Powdery Mildew Resistance Genes in Wheat: Identification and Genetic Analysis

University of Nebraska - LincolnDigitalCommons@University of Nebraska - Lincoln
Faculty Publications: Department of Entomology Entomology, Department of
6-2015
Exceptionally High Levels of Genetic Diversity inWheat Curl Mite (Acari: Eriophyidae) Populationsfrom TurkeyW. SzydłoAdam Mickiewicz University, Poznań, Poland, [email protected]
Gary L. HeinUniversity of Nebraska-Lincoln, [email protected]
E. DenizhanYüzüncü Yıl University, Turkey
A. SkorackaAdam Mickiewicz University, Poznań, Poland
Follow this and additional works at: http://digitalcommons.unl.edu/entomologyfacpub
Part of the Entomology Commons
This Article is brought to you for free and open access by the Entomology, Department of at DigitalCommons@University of Nebraska - Lincoln. It hasbeen accepted for inclusion in Faculty Publications: Department of Entomology by an authorized administrator of DigitalCommons@University ofNebraska - Lincoln.
Szydło, W.; Hein, Gary L.; Denizhan, E.; and Skoracka, A., "Exceptionally High Levels of Genetic Diversity in Wheat Curl Mite (Acari:Eriophyidae) Populations from Turkey" (2015). Faculty Publications: Department of Entomology. 429.http://digitalcommons.unl.edu/entomologyfacpub/429

The wheat curl mite, Aceria tosichella (Keifer), is an inva-sive pest of increasing importance on cereal crops, primar-ily as a vector of plant viruses such as wheat streak mosaic virus (WSMV), wheat mosaic virus (WMoV; formerly a High Plains virus), and Triticum mosaic virus (TriMV; Slykhuis 1995; Seifers et al. 1997, 2009; Navia et al. 2013). The wheat curl mite has been observed on >80 grass species in North and South America, Africa, Australia, and Eurasia (Navia et al. 2013). However, recent research on the wheat curl mite revealed extensive genetic diversity and led to the conclu-sion that in fact wheat curl mite represents a cryptic species complex (Carew et al. 2009; Hein et al. 2012; Skoracka et al. 2012, 2013, 2014a; Miller et al. 2013). The existence of cryp-tic diversity (viz. morphologically similar but genetically dif-ferent entities) within an economically important crop pest species, such as wheat curl mite, may have enormous implica-tions for the control of the pest (Bickford et al. 2007). Species within a complex may differ in biological and ecological traits, for example, host range, effect on plant physiology, pesticide resistance, ability to transmit pathogens, and potential inva-siveness (e.g., Perring 2001, Drés and Mallet 2002, Bickford et al. 2007, Guo et al. 2013, Frewin et al. 2014).
Indeed, experimental assays examining wheat curl mite host acceptance confirmed the ecological distinctiveness of several genotypes (some of them are presumed to be differ-ent species), but since this study has been limited to Poland, it is expected that the wheat curl mite complex is much more species rich (Skoracka et al. 2013). This study further showed that the host range strategy is uneven within the wheat curl mite complex, with some lineages exhibiting narrow or ex-clusive host ranges (e.g., MT-4 and MT-5 infesting smooth brome and tall oat-grass, respectively), whereas others are more generalist in nature, tending to infest a broader range of host plants. Nevertheless, a general host-related coevo-lutionary pattern has been suggested to exist among wheat curl mite genetic lineages (Miller et al. 2013). Three genetic wheat curl mite lineages have been identified as the most im-portant economically, viz. MT-1, MT-7, and MT-8, because of their ability to infest bread wheat and common barley, as well as their worldwide occurrence, including North (MT-1, MT-8 only) and South America (MT-1 only), Australia, and Europe (Skoracka et al. 2014b). Long-distance dispersal abil-ities of eriophyoid mites are still to be investigated but may include aerial means of dispersal as well as dispersal on a
Published in Journal of Economic Entomology 108:4 (2015), pp. 2030–2039; doi: 10.1093/jee/tov180 Copyright © 2015 W. Szydło, G. Hein, E. Denizhan, and A. Skoracka. Published by Oxford University Press on behalf of Entomological Society of America. Used by permission.Submitted March 29, 2015; accepted June 1, 2015; published online June 30, 2015.
Exceptionally High Levels of Genetic Diversity in Wheat Curl Mite (Acari: Eriophyidae) Populations from Turkey
W. Szydło,1 G. Hein,2 E. Denizhan,3 and A. Skoracka1
1 Department of Animal Taxonomy and Ecology, Faculty of Biology, Adam Mickiewicz University, Umultowska 89, 61-614 Poznań, Poland
2 Department of Entomology, University of Nebraska–Lincoln, P.O. Box 830933, Lincoln, NE 68583-0933, USA3 Department of Plant Protection, Agricultural Faculty, Yüzüncü Yıl University, 65080 Van, Turkey
Corresponding author — W. Szydło, email [email protected].
Abstract Recent research on the wheat curl mite species complex has revealed extensive genetic diversity that has distinguished sev-eral genetic lineages infesting bread wheat (Triticum aestivum L.) and other cereals worldwide. Turkey is the historical region of wheat and barley (Hordeum vulgare L.) domestication and diversification. The close relationship between these grasses and the wheat curl mite provoked the question of the genetic diversity of the wheat curl mite in this region. The scope of the study was to investigate genetic differentiation within the wheat curl mite species complex on grasses in Turkey. Twenty-one wheat curl mite populations from 16 grass species from nine genera (Agropyron sp., Aegilops sp., Bromus sp., Elymus sp., Eremopy-rum sp., Hordeum sp., Poa sp., Secale sp., and Triticum sp.) were sampled in eastern and southeastern Turkey for genetic anal-yses. Two molecular markers were amplified: the cytochrome oxidase subunit I coding region of mtDNA (COI) and the D2 re-gion of 28S rDNA. Phylogenetic analyses revealed high genetic variation of the wheat curl mite in Turkey, primarily on Bromus and Hordeum spp., and exceptionally high diversity of populations associated with bread wheat. Three wheat-infesting wheat curl mite lineages known to occur on other continents of the world, including North and South America, Australia and Eu-rope, were found in Turkey, and at least two new genetic lineages were discovered. These regions of Turkey exhibit rich wheat curl mite diversity on native grass species. The possible implications for further studies on the wheat curl mite are discussed.
Keywords: Aceria tosichella, genetics, variation, cryptic, complex
2030
digitalcommons.unl.edudigitalcommons.unl.edu

Hi g H ge n e t i c Di v e r s i t y i n WH e a t cu r l Mi t e Po P u l a t i o n s f r o M tu r k e y 2031
host, because their ability to disperse by walking is limited (Lindquist and Oldfield 1996, Sabelis and Bruin 1996, Mi-chalska et al. 2010). The global spread of these wheat curl mite lineages was most likely associated with cultivated Alli-oidae plants (i.e., onion and garlic; Skoracka et al. 2014). Er-iophyoid mites are haplodiploid and reproduce mostly by ar-rhenotokous parthenogenesis (Michalska et al. 2010, Miller et al. 2012), so just one founder female is able to start a new population.
Studies conducted on genetic variation of wheat curl mite populations to date have not addressed the genetic varia-tion of wheat curl mite populations in regions where the cul-tivation of wheat and barley originated. The Turkish region, examined in this study, falls within or borders the histori-cal region of the Fertile Crescent where the domestication of crops began (Lev-Yadun et al. 2000). This area is where einkorn wheat (Triticum monococcum L.), Triticum ararati-cum Jakubz., and common barley were domesticated (Heun et al. 1997, Smith 1998, Badr et al. 2000, Doebley et al. 2006). Furthermore, Turkey is currently a center of genetic diver-sity of wheat (Dvorak et al. 2011) and is the site of the natu-ral origin of its progenitors. In addition to bread wheat and durum wheat (Triticum durum Desf.) cultivation, Turkey is still home to ancient agricultural species, including wild em-mer (Triticum dicoccum L.) and einkorn wheat (Bardsley and Thomas 2005, Karagöz 2014).
Recently, the wheat curl mite has been recorded in Turkey from several host species, including bread wheat (Denizhan et al. 2013, Kiedrowicz et al. 2014), and all three cereal-as-sociated lineages (viz. MT-1, MT-7, and MT-8) have been de-tected (Skoracka et al. 2014b). Taking into consideration the worldwide occurrence of wheat- and barley-infesting wheat curl mite lineages, Turkey and adjacent areas have been sug-gested to be the region of origin for the wheat curl mite spe-cies complex. A study on wheat curl mite diversity in this re-gion would elucidate the relationships between host plants and wheat curl mite lineages and enable the testing of hy-potheses on the possible patterns of the mite’s early specia-tion and spread (Denizhan et al. 2013, Skoracka et al. 2014b).
The aim of this study was to explore the genetic diversity of different wheat curl mite host populations in Turkey. Spe-cifically, we propose to: 1) assess the level of variation among the Turkish wheat curl mite populations inhabiting grasses for two genetic markers that are commonly used for eriophy-oid mites, the cytochrome oxidase subunit I mitochondrial DNA coding region and the D2 region of 28S ribosomal DNA, and 2) verify the existence of wheat curl mite genetic lineages in Turkey that are present in other parts of the world.
Materials and Methods
Sampling. Sampling was conducted in eastern and south-eastern Turkey from 2009 to 2011 as a part of a faunistic sur-vey. The shoots of 16 grass (Poaceae) species from 10 genera were sampled, including Agropyron Gaertn., Aegilops L., Bro-mus L., Dactylis L., Elymus L., Eremopyrum (Ledeb.) Jaub. & Spach., Hordeum L., Poa L., Secale L., and Triticum L. The
plants were examined under a stereomicroscope for the pres-ence of eriophyoid mites. Mite specimens were collected and mounted on slides using a standard protocol (de Lillo et al. 2010) and then identified (Keifer 1969, Amrine et al. 2003). Specimens of Aceria tosichella Keifer as well as Abacarus hys-trix (Nalepa), and Abacarus longilobus Skoracka were col-lected and preserved for further genetic analyses. A single sample for genetic analysis consisted of the mite specimens of one species collected from one plant shoot placed directly in extraction buffer (ATL buffer; Qiagen, Hilden, Germany). The samples were transferred to the Molecular Biology Tech-niques Laboratory at Adam Mickiewicz University (Poland) and stored at –20°C. The number of specimens per sample, hosts, dates and localities are shown in Table 1.
DNA Extraction, Amplification, and Sequencing. The number of mite specimens per grass sample used for genetic analysis varied from 5 to 25, and the samples only consisted of specimens originating from the same population. A non-destructive method of DNA extraction was applied, as de-scribed by Dabert et al. (2008), using the DNeasy Blood & Tissue Kit (Qiagen, Hilden, Germany). Post-digestion, spec-imen cuticles were transferred to 70% ethanol for further preparation and identification to eliminate the possibility of errors. A partial sequence of the cytochrome oxidase sub-unit I (COI) of mitochondrial DNA (mtDNA) was amplified via PCR using the degenerate primers bcdF01 and bcdR04 (Skoracka and Dabert 2010). A partial sequence of the ri-bosomal DNA (rDNA) ranging from ITS1 to the D2/D3 re-gion of 28S rDNA was amplified with the primers D1D2fw2 (Skoracka and Dabert 2010) and 28Sr0990 (Mironov et al. 2012). PCR was conducted in a 10 ml reaction volume con-taining 5 ml of Type-it Multiplex PCR Master Mix (Qiagen, Hilden, Germany), 50pM each primer and 4 ml of DNA tem-plate. The thermocycling profile consisted of one cycle of 5min at 95°C, followed by 35 cycles of 30 s denaturation at 95°C, 30 s annealing at 50°C, and a 1 min extension for both the bcdF01/ bcdR04 and the D1D2fw2/28Sr0990 primer sets at 72°C, with a final step of 15 min at 72°C. The reaction prod-ucts were diluted twofold and checked through electrophore-sis on a 1% agarose gel with ethidium bromide. The COI am-plification reaction products were directly sequenced in both directions with the same primers (bcdF01 and bcdR04). The amplified rDNA samples were enzymatically cleaned with a mixture of exonuclease I (Exo I) and Fast AP thermosen-sitive alkaline phosphatase (Thermo Fisher Scientific Inc., Waltham, MA) prior to sequencing. The samples were se-quenced with the forward primer to obtain the D2 region of the 28S rDNA sequence: D1D2fw2 (Sonnenberg et al. 2007), Er28SF05 (5′-ACGAATCGGAGCCACGAAG- 3′) and reverse Er28SR05 (5′-TCGTCTAACTGGTTGCAGTG-3′). All sequenc-ing was performed with BigDye Terminator v. 3.1 on an ABI Prism 3130XL or 3730 Analyzer (Applied Biosystems, Foster City, CA). The forward and reverse sequences were aligned and assembled with BioEdit v. 7 software (Hall 1999). Trace files were aligned and edited with MEGA5 (Tamura et al. 2011). All sequences have been deposited in NCBI GenBank under the accession numbers indicated in Table 1.

2032 Sz y d ł o e t a l . i n Jo u r n a l o f Ec o n o m i c En t o m o l o g y 108 (2015) Ta
ble
1. S
ampl
es u
sed
in th
e st
udy:
eri
ophy
oid
mite
spe
cies
, hos
t pla
nt s
peci
es, c
olle
ctio
n da
tes,
col
lect
ion
loca
lity
coor
dina
tes,
num
ber
of s
peci
men
s co
llect
ed in
a s
ingl
e tu
be w
ith
buffe
r, sa
mpl
e co
des,
and
Gen
Bank
acc
essi
on n
umbe
rs
Spec
ies
H
ost
Dat
e
Lat-L
ong
N
o. o
f spe
cim
ens
Sa
mpl
e
COI a
cces
sion
D
2 ac
cess
ion
per s
ampl
e
code
num
ber
nu
mbe
r
Abac
arus
hys
trix
E
lym
us h
ispi
dus
(Opi
z) M
elde
ris
subs
p. B
arbu
latu
s
30-A
ug-2
009
38
.450
001,
43.
4000
02
5; 1
0 (2
sam
ples
) ah
ys.1
K
C412
843
K
M28
0940
Tr
iticu
m a
estiv
um L
. 3-
July
-201
0
39.5
6015
, 44.
0993
69
1
ahys
.2
KC4
1284
4
–
Abac
arus
long
ilobu
s B
rom
us e
rect
us H
uds.
3-
July
-200
9
37.3
1666
9, 4
3.46
6671
8
al
on.1
K
C412
846
K
M28
0944
D
acty
lis g
lom
erat
a L.
24
-Jul
y-20
09
39.1
9208
9, 4
3.88
2778
20
al
on.2
K
C412
845
–
Acer
ia to
sich
ella
Ae
gilo
ps c
ylin
dric
a H
ost
4-Ju
ne-2
010
38
.508
209,
43.
3754
39
10
wcm
.AEG
.1
KC4
1285
8
KM
2809
47
Agro
pyro
n cr
ista
tum
(L.)
Gae
rtn.
27
-Jun
e-20
09
38.3
256,
43.
4076
19
5; 1
5; 1
5; 1
0
wcm
.AG
R.1
K
C412
847
K
M28
0942
S
ubsp
. In
conu
m (N
ab) M
edle
r
(4
sam
ples
)
Arrh
enat
heru
m e
latiu
s (L
.) B
eauv
. ex
Pres
l & P
resl
15
-Sep
t-200
9
52.4
664,
16.
9342
5
w
cm.A
RR.1
JQ
2489
24a
JF
9201
09b
B
rom
us a
rven
sis
L.
3-Ju
ly-2
009
38
.355
499,
43.
6568
98
3; 1
0; 7
(3 s
ampl
es)
wcm
.BRO
.1
KC4
1284
8
KM
2809
43
Bro
mus
tom
ente
llus
Bois
s.
13-J
uly-
2009
38
.316
631,
43.
8007
58
10
wcm
.BRO
.2
KC4
1285
0
KM
2809
45
Bro
mus
cap
pado
cius
Boi
ss. S
ubsp
. Cap
pado
cius
30
-Jul
y-20
09
37.3
1666
9, 4
3.46
6671
5;
5 (2
sam
ples
) w
cm.B
RO.3
K
C412
849
K
M28
0946
B
rom
us in
erm
is L
eyss
. 30
-Oct
-200
9
52.4
675,
16.
9086
4
w
cm.B
RO.4
JQ
2489
22a
JQ
9188
85a
E
lym
us h
ispi
dus
(Opi
z) M
elde
ris
subs
p. B
arbu
latu
s
10-A
ug-2
009
39
.560
15, 4
4.09
9369
12
w
cm.E
LY.1
K
C412
851
K
M28
0941
E
lym
us r
epen
s (L
.) G
ould
16
-Jul
y-20
13
51.5
4712
3, 1
5.01
0541
1
w
cm.E
LY.2
K
P973
941c
–
E
rem
opyr
um o
rien
tale
(L.)
Jaub
. & S
pach
25
-Jun
e-20
11
40.5
1208
6, 4
3.57
2825
25
; 25
(2 s
ampl
es)
wcm
.ERE
.1
KM
2809
39
KM
2809
56
Hor
deum
gig
ante
um (V
ahl)
Rasp
ail
23-J
une-
2010
38
.333
302,
43.
4333
10
w
cm.H
OR.
1
KC4
1285
3
KM
2809
49
Hor
deum
gen
icul
atum
All.
3-
July
-201
0
38.3
3330
2, 4
3.43
33
10
wcm
.HO
R.2
K
C412
854
K
M28
0950
H
orde
um s
p.
26-J
uly-
2010
38
.176
899,
43.
9495
01
10
wcm
.HO
R.3
K
C412
855
–
H
orde
um v
iola
ceum
Boi
ss. &
Hoh
en.
16-J
uly-
2010
38
.387
798,
42.
7921
98
10
wcm
.HO
R.4
K
C412
852
K
M28
0957
H
orde
um s
p.
9-Ju
ly-2
010
39
.560
15, 4
4.09
9369
10
w
cm.H
OR.
5
KC4
1285
6
KM
2809
59
Hor
deum
mur
inum
L.
1-Au
g-20
10
38.0
0804
1, 4
3.06
1039
10
w
cm.H
OR.
6
KC4
1285
7
–
Hor
deum
mur
inum
L.
3-D
ec-2
010
52
.462
8, 1
6.92
47
8
wcm
.HO
R.7
JQ
2489
26a
JQ
9188
88a
H
orde
um v
ulga
re L
. 28
-Jun
e-20
13
52.4
9395
3, 1
5.38
0120
1
w
cm.H
OR.
8
KP9
7394
2c
–
Poa
bulb
osa
L.
26-J
uly-
2010
38
.176
899,
43.
9495
01
10
wcm
.PO
A.1
K
C412
860
K
M28
0958
Se
cale
cili
atog
lum
e (B
oiss
.) G
ross
h.
16-J
une-
2010
39
.028
099,
43.
3617
9
10
wcm
.SEC
.1
KC4
1285
9
KM
2809
48
Seca
le c
erea
le L
. 13
-Jul
y-20
13
51.9
3711
4, 1
6.02
4099
5
w
cm.S
EC.2
K
P973
943c
–
Tr
iticu
m a
estiv
um L
. 13
-Jun
e-20
11
39.0
2809
9, 4
3.36
179
28
w
cm.T
RI.1
K
C412
861d
K
M28
0951
Tr
iticu
m a
estiv
um L
. 18
-Jun
e-20
11
39.0
2809
9, 4
3.36
179
25
w
cm.T
RI.2
K
C412
862
K
M28
0952
Tr
iticu
m a
estiv
um L
. 13
-Jun
e-20
11
38.4
2122
3, 4
2.14
0324
25
w
cm.T
RI.3
K
C412
864
K
M28
0953
Tr
iticu
m a
estiv
um L
. 19
-Jun
e-20
11
39.9
4625
1, 4
3.96
8361
25
w
cm.T
RI.4
K
C412
863
–
Tr
iticu
m a
estiv
um L
. 26
-Oct
-201
1
40.5
3445
8, 4
3.10
9268
25
w
cm.T
RI.5
K
C412
865
K
M28
0954
Tr
iticu
m a
estiv
um L
. 20
-Jun
e-20
11
39.5
6015
, 44.
0993
69
25
wcm
.TRI
.6
KC4
1286
6
KM
2809
55
Triti
cum
aes
tivum
L.
2-Ju
ly-2
009
52.0
4333
3, 1
6.76
7222
15
w
cm.T
RI.7
JF
9200
77b
JF
9200
97b
Tr
iticu
m a
estiv
um L
. 19
96
41.2
3529
6, –
103.
0025
05
5
wcm
.TRI
.8
JX10
2055
e
–
Sequ
ence
s w
ith th
e su
pers
crip
ts a
, b, c
, d a
nd e
wer
e do
wnl
oade
d fr
om G
enBa
nk:
a. S
kora
cka
et a
l. 20
13b.
Sko
rack
a et
al.
2012
c. W
.S. a
nd A
.S.,
unpu
blis
hed
data
d. S
kora
cka
et a
l. 20
14b
e. H
ein
et a
l. 20
12Al
l oth
er s
eque
nces
wer
e ob
tain
ed d
urin
g th
e co
urse
of t
his
stud
y.

Hi g H ge n e t i c Di v e r s i t y i n WH e a t cu r l Mi t e Po P u l a t i o n s f r o M tu r k e y 2033
Alignment and Sequence Analyses. Twenty-one COI sequences and 18 rDNA sequences were obtained from var-ious host populations of Aceria tosichella (wheat curl mite) from Turkey (Table 1). There were no differences among the COI sequences generated from mites originating from the same population, and single representatives of each wheat curl mite population were therefore used in the analyses. Four COI sequences and two rDNA sequences were obtained from Abacarus hystrix and A. longilobus from Turkey. Ad-ditional COI and D2 sequences from previously described wheat curl mite lineages, viz., MT-1, MT-2, MT-4, MT-5, MT-7, and MT-8 (Hein et al. 2012; Skoracka et al. 2012, 2013, 2014b), were downloaded from the NCBI GenBank database (Table 1).
A total of 33 COI sequences, aligned and edited with MEGA5 software to a length of 603 bp, were analyzed. A to-tal of 24 rDNA sequences were aligned with MEGA5 soft-ware, and the alignment was trimmed to a length of 466 bp to cover the partial sequence of the D2 region of 28S rDNA. Two A. hystrix and A. longilobus sequences for each (mtDNA and rDNA) dataset served as outgroup taxa. All necessary alignment format conversions were performed with the web application Alignment Transformation Environment, ALTER (Glez-Peña et al. 2010).
For each dataset (COI and D2), neighbor-joining (NJ) trees with 1,000 bootstrap replicates were constructed with MEGA5 on the basis of the uncorrected distance (p-dis-tance). The pair-wise p-distances and Kimura-2-parameter (K2P) distances between sequences and the overall mean distance of the sequence datasets were calculated with MEGA5 software, as were the between- and within-group p-distances (groups chosen a posteriori on the basis of the p-distance matrices). The uncorrected distance was chosen as a simple and reliable measure of sequence divergence for this study, whereas the K2P distance matrix was cal-culated as a comparable reference to previous research re-sults (Skoracka et al. 2012, 2013). For maximum likelihood (ML) analysis using PhyML3.1 (Guindon et al. 2010), best-fit nucleotide substitution models for both alignments were chosen with jModeltest v. 2.1.3 (Darriba et al. 2012, Guin-don and Gascuel 2003) according to the Akaiake informa-tion criterion (AIC), which were TPM2uf+I+G (p-inv = 0.55, G = 1.11) for the COI alignment and TrN+G (G = 0.3) for the D2 alignment. For the purpose of Bayesian inference (BI) analysis, the COI dataset was subdivided into three parti-tions based on the codon position (1st, 2nd, and 3rd), and the best-fit model scheme was chosen with Partition Finder v. 1.1.1 (Lanfear et al. 2012). The best-fit models under the Bayesian information criterion (BIC) for implementation in MrBayes 3.2.2 were SYM+G for the 1st codon position, F81 for the 2nd codon position and HKY+G for the 3rd co-don position (gamma shape parameters set to be estimated by MrBayes 3.2.2). The best-fit model for BI analysis of the D2 alignment was K80+G (G = 0.32) according to the BIC, chosen with jModeltest v. 2.1.3.
ML analysis was performed separately for the datasets us-ing PhML3.1 software. Bayesian inference analysis was per-
formed for each dataset separately using MrBayes 3.2 (Ron-quist et al. 2012), with two independent runs consisting of four chains each (3 heated and 1 cold), and data partition-ing was applied. The analysis was performed until the aver-age split deviation was below 0.01. The trace files were an-alyzed with Tracer v. 1.5 for effective sample size (Rambaut and Drummond 2009), and the 25% of trees obtained in the beginning of the analysis were discarded. Additionally, both datasets were concatenated into two-partitioned datasets of 24 sequences. Each concatenated sequence consisted of both the COI and D2 sequence from the same sample. The incon-gruence length difference test (ILD test; Farris et al. 1994, 1995) with 500 partition-homogeneity test replicates was per-formed with PAUP* 4.0b10 (Swofford 2003) to test the con-gruence of the data. Combined analysis for the concatenated alignment was performed with MrBayes 3.2 to obtain the consensus tree, with the nucleotide substitution models im-plemented as for the separate COI and D2 dataset Bayesian inference analyses.
Results
The mtDNA COI sequence dataset exhibited 240 variable sites, and the amino acid translation presented 23 variable sites. There was no evidence of indels or premature stop co-dons. The average nucleotide composition of the COI dataset was T = 44.4, C = 18.1, A = 21.9, and G = 15.7. The average transition/transversion ratio (R = transitional pair/transver-sional pair frequencies) was R = 26 (codon positions 1st, 2nd, and 3rd: R = 13.40, R = 0.25, and R = 2, respectively). The overall mean p-distance of the COI sequence dataset includ-ing the out-group sequences was 15.5% (SE = 0.9%), whereas the overall mean p-distance among the wheat curl mite se-quences was 13.9% (SE = 0.9%). P-distance values for the wheat curl mite COI sequences ranged from 0.17 to 23.8%. The overall mean p-distance of the D2 sequence dataset in-cluding the out-group sequences was 5.11% (SE = 0.5%), and the overall mean p-distance was 4.03% (SE = 0.4%) for wheat curl mite sequences. P-distance values for the wheat curl mite D2 sequences ranged from 0 to 14.25%. The p-distances be-tween the out-group and in-group were 21.0% (SE = 1.3%) for COI and 11.96% (SE = 1.4%) for D2. The matrices of pair-wise p-distances and K2P distances for the COI and D2 align-ments are given in the Supplementary materials (Suppl. Ta-bles 1–4).
The pair-wise p-distance matrices were examined for se-quence pairs showing values of p-dist < 4% and p-dist < 0.4% for the COI and D2 sequence distance matrix, respectively. The values have been chosen on the basis of previous compre-hensive analyses of the same DNA regions (e.g., Hebert et al. 2003, Sonnenberg et al. 2007) demonstrating the ranges of inter- and intraspecific distances between sequences of spe-cies pairs of various animals. Based on these matrices, se-quences 18 from the COI alignment fell into seven groups, designated A, B, C, D, E, F, and G (Figure 1), exhibiting mean within-group p-distances ranging from 0.17% (SE = 0.15%;

2034 Sz y d ł o e t a l . i n Jo u r n a l o f Ec o n o m i c En t o m o l o g y 108 (2015)
group D) to 3.49% (SE = 0.7%; group B; Table 2). While 13 D2 sequences fell into four groups, designated a, b, c, and d (Figure 2), presenting mean within-group p-distances rang-ing from 0% (group a) to 0.22% (SE = 0.2%; group d; Table 2). Two of the groups were recovered for both datasets: group A corresponded to group a, and the F group corresponded to the b group.
Distance-based NJ analyses resulted in trees with a num-ber of highly supported ancestral clades, while relationships among terminal nodes were poorly resolved (Figures 1 and 2). The COI tree topology confirmed the exceptionally high vari-ation observed in the divergence values. The distance-based COI sequence groups shown in Figure 1 match the branch-ing of the tree. There was no clear host association, as mite haplotypes from different host genera were paraphyletic. The sequences originating from mites infesting Bromus spp. and
Hordeum spp. were scattered on tree tips without any trend, except for the following cases: 1) wcm.HOR.1 and wcm.HOR.5 clustered with wcm.AGR.1 for both COI (group F) and D2 (group b); 2) wcm.HOR.6 and wcm.HOR.7 (COI group D); and 3) wcm.BRO.2 and wcm.BRO.3 (D2 group d). The wcm.BRO.2 and wcm.BRO.3 sequences in the D2 region of 28S were sim-ilar (0.22%, SE = 0.2%; Figure 2); however, their COI se-quences were as much as 6.67% distant (SE = 1%; Figure 1). The mtDNA COI sequences of the wheat-associated popula-tions wcm.TRI.4 and wcm.TRI.6 clustered together (group B). The mtDNA COI sequences of the others wheat-associated populations fell into three groups (A, C, and E) but clustered with the sequence of wcm.HOR.8, wcm.SEC.2, and ELY.1, respectively (Figure 1).
The results of the ML analyses were concordant with the BI trees, and the latter results are shown with ML support values added (derived with the approximate likelihood ratio test; aLRT [Anisimova and Gascuel 2006]). The topology of the COI BI tree (Figure 3) was consistent with that obtained using the NJ method and supported the existence of groups A, D, E, F, and G.
The D2 BI tree (Figure 4) showed polytomy of four clusters and two stand-alone sequences (wcm.BRO.1 and wcm.BRO.4), with the sequences of the Bromus-, Hordeum- and wheat-as-sociated wheat curl mite populations scattered among them without any clear host-related clustering. Groups a, b, and d were reflected in the BI tree, and the c group was found within a bigger polytomic clade that included wcm.SEC.1 and wcm.HOR.2.
Figure 1. Neighbor-joining tree based on the p-distances of the mtDNA COI sequences dataset built with MEGA5. Values above the branches represent bootstrap-measured support (1,000 replicates) equal to or higher than 60. Groups indicated on the right of the tree tips were as-signed a posteriori to the tree analysis based on pair-wise p-distance values lower than 4%. The sample codes are explained in Table 1. The colors of the code were assigned by the population host genus. * = sequence downloaded from GenBank from a population of Turkish origin; ** = sequence downloaded from GenBank from a population of non-Turkish origin (USA and Poland).
Table 2. Within group mean p-distances with standard error values (bootstrap = 1,000) given in percentages of the groups of COI mtDNA sequences (A–G) and the groups of D2 region of 28S rDNA sequences (a–d) used in the study
Group COI D2 A B C D E F G a b c d
Mean (%) 2.05 3.49 0.66 0.17 0.83 0.89 2.49 0 0.15 0.29 0.22 p-distanceSE (%) 0.41 0.72 0.26 0.15 0.36 0.30 0.59 0 0.14 0.14 0.22
Group names are explained in the text.
Hi g H ge n e t i c Di v e r s i t y i n WH e a t cu r l Mi t e Po P u l a t i o n s f r o M tu r k e y 2035
Figure 2. Neighbor-joining tree based on the p-distances of the D2 sequences of the 28S rDNA dataset built with MEGA5. Values above the branches represent bootstrap-measured support (1,000 replicates) equal to or higher than 60. Groups indicated on the right of the tree tips were assigned a posteriori to the tree analysis based on pair-wise p-distance values lower than 0.4%. The sample codes are explained in Ta-ble 1. The colors of the code were assigned by the population host genus. * = sequence downloaded from GenBank from a population of Turk-ish origin; ** = sequence downloaded from GenBank from a population of non-Turkish origin (USA and Poland).
Figure 3. Bayesian tree of mtDNA COI sequences inferred with MrBayes 3.2. Values above the branches represent support values (aLRT from ML analysis and posterior probabilities of BI analysis) equal to or higher than 60 (0.6). The sample codes are explained in Table 1. The colors of the code were assigned by the population host genus. * = sequence downloaded from GenBank from a population of Turkish origin; ** = sequence downloaded from GenBank from a population of non-Turkish origin (USA and Poland).

2036 Sz y d ł o e t a l . i n Jo u r n a l o f Ec o n o m i c En t o m o l o g y 108 (2015)
The COI and D2 sequence datasets were incongruent, as the ILD test P-value was less than P = 0.05 (P < 0.05). The tree inferred from the combined analysis represented an un-reliable topology (tree not shown). But, it showed some sim-ilarities to the NJ and BI trees, with groups A and a, F and b, and group D being recovered in the topology.
Discussion
The results of this study, focusing on wheat curl mite popu-lations from regions of Turkey, not only supported previous findings about genetic variation within wheat curl mite sug-gesting the existence of cryptic diversity, but above all uncov-ered much more diversity within the wheat curl mite species complex. This diversity matched the diversity observed on different continents (Skoracka et al. 2012, 2014b) and even exceeded that of the host species and mite pattern complex-ity. In addition to the lineages previously detected worldwide (Skoracka et al. 2013, 2014b), viz., MT-1 (in this study, in groups A and a), MT-2 (in group G), MT-7 (in groups D and c), and MT-8 (in groups C and c), we found several new ge-netic lineages in Turkey (Figures 1 and 2).
Among six Turkish wheat curl mite populations from Hor-
deum spp., only one (viz. wcm.HOR.6) was closely related to the globally present MT-7 lineage that attacks barley, Hor-deum vulgare L., and bread wheat in Australia, and wall barley, Hordeum murinum L., in Poland (Skoracka et al. 2014b). The other five haplotypes were highly divergent from each other and apparently formed several putative lineages, with much uncertainty due to the incongruence of mitochon-drial DNA-based and nuclear DNA-based phylogenies. Sim-ilarly, three haplotypes from Bromus spp. formed two new lines that were divergent from the previously detected in Poland (Skoracka et al. 2013; wcm.BRO.4, see Table 1 and Figures 1–4).
Most importantly, this study revealed great variation in the wheat curl mite populations from the agriculturally significant cereal grain bread wheat, with COI haplotypes falling into four distinct groups. Three wheat curl mite lin-eages were previously known to occur on bread wheat world-wide (Skoracka et al. 2014b). This study revealed three new wheat-associated haplotypes (viz., wcm.TRI.3, wcm.TRI.4, and wcm.TRI.6).
In addition, wheat curl mite populations from six other host plant genera (Aegilops, Agropyron, Elymus, Eremopy-rum, Poa, and Secale) add to the wheat curl mite diversity
Figure 4. Bayesian tree of the D2 region of 28S rDNA sequences inferred with MrBayes 3.2. Values above the branches represent support values (aLRT from ML analysis and posterior probabilities of BI analysis) equal to or higher than 60 (0.6). The sample codes are explained in Table 1. The colors of the code were assigned by the population host genus. ** = sequence downloaded from GenBank from a population of non-Turkish origin (USA and Poland).

Hi g H ge n e t i c Di v e r s i t y i n WH e a t cu r l Mi t e Po P u l a t i o n s f r o M tu r k e y 2037
observed in Turkey. This high genetic variability exceeds the variation found in other studied areas, and provides ev-idence that the sampled area lies within the original distri-bution of the wheat curl mite complex, as previously sug-gested (Skoracka et al. 2014b). This has been demonstrated or suggested for other phytophagous pests and for invasive species (e.g., Karsten et al. 2013, Kirk et al. 2013, Zheng et al. 2013, Shi et al. 2014, Mastrangelo et al. 2014). Higher ge-netic variation in the native area of a species than in an in-vaded area might be a result of the bottlenecks and genetic drift experienced by invasive populations (e.g., Tsutsui et al. 2000, Sakai et al. 2001, de Barro and Ahmed 2011). The pattern of lower genetic diversity among wheat and barley wheat curl mite haplotypes worldwide compared to genetic divergence among wheat and barley wheat curl mite hap-lotypes in Turkey suggests that only some genotypes have successfully moved from Turkey to other areas around the world. This may be due to the differences between vari-ous wheat curl mite genotypes in their dispersal, adaptive, competitive, or survival ability. For example, the lineage MT-1 has been shown to survive on onion and garlic bulbs (Skoracka et al. 2014a), which might allow international movement of the mite. This issue should be experimentally tested in the future to show what biological characteristics of different wheat curl mite genotypes may influence their colonization and invasive potential.
Turkey is also a part of the native distribution of wheat curl mite hosts, including the Triticae tribe (Aegilops spp., Elymus spp., Eremopyrum spp., Hordeum spp., Secale spp., and Triticum spp.), many species of Bromus, and Poa bul-bosa. This supports the existence of well-established mite and host plant relationships in this region. Some of these wheat curl mite host plants have spread worldwide as highly impor-tant crops, such as bread wheat and barley, or have invaded the North American continent, such as the close bread wheat relative Aegilops cylindrica (Donald and Ogg 1991) and Poa bulbosa (Novak and Welfley 1997). The founder populations responsible for the worldwide invasion of the wheat curl mite might have followed the spread of their hosts (and other hosts not mentioned here). Rabenstein et al. (2002) noted that the wheat streak mosaic virus (WSMV) and the wheat curl mite associated with hard red winter wheat might have been in-troduced from the Black Sea region, which was supported by the similarity of North American and Turkish WSMV isolates and the alleged late diversification of US strains of WSMV. These and our findings highlight the importance of under-standing wheat curl mite species complex diversity in the area of its plausible origin for wheat curl mite and WSMV pathosystem management.
The host and mite coevolutionary pattern observed in this study was different from that reported by Miller et al. (2013), who revealed consistent host associations, with a single hap-lotype often dominating on a host plant species. Although it must be stated that Miller et al. (2013) used different genetic markers than other wheat curl mite studies applied (e.g., Hein et al. 2012; Skoracka et al. 2012, 2013, 2014b).
The observed incongruence of mtDNA and genomic DNA
phylogenies may be explained by possible introgressive hy-bridizations of lineages or ancestral polymorphisms (Nowell et al. 2011, Stankowski and Johnson 2014, Dias and Carareto 2012). Hybridization may contribute to speciation through the formation of new hybrid taxa, whereas introgression of a few loci may promote adaptive divergence and so facilitate speciation (Abbott et al. 2013). Whether any of the above processes play a role in speciation of the wheat curl mite complex remains unclear, and further genetic investigations (e.g., including the whole genome sequencing) are required to explain this phenomenon. The incongruence between COI and D2 trees may question the reliability of these markers as barcodes for quick identification of wheat curl mite lin-eages. However, these findings confirmed earlier hypoth-eses on the very recent speciation within wheat curl mite complex and possible hybridization between lineages (e.g., Skoracka et al. 2012). Taking into account a higher rate of mutation in mtDNA compared to nuclear DNA and the poten-tial earlier divergence in mtDNA than in nuclear genes after a recent speciation event (Piganeau and Eyre-Walker 2009), COI sequences make a better barcode than D2 for quaran-tine purposes.
Our study has expanded the known levels of diversity in wheat curl mite, and has led to the discovery of high diver-sity of the wheat curl mite species complex in Turkey. These results support the hypothesis regarding Middle East ori-gin of the wheat curl mite. At least two lineages of wheat curl mite associated with wheat were found for the first time in Turkey, and the existence of additional lineages is pos-sible. Turkey and the adjacent areas abound in wheat curl mite lineages associated with native grass species. The re-gion may also support additional potentially invasive geno-types. Understanding the genetic and ecological variation of an invasive plant pest and virus vector is crucial for efficient management. For example, the phytophagous cryptic spe-cies complex of Bemisia tabaci Gannadius (Insecta: Hemip-tera: Aleyrodidae) comprises several important lineages with diverse invasive abilities (de Barro and Ahmed 2011, Ester-huizen et al. 2013, Frewin et al. 2014). Furthermore, knowl-edge of wheat curl mite diversity on cultivated grasses and their noncultivated relatives or on host plant species associ-ated with narrowly specialized wheat curl mite lineages may provide clues for the identification of genes that are respon-sible for resistance to wheat curl mite. This study elucidates the diversity of the wheat curl mite cryptic species complex in its presumed cradle of origin and signals the necessity for further research regarding the source and drivers of global wheat curl mite introduction events. This understanding is central to enhanced bio-security.
Acknowledgments — We wish to acknowledge Mirosława Dabert (Molecular Techniques Laboratory, Adam Mickiewicz University), who helped to design the Er28SF05 and Er28SR05 primers. The study was financed by the National Science Centre of Poland, grant DEC- 2011/01/N/NZ8/04540. DNA data of three wheat curl mite pop-ulations included here were financed by the National Science Cen-tre of Poland, grant DEC-2011/03/B/NZ8/00129. We would also like

2038 Sz y d ł o e t a l . i n Jo u r n a l o f Ec o n o m i c En t o m o l o g y 108 (2015)
to thank the three anonymous reviewers from Journal of Economic Entomology for a critical reading of the manuscript and their valu-able comments.
ReferencesAbbott, R., D. Albach, S. Ansell, J. W. Arntzen, S.J.E. Baird,
N. Bierne, J. Boughman, A. Brelsford, C. A. Buerkle, R. Buggs, et al. 2013. Hybridization and speciation. J. Evol. Biol. 26: 229–246.
Anisimova, M., and O. Gascuel. 2006. Approximate likelihood- ra-tio test for branches: A fast, accurate, and powerful alternative. Syst. Biol. 55: 539–52.
Amrine, J. W. Jr. 2003. Catalog of the Eriophyoidea. A working cat-alog of the Eriophyoidea of the world. Ver. 1.0. http://insects.tamu.edu/research/collection/hallan/acari/eriophyidae (July 1, 2013)
Badr, A., K. Müller, R. Schäfer-Pregl, H. El Rabey, S. Effgen, H. H. Ibrahim, C. Pozzi, W. Rohde, and F. Salamini. 2000. On the origin and domestication history of barley (Hordeum vul-gare). Mol. Biol. Evol. 17: 499–510.
Bardsley, B., and I. Thomas. 2005. Valuing local wheat landra-ces for agrobiodiversity conservation in Northeast Turkey. Agric. Ecosyst. Environ. 106: 407–412.
Bickford, D., D. J. Lohman, N. S. Sodhi, P. K. L. Ng, R. Meier, K. Winker, K. K. Ingram, and I. Das. 2007. Cryptic species as a window on diversity and conservation. Trends Ecol. Evol. 22: 148–155.
Carew, M., M. Schiffer, P. Umina, A. Weeks, and A. Hoffmann. 2009. Molecular markers indicate that the wheat curl mite Ace-ria tosichella Keifer may represent a species complex in Austra-lia. Bull. Entomol. Res. 5: 479–486.
Dabert, J., R. Ehrnsberger, and M. Dabert. 2008. Glaucalges ty-tonis sp. n. (Analgoidea, Xolalgidae) from the barn owl Tyto alba (Strigiformes, Tytonidae): Compiling morphology with DNA bar-code data for taxon descriptions in mites (Acari). Zootaxa 1719: 41–52.
Darriba, D., G. L. Taboada, R. Doallo, and D. Posada. 2012. jModelTest 2: More models, new heuristics and parallel comput-ing. Nat. Methods 9: 772.
de Barro, P, and M. Z. Ahmed. 2011. Genetic networking of the Bemisia tabaci cryptic species complex reveals pattern of biolog-ical invasions. PLoS ONE 6: e25579.
de Lillo, E., C. Craemer, J. W. Amrine, Jr., and G. Nuzzaci. 2010. Recommended procedures and techniques for morphologi-cal studies of Eriophyoidea (Acari: Prostigmata). Exp. Appl. Ac-arol. 51: 283–307.
Denizhan, E., W. Szydło, and A. Skoracka. 2013. Eriophyoid studies in Turkey: Review and perspectives. Biol. Lett. 50: 45–54.
Dias, E. S., and C.M.A. Carareto. 2012. Ancestral polymorphism and recent invasion of transposable elements in Drosophila spe-cies. BMC Evol. Biol. 12: 119.
Doebley, J.F., B. S. Gaut, and B. D. Smith.2006. Themolecular genetics of crop domestication. Cell 127: 1309–1321.
Donald W. W., and A. G. Ogg, Jr. 1991. Biology and control of jointed goatgrass (Aegilops cylindrica), a review. Weed Technol. 5: 3–17.
Drés, M., and J. Mallet. 2002. Host races in plant-feeding insects and their importance in sympatric speciation. Phil. Trans. R. Soc. Lond. B 357: 471-492.
Dvorak, J., M. C. H. Luo, and E. D. Akhunov. 2011. N. I. Vavilov’s theory of centres of diversity in the light of current understanding of wheat diversity, domestication and evolution. Czech J. Genet. Plant 47: S20–S27.
Esterhuizen, L. L., K. G. Mabasa, S. W. van Heerden, H. Czos-nek, J. K. Brown, H. van Heerden, and M.E.C. Rey. 2013. Genetic identification of members of the Bemisia tabaci cryptic species complex from South Africa reveals native and introduced haplotypes. J. Appl. Entomol. 137: 122–135.
Farris, J. S., M. Källersjö, A. G. Kluge, and C. Bult. 1994. Test-ing significance of congruence. Cladistics 10: 315–319.
Farris, J. S., M. Källersjö, A. G. Kluge, and C. Bult. 1995. Con-structing a significance test for incongruence. Syst. Biol. 44: 570–572.
Frewin, A., C. Scott-Dupree, G. Murphy, and R. Hanner. 2014. Demographic trends in mixed Bemisia tabaci (Hemiptera: Aley-rodidae) cryptic species populations in commercial poinsettia under biological control- and insecticide- based management. J. Econ. Entomol. 107: 1150–1155.
Glez-Peña, D., D. Gómez-Blanco, M. Reboiro-Jato, F. Fdez-Riv-erola, and D. Posada. 2010. ALTER: Program-oriented format conversion of DNA and protein alignments. Nucleic Acids Res. 38:W14–W18.
Guindon, S., and O. Gascuel. 2003. A simple, fast and accurate method to estimate large phylogenies by maximum-likelihood”. Syst. Biol. 52: 696–704.
Guindon, S., J. F. Dufayard, V. Lefort, M. Anisimova, W. Hordijk, and O. Gascuel. 2010. New algorithms and methods to estimate maximum-likelihood phylogenies: Assessing the per-formance of PhyML 3.0. Syst. Biol. 59: 307–321.
Guo, J.-Y., G. Wu, and F.-H. Wan. 2013. Effects of high-gossypol cotton on the development and reproduction of Bemisia tabaci (Hemiptera: Aleyrodidae) MEAM1 cryptic species. J. Econ. En-tomol. 106: 1379–1385.
Hall, T. A. 1999. BioEdit: A user-friendly biological sequence align-ment editor and analysis program for Windows 95/98/ NT. Nu-cleic Acids Symp. Ser. 41: 95–98.
Hebert, P. D. N., S. Ratnasingham, and J. R. de Waard, 2003. Barcoding animal life: Cytochrome c oxidase subunit I diver-gences among closely related species. Proc. R. Soc. Lond. B 270: S96–S99.
Hein, G. L., R. French, B. Siriwetwiwat, and J. W. Amrine Jr. 2012. Genetic characterization of North American populations of the wheat curl mite and dry bulb mite. J. Econ. Entomol. 105: 1801–1808.
Heun, M., R. Schäfer-Pregl, D. Klawan, R. Castagna, M. Ac-cerbi, B. Borghi, and F. Salamini. 1997. Site of einkorn wheat domestication identified by DNA fingerprinting. Science 278: 1312–1314.
Karagöz, A. 2014. Wheat landraces of Turkey. Emir. J. Food Ag-ric. 26: 149–156.
Karsten, M., B. J. van Vuuren, A. Barnaud, and J. S. Ter-blanche. 2013. Population genetics of Ceratitis capitata in South Africa: Implications for dispersal and pest management. PLoS ONE 8: e54281.
Keifer, H. H. 1969. Eriophyid Studies C3: 1-2, U.S. Dep. Agric., ARS. Special Publ., Calif. Dep. Agric., Sacramento, CA.
Kiedrowicz, A., B. Rector, E. Denizhan, W. Szydło, and A. Skoracka. 2014. Infestation of grasses by eriophyoid mites (Ac-ari: Eriophyoidea) in Turkey. Int. J. Acarol. 40: 421–427.
Kirk, H., S. Dorn, and D. Mazzi. 2013. Molecular genetics and ge-nomics generate new insights into invertebrate pest invasions. Evol. Appl. 6: 842-856.
Lanfear, R., B. Calcott, S. Y. W. Ho, and S. Guindon. 2012. Par-titionFinder: Combined selection of partitioning schemes and sub-stitution models for phylogenetic analyses. Mol. Biol. Evol. 29: 1695-1701.

Hi g H ge n e t i c Di v e r s i t y i n WH e a t cu r l Mi t e Po P u l a t i o n s f r o M tu r k e y 2039
Lindquist, E. E., and G. N. Oldfield. 1996. Evolution of erio-phyoid mites in relation to their host plants, pp. 277–300. In: E. E. Lindquist, M. W. Sabelis, J. Bruin (eds.), Eriophy-oid mites—Their biology, natural enemies and control, World Crop Pests vol. 6. Elsevier Science Publishing, Amsterdam, The Netherlands.
Lev-Yadun, S., A. Gopher, and S. Abbo. 2000. The cradle of agri-culture. Science 288: 1602–1603.
Mastrangelo, T., D. F. Paulo, L. W. Bergamo, E. G. F. Morais, M. Silva, G. Bezerra-Silva, and A. M. L. Azeredo-Espin. 2014. Detection and genetic diversity of a heliothine invader (Lep-idoptera: Noctuidae) from North and Northeast of Brazil. J. Econ. Entomol. 107: 970–980.
Michalska, K., A. Skoracka, D. Navia, and J. W. Amrine. 2010. Behavioural studies on eriophyoid mites: An overview. Exp. Appl. Acarol. 51: 39–51.
Miller, A.D., P. A. Umina, A. R. Weeks, and A. A. Hoffmann. 2012. Population genetics of the wheat curl mite (Aceria tosichella Keifer) in Australia: implications for the management of wheat pathogens. Bull. Entomol. Res. 102: 199–212.
Miller, A. D., A. Skoracka, D. Navia, R. S. de Mendonça, W. Szydło, M. Schultz, C. M. Smith, G. Truol, and A. A. Hoff-mann. 2013. Phylogenetic analyses reveal extensive cryptic spe-ciation and host specialization in an economically important mite taxon. Mol. Phylogenet. Evol. 66: 928–940.
Mironov, S. V., J. Dabert, and M. Dabert. 2012. A new feather mite species of the genus Proctophyllodes Robin, 1877 (Astigmata: Proctophyllodidae) from the Long-tailed Tit Aegithalos caudatus (Passeriformes: Aegithalidae)—morphological description with DNA barcode data. Zootaxa 3253: 54–61.
Navia, D., R. S. de Mendonça, A. Skoracka, W. Szydło, D. Kni-hinicki, G. L. Hein, P. R. da Silva Pereira, G. Truol, and D. Lau. 2013. Wheat curl mite, Aceria tosichella, and transmitted viruses: An expanding pest complex affecting cereal crops. Exp. Appl. Acarol. 59: 95–143.
Nowell, R. W., B. Charlesworth, and P. R. Haddrill. 2011. An-cestral polymorphisms in Drosophila pseudoobscura and Drosoph-ila miranda. Genet. Res. (Camb) 93: 255–263.
Novak, S. J., and A. Y. Welfley. 1997. Genetic diversity in the in-troduced clonal grass Poa bulbosa (Bulbous bluegrass). North-west Sci. 71: 271–280.
Perring, T.M. 2001. The Bemisia tabaci species complex. Crop Prot. 20: 725–737.
Piganeau, G., and A. Eyre-Walker. 2009. Evidence for variation in the effective population size of animal mitochondrial DNA. PLoS ONE 4: e4396.
Rabenstein, F., D. L. Seifers, J. Schubert, R. French, and D. C. Stenger. 2002. Phylogenetic relationships, strain diversity and biogeography of tritimoviruses. J. Gen. Virol. 83: 895–906.
Rambaut, A., and A. J. Drummond. 2009. Tracer v1.5. < http://tree.bio.ed.ac.uk/software/tracer/> (accessed 30 January 2013).
Ronquist, F., M. Teslenko, P. van der Mark, D. Ayres, A. Dar-ling, S. Höhna, B. Larget, L. Liu, M. A. Suchard, and J. P. Huelsenbeck. 2012. MrBayes 3.2: Efficient Bayesian phyloge-netic inference and model choice across a large model space. Syst. Biol. 61: 539–542.
Sabelis, M. W., and J. Bruin. 1996. Evolutionary ecology: Life his-tory patterns, food plant choice and dispersal, pp. 329– 366. In E. E. Lindquist, M. W. Sabelis, J. Bruin (eds.), Eriophyoid mites—their biology, natural enemies and control, World crop pests vol. 6.Elsevier Science Publishing, Amsterdam, The Netherlands.
Sakai, A. K., F. W. Allendorf, J. S. Holt, D. M. Lodge, J. Molof-sky, K. A. Wit, S. Baughman, R. J. Cabin, J. E. Cohen, N. C. Ellstrand, et al. 2001. The population biology of invasive spe-cies. Ann. Rev. Ecol. Syst. 32: 305–332.
Seifers, D. L., T. L. Harvey, J. Martin, and S. G. Jensen. 1997. Identification of the wheat curl mite as the vector of the High Plains virus of corn and wheat. Plant Dis. 81: 1161–1166.
Seifers, D. L., T. J. Martin, T. L. Harvey, J. P. Fellers, and J. P. Michaud. 2009. Identification of the wheat curl mite as the vec-tor of Triticum mosaic virus. Plant Dis. 93: 25–29.
Shi, W., C. Kerdelhué, and H. Ye. 2014. Genetic structure and col-onization history of the fruit fly Bactrocera tau (Diptera: Teph-ritidae) in China and Southeast Asia. J. Econ. Entomol. 107: 1256–1265.
Skoracka, A., and M. Dabert. 2010. The cereal rust mite Abac-arus hystrix (Acari: Eriophyoidea) is a complex of species: Evi-dence from mitochondrial and nuclear DNA sequences. Bull. En-tomol. Res. 100: 263–272.
Skoracka, A., L. Kuczyński, R. S. de Mendonça, M. Dabert, W. Szydło, D. Knihinicki, G. Truol, and D. Navia. 2012. Cryptic species within the wheat curl mite Aceria tosichella (Keifer) (Ac-ari, Eriophyoidea) revealed by mitochondrial, nuclear and mor-phometric data. Invertebr. Syst. 26: 417–433.
Skoracka, A., L. Kuczyński, W. Szydło, and B. Rector. 2013. The wheat curl mite Aceria tosichella (Acari: Eriophyoidea) is a complex of cryptic lineages with divergent host ranges: Evidence from molecular and plant bioassay data. Biol. J. Linn. Soc. 109: 165–180.
Skoracka, A., L. Kuczyński, B. Rector, and J. W. Amrine Jr. 2014a. Wheat curl mite and dry bulb mite: Untangling a taxo-nomic conundrum through a multidisciplinary approach. Biol. J. Linn. Soc. 111: 421–436.
Skoracka, A., B. Rector, L. Kuczyński, W. Szydło, G. Hein, and R. French. 2014b. Global spread of wheat curl mite by its most polyphagous and pestiferous lineages. Ann. Appl. Biol. 116: 222–235.
Slykhuis, J. T. 1955. Aceria tulipae Keifer (Acarina: Eriophyidae) in relation to the spread of wheat streak mosaic. Phytopathol. 45: 116–128.
Smith, B. D. 1998. The emergence of agriculture. W. H. Freeman, New York, NY.
Sonnenberg, R., A. W. Nolte, and D. Tautz. 2007. An evaluation of LSU rDNA D1-D2 sequences for their use in species identifi-cation. Front. Zool. 4: 6.
Stankowski, S., and M. S. Johnson. 2014. Biogeographic discor-dance of molecular phylogenetic and phenotypic variation in a continental archipelago radiation of land snails. BMC Evol. Biol. 14: 2.
Swofford, D. L. 2003. PAUP*. Phylogenetic analysis using parsi-mony (*and Other Methods). Version 4. Sinauer Associates, Sun-derland, MA.
Tamura, K., D. Peterson, N. Peterson, G. Stecher, M. Nei, and S. Kumar. 2011. MEGA5: Molecular evolutionary genetics anal-ysis using maximum likelihood, evolutionary distance, and maxi-mum parsimony methods. Mol. Biol. Evol. 28: 2731–2739.
Tsutsui, N. D., A. V. Suarez, D. A. Holway, and T. J. Case. 2000. Reduced genetic variation and the success of an invasive species. Proc. Natl. Acad. Sci. USA 97: 5948–5953.
Zheng, Y., X. Peng, G. Liu, H. Pan, S. Dorn, and M. Chen. 2013. High genetic diversity and structured populations of the oriental fruit moth in its range of origin. PLoS ONE 8: e78476.

Table S1. The pair-wise p-distances of the COI mtDNA sequences used in the study are presented on the lower-left side of the table, and relevant standard error values (bootstrap=1,000) are presented on
the upper-right. All distances were calculated with MEGA5. The sample codes are explained in Table 1. ah
ys.1
ahys
.2
alo
n.1
alo
n.2
wcm
.AEG
.1
wcm
.AG
R.1
wcm
.AR
R.1
wcm
.BR
O.1
wcm
.BR
O.2
wcm
.BR
O.3
wcm
.BR
O.4
wcm
.ELY
.1
wcm
.ELY
.2
wcm
.ER
E.1
wcm
.HO
R.1
wcm
.HO
R.2
wcm
.HO
R.3
wcm
.HO
R.4
wcm
.HO
R.5
wcm
.HO
R.6
wcm
.HO
R.7
wcm
.HO
R.8
wcm
.PO
A.1
wcm
.SEC
.1
wcm
.SEC
.2
wcm
.TR
I.1
wcm
.TR
I.2
wcm
.TR
I.3
wcm
.TR
I.4
wcm
.TR
I.5
wcm
.TR
I.6
wcm
.TR
I.7
wcm
.TR
I.8
ahys.1
1.62 1.72 1.70 1.81 1.73 1.68 1.69 1.71 1.78 1.76 1.72 1.88 1.64 1.74 1.73 1.89 1.71 1.73 1.68 1.67 1.70 1.63 1.82 1.68 1.72 1.73 1.73 1.76 1.78 1.77 1.70 1.75
ahys.2 17.17
1.73 1.74 1.76 1.60 1.78 1.81 1.71 1.76 1.78 1.71 1.68 1.73 1.58 1.63 1.69 1.73 1.58 1.75 1.76 1.73 1.69 1.71 1.73 1.70 1.71 1.71 1.77 1.70 1.79 1.73 1.76
alon.1 21.17 19.83
0.16 1.85 1.71 1.73 1.78 1.73 1.79 1.81 1.72 1.75 1.79 1.71 1.77 1.76 1.72 1.74 1.70 1.68 1.74 1.73 1.72 1.70 1.69 1.69 1.74 1.73 1.74 1.74 1.74 1.71
alon.2 21.00 20.00 0.17
1.85 1.71 1.73 1.78 1.74 1.80 1.82 1.74 1.76 1.80 1.71 1.78 1.77 1.73 1.73 1.70 1.68 1.75 1.73 1.73 1.69 1.69 1.69 1.76 1.73 1.75 1.74 1.75 1.72
wcm.AEG.1 21.33 19.50 23.67 23.83
1.53 1.54 1.56 1.55 1.49 1.55 1.55 1.60 1.61 1.52 1.49 1.63 1.48 1.58 1.54 1.54 1.76 1.53 1.51 1.58 1.57 1.58 1.54 1.62 1.69 1.62 1.76 1.77
wcm.AGR.1 20.17 18.83 21.67 21.50 15.00
1.45 1.33 1.46 1.39 1.33 1.47 1.41 1.43 0.21 1.41 1.43 1.42 0.38 1.45 1.45 1.46 1.49 1.52 1.39 1.37 1.39 1.45 1.38 1.44 1.45 1.46 1.46
wcm.ARR.1 18.00 20.83 21.83 21.67 18.67 13.83
1.47 1.56 1.50 1.36 1.46 1.47 1.51 1.46 1.46 1.51 1.35 1.46 1.36 1.35 1.49 1.54 1.38 1.17 1.17 1.19 1.41 1.32 1.41 1.32 1.49 1.44
wcm.BRO.1 19.50 20.83 21.33 21.50 16.33 11.17 14.67
1.50 1.51 1.37 1.50 1.49 1.50 1.35 1.39 1.52 1.49 1.33 1.54 1.54 1.48 1.39 1.59 1.44 1.44 1.45 1.48 1.44 1.46 1.47 1.48 1.52
wcm.BRO.2 20.17 19.17 21.33 21.50 15.83 15.17 16.33 14.00
1.02 1.50 1.57 1.50 1.57 1.48 1.58 1.57 1.42 1.46 1.56 1.56 1.56 1.29 1.49 1.55 1.55 1.56 1.58 1.55 1.53 1.61 1.56 1.57
wcm.BRO.3 20.33 20.83 22.33 22.50 16.17 13.67 16.33 14.33 6.67
1.43 1.60 1.56 1.59 1.40 1.52 1.62 1.50 1.41 1.55 1.55 1.61 1.29 1.56 1.49 1.50 1.52 1.58 1.55 1.56 1.56 1.61 1.59
wcm.BRO.4 20.50 21.33 23.83 24.00 17.50 12.67 14.17 13.67 15.50 15.33
1.43 1.37 1.40 1.35 1.39 1.45 1.35 1.32 1.34 1.32 1.43 1.40 1.44 1.35 1.38 1.40 1.37 1.42 1.40 1.42 1.43 1.43
wcm.ELY.1 20.67 20.67 20.67 20.83 17.17 14.33 15.83 15.33 16.50 17.50 13.67
1.41 1.58 1.46 1.39 1.47 1.33 1.48 1.39 1.40 1.47 1.51 1.34 1.39 1.36 1.37 0.35 1.30 1.39 1.37 1.47 1.48
wcm.ELY.2 22.33 19.33 22.33 22.50 18.83 14.00 14.67 15.17 16.17 17.17 13.33 14.33
1.54 1.41 1.49 0.63 1.54 1.40 1.40 1.40 1.04 1.46 1.48 1.33 1.34 1.35 1.40 1.09 0.96 1.10 1.04 0.98
wcm.ERE.1 19.33 19.50 22.00 22.17 18.50 14.17 16.33 16.00 17.50 18.50 15.00 17.33 16.33
1.44 1.52 1.60 1.49 1.44 1.44 1.43 1.57 1.48 1.53 1.42 1.42 1.43 1.55 1.42 1.55 1.48 1.57 1.54
wcm.HOR.1 20.50 18.83 22.00 21.83 15.00 0.33 14.17 11.50 15.50 14.00 13.00 14.33 14.33 14.50
1.41 1.41 1.40 0.44 1.45 1.46 1.47 1.50 1.51 1.40 1.36 1.37 1.45 1.37 1.43 1.45 1.47 1.47
wcm.HOR.2 20.67 20.67 21.83 22.00 16.17 13.67 15.83 13.33 16.33 15.83 14.50 14.00 14.33 17.17 13.67
1.42 1.55 1.41 1.55 1.56 1.52 1.50 1.61 1.47 1.44 1.45 1.36 1.47 1.46 1.44 1.52 1.52
wcm.HOR.3 23.17 19.33 22.33 22.50 19.50 14.17 15.67 15.67 17.33 17.50 14.83 15.17 2.50 17.17 14.17 13.83
1.60 1.42 1.50 1.50 1.09 1.54 1.57 1.37 1.34 1.35 1.48 1.10 1.04 1.13 1.09 1.05
wcm.HOR.4 20.83 20.33 22.67 22.83 17.00 14.33 14.50 15.33 15.50 17.50 13.83 12.67 17.00 15.33 14.33 17.83 18.17
1.44 1.55 1.56 1.61 1.50 1.01 1.39 1.37 1.38 1.27 1.42 1.54 1.48 1.61 1.63
wcm.HOR.5 20.17 18.50 21.83 21.67 16.00 1.00 14.17 11.17 15.17 14.00 12.50 14.50 14.17 14.33 1.33 13.67 14.33 14.50
1.49 1.48 1.45 1.50 1.56 1.38 1.37 1.39 1.45 1.38 1.44 1.45 1.45 1.45
wcm.HOR.6 19.83 21.17 20.67 20.83 17.17 13.33 11.83 15.17 16.17 16.67 13.33 13.67 13.83 15.33 13.33 16.00 14.83 15.83 14.17
0.15 1.40 1.49 1.54 1.27 1.25 1.25 1.40 1.26 1.34 1.35 1.40 1.41
wcm.HOR.7 19.67 21.33 20.50 20.67 17.33 13.17 11.67 15.00 16.00 16.50 13.17 13.83 13.67 15.17 13.50 16.17 15.00 16.00 14.00 0.17
1.39 1.49 1.55 1.25 1.26 1.27 1.41 1.28 1.35 1.34 1.39 1.40
wcm.HOR.8 20.00 20.67 22.33 22.50 20.33 14.17 15.83 14.67 16.33 17.00 13.33 14.83 6.83 16.33 14.50 15.33 8.00 17.33 14.33 13.67 13.50
1.47 1.60 1.44 1.46 1.47 1.45 1.22 0.65 1.31 0.00 0.54
wcm.POA.1 19.83 19.67 21.83 22.00 17.83 16.00 16.33 13.67 12.17 12.83 16.17 17.83 16.50 16.17 16.33 14.83 17.50 18.00 16.00 15.67 15.50 16.50
1.51 1.47 1.46 1.47 1.46 1.46 1.39 1.47 1.47 1.48
wcm.SEC.1 22.50 20.33 23.33 23.50 16.17 15.83 14.67 16.33 15.50 17.50 13.83 11.67 15.50 15.83 15.83 17.50 17.33 7.17 16.33 16.17 16.33 17.17 17.33
1.42 1.39 1.40 1.33 1.43 1.54 1.50 1.60 1.60
wcm.SEC.2 18.17 20.00 20.83 21.00 18.33 12.83 10.17 14.83 16.00 15.50 11.83 13.83 13.67 14.17 13.17 15.67 13.83 14.50 13.17 10.17 10.00 13.83 15.33 15.17
0.37 0.33 1.33 0.87 1.36 0.90 1.44 1.43
wcm.TRI.1 18.17 19.50 21.00 21.17 18.17 12.83 10.50 14.83 16.00 15.83 11.83 13.50 13.50 14.17 12.83 15.00 13.33 14.50 12.83 10.17 10.33 13.83 15.33 14.83 1.00
0.17 1.31 0.80 1.35 0.92 1.46 1.45
wcm.TRI.2 18.33 19.67 20.83 21.00 18.33 13.00 10.67 15.00 16.17 16.00 12.00 13.67 13.67 14.33 13.00 15.17 13.50 14.67 13.00 10.33 10.50 14.00 15.50 15.00 0.83 0.17
1.31 0.82 1.36 0.91 1.47 1.46
wcm.TRI.3 20.50 20.83 21.00 21.17 17.17 14.17 15.17 15.00 16.33 17.00 12.83 0.83 14.17 17.17 14.17 13.50 15.33 11.83 14.00 13.83 14.00 15.00 17.00 11.50 13.33 13.00 13.17
1.30 1.38 1.33 1.45 1.47
wcm.TRI.4 19.67 20.50 21.00 21.17 19.83 13.00 12.33 14.50 16.33 16.67 12.50 12.17 9.00 14.67 13.00 14.83 9.33 15.17 13.17 10.67 10.83 10.50 15.50 15.00 5.33 4.67 4.83 12.00
1.05 0.72 1.22 1.18
wcm.TRI.5 20.67 19.67 22.33 22.50 19.50 13.83 13.83 14.17 16.17 16.83 13.17 13.83 5.67 16.33 13.83 13.67 6.67 16.17 14.00 13.00 13.17 3.00 15.33 16.33 12.50 12.17 12.33 13.67 8.00
1.16 0.65 0.57
wcm.TRI.6 19.67 20.50 21.50 21.67 19.83 14.17 12.50 16.00 17.33 16.67 13.00 13.50 8.33 15.33 14.50 15.17 8.83 16.17 14.33 11.67 11.50 11.17 16.17 16.50 5.67 6.00 5.83 13.00 3.33 8.67
1.31 1.23
wcm.TRI.7 20.00 20.67 22.33 22.50 20.33 14.17 15.83 14.67 16.33 17.00 13.33 14.83 6.83 16.33 14.50 15.33 8.00 17.33 14.33 13.67 13.50 0.00 16.50 17.17 13.83 13.83 14.00 15.00 10.50 3.00 11.17
0.54
wcm.TRI.8 20.83 21.17 22.00 22.17 20.50 14.83 14.67 14.83 16.67 17.33 13.67 15.83 6.33 16.67 15.17 15.00 7.50 17.67 15.00 13.67 13.50 2.00 16.50 17.17 14.00 14.00 14.17 15.67 10.17 2.33 10.50 2.00

Table S2. The pair-wise p-distances of the D2 region of 28S rDNA sequences used in the study are presented on the lower-left side of the
table and relevant standard error values (bootstrap=1,000) are presented on the upper-right. All distances were calculated with MEGA5.
The sample codes are explained in Table 1.
ahys
.1
alo
n.1
wcm
.AEG
.1
wcm
.AG
R.1
wcm
.AR
R.1
wcm
.BR
O.1
wcm
.BR
O.2
wcm
.BR
O.3
wcm
.BR
O.4
wcm
.ELY
.1
wcm
.ER
E.1
wcm
.HO
R.1
wcm
.HO
R.2
wcm
.HO
R.4
wcm
.HO
R.5
wcm
.HO
R.7
wcm
.PO
A.1
wcm
.SEC
.1
wcm
.TR
I.1
wcm
.TR
I.2
wcm
.TR
I.3
wcm
.TR
I.5
wcm
.TR
I.6
wcm
.TR
I.7
ahys.1
0.86 1.55 1.40 1.39 1.37 1.54 1.52 1.38 1.73 1.44 1.40 1.38 1.39 1.40 1.39 1.52 1.41 1.40 1.39 1.40 1.38 1.54 1.38
alon.1 3.79
1.60 1.55 1.53 1.52 1.58 1.57 1.54 1.77 1.57 1.55 1.56 1.53 1.55 1.53 1.53 1.54 1.54 1.53 1.54 1.52 1.61 1.52
wcm.AEG.1 12.69 14.25
1.48 1.47 1.44 1.39 1.38 1.46 1.59 1.51 1.48 1.44 1.47 1.48 1.47 1.43 1.52 1.46 1.47 1.48 1.45 1.64 1.45
wcm.AGR.1 10.24 12.47 10.69
0.41 0.55 0.96 0.93 0.37 1.29 0.53 0.00 0.65 0.41 0.00 0.41 0.90 0.62 0.51 0.41 0.46 0.38 0.93 0.38
wcm.ARR.1 10.24 12.47 10.91 0.89
0.48 0.93 0.90 0.36 1.29 0.61 0.41 0.60 0.00 0.41 0.00 0.88 0.48 0.29 0.00 0.22 0.35 0.92 0.35
wcm.BRO.1 9.80 12.47 10.02 1.56 1.11
0.98 0.96 0.42 1.34 0.71 0.55 0.74 0.48 0.55 0.48 0.93 0.66 0.56 0.48 0.52 0.51 1.00 0.51
wcm.BRO.2 12.25 13.36 9.58 4.90 4.68 5.12
0.22 0.94 1.03 1.00 0.96 1.04 0.93 0.96 0.93 0.42 1.00 0.96 0.93 0.95 0.95 1.23 0.95
wcm.BRO.3 12.03 13.14 9.35 4.68 4.45 4.90 0.22
0.91 1.01 0.98 0.93 1.01 0.90 0.93 0.90 0.37 0.98 0.94 0.90 0.93 0.92 1.22 0.92
wcm.BRO.4 9.80 12.47 10.47 0.67 0.67 0.89 4.68 4.45
1.30 0.59 0.37 0.68 0.36 0.37 0.36 0.89 0.58 0.47 0.36 0.42 0.30 0.92 0.30
wcm.ELY.1 16.70 17.82 14.25 9.58 9.35 9.80 5.79 5.57 9.35
1.36 1.29 1.35 1.29 1.29 1.29 1.04 1.32 1.31 1.29 1.30 1.30 1.43 1.30
wcm.ERE.1 10.69 12.92 11.36 1.34 1.78 2.45 5.35 5.12 1.56 10.24
0.53 0.78 0.61 0.53 0.61 0.95 0.77 0.68 0.61 0.64 0.58 1.03 0.58
wcm.HOR.1 10.24 12.47 10.69 0.00 0.89 1.56 4.90 4.68 0.67 9.58 1.34
0.65 0.41 0.00 0.41 0.90 0.62 0.51 0.41 0.46 0.38 0.93 0.38
wcm.HOR.2 10.47 12.92 10.47 2.23 1.78 2.90 5.57 5.35 2.45 10.24 3.12 2.23
0.60 0.65 0.60 1.03 0.78 0.66 0.60 0.62 0.62 1.05 0.62
wcm.HOR.4 10.24 12.47 10.91 0.89 0.00 1.11 4.68 4.45 0.67 9.35 1.78 0.89 1.78
0.41 0.00 0.88 0.48 0.29 0.00 0.22 0.35 0.92 0.35
wcm.HOR.5 10.24 12.47 10.69 0.00 0.89 1.56 4.90 4.68 0.67 9.58 1.34 0.00 2.23 0.89
0.41 0.90 0.62 0.51 0.41 0.46 0.38 0.93 0.38
wcm.HOR.7 10.24 12.47 10.91 0.89 0.00 1.11 4.68 4.45 0.67 9.35 1.78 0.89 1.78 0.00 0.89
0.88 0.48 0.29 0.00 0.22 0.35 0.92 0.35
wcm.POA.1 12.03 12.69 10.02 4.45 4.23 4.68 0.89 0.67 4.23 5.79 4.90 4.45 5.57 4.23 4.45 4.23
0.96 0.91 0.88 0.90 0.89 1.18 0.89
wcm.SEC.1 10.69 12.92 11.80 2.00 1.11 2.23 5.57 5.35 1.78 10.24 2.90 2.00 2.90 1.11 2.00 1.11 5.12
0.55 0.48 0.52 0.58 0.99 0.58
wcm.TRI.1 10.69 12.92 11.36 1.34 0.45 1.56 5.12 4.90 1.11 9.58 2.23 1.34 2.23 0.45 1.34 0.45 4.68 1.56
0.29 0.37 0.46 0.96 0.46
wcm.TRI.2 10.24 12.47 10.91 0.89 0.00 1.11 4.68 4.45 0.67 9.35 1.78 0.89 1.78 0.00 0.89 0.00 4.23 1.11 0.45
0.22 0.35 0.92 0.35
wcm.TRI.3 10.47 12.69 11.14 1.11 0.22 1.34 4.90 4.68 0.89 9.58 2.00 1.11 2.00 0.22 1.11 0.22 4.45 1.34 0.67 0.22
0.41 0.93 0.41
wcm.TRI.5 10.02 12.03 10.47 0.67 0.67 1.34 4.68 4.45 0.45 9.35 1.56 0.67 2.00 0.67 0.67 0.67 4.23 1.78 1.11 0.67 0.89
0.87 0.00
wcm.TRI.6 12.92 14.25 13.81 4.45 4.45 5.12 8.24 8.02 4.23 11.80 5.35 4.45 5.79 4.45 4.45 4.45 7.80 5.35 4.90 4.45 4.68 3.79
0.87
wcm.TRI.7 10.02 12.03 10.47 0.67 0.67 1.34 4.68 4.45 0.45 9.35 1.56 0.67 2.00 0.67 0.67 0.67 4.23 1.78 1.11 0.67 0.89 0.00 3.79
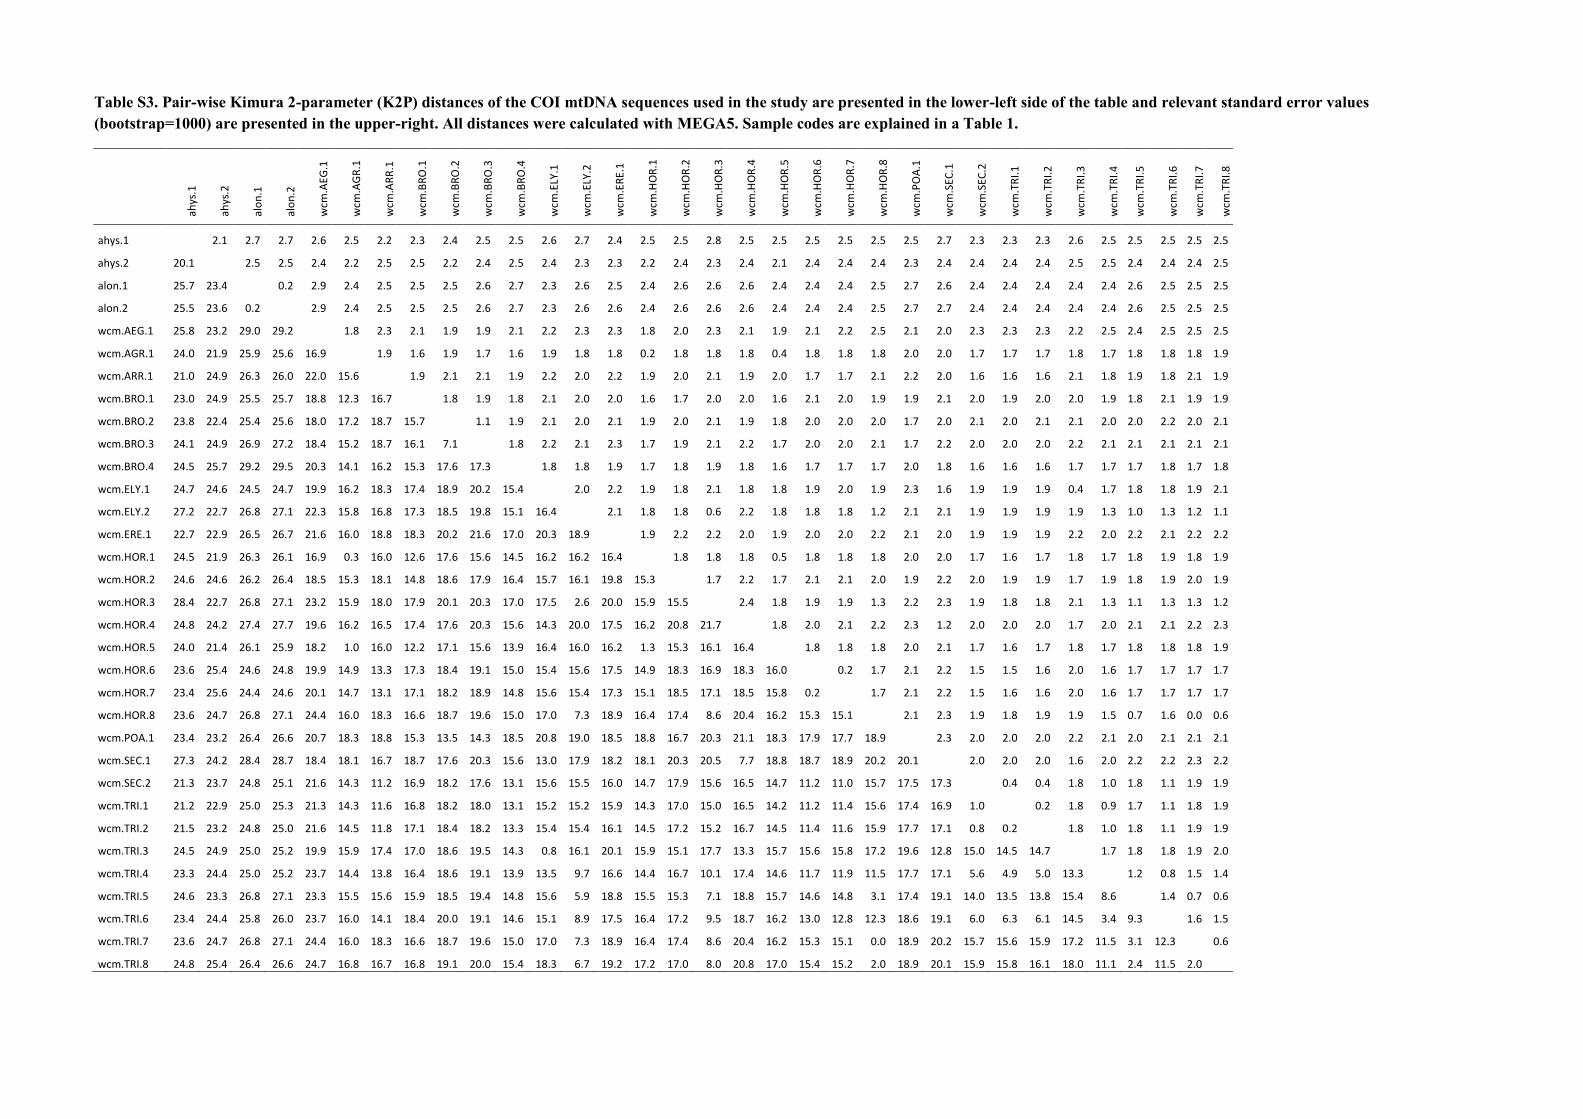
Table S3. Pair-wise Kimura 2-parameter (K2P) distances of the COI mtDNA sequences used in the study are presented in the lower-left side of the table and relevant standard error values
(bootstrap=1000) are presented in the upper-right. All distances were calculated with MEGA5. Sample codes are explained in a Table 1.
ahys
.1
ahys
.2
alo
n.1
alo
n.2
wcm
.AEG
.1
wcm
.AG
R.1
wcm
.AR
R.1
wcm
.BR
O.1
wcm
.BR
O.2
wcm
.BR
O.3
wcm
.BR
O.4
wcm
.ELY
.1
wcm
.ELY
.2
wcm
.ER
E.1
wcm
.HO
R.1
wcm
.HO
R.2
wcm
.HO
R.3
wcm
.HO
R.4
wcm
.HO
R.5
wcm
.HO
R.6
wcm
.HO
R.7
wcm
.HO
R.8
wcm
.PO
A.1
wcm
.SEC
.1
wcm
.SEC
.2
wcm
.TR
I.1
wcm
.TR
I.2
wcm
.TR
I.3
wcm
.TR
I.4
wcm
.TR
I.5
wcm
.TR
I.6
wcm
.TR
I.7
wcm
.TR
I.8
ahys.1
2.1 2.7 2.7 2.6 2.5 2.2 2.3 2.4 2.5 2.5 2.6 2.7 2.4 2.5 2.5 2.8 2.5 2.5 2.5 2.5 2.5 2.5 2.7 2.3 2.3 2.3 2.6 2.5 2.5 2.5 2.5 2.5
ahys.2 20.1
2.5 2.5 2.4 2.2 2.5 2.5 2.2 2.4 2.5 2.4 2.3 2.3 2.2 2.4 2.3 2.4 2.1 2.4 2.4 2.4 2.3 2.4 2.4 2.4 2.4 2.5 2.5 2.4 2.4 2.4 2.5
alon.1 25.7 23.4
0.2 2.9 2.4 2.5 2.5 2.5 2.6 2.7 2.3 2.6 2.5 2.4 2.6 2.6 2.6 2.4 2.4 2.4 2.5 2.7 2.6 2.4 2.4 2.4 2.4 2.4 2.6 2.5 2.5 2.5
alon.2 25.5 23.6 0.2
2.9 2.4 2.5 2.5 2.5 2.6 2.7 2.3 2.6 2.6 2.4 2.6 2.6 2.6 2.4 2.4 2.4 2.5 2.7 2.7 2.4 2.4 2.4 2.4 2.4 2.6 2.5 2.5 2.5
wcm.AEG.1 25.8 23.2 29.0 29.2
1.8 2.3 2.1 1.9 1.9 2.1 2.2 2.3 2.3 1.8 2.0 2.3 2.1 1.9 2.1 2.2 2.5 2.1 2.0 2.3 2.3 2.3 2.2 2.5 2.4 2.5 2.5 2.5
wcm.AGR.1 24.0 21.9 25.9 25.6 16.9
1.9 1.6 1.9 1.7 1.6 1.9 1.8 1.8 0.2 1.8 1.8 1.8 0.4 1.8 1.8 1.8 2.0 2.0 1.7 1.7 1.7 1.8 1.7 1.8 1.8 1.8 1.9
wcm.ARR.1 21.0 24.9 26.3 26.0 22.0 15.6
1.9 2.1 2.1 1.9 2.2 2.0 2.2 1.9 2.0 2.1 1.9 2.0 1.7 1.7 2.1 2.2 2.0 1.6 1.6 1.6 2.1 1.8 1.9 1.8 2.1 1.9
wcm.BRO.1 23.0 24.9 25.5 25.7 18.8 12.3 16.7
1.8 1.9 1.8 2.1 2.0 2.0 1.6 1.7 2.0 2.0 1.6 2.1 2.0 1.9 1.9 2.1 2.0 1.9 2.0 2.0 1.9 1.8 2.1 1.9 1.9
wcm.BRO.2 23.8 22.4 25.4 25.6 18.0 17.2 18.7 15.7
1.1 1.9 2.1 2.0 2.1 1.9 2.0 2.1 1.9 1.8 2.0 2.0 2.0 1.7 2.0 2.1 2.0 2.1 2.1 2.0 2.0 2.2 2.0 2.1
wcm.BRO.3 24.1 24.9 26.9 27.2 18.4 15.2 18.7 16.1 7.1
1.8 2.2 2.1 2.3 1.7 1.9 2.1 2.2 1.7 2.0 2.0 2.1 1.7 2.2 2.0 2.0 2.0 2.2 2.1 2.1 2.1 2.1 2.1
wcm.BRO.4 24.5 25.7 29.2 29.5 20.3 14.1 16.2 15.3 17.6 17.3
1.8 1.8 1.9 1.7 1.8 1.9 1.8 1.6 1.7 1.7 1.7 2.0 1.8 1.6 1.6 1.6 1.7 1.7 1.7 1.8 1.7 1.8
wcm.ELY.1 24.7 24.6 24.5 24.7 19.9 16.2 18.3 17.4 18.9 20.2 15.4
2.0 2.2 1.9 1.8 2.1 1.8 1.8 1.9 2.0 1.9 2.3 1.6 1.9 1.9 1.9 0.4 1.7 1.8 1.8 1.9 2.1
wcm.ELY.2 27.2 22.7 26.8 27.1 22.3 15.8 16.8 17.3 18.5 19.8 15.1 16.4
2.1 1.8 1.8 0.6 2.2 1.8 1.8 1.8 1.2 2.1 2.1 1.9 1.9 1.9 1.9 1.3 1.0 1.3 1.2 1.1
wcm.ERE.1 22.7 22.9 26.5 26.7 21.6 16.0 18.8 18.3 20.2 21.6 17.0 20.3 18.9
1.9 2.2 2.2 2.0 1.9 2.0 2.0 2.2 2.1 2.0 1.9 1.9 1.9 2.2 2.0 2.2 2.1 2.2 2.2
wcm.HOR.1 24.5 21.9 26.3 26.1 16.9 0.3 16.0 12.6 17.6 15.6 14.5 16.2 16.2 16.4
1.8 1.8 1.8 0.5 1.8 1.8 1.8 2.0 2.0 1.7 1.6 1.7 1.8 1.7 1.8 1.9 1.8 1.9
wcm.HOR.2 24.6 24.6 26.2 26.4 18.5 15.3 18.1 14.8 18.6 17.9 16.4 15.7 16.1 19.8 15.3
1.7 2.2 1.7 2.1 2.1 2.0 1.9 2.2 2.0 1.9 1.9 1.7 1.9 1.8 1.9 2.0 1.9
wcm.HOR.3 28.4 22.7 26.8 27.1 23.2 15.9 18.0 17.9 20.1 20.3 17.0 17.5 2.6 20.0 15.9 15.5
2.4 1.8 1.9 1.9 1.3 2.2 2.3 1.9 1.8 1.8 2.1 1.3 1.1 1.3 1.3 1.2
wcm.HOR.4 24.8 24.2 27.4 27.7 19.6 16.2 16.5 17.4 17.6 20.3 15.6 14.3 20.0 17.5 16.2 20.8 21.7
1.8 2.0 2.1 2.2 2.3 1.2 2.0 2.0 2.0 1.7 2.0 2.1 2.1 2.2 2.3
wcm.HOR.5 24.0 21.4 26.1 25.9 18.2 1.0 16.0 12.2 17.1 15.6 13.9 16.4 16.0 16.2 1.3 15.3 16.1 16.4
1.8 1.8 1.8 2.0 2.1 1.7 1.6 1.7 1.8 1.7 1.8 1.8 1.8 1.9
wcm.HOR.6 23.6 25.4 24.6 24.8 19.9 14.9 13.3 17.3 18.4 19.1 15.0 15.4 15.6 17.5 14.9 18.3 16.9 18.3 16.0
0.2 1.7 2.1 2.2 1.5 1.5 1.6 2.0 1.6 1.7 1.7 1.7 1.7
wcm.HOR.7 23.4 25.6 24.4 24.6 20.1 14.7 13.1 17.1 18.2 18.9 14.8 15.6 15.4 17.3 15.1 18.5 17.1 18.5 15.8 0.2
1.7 2.1 2.2 1.5 1.6 1.6 2.0 1.6 1.7 1.7 1.7 1.7
wcm.HOR.8 23.6 24.7 26.8 27.1 24.4 16.0 18.3 16.6 18.7 19.6 15.0 17.0 7.3 18.9 16.4 17.4 8.6 20.4 16.2 15.3 15.1
2.1 2.3 1.9 1.8 1.9 1.9 1.5 0.7 1.6 0.0 0.6
wcm.POA.1 23.4 23.2 26.4 26.6 20.7 18.3 18.8 15.3 13.5 14.3 18.5 20.8 19.0 18.5 18.8 16.7 20.3 21.1 18.3 17.9 17.7 18.9
2.3 2.0 2.0 2.0 2.2 2.1 2.0 2.1 2.1 2.1
wcm.SEC.1 27.3 24.2 28.4 28.7 18.4 18.1 16.7 18.7 17.6 20.3 15.6 13.0 17.9 18.2 18.1 20.3 20.5 7.7 18.8 18.7 18.9 20.2 20.1
2.0 2.0 2.0 1.6 2.0 2.2 2.2 2.3 2.2
wcm.SEC.2 21.3 23.7 24.8 25.1 21.6 14.3 11.2 16.9 18.2 17.6 13.1 15.6 15.5 16.0 14.7 17.9 15.6 16.5 14.7 11.2 11.0 15.7 17.5 17.3
0.4 0.4 1.8 1.0 1.8 1.1 1.9 1.9
wcm.TRI.1 21.2 22.9 25.0 25.3 21.3 14.3 11.6 16.8 18.2 18.0 13.1 15.2 15.2 15.9 14.3 17.0 15.0 16.5 14.2 11.2 11.4 15.6 17.4 16.9 1.0
0.2 1.8 0.9 1.7 1.1 1.8 1.9
wcm.TRI.2 21.5 23.2 24.8 25.0 21.6 14.5 11.8 17.1 18.4 18.2 13.3 15.4 15.4 16.1 14.5 17.2 15.2 16.7 14.5 11.4 11.6 15.9 17.7 17.1 0.8 0.2
1.8 1.0 1.8 1.1 1.9 1.9
wcm.TRI.3 24.5 24.9 25.0 25.2 19.9 15.9 17.4 17.0 18.6 19.5 14.3 0.8 16.1 20.1 15.9 15.1 17.7 13.3 15.7 15.6 15.8 17.2 19.6 12.8 15.0 14.5 14.7
1.7 1.8 1.8 1.9 2.0
wcm.TRI.4 23.3 24.4 25.0 25.2 23.7 14.4 13.8 16.4 18.6 19.1 13.9 13.5 9.7 16.6 14.4 16.7 10.1 17.4 14.6 11.7 11.9 11.5 17.7 17.1 5.6 4.9 5.0 13.3
1.2 0.8 1.5 1.4
wcm.TRI.5 24.6 23.3 26.8 27.1 23.3 15.5 15.6 15.9 18.5 19.4 14.8 15.6 5.9 18.8 15.5 15.3 7.1 18.8 15.7 14.6 14.8 3.1 17.4 19.1 14.0 13.5 13.8 15.4 8.6
1.4 0.7 0.6
wcm.TRI.6 23.4 24.4 25.8 26.0 23.7 16.0 14.1 18.4 20.0 19.1 14.6 15.1 8.9 17.5 16.4 17.2 9.5 18.7 16.2 13.0 12.8 12.3 18.6 19.1 6.0 6.3 6.1 14.5 3.4 9.3
1.6 1.5
wcm.TRI.7 23.6 24.7 26.8 27.1 24.4 16.0 18.3 16.6 18.7 19.6 15.0 17.0 7.3 18.9 16.4 17.4 8.6 20.4 16.2 15.3 15.1 0.0 18.9 20.2 15.7 15.6 15.9 17.2 11.5 3.1 12.3
0.6
wcm.TRI.8 24.8 25.4 26.4 26.6 24.7 16.8 16.7 16.8 19.1 20.0 15.4 18.3 6.7 19.2 17.2 17.0 8.0 20.8 17.0 15.4 15.2 2.0 18.9 20.1 15.9 15.8 16.1 18.0 11.1 2.4 11.5 2.0

Table S4. The pair-wise Kimura 2-parameter (K2P) distances of the D2 region of the 28S rDNA sequences used in the study are
presented on the lower-left side of the table, and relevant standard error values (bootstrap=1,000) are presented on the upper-right. All
distances were calculated with MEGA5. The sample codes are explained in Table 1.
ah
ys.1
alo
n.1
wcm
.AEG
.1
wcm
.AG
R.1
wcm
.AR
R.1
wcm
.BR
O.1
wcm
.BR
O.2
wcm
.BR
O.3
wcm
.BR
O.4
wcm
.ELY
.1
wcm
.ER
E.1
wcm
.HO
R.1
wcm
.HO
R.2
wcm
.HO
R.4
wcm
.HO
R.5
wcm
.HO
R.7
wcm
.PO
A.1
wcm
.SEC
.1
wcm
.TR
I.1
wcm
.TR
I.2
wcm
.TR
I.3
wcm
.TR
I.5
wcm
.TR
I.6
wcm
.TR
I.7
ahys.1
0.91 1.83 1.65 1.62 1.59 1.88 1.85 1.59 2.22 1.70 1.65 1.61 1.62 1.65 1.62 1.85 1.70 1.66 1.62 1.65 1.61 1.86 1.61
alon.1 3.89
1.98 1.82 1.81 1.82 1.95 1.93 1.82 2.31 1.86 1.82 1.85 1.81 1.82 1.81 1.85 1.86 1.84 1.81 1.82 1.76 1.93 1.76
wcm.AEG.1 13.95 15.88
1.75 1.76 1.69 1.62 1.59 1.73 1.99 1.80 1.75 1.69 1.76 1.75 1.76 1.67 1.85 1.79 1.76 1.78 1.72 2.09 1.72
wcm.AGR.1 11.08 13.75 11.69
0.43 0.60 1.06 1.03 0.38 1.49 0.54 0.00 0.68 0.43 0.00 0.43 0.99 0.63 0.53 0.43 0.48 0.39 0.98 0.39
wcm.ARR.1 11.08 13.75 11.97 0.90
0.49 1.02 0.99 0.36 1.46 0.60 0.43 0.60 0.00 0.43 0.00 0.96 0.49 0.31 0.00 0.22 0.37 0.99 0.37
wcm.BRO.1 10.55 13.75 10.88 1.58 1.13
1.09 1.06 0.43 1.55 0.72 0.60 0.81 0.49 0.60 0.49 1.02 0.71 0.59 0.49 0.54 0.54 1.09 0.54
wcm.BRO.2 13.49 14.82 10.39 5.12 4.88 5.37
0.21 1.03 1.13 1.10 1.06 1.14 1.02 1.06 1.02 0.45 1.11 1.07 1.02 1.05 1.03 1.43 1.03
wcm.BRO.3 13.21 14.54 10.13 4.88 4.64 5.12 0.22
1.01 1.11 1.08 1.03 1.11 0.99 1.03 0.99 0.39 1.08 1.05 0.99 1.02 1.00 1.42 1.00
wcm.BRO.4 10.55 13.75 11.42 0.67 0.67 0.90 4.88 4.64
1.49 0.57 0.38 0.70 0.36 0.38 0.36 0.97 0.58 0.48 0.36 0.43 0.30 0.98 0.30
wcm.ELY.1 18.98 20.42 15.98 10.27 10.01 10.54 6.03 5.79 10.01
1.57 1.49 1.55 1.46 1.49 1.46 1.14 1.51 1.49 1.46 1.48 1.49 1.75 1.49
wcm.ERE.1 11.58 14.26 12.46 1.35 1.81 2.50 5.59 5.34 1.58 11.04
0.54 0.80 0.60 0.54 0.60 1.04 0.76 0.68 0.60 0.64 0.56 1.11 0.56
wcm.HOR.1 11.08 13.75 11.69 0.00 0.90 1.58 5.12 4.88 0.67 10.27 1.35
0.68 0.43 0.00 0.43 0.99 0.63 0.53 0.43 0.48 0.39 0.98 0.39
wcm.HOR.2 11.34 14.29 11.40 2.27 1.81 2.98 5.85 5.61 2.51 11.05 3.20 2.27
0.60 0.68 0.60 1.13 0.80 0.69 0.60 0.63 0.62 1.11 0.62
wcm.HOR.4 11.08 13.75 11.97 0.90 0.00 1.13 4.88 4.64 0.67 10.01 1.81 0.90 1.81
0.43 0.00 0.96 0.49 0.31 0.00 0.22 0.37 0.99 0.37
wcm.HOR.5 11.08 13.75 11.69 0.00 0.90 1.58 5.12 4.88 0.67 10.27 1.35 0.00 2.27 0.90
0.43 0.99 0.63 0.53 0.43 0.48 0.39 0.98 0.39
wcm.HOR.7 11.08 13.75 11.97 0.90 0.00 1.13 4.88 4.64 0.67 10.01 1.81 0.90 1.81 0.00 0.90
0.96 0.49 0.31 0.00 0.22 0.37 0.99 0.37
wcm.POA.1 13.21 13.98 10.93 4.64 4.39 4.88 0.90 0.67 4.39 6.03 5.10 4.64 5.85 4.39 4.64 4.39
1.04 1.02 0.96 0.98 0.97 1.38 0.97
wcm.SEC.1 11.60 14.29 13.01 2.04 1.12 2.27 5.83 5.59 1.81 11.04 2.96 2.04 2.96 1.12 2.04 1.12 5.34
0.57 0.49 0.53 0.59 1.07 0.59
wcm.TRI.1 11.60 14.29 12.50 1.35 0.45 1.58 5.36 5.11 1.12 10.27 2.26 1.35 2.27 0.45 1.35 0.45 4.87 1.58
0.31 0.38 0.50 1.04 0.50
wcm.TRI.2 11.08 13.75 11.97 0.90 0.00 1.13 4.88 4.64 0.67 10.01 1.81 0.90 1.81 0.00 0.90 0.00 4.39 1.12 0.45
0.22 0.37 0.99 0.37
wcm.TRI.3 11.34 14.01 12.22 1.12 0.22 1.35 5.11 4.87 0.90 10.27 2.03 1.12 2.04 0.22 1.12 0.22 4.63 1.35 0.67 0.22
0.43 1.01 0.43
wcm.TRI.5 10.82 13.20 11.42 0.67 0.67 1.35 4.88 4.64 0.45 10.01 1.58 0.67 2.04 0.67 0.67 0.67 4.39 1.81 1.12 0.67 0.90
0.92 0.00
wcm.TRI.6 14.24 15.93 15.44 4.60 4.60 5.32 8.80 8.55 4.36 12.87 5.55 4.60 6.05 4.60 4.60 4.60 8.29 5.56 5.08 4.60 4.84 3.89
0.92
wcm.TRI.7 10.82 13.20 11.42 0.67 0.67 1.35 4.88 4.64 0.45 10.01 1.58 0.67 2.04 0.67 0.67 0.67 4.39 1.81 1.12 0.67 0.90 0.00 3.89