Excellent growth in first quarter of 2010* Asia–Pacific, CEMAI (Central and Eastern Europe, Middle...
24
Media Release 1/11 Basel, 15 April 2010 Excellent growth in first quarter of 2010 • Group sales up 9% in local currencies to 12.2 billion Swiss francs in first three months (+6% in Swiss francs, +15% in US dollars). • Both divisions continue to outgrow their respective markets in 2010 1 . • Roche confirms full-year outlook. Sales in millions of CHF Three months ended 31 March % change 2010 2009 In CHF In LC* In USD Pharmaceuticals Division 9,727 9,216 +6 +10 +15 United States 3,647 3,586 +2 +10 +10 Western Europe 2,597 2,532 +3 +4 +11 Japan 988 1,139 -13 -9 -6 International** 2,495 1,959 +27 +25 +38 Diagnostics Division 2,518 2,361 +7 +9 +16 Roche Group 12,245 11,577 +6 +9 +15 *LC= local currencies **International: Asia–Pacific, CEMAI (Central and Eastern Europe, Middle East, Africa, Central Asia, Indian Subcontinent), Latin America, Canada, Others See appendix to this media release for details of quarterly sales growth Pharmaceuticals Division posts double-digit growth in first quarter • Pharma sales grow 10% (6% in Swiss francs, 15% in US dollars) • Continued strong growth of oncology portfolio, increasing 12% in local currencies; sales of leading cancer medication Avastin advance 18%. • Promising US launch of Actemra for rheumatoid arthritis • Rituxan approved in US for chronic lymphocytic leukemia, the most common form of adult leukemia • US marketing application for T–DM1 for advanced HER2-positive breast cancer to be brought forward to 2010, based on strong phase II results Diagnostics Division continues to significantly outperform the market • Divisional sales grow 9% (7% in Swiss francs, 16% in US dollars), again substantially ahead of the global market, driven by Professional Diagnostics, Diabetes Care and Applied Science • Continued strong uptake of recently launched products in Diabetes Care (Accu-Chek Mobile, Accu- Chek Combo) as well as other business areas (cobas 8000, cobas 4800 and xCELLigence systems) Barring unforeseen events. 1 Unless otherwise stated, all growth rates are in local currencies
-
Upload
hoangkhuong -
Category
Documents
-
view
213 -
download
0
Transcript of Excellent growth in first quarter of 2010* Asia–Pacific, CEMAI (Central and Eastern Europe, Middle...

Media Release
1/11
Basel, 15 April 2010
Excellent growth in first quarter of 2010
• Group sales up 9% in local currencies to 12.2 billion Swiss francs in first three months (+6% in Swiss francs, +15% in US dollars).
• Both divisions continue to outgrow their respective markets in 2010 1. • Roche confirms full-year outlook.
Sales in millions of CHF Three months ended
31 March % change
2010 2009 In CHF In LC* In USD Pharmaceuticals Division 9,727 9,216 +6 +10 +15 United States 3,647 3,586 +2 +10 +10 Western Europe 2,597 2,532 +3 +4 +11 Japan 988 1,139 -13 -9 -6 International** 2,495 1,959 +27 +25 +38 Diagnostics Division 2,518 2,361 +7 +9 +16 Roche Group 12,245 11,577 +6 +9 +15
*LC= local currencies **International: Asia–Pacific, CEMAI (Central and Eastern Europe, Middle East, Africa, Central Asia, Indian Subcontinent), Latin America, Canada, Others See appendix to this media release for details of quarterly sales growth Pharmaceuticals Division posts double-digit growth in first quarter • Pharma sales grow 10% (6% in Swiss francs, 15% in US dollars) • Continued strong growth of oncology portfolio, increasing 12% in local currencies; sales of leading
cancer medication Avastin advance 18%. • Promising US launch of Actemra for rheumatoid arthritis • Rituxan approved in US for chronic lymphocytic leukemia, the most common form of adult leukemia • US marketing application for T–DM1 for advanced HER2-positive breast cancer to be brought forward
to 2010, based on strong phase II results Diagnostics Division continues to significantly outperform the market • Divisional sales grow 9% (7% in Swiss francs, 16% in US dollars), again substantially ahead of the global
market, driven by Professional Diagnostics, Diabetes Care and Applied Science • Continued strong uptake of recently launched products in Diabetes Care (Accu-Chek Mobile, Accu-
Chek Combo) as well as other business areas (cobas 8000, cobas 4800 and xCELLigence systems)
Barring unforeseen events. 1 Unless otherwise stated, all growth rates are in local currencies

2/11
Commenting on the Group’s first-quarter sales figures, Roche CEO Severin Schwan said: ‘With sales
advancing 9%, Roche is off to a very good start in 2010. Both divisions continued to outgrow their respective
markets. We are thus fully on track for 2010.’ Referring to Roche’s strong late-stage pipeline, Schwan added:
‘I am very pleased that, after discussions with the FDA, we are now planning to submit a US marketing
application for our innovative breast cancer treatment T–DM1 this year, based on strong phase II data in
women who have not responded to prior treatments.’
Roche Group
Strong sales growth in first quarter
The Roche Group sustained its strong sales growth in the first three months of 2010. Group sales grew 9% in
local currencies (6% in Swiss francs; 15% in US dollars) to 12.2 billion Swiss francs. The Pharmaceuticals
Division’s sales increased 10% in local currencies (6% in Swiss francs; 15% in US dollars) to 9.7 billion Swiss
francs, maintaining its above-market growth. The Diagnostics Division also maintained its above-market
growth, with sales increasing 9% in local currencies (7% in Swiss francs; 16% in US dollars) to 2.5 billion
Swiss francs.
At its Investor Day in March, Roche provided an in-depth review of its near- and long-term growth
opportunities. Roche plans to introduce at least six new medicines by the end 2014. Of the 61 new molecular
entities (NMEs) in the Group’s R&D pipeline, ten are currently in late-stage development, and Roche plans
to increase this to as many as 13 NMEs by year end. The Group’s late-stage pipeline also comprises more than
35 new indications for existing products. Roche is set to strengthen its global leadership position in oncology
and to expand in therapeutic areas such as metabolism, inflammation and diseases of the central nervous
system.
In the first quarter Roche continued to pay down the debt raised to finance the Genentech transaction:
3 billion US dollars and 1.5 billion Euros were repaid as scheduled.
Outlook
Based on its first-quarter sales, Roche confirms its full-year outlook for 2010. Barring unforeseen events,
Roche expects sales in 2010 for the Pharmaceuticals Division and for the Group to increase in the mid-single-
digit range in local currencies (excluding Tamiflu). In the Diagnostics Division, full-year sales are expected to
grow significantly ahead of the market. Despite an anticipated decrease in Tamiflu sales from 3.2 to
3/11
1.2 billion Swiss Francs, Roche is aiming to achieve double-digit Core Earnings per Share growth at constant
exchange rates. In addition, by the end of the year Roche expects to have repaid a quarter of the debt raised to
finance the Genentech transaction.
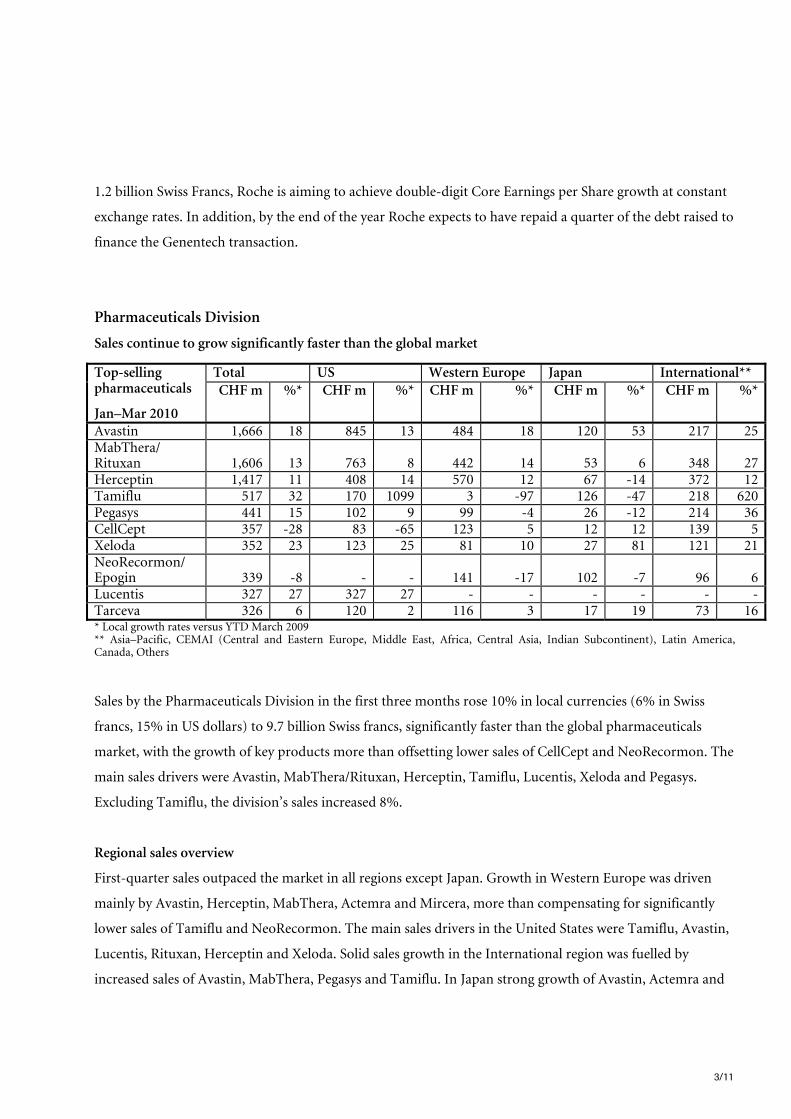
Pharmaceuticals Division
Sales continue to grow significantly faster than the global market
* Local growth rates versus YTD March 2009 ** Asia–Pacific, CEMAI (Central and Eastern Europe, Middle East, Africa, Central Asia, Indian Subcontinent), Latin America, Canada, Others
Sales by the Pharmaceuticals Division in the first three months rose 10% in local currencies (6% in Swiss
francs, 15% in US dollars) to 9.7 billion Swiss francs, significantly faster than the global pharmaceuticals
market, with the growth of key products more than offsetting lower sales of CellCept and NeoRecormon. The
main sales drivers were Avastin, MabThera/Rituxan, Herceptin, Tamiflu, Lucentis, Xeloda and Pegasys.
Excluding Tamiflu, the division’s sales increased 8%.
Regional sales overview
First-quarter sales outpaced the market in all regions except Japan. Growth in Western Europe was driven
mainly by Avastin, Herceptin, MabThera, Actemra and Mircera, more than compensating for significantly
lower sales of Tamiflu and NeoRecormon. The main sales drivers in the United States were Tamiflu, Avastin,
Lucentis, Rituxan, Herceptin and Xeloda. Solid sales growth in the International region was fuelled by
increased sales of Avastin, MabThera, Pegasys and Tamiflu. In Japan strong growth of Avastin, Actemra and
Total US Western Europe Japan International** Top-selling pharmaceuticals
Jan–Mar 2010
CHF m %* CHF m %* CHF m %* CHF m %* CHF m %*
Avastin 1,666 18 845 13 484 18 120 53 217 25 MabThera/ Rituxan 1,606 13 763 8 442 14 53 6 348 27 Herceptin 1,417 11 408 14 570 12 67 -14 372 12 Tamiflu 517 32 170 1099 3 -97 126 -47 218 620 Pegasys 441 15 102 9 99 -4 26 -12 214 36 CellCept 357 -28 83 -65 123 5 12 12 139 5 Xeloda 352 23 123 25 81 10 27 81 121 21 NeoRecormon/ Epogin 339 -8 - - 141 -17 102 -7 96 6 Lucentis 327 27 327 27 - - - - - - Tarceva 326 6 120 2 116 3 17 19 73 16
4/11
Xeloda was outweighed by a significant decline in sales of Tamiflu and destocking by wholesalers in
anticipation of revised National Health Insurance reimbursement prices, which come into effect in April.
Sales review — selected key products
Sales of Avastin (bevacizumab), for advanced colorectal, breast, lung and kidney cancer, and for relapsed
glioblastoma (a type of brain tumour), rose 18% to 1.7 billion Swiss francs. Sustained growth in all regions
continued to be driven by uptake in colorectal, breast and/or lung cancer, the product’s largest indications.
Apart from the US, where penetration rates are already high, patient share in all three indications continues
to grow strongly. Sales by Chugai in Japan remain particularly strong, driven by sustained growth in
colorectal cancer and helped further by the product’s launch for the treatment of non-small cell lung cancer
in November.
Overall sales (oncology and autoimmune diseases) of MabThera/Rituxan (rituximab), for non-Hodgkin’s
lymphoma (NHL), chronic lymphocytic leukemia (CLL) and rheumatoid arthritis (RA), rose 13% to
1.6 billion Swiss francs. Sustained growth in the oncology segment was driven by strong uptake in CLL
worldwide, as well as continued penetration in NHL in countries of the International region. Sales growth in
the rheumatoid arthritis segment was driven primarily by increased use of MabThera/Rituxan in patients
with an inadequate response to one or more tumour necrosis factor inhibitors.
Global sales of Herceptin (trastuzumab), for HER2-positive breast cancer, advanced 11% to 1.4 billion Swiss
francs in the first quarter. Growth was driven by continuing penetration in the early and metastatic disease
settings. Sales are expected to be helped further by the rollout of Herceptin in the newly approved stomach
cancer indication in the EU.
The robust sales performance of Xeloda (capecitabine), for colorectal, stomach and breast cancer, which grew
23% to 352 million Swiss francs, was driven primarily by strong gains in the United States, China and Japan.
Growth in China is being fuelled mainly by use of the medicine in advanced stomach cancer, while sales in
Japan continued to benefit from an expanded metastatic colorectal cancer indication approved in 2009.
Sales of Tarceva (erlotinib), for advanced lung and pancreatic cancer, increased 6% to 326 million Swiss
francs in the first quarter, driven primarily by strong growth in the International region. Solid double-digit
sales growth in Japan reflects continuing market penetration.
5/11
First-quarter sales of the antiinfluenza medicine Tamiflu (oseltamivir) totalled 517 million Swiss francs, a rise
of 32% over the relatively low baseline of the prior-year period (401 million francs). Following the
exceptional demand seen in the last three quarters of 2009 due to the worldwide influenza A (H1N1)
pandemic, global sales of Tamiflu have slowed significantly since December. Roche has now filled the bulk of
government pandemic orders received in 2009 and early 2010. In addition, according to the latest World
Health Organization and US Centers for Disease Control updates, the current wave of the H1N1 pandemic
has passed its peak in Europe and North America. Barring unforeseen events, Roche expects full-year sales of
Tamiflu of about 1.2 billion Swiss francs in 2010.
Sales of Pegasys (peginterferon alfa-2a), for hepatitis B and C, rose 15% to 441 million Swiss francs. Growth
is being driven by market expansion in emerging countries and increasing market share globally. Pegasys is
benefiting from the publication of new studies demonstrating the medicine’s superiority over other hepatitis
C treatment options, as well as increased use in hepatitis B.
US sales of Lucentis (ranibizumab), for wet age-related macular degeneration (AMD), were up 27%
compared with the first quarter of 2009 to 327 million Swiss francs. Robust growth throughout the quarter
was driven primarily by an increase in the total number of patients receiving Lucentis.
Sales of the novel rheumatoid arthritis (RA) medicine RoActemra (tocilizumab, known as Actemra outside
Europe) continued to develop very well in the first quarter of 2010, supported by further growth in the 2009
launch markets and by the ongoing rollout in additional countries, notably the US and France. Global sales
totalled 66 million Swiss francs in the first quarter, an increase of 236% over the year-earlier period. In the
US, where Actemra has been available since mid-January, the initial response from physicians and patients
has been very encouraging. Market uptake in Japan also remained strong. Here and in other markets where
this indication is approved, doctors are already using the medicine as a first-line biologic treatment in many
RA patients.
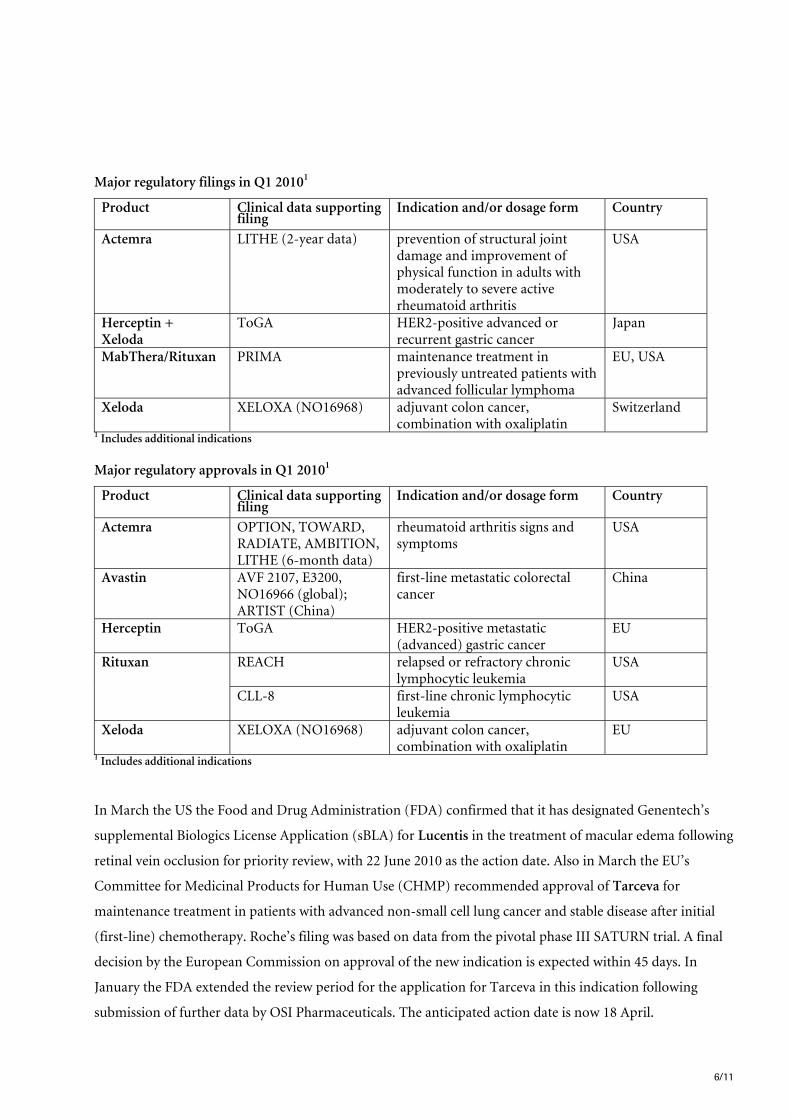
Product development highlights
The major regulatory approvals gained and important marketing applications filed by the Pharmaceuticals
Division in the first quarter of 2010 are summarised in the tables below.
6/11
Major regulatory filings in Q1 20101
Product Clinical data supporting filing
Indication and/or dosage form Country
Actemra LITHE (2-year data) prevention of structural joint damage and improvement of physical function in adults with moderately to severe active rheumatoid arthritis
USA
Herceptin + Xeloda
ToGA HER2-positive advanced or recurrent gastric cancer
Japan
MabThera/Rituxan PRIMA maintenance treatment in previously untreated patients with advanced follicular lymphoma
EU, USA
Xeloda XELOXA (NO16968) adjuvant colon cancer, combination with oxaliplatin
Switzerland
1 Includes additional indications
Major regulatory approvals in Q1 20101
Product Clinical data supporting filing
Indication and/or dosage form Country
Actemra OPTION, TOWARD, RADIATE, AMBITION, LITHE (6-month data)
rheumatoid arthritis signs and symptoms
USA
Avastin AVF 2107, E3200, NO16966 (global); ARTIST (China)
first-line metastatic colorectal cancer
China
Herceptin ToGA HER2-positive metastatic (advanced) gastric cancer
EU
REACH relapsed or refractory chronic lymphocytic leukemia
USA Rituxan
CLL-8 first-line chronic lymphocytic leukemia
USA
Xeloda XELOXA (NO16968) adjuvant colon cancer, combination with oxaliplatin
EU
1 Includes additional indications
In March the US the Food and Drug Administration (FDA) confirmed that it has designated Genentech’s
supplemental Biologics License Application (sBLA) for Lucentis in the treatment of macular edema following
retinal vein occlusion for priority review, with 22 June 2010 as the action date. Also in March the EU’s
Committee for Medicinal Products for Human Use (CHMP) recommended approval of Tarceva for
maintenance treatment in patients with advanced non-small cell lung cancer and stable disease after initial
(first-line) chemotherapy. Roche’s filing was based on data from the pivotal phase III SATURN trial. A final
decision by the European Commission on approval of the new indication is expected within 45 days. In
January the FDA extended the review period for the application for Tarceva in this indication following
submission of further data by OSI Pharmaceuticals. The anticipated action date is now 18 April.
7/11
Following discussions with the FDA, Genentech now plans to submit a US marketing application in 2010 for
the novel antibody–drug conjugate T–DM1 (RG3502). The application, for approval of T–DM1 for patients
with advanced metastatic HER2-positive breast cancer, will be based on the positive phase II data presented
at the San Antonio Breast Cancer Symposium last December.
Roche announced initial results from phase III clinical trials with Avastin in ovarian, gastric and prostate
cancer during the first quarter. The results of the GOG 0218 study showed that combined Avastin and
chemotherapy followed by maintenance treatment with Avastin alone increased the time women with
advanced ovarian cancer lived without their disease worsening (progression-free survival), compared with
chemotherapy alone. The AVAGAST (gastric cancer) and CALGB 90401 (prostate cancer) trials did not meet
their primary endpoints of extending overall survival. Data from all three studies have been submitted for
presentation at the American Society of Clinical Oncology (ASCO) annual meeting in June.
As already announced, in March Roche and Biogen Idec decided to suspend administration of ocrelizumab
to patients in the rheumatoid arthritis programme. This followed a recommendation by the RA and lupus
programme’s independent data and safety monitoring board, which concluded that the safety risk outweighs
the benefits observed in RA and lupus patient populations at this time. A phase II trial with ocrelizumab in
relapsing remitting multiple sclerosis is continuing.
R&D pipeline update
As of 31 March 2010 the Pharmaceuticals Division’s research and development pipeline (phase I to
III/registration) included 61 new molecular entities and 49 additional indications. In the first quarter of 2010
three projects entered phase I, one entered phase II and two (RG7204, aleglitazar) entered phase III
development. One phase II project was discontinued. Full details of the Group’s pharmaceutical R&D
pipeline are available at roche.com.

8/11
Diagnostics Division
Sales continue to significantly outgrow the market
Sales January–March 2010
In millions of CHF
% change in CHF
% change in local currencies
As % of sales
Diagnostics Divsion 2,518 7 9 100 - Professional Diagnostics 1,170 8 9 46 - Diabetes Care 708 4 6 28 - Molecular Diagnostics 294 0 2 12 - Applied Science 226 15 19 9 - Tissue Diagnostics 120 13 21 5
Roche’s Diagnostics Division recorded first-quarter sales of 2,518 million Swiss francs, an increase of 9% in
local currencies (7% in Swiss francs). This was substantially ahead of the global market . All five business
areas increased their sales in local currencies, with Professional Diagnostics, Diabetes Care and Applied
Science the biggest contributors to growth. Strong uptake of the recently launched Accu-Chek Mobile (strip-
free blood glucose monitoring system), Accu-Chek Combo (combined insulin pump/blood glucose
monitoring system), cobas 8000 (fully automated high-throughput analyser), cobas 4800 (fully automated
system for molecular diagnostics) and xCELLigence (cell analysis system) continued, combined with rollouts
in additional European and Asia–Pacific markets during the first quarter. Sales grew ahead of the market in
all regions: Asia–Pacific and Latin American countries continued their excellent sales development, with
growth in the E7 emerging markets (Brazil, Russia, India, China, Korea, Mexico and Turkey) reaching 25%,
led by China.
Professional Diagnostics’ first-quarter sales rose 9% to 1,170 million Swiss francs. The immunoassay
business again outpaced the market with sales growth of 16%. New placements of cobas 6000 and recent
additions to the immunoassay menu were key growth drivers. The successful rollout of the cobas 8000
modular analyser continued in the EU and Asia–Pacific. Professional Diagnostics launched three new or
next-generation immunoassays: in the EU and other markets that recognise CE Mark certification a
pregnancy test for free �-HCG and PAPP-A to evaluate the risk of trisomy 21 (Down syndrome), and in the
US market the accelerated (STAT) NT-proBNP test for the risk of heart failure and the Rubella IgM test to
diagnose rubella infection in women. Sales of decentralised solutions rose 5%, led by strong demand for
portable testing systems such as the CoaguChek coagulation monitors. The CoaguChek XS plus system, a
point-of-care anticoagulation monitor, was granted CLIA-waived status by the FDA, allowing its use in a
broader range of clinical settings.

9/11
Diabetes Care’s combined sales of blood glucose (BG) monitoring systems and insulin pumps rose 6%,
significantly ahead of global diabetes market, to 708 million Swiss francs. The main growth drivers were the
Accu-Chek Aviva and Accu-Chek Performa BG monitoring systems, both of which posted strong double-
digit sales growth. Market uptake of the newly launched Accu-Chek Mobile, the first and only strip-free BG
monitoring system, has been excellent, with the product now available in twelve countries in Europe and
Asia–Pacific. Sales of the insulin delivery business posted double digit growth, driven by continued strong
uptake of the new Accu-Chek Combo, a combination of insulin pump and BG monitoring system, which was
launched in another seven European and Asia–Pacific markets during the first quarter. As announced in
April, Roche will acquire 100% of Medingo Ltd., a majority-owned subsidiary of the Elron group engaged in
the development of a semi-disposable insulin patch pump. Through the acquisition Diabetes Care will
broaden its portfolio of innovative insulin delivery technologies.
Molecular Diagnostics posted sales of 294 million Swiss francs (2%) in the first quarter. The slight decline in
virology, which showed a very strong performance in the first quarter of 2009 due to non-recurring
instrument sales in Asia–Pacific, was more than offset by substantial growth in blood screening (8%), based
on the addition of new customers. Initial uptake in key markets of the cobas 4800 system, launched at the end
of 2009, has been very encouraging. This system offers full automation for mid- to high-throughput testing
with a current menu of dual target tests for Chlamydia trachomatis and Neisseria gonorrhoeae and a screening
and genotyping test for human papillomavirus (HPV). Preliminary data from the ATHENA trial were
released in February, demonstrating the clinical utility of HPV genotyping in cervical cancer screening. Full
data from the ATHENA trial with the cobas 4800 HPV test will be presented in July, with a US filing planned
for mid year.
Applied Science’s first-quarter sales rose 19% to 226 million Swiss francs, driven by strong demand for the
MagNA Pure and LightCycler product lines for sample preparation and quantitative PCR analysis (39%),
particularly in China. The microarray business grew by almost 40%, with the NimbleGen CGX-6 cytogenetics
multiplex array for high-resolution analysis of chromosomal abnormalities launched worldwide, as planned.
Strong growth in the cell analysis segment is being driven by CIM-Plate 16, launched at the end of 2009,
which enables the study of cell migration and invasion in real time and opens up new application fields for
the xCELLigence cell analysis system.
Tissue Diagnostics recorded first-quarter sales of 120 million Swiss francs, up 21%, outperforming the
market in all key regions. Advanced tissue staining – immunohistochemistry (IHC) and in situ hybridisation

10/11
(ISH) – continued to be the main growth driver, reflecting a robust 17% rise in IHC and 73% rise in ISH
reagent sales, along with continued excellent uptake of the BenchMark Ultra system for simultaneous IHC
and ISH testing on a single platform. Tissue Diagnostics further expanded its advanced staining portfolio
with the US launch of Discovery ULTRA, an automated platform for IHC and ISH in the research setting that
offers significant improvements in ease of use, workflow and system flexibility.
About Roche
Headquartered in Basel, Switzerland, Roche is a leader in research-focused healthcare with combined
strengths in pharmaceuticals and diagnostics. Roche is the world’s largest biotech company with truly
differentiated medicines in oncology, virology, inflammation, metabolism and CNS. Roche is also the world
leader in in-vitro diagnostics, tissue-based cancer diagnostics and a pioneer in diabetes management. Roche’s
personalised healthcare strategy aims at providing medicines and diagnostic tools that enable tangible
improvements in the health, quality of life and survival of patients. In 2009, Roche had over 80,000
employees worldwide and invested almost 10 billion Swiss francs in R&D. The Group posted sales of 49.1
billion Swiss francs. Genentech, United States, is a wholly owned member of the Roche Group. Roche has a
majority stake in Chugai Pharmaceutical, Japan. For more information: www.roche.com.
All trademarks used or mentioned in this release are protected by law.
Additional information
- Media release including a full set of tables: www.roche.com//med-cor-2010-04-15
- Annual Report 2009: www.roche.com/annual_reports.htm
- Roche Pharmaceuticals pipeline: www.roche.com/pipeline.htm
- Roche Finance Info System: rofis.roche.com/dynasight/rofis.html
Next events
- Half-year results 2010: 22 July 2010 (tentative date)
Roche Group Media Relations
Phone: +41 -61 688 8888 / e-mail: [email protected]
- Alexander Klauser
- Martina Rupp
11/11
- Claudia Schmitt
- Nina Schwab-Hautzinger Disclaimer: Cautionary statement regarding forward-looking statements This document contains certain forward-looking statements. These forward-looking statements may be identified by words such as ‘believes’, ‘expects’, ‘anticipates’, ‘projects’, ‘intends’, ‘should’, ‘seeks’, ‘estimates’, ‘future’ or similar expressions or by discussion of, among other things, strategy, goals, plans or intentions. Various factors may cause actual results to differ materially in the future from those reflected in forward-looking statements contained in this document, among others: (1) pricing and product initiatives of competitors; (2) legislative and regulatory developments and economic conditions; (3) delay or inability in obtaining regulatory approvals or bringing products to market; (4) fluctuations in currency exchange rates and general financial market conditions; (5) uncertainties in the discovery, development or marketing of new products or new uses of existing products, including without limitation negative results of clinical trials or research projects, unexpected side-effects of pipeline or marketed products; (6) increased government pricing pressures; (7) interruptions in production; (8) loss of or inability to obtain adequate protection for intellectual property rights; (9) litigation; (10) loss of key executives or other employees; and (11) adverse publicity and news coverage. The statement regarding earnings per share growth is not a profit forecast and should not be interpreted to mean that Roche’s earnings or earnings per share for any current or future period will necessarily match or exceed the historical published earnings or earnings per share of Roche.
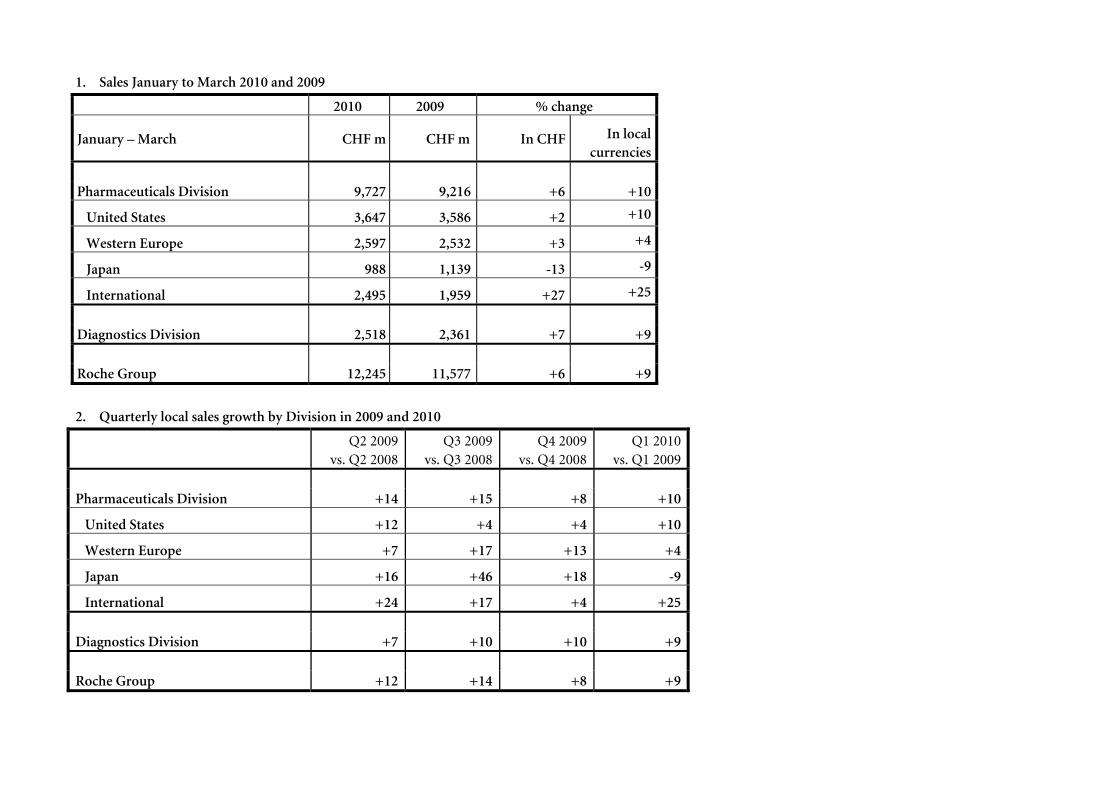
1. Sales January to March 2010 and 2009
2010 2009 % change
January – March CHF m CHF m In CHF In local currencies
Pharmaceuticals Division 9,727 9,216 +6 +10
United States 3,647 3,586 +2 +10
Western Europe 2,597 2,532 +3 +4
Japan 988 1,139 -13 -9
International 2,495 1,959 +27 +25
Diagnostics Division 2,518 2,361 +7 +9
Roche Group 12,245 11,577 +6 +9
2. Quarterly local sales growth by Division in 2009 and 2010
Q2 2009 vs. Q2 2008
Q3 2009 vs. Q3 2008
Q4 2009 vs. Q4 2008
Q1 2010 vs. Q1 2009
Pharmaceuticals Division +14 +15 +8 +10
United States +12 +4 +4 +10
Western Europe +7 +17 +13 +4
Japan +16 +46 +18 -9
International +24 +17 +4 +25
Diagnostics Division +7 +10 +10 +9
Roche Group +12 +14 +8 +9
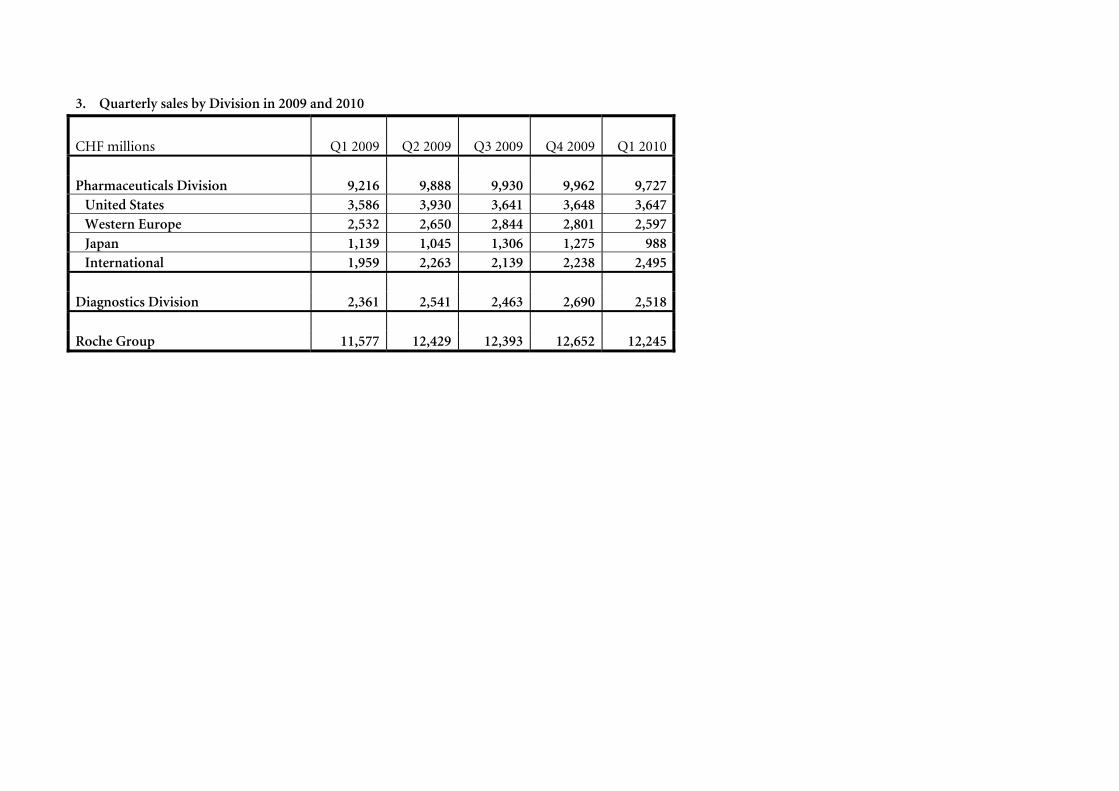
3. Quarterly sales by Division in 2009 and 2010
CHF millions
Q1 2009
Q2 2009
Q3 2009
Q4 2009
Q1 2010
Pharmaceuticals Division 9,216 9,888 9,930 9,962 9,727
United States 3,586 3,930 3,641 3,648 3,647 Western Europe 2,532 2,650 2,844 2,801 2,597 Japan 1,139 1,045 1,306 1,275 988 International 1,959 2,263 2,139 2,238 2,495
Diagnostics Division 2,361 2,541 2,463 2,690 2,518
Roche Group 11,577 12,429 12,393 12,652 12,245

1. Top 20 Pharmaceuticals Division product sales and local growth YTD March 2010 vs. YTD March 2009: US, Western Europe, Japan and International
Total United States Western Europe Japan International
CHF m % CHF m % CHF m % CHF m % CHF m %
Avastin 1,666 18% 845 13% 484 18% 120 53% 217 25%
MabThera/Rituxan 1,606 13% 763 8% 442 14% 53 6% 348 27%
Herceptin 1,417 11% 408 14% 570 12% 67 -14% 372 12%
Tamiflu 517 32% 170 1099% 3 -97% 126 -47% 218 620%
Pegasys 441 15% 102 9% 99 -4% 26 -12% 214 36%
CellCept 357 -28% 83 -65% 123 5% 12 12% 139 5%
Xeloda 352 23% 123 25% 81 10% 27 81% 121 21%
NeoRecormon/Epogin 339 -8% - - 141 -17% 102 -7% 96 6%
Lucentis 327 27% 327 27% - - - - - -
Tarceva 326 6% 120 2% 116 3% 17 19% 73 16%
Bonviva/Boniva 277 17% 144 14% 79 12% - - 54 33%
Valcyte/Cymevene 149 18% 70 28% 46 19% - - 33 -1%
Xolair 148 5% 148 5% - - - - - -
Pulmozyme 135 17% 75 9% 30 5% - - 30 78%
Activase/TNKase 110 -6% 100 -5% - - - - 10 -24%
Xenical 91 -11% 10 26% 44 5% - - 37 -30%
Nutropin 91 -6% 88 -6% - - - - 3 -3%
Rocephin 82 10% 2 2325% 16 -6% 13 -13% 51 20%
Neutrogin 81 -5% - - - - 81 -5% - -
Madopar 75 8% - - 27 -5% 5 0% 43 20%

2. Top 20 Pharmaceuticals Division quarterly local product sales growth
Q2 2009
vs. Q2 2008
Q3 2009
vs. Q3 2008
Q4 2009
vs. Q4 2008
Q1 2010
vs. Q1 2009
Avastin 29% 21% 9% 18%
MabThera/Rituxan 10% 7% 0% 13%
Herceptin 10% 8% 2% 11%
Tamiflu 1048% 887% 620% 32%
Pegasys 10% 13% -11% 15%
CellCept -21% -26% -45% -28%
Xeloda 14% 11% -2% 23%
NeoRecormon/Epogin -8% -7% -15% -8%
Lucentis 21% 21% 34% 27%
Tarceva 7% 11% 10% 6%
Bonviva/Boniva 2% 0% -10% 17%
Valcyte/Cymevene 6% 7% 1% 18%
Xolair 11% 9% 8% 5%
Pulmozyme 8% 8% -1% 17%
Activase/TNKase 17% 34% 39% -6%
Xenical -10% -14% -15% -11%
Nutropin 2% -6% -9% -6%
Rocephin 2% -2% -19% 10%
Neutrogin -13% -10% -12% -5%
Madopar -5% 1% -4% 8%
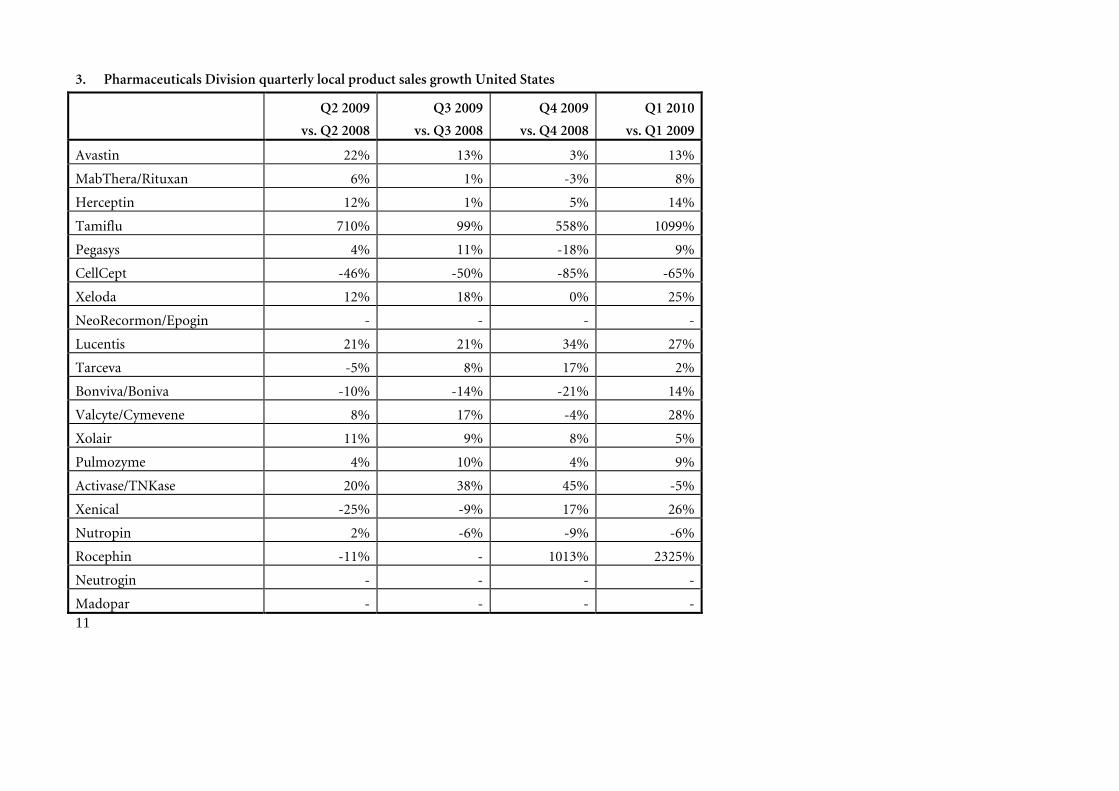
3. Pharmaceuticals Division quarterly local product sales growth United States
Q2 2009
vs. Q2 2008
Q3 2009
vs. Q3 2008
Q4 2009
vs. Q4 2008
Q1 2010
vs. Q1 2009
Avastin 22% 13% 3% 13%
MabThera/Rituxan 6% 1% -3% 8%
Herceptin 12% 1% 5% 14%
Tamiflu 710% 99% 558% 1099%
Pegasys 4% 11% -18% 9%
CellCept -46% -50% -85% -65%
Xeloda 12% 18% 0% 25%
NeoRecormon/Epogin - - - -
Lucentis 21% 21% 34% 27%
Tarceva -5% 8% 17% 2%
Bonviva/Boniva -10% -14% -21% 14%
Valcyte/Cymevene 8% 17% -4% 28%
Xolair 11% 9% 8% 5%
Pulmozyme 4% 10% 4% 9%
Activase/TNKase 20% 38% 45% -5%
Xenical -25% -9% 17% 26%
Nutropin 2% -6% -9% -6%
Rocephin -11% - 1013% 2325%
Neutrogin - - - -
Madopar - - - - 11
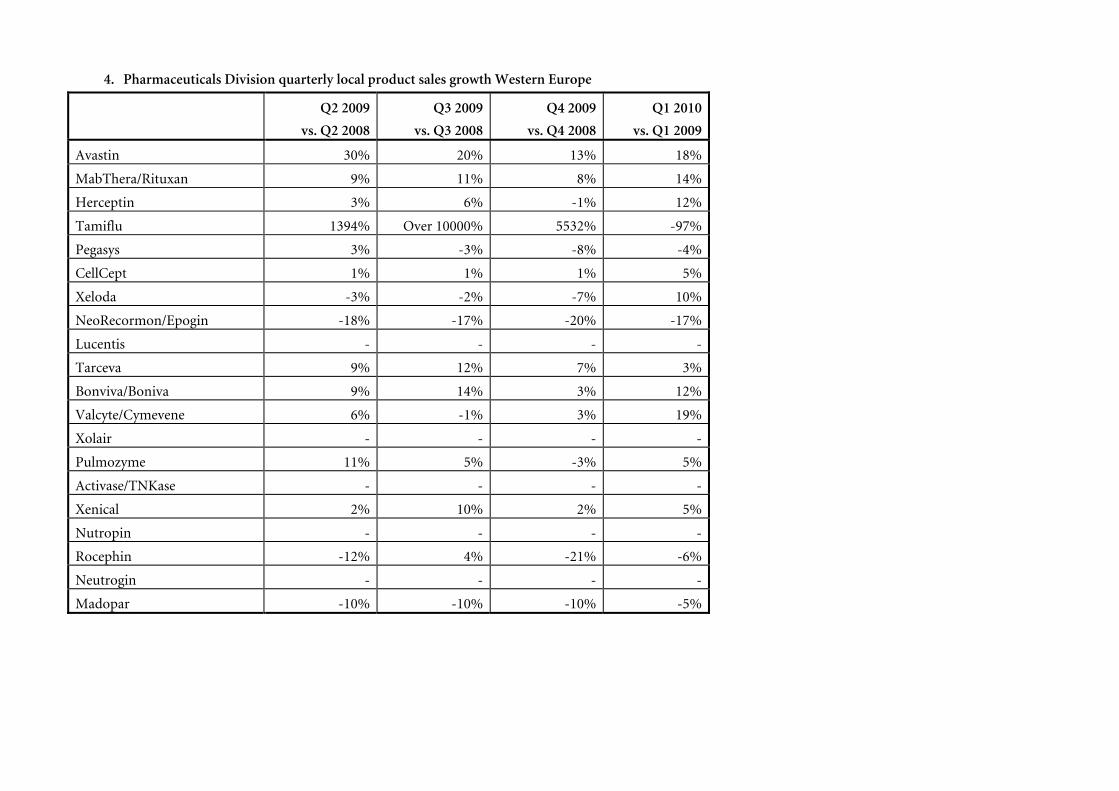
4. Pharmaceuticals Division quarterly local product sales growth Western Europe
Q2 2009
vs. Q2 2008
Q3 2009
vs. Q3 2008
Q4 2009
vs. Q4 2008
Q1 2010
vs. Q1 2009
Avastin 30% 20% 13% 18%
MabThera/Rituxan 9% 11% 8% 14%
Herceptin 3% 6% -1% 12%
Tamiflu 1394% Over 10000% 5532% -97%
Pegasys 3% -3% -8% -4%
CellCept 1% 1% 1% 5%
Xeloda -3% -2% -7% 10%
NeoRecormon/Epogin -18% -17% -20% -17%
Lucentis - - - -
Tarceva 9% 12% 7% 3%
Bonviva/Boniva 9% 14% 3% 12%
Valcyte/Cymevene 6% -1% 3% 19%
Xolair - - - -
Pulmozyme 11% 5% -3% 5%
Activase/TNKase - - - -
Xenical 2% 10% 2% 5%
Nutropin - - - -
Rocephin -12% 4% -21% -6%
Neutrogin - - - -
Madopar -10% -10% -10% -5%
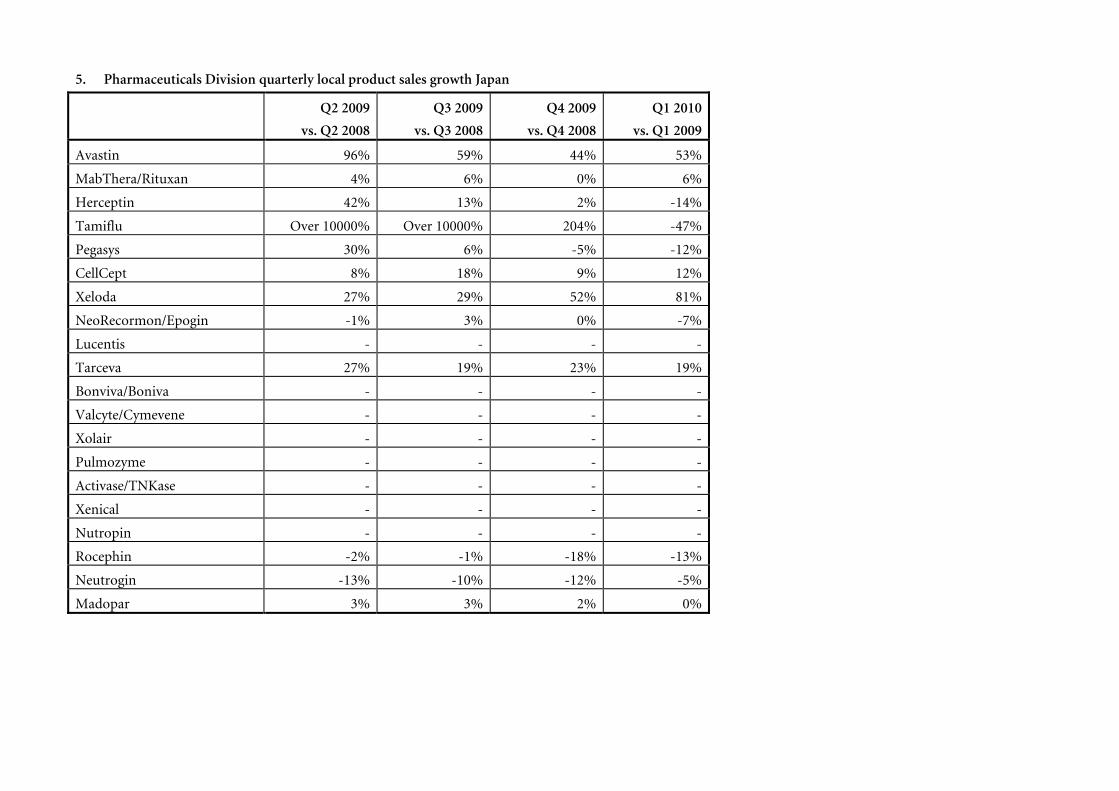
5. Pharmaceuticals Division quarterly local product sales growth Japan
Q2 2009
vs. Q2 2008
Q3 2009
vs. Q3 2008
Q4 2009
vs. Q4 2008
Q1 2010
vs. Q1 2009
Avastin 96% 59% 44% 53%
MabThera/Rituxan 4% 6% 0% 6%
Herceptin 42% 13% 2% -14%
Tamiflu Over 10000% Over 10000% 204% -47%
Pegasys 30% 6% -5% -12%
CellCept 8% 18% 9% 12%
Xeloda 27% 29% 52% 81%
NeoRecormon/Epogin -1% 3% 0% -7%
Lucentis - - - -
Tarceva 27% 19% 23% 19%
Bonviva/Boniva - - - -
Valcyte/Cymevene - - - -
Xolair - - - -
Pulmozyme - - - -
Activase/TNKase - - - -
Xenical - - - -
Nutropin - - - -
Rocephin -2% -1% -18% -13%
Neutrogin -13% -10% -12% -5%
Madopar 3% 3% 2% 0%
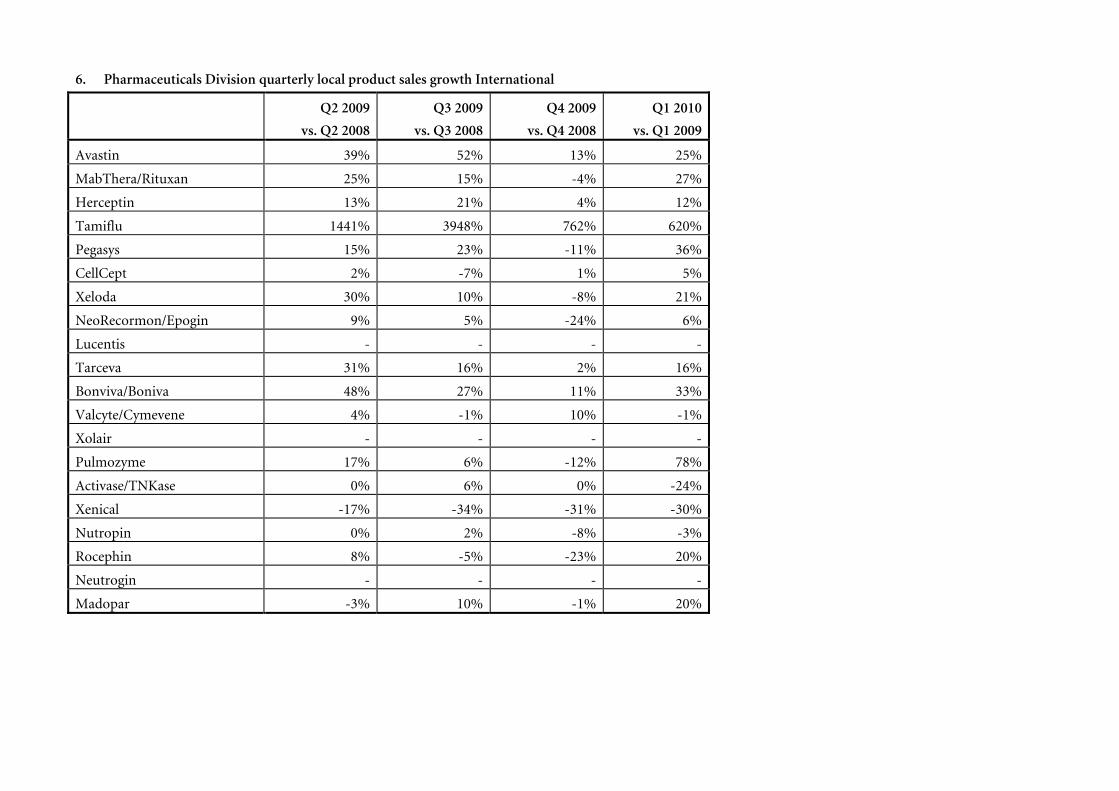
6. Pharmaceuticals Division quarterly local product sales growth International
Q2 2009
vs. Q2 2008
Q3 2009
vs. Q3 2008
Q4 2009
vs. Q4 2008
Q1 2010
vs. Q1 2009
Avastin 39% 52% 13% 25%
MabThera/Rituxan 25% 15% -4% 27%
Herceptin 13% 21% 4% 12%
Tamiflu 1441% 3948% 762% 620%
Pegasys 15% 23% -11% 36%
CellCept 2% -7% 1% 5%
Xeloda 30% 10% -8% 21%
NeoRecormon/Epogin 9% 5% -24% 6%
Lucentis - - - -
Tarceva 31% 16% 2% 16%
Bonviva/Boniva 48% 27% 11% 33%
Valcyte/Cymevene 4% -1% 10% -1%
Xolair - - - -
Pulmozyme 17% 6% -12% 78%
Activase/TNKase 0% 6% 0% -24%
Xenical -17% -34% -31% -30%
Nutropin 0% 2% -8% -3%
Rocephin 8% -5% -23% 20%
Neutrogin - - - -
Madopar -3% 10% -1% 20%

7. Top 20 Pharmaceuticals Division quarterly product sales
CHF millions
Q1 2009
Q2 2009
Q3 2009
Q4 2009
Q1 2010
Avastin 1,485 1,605 1,594 1,538 1,666
MabThera/Rituxan 1,481 1,617 1,508 1,481 1,606
Herceptin 1,307 1,338 1,327 1,294 1,417
Tamiflu 401 609 994 1,196 517
Pegasys 393 449 438 375 441
CellCept 517 410 362 287 357
Xeloda 296 330 326 308 352
NeoRecormon/Epogin 378 411 391 380 339
Lucentis 279 294 296 329 327
Tarceva 320 323 319 342 326
Bonviva/Boniva 249 276 255 278 277
Valcyte/Cymevene 131 143 148 142 149
Xolair 152 161 157 150 148
Pulmozyme 120 128 125 128 135
Activase/TNKase 126 100 107 122 110
Xenical 103 106 98 90 91
Nutropin 104 107 100 89 91
Rocephin 77 87 73 70 82
Neutrogin 90 98 101 96 81
Madopar 68 72 71 75 75
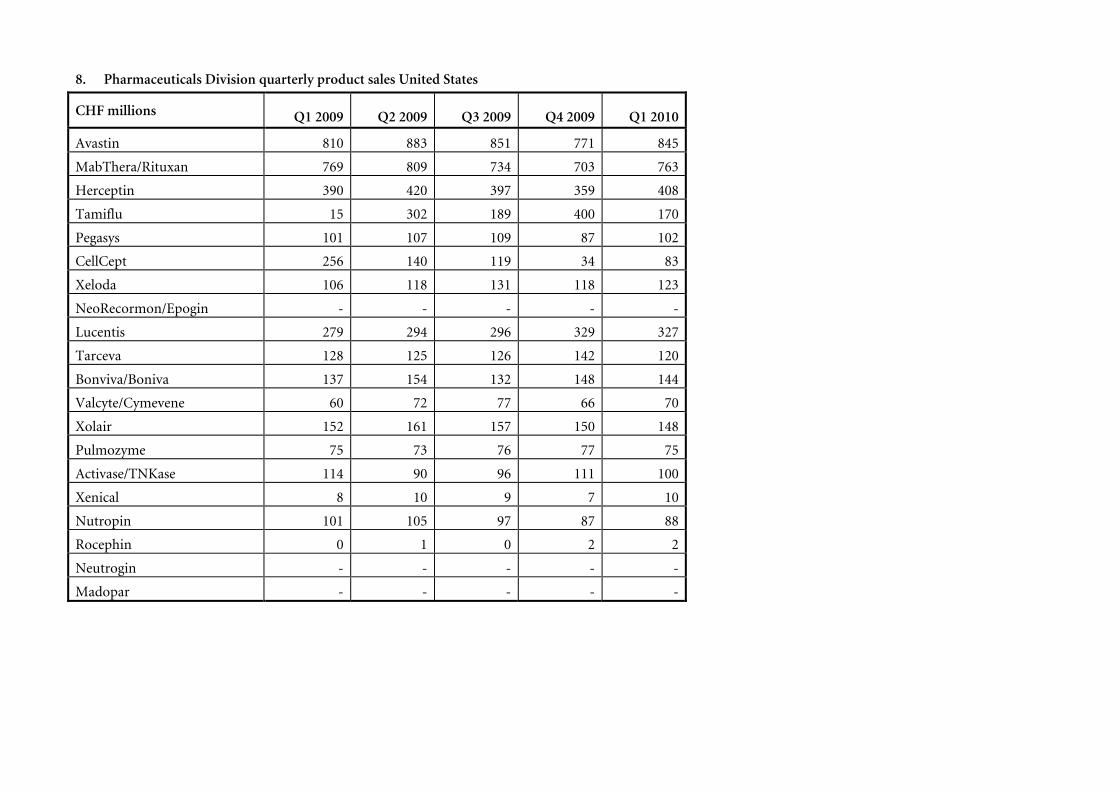
8. Pharmaceuticals Division quarterly product sales United States
CHF millions
Q1 2009
Q2 2009
Q3 2009
Q4 2009
Q1 2010
Avastin 810 883 851 771 845
MabThera/Rituxan 769 809 734 703 763
Herceptin 390 420 397 359 408
Tamiflu 15 302 189 400 170
Pegasys 101 107 109 87 102
CellCept 256 140 119 34 83
Xeloda 106 118 131 118 123
NeoRecormon/Epogin - - - - -
Lucentis 279 294 296 329 327
Tarceva 128 125 126 142 120
Bonviva/Boniva 137 154 132 148 144
Valcyte/Cymevene 60 72 77 66 70
Xolair 152 161 157 150 148
Pulmozyme 75 73 76 77 75
Activase/TNKase 114 90 96 111 100
Xenical 8 10 9 7 10
Nutropin 101 105 97 87 88
Rocephin 0 1 0 2 2
Neutrogin - - - - -
Madopar - - - - -

9. Pharmaceuticals Division quarterly product sales Western Europe
CHF millions
Q1 2009
Q2 2009
Q3 2009
Q4 2009
Q1 2010
Avastin 418 453 461 458 484
MabThera/Rituxan 395 419 421 408 442
Herceptin 517 533 547 528 570
Tamiflu 108 96 283 297 3
Pegasys 105 110 92 91 99
CellCept 119 127 123 125 123
Xeloda 75 79 80 77 81
NeoRecormon/Epogin 172 178 172 157 141
Lucentis - - - - -
Tarceva 115 118 121 121 116
Bonviva/Boniva 72 74 77 81 79
Valcyte/Cymevene 39 41 41 43 46
Xolair - - - - -
Pulmozyme 29 31 29 29 30
Activase/TNKase - - - - -
Xenical 43 51 51 44 44
Nutropin - - - - -
Rocephin 18 16 15 17 16
Neutrogin - - - - -
Madopar 29 29 28 30 27

10. Pharmaceuticals Division quarterly product sales Japan
CHF millions
Q1 2009
Q2 2009
Q3 2009
Q4 2009
Q1 2010
Avastin 82 100 102 120 120
MabThera/Rituxan 52 63 62 67 53
Herceptin 81 93 83 88 67
Tamiflu 250 50 351 233 126
Pegasys 31 34 31 33 26
CellCept 11 13 13 14 12
Xeloda 15 18 19 25 27
NeoRecormon/Epogin 115 131 131 138 102
Lucentis - - - - -
Tarceva 15 17 16 19 17
Bonviva/Boniva - - - - -
Valcyte/Cymevene - - - - -
Xolair - - - - -
Pulmozyme - - - - -
Activase/TNKase - - - - -
Xenical - - - - -
Nutropin - - - - -
Rocephin 15 17 16 15 13
Neutrogin 90 98 101 96 81
Madopar 5 6 6 6 5
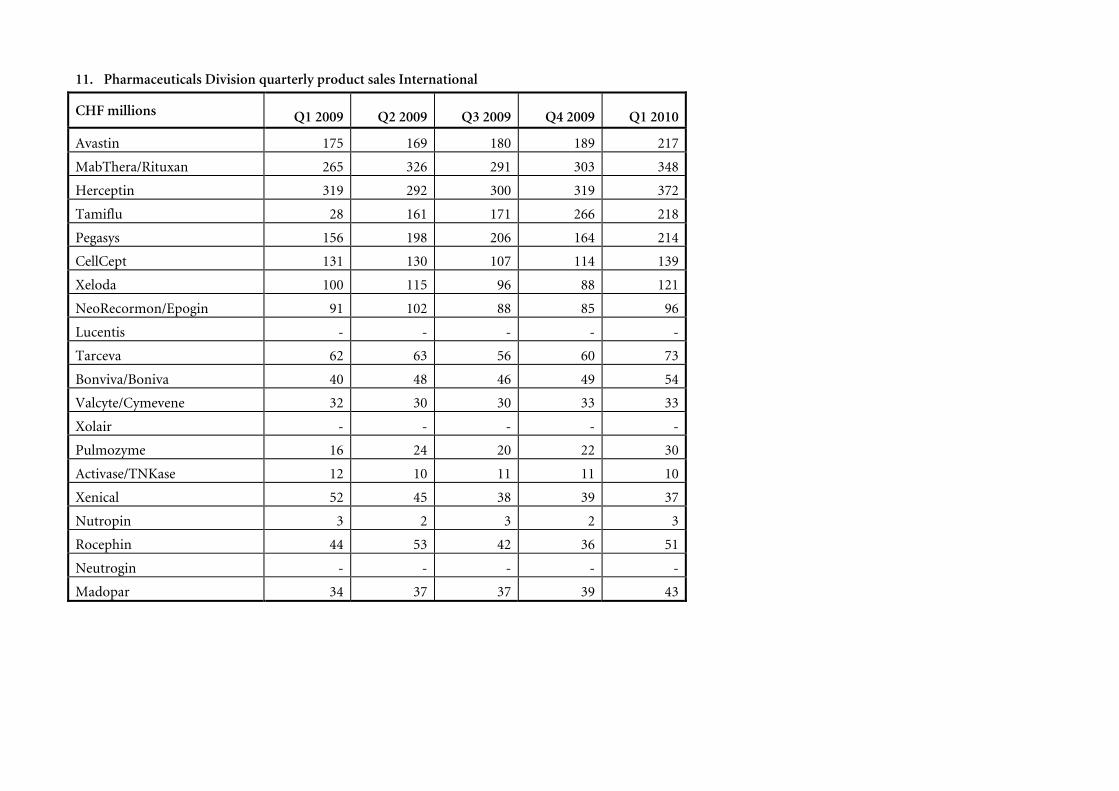
11. Pharmaceuticals Division quarterly product sales International
CHF millions
Q1 2009
Q2 2009
Q3 2009
Q4 2009
Q1 2010
Avastin 175 169 180 189 217
MabThera/Rituxan 265 326 291 303 348
Herceptin 319 292 300 319 372
Tamiflu 28 161 171 266 218
Pegasys 156 198 206 164 214
CellCept 131 130 107 114 139
Xeloda 100 115 96 88 121
NeoRecormon/Epogin 91 102 88 85 96
Lucentis - - - - -
Tarceva 62 63 56 60 73
Bonviva/Boniva 40 48 46 49 54
Valcyte/Cymevene 32 30 30 33 33
Xolair - - - - -
Pulmozyme 16 24 20 22 30
Activase/TNKase 12 10 11 11 10
Xenical 52 45 38 39 37
Nutropin 3 2 3 2 3
Rocephin 44 53 42 36 51
Neutrogin - - - - -
Madopar 34 37 37 39 43