Exam - College of Engineering, Michigan State University€¦ · exceeds shear strength in uniaxial...
42
Exam Monday April 18 Chapter 5: Elastic Strain Deflection Stability Chapter 6: Failure Theories Safety Factors Chapter 7: Impact Chapter 8: Fatigue 5.1-2, 5.5-7, 5.10-12 6.1-2, 6.5-8, 6.10-12 7.1-2, 7.4 8.1-11
Transcript of Exam - College of Engineering, Michigan State University€¦ · exceeds shear strength in uniaxial...

Exam
Monday April 18
Chapter 5: Elastic Strain Deflection Stability
Chapter 6: Failure TheoriesSafety Factors
Chapter 7: Impact
Chapter 8: Fatigue
5.1-2, 5.5-7, 5.10-12
6.1-2, 6.5-8, 6.10-12
7.1-2, 7.4
8.1-11

Chapter 5: Elastic Strain 5.1-2, Deflection 5.5-7 p184-185p186 Tab 5.1p187 Tab 5.2 Stability 5.10-12 p209-214Fig 5.27Fig 5.28Eq 5.10-13
Chapter 6: 6.1-2,6.5-8, 6.10-12 Failure Theories p253-254Fig 6.10Eq 6.5-8Safety Factors p263
Chapter 7: 7.1-2,7.4 Impact p275-284, 290-295
Chapter 8: Fatigue 8.1-11 alternating stressp304-310 readingFig 8.11Fig 8.13Tab 8.1
Mean + alternating stressp317-322Fig 8.16Fig 8.17

Tables and Charts provided for Exam:1. Table 5.1, p186 (Deflection, Stiffness)
2. Table 5.2, p187 (Torsional Deflection)
3. Appendix B1-a, p834 (Section Properties)
4. Appendix C-1, p840 (Material Properties)
5. Figure 5.27, p212 (eq. Column Length)
6. Table 8.1, p316 (Fatigue Strength Factors)
7. Figure 8.13, p314 (CS Surface Finish)

Elastic Strain, Deflection & Stability
Linearly elastic stress-strain relationship (Hooke’s Law)
strain: (uniaxial stress)
E
11
δ=ε
E…Young’s Modulus(Elasticity Modulus)

Shear strain normally can’t be measured directly.
Shear strain: (Hook’s Law) G…shear modulus of elasticity
dx
γ Gτ
=γ
( )ν+=
12EG
uniaxial: E
11
δ=ε
dy (neg.)
dz (neg.)
dx
Axial strain
also causes Lateral strain (Poisson’s Ratio)
strainaxialstrainlateral
=ν
Uniaxial Linear Strain:

Strain Φ-direction: Φ⋅⎟⎠⎞
⎜⎝⎛ ε−ε
+ε+ε
=εΦ 2cos22
2121
Shear Strain Φ-direction: Φ⋅ε−ε
=γ Φ 2sin
2221
Mohr’s Circle:
•Half shear strain
+γ/2
+ε
•Angles twicethe real angles
substitute: σ? ε, τ? γ/2substitute: σ→ ε, τ→ γ/2
Mohr Strain Circle

Deflection or stiffness, rather than stress, is controlling factor in design
• satisfying rigidity • preventing interference or disengagement of gears
Elastic stable systems: small disturbance corrected be elastic forces
Tension Bending Torsion Compression
short column
Elastic unstable systems: small disturbance can cause buckling (collapse)
Compression slender column
Elastic Strain, Deflection & Stability

Deflection in direction of Load p186
Deflection not in direction of Load
K’ …Section Property (Table 5.2)
Deflection Spring Rate
Rigidity Property Section Material
θ in radiant

Table 5.2: Section Properties for Torsional Deflection

Buckling does not vary linearly with load • it occurs suddenly and is therefore dangerous
Elastically Elastically Stable Unstable
P < 2e
2
cr LEIP π
= P > 2e
2
cr LEIP π
=
E …modulus of Elasticity I …moment of inertia (smallest value)
Axis of least I and ρ becomes neutral bending axis
Le…equivalent column length (length between zero bending)
Le=L
Both ends hinged
fixed fixed
fixed
0.707L 0.8 L
0.5 L 0.65 L
L 1.2 L
2 L 2.1 L
Elastic Instability - Buckling

J.B.Johnson Parabola Euler Buckling
P > 2
e2
2y
ycrL
E4S
SS ⎟⎟⎠
⎞⎜⎜⎝
⎛ρπ
−= ( )2e
2
crL
ESρ
π=
ρ …radius of gyration Le/ρ…slenderness ratio
Euler Column Buckling
Johnson Parabola 2
Sy
21
y
2
SE2
⎟⎟
⎠
⎞
⎜⎜
⎝
⎛ π


Failure TheoriesPredict capability of materialsto withstand the infinite combination of non-standard loads
Failure:Behavior of a member that renders it unsuitable for its intended function.
Static loading (no impact, fatigue nor surface wear)
How much distortion is too much ?Impact loading,
Sharp notches,Low temperatures,
Can promote brittle fracture of usually ductile material


Max. Normal-Stress-Theory(W.J.M. Rankine 1802-1872, engl. scientist & educator)
+σ
+τ
Suc
Suc+σ1
Sut
+σ2
Sut
Suc Sut
Failure occurs, when greatest tensile stress
exceeds uniaxial tensile strength.
No Failure occurs within this area
No Failure occurs within these bounds
Principle Mohr circles σ1 –σ2 plot
Correlates well for brittle fracture
simplest

Max. Shear-Stress-Theory(C.A. Coulomb 1736-1806, French scientist)
+τ
Syt+σ1
Sy+σ2
Sy
Failure occurs, when maximum shear stress
exceeds shear strength in uniaxial tension test.
No Failurewithin this area
No Failurewithin
these bounds
Principle Mohr circles σ1 –σ2 plot
Correlates well for ductile yielding
oldestAlso called: Tresca Theory or Guest’s Law
+σ
2S
2y
max21 =τ=
σ−σ
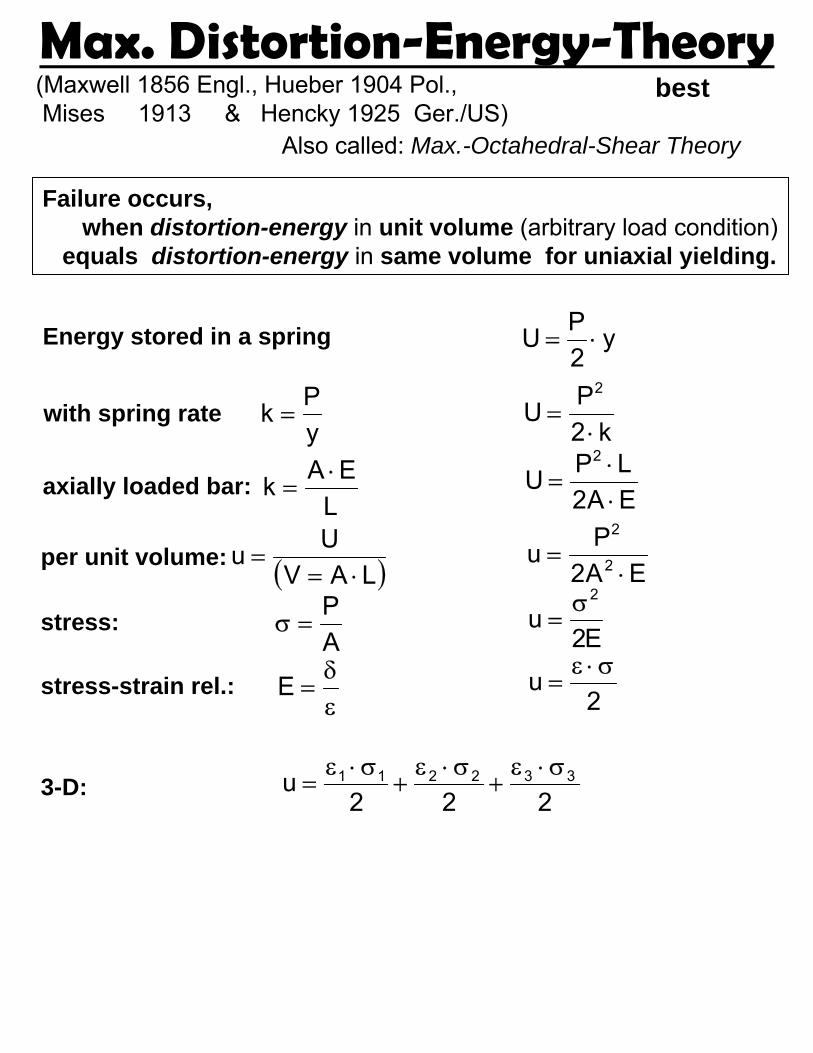
Max. Distortion-Energy-Theory(Maxwell 1856 Engl., Hueber 1904 Pol., Mises 1913 & Hencky 1925 Ger./US)
Failure occurs, when distortion-energy in unit volume (arbitrary load condition)
equals distortion-energy in same volume for uniaxial yielding.
best
Also called: Max.-Octahedral-Shear Theory
with spring rateyPk =
axially loaded bar:L
EAk ⋅=
Energy stored in a spring y2PU ⋅=
k2PU
2
⋅=
EA2LPU
2
⋅⋅
=
per unit volume: ( )LAVUu
⋅==
EA2Pu 2
2
⋅=
stress:AP
=σ E2u
2σ=
stress-strain rel.:εδ
=E 2u σ⋅ε
=
3-D: 222u 332211 σ⋅ε
+σ⋅ε
+σ⋅ε
=

Max. Distortion-Energy-Theory222
u 332211 σ⋅ε+
σ⋅ε+
σ⋅ε=σ
with 3-D stress-strain rel.
with 3-D averaged stress:
[ ]ν−σ
= 21E2
3u2
avav
3321
avσ+σ+σ
=σ
( )[ ]1332212
32
22
1 2E21u σσ+σσ+σσν−σ+σ+σ=σ
avd uuu −= σDistortion energy
2yd S
E31u ν+
=y1 S=σSimple tension test:
( ) ( ) ( )⎥⎦
⎤⎢⎣
⎡ σ−σ+σ−σ+σ−σν+=
2E31u
213
232
221
d
( ) ( ) ( )2
S2
132
322
21ey
σ−σ+σ−σ+σ−σ=σ>
actual average difference
EEE321
1νδ
−νδ
−δ
=ε
EEE312
2νδ
−νδ
−δ
=ε
EEE213
3νδ
−νδ
−δ
=ε

Max. Distortion-Energy-Theory
(Juvinall p254)
( ) ( ) ( )2
S2
132
322
21ey
σ−σ+σ−σ+σ−σ=σ>
3D:
2D:

Example:
Failure Theoriesσ1 = 35 ksi
σ2 = -25 ksi
SteelSy=100 ksi
Load Line
Shear Diagonal
σ1= Sy=
σ2=
Sy=
Max. S
hear
Stress
Th.
Max. Distortio
n Energy Th.M
ax. N
orm
al S
ress
Th.
Load Point
y212
22
1 S<σσ−σ+σ
y21 S<σ−σ
ymax S<σ
1.7
1.9
2.9

also called shock, sudden or impulsive loadingImpact
Compare Time of Load Application t with Natural Period of Vibration τ
a) Rapidly moving
dashpot
■driving a nail with a hammer, automobile collisions ….
b) Suddenly applied c) Direct Impact■Combustion in
engine cylinder■ vehicles crossing
a bridge■ pile drive,■ drop forge,■ car crash
To distinguish:
km
π= 2
Carrying loads
Absorbing energy
t > 3 τStatic load “Gray area” Impact load
3 τ > t > 1/2 τ t < 1/2 τ
Design for

Impact Factor
material properties vary with loading speed Impact
Su
Sy
Sy/Su
elongation
ksi %•Works favorably
•Promotes brittle fracture
•Loading rate only approximated
In praxis:•Static propertiesknown
■ x4 for automobile suspension parts

Linear & Bending Impact
Assumptions:
•No massof structure
•No deflectionwithin impacting mass
•No damping
dynamic = static deflection curveonly multiplied by impact factor
all energy goes into structure
most severe impact
W
Wk k
hδ
Fe
W
Guide rod
δst δ h
Elastic-strain energy stored in structure= 0.5Feδ
Work of falling weight = W(h+δ)
W (h + δ) = 0.5 Fe δFe = k δ
k = W / δstFe = W δ/δst
⎟⎟⎠
⎞⎜⎜⎝
⎛++=
stst
h211δ
δδ
⎟⎟⎠
⎞⎜⎜⎝
⎛++=
ste
h211WFδ
Impact Factor
Impact Deflection …
Impact Load …
⎟⎟⎠
⎞⎜⎜⎝
⎛++=
stste
h211δ
σσImpact Stress …

Linear & Bending ImpactW
Wk k
hδ
Fe
W
Guide rod
δst δ h
Elastic-strain energy stored in structure= 0.5Feδ
Work of falling weight = W(h+δ)
W (h + δ) = 0.5 Fe δFe = k δ
k = W / δstFe = W δ/δst
v2 = 2gh → h= v2/2g
h = 0 or v=0suddenly applied load
Impact Factor = 2 (Double Safety Factor)
Impact Factor
For h >> δst

Linear & Bending ImpactW
Wk k
hδ
Fe
W
Guide rod
δst δ h
Elastic-strain energy stored in structure= 0.5Feδ
Work of falling weight = W(h+δ)
W (h + δ) = 0.5 Fe δFe = k δ
k = W / δstFe = W δ/δst
Impact Factor
For h >> δst
Vertical movement
Horizontal movement
W = k δst = g m
Impact kin. Energy … U = 0.5 m v2
As greater Stiffness and kin. Energy as greater Equivalent static force

Linear Impact of Straight Bar
σ = Fe / A k = A E / L
Impact Energy Capacity of a straight rod
• Basic relationship → Gives optimistic results
• Calculates stress lower than actual stressbecause of- Non-uniform loading & stress distribution- Mass of the impacted rod
σ

Term fatigue introduced by Poncelet (France) 1839progressive fracture is more descriptive
Fatigue
1. Minute crack at critical area of high local stress(geometric stress raiser, flaws, preexisting cracks)
2. Crack gradually enlarges(creating “beach marks”)
3. Final fracture(suddenly, when section sufficiently weakened)
Fatigue: no or only microscopic distortionstatic failure: gross distortion
• Repeated plastic deformation
• Thousands/millions of microscopic yielding(far below conventional yield or elastic point)
• Highly localized plastic yielding(holes, sharp corners, threads, keyways, scratches, corrosion)
• Strengthen vulnerable location often as effectiveas choosing a stronger material
• (If local yielding is sufficiently minutestrain-strengthen may stop the yielding)

Standard Fatigue Strength Sn’Empirical data from R.R. Moore fatigue test(Highly standardized and restricted conditions)
Rotating-beam fatigue-testing machine
Pure bending (zero traverse shear)
N cycles of tension-to-compression-to-tension
1750 rpm
various

Endurance LimitS-N curve approximation
Endurance limit
Steel Sn‘ = 0.5 x Su
Cast Iron
Aluminum
Magnesium Sn‘ = 0.35 x Su
Nickel alloys Sn‘ = 0.35…0.5 x Su
Cooper alloys Sn‘ = 0.25…0.5 x Su
Titanium Sn‘ = 0.45…0.6 x Su
@ N=106
@ N=108Sn‘ = 0.4 x Su

Endurance Limit
Reversed Bending (not rotating bending like in Moore testing)
maximum stresses only @ top and bottomhigh probability not weakest point
Rotating Bending (Moore testing)
maximum stresses on surfaceweakest point fatigue start
Fatigue strength usually slightly greaterdeliberately neglected safe side
Reversed Axial Loadingmaximum stresses entire cross section
no reserve !Fatigue strength about 10% lesseccentric loads about 20…30% less
CG=0.7…0.9gradient factor
Reversed Torsional Loading
reversed biaxial stressdistortion energy theory 58%
CL=0.58load factor
maximum stresses on surfaceshear stresses fatigue start

Fatigue StrengthJuvinall p.312
Fig. 8.12
Steel Sus=0.8 Su
Other ductile material Sus=0.7 Su

Fatigue StrengthInfluence of SurfaceSo far special “mirror polish” surface (only in laboratory ! )Minimizes 1.) surface scratches (stress concentration)
2.) differences of surface & interior material3.) residual stresses from finishing
Commercial surfaces have localized pointsof greater fatigue vulnerability.
Surface factor CS
Use only for endurance limit !
+ cast iron

Fatigue StrengthInfluence of Size
Reversed Axial Loadingmaximum stresses entire cross section
no reserve !Fatigue strength about 10% lesseccentric loads about 20…30% less
CG=0.7…0.9gradient factor
large specimen> 0.4” CG = 0.92..4” CG = 0.84..6” CG = 0.7
0.3” test specimen
Use equivalent round section !
Bending & Torsional Reversed Loading
small specimen< 0.3” CG = 1

Fatigue Strength
Sn = Sn’CLCGCS
Summery use Table 8.1 Juvinall p.316106-cycle strength (endurance limit)
Sn’… Moore endurance limit
1000-cycle strengthBending Axial Torsion
CL (load factor) 0.9Su 0.75Su 0.9Sussteel: Sus=0.8Su
other ductile metals: Sus=0.7Su
Bending Axial TorsionCL (load factor) 1 1 0.58
CG (gradient factor)< 0.4” 1 0.7…0.9 1
0.4”…2” 0.9 0.7…0.9 0.92”…4” r e d u c e - 0.1 4”…6” r e d u c e - 0.2
CS (surface factor) see Fig. 8.13

Fatigue StrengthFluctuating stress = static stress + completely reversed stress
mean + alternating
Effect of mean stress

Fatigue StrengthEffect of mean stressStatic tensile stress reduces amplitude of reversed stress
that can be superimposed
Macroscopic Yielding on first load application
Microscopic Yielding
empiric concept
Sy
Sn
Su
-Sn
σa
σm

Fatigue StrengthEffect of mean stress
Compressive mean stress does not reduce amplitudethat can be superimposed
Sy-Sy
Sy
Sn
σa
-σm(compression)
σm(tension)
Goodman lines
empiric concept
Su
Values from S-N curve (σm=0)
No macroscopic yielding
Ext
ends
infin
ite fo
r fat
igue
(o
nly
stat
ic fa
ilure
Suc
)
Juvinall p.318 Fig. 8.16constant-life fatigue diagram

Fatigue StrengthEffect of mean stress
Sy Su
Sy
-σm(compression)
σm(tension)
σa
-Sy
67.0m
a =σσ
Sn=Sn’CLCGCS=(0.5x150ksi)x1x0.9x0.9=61ksi
Sy=120 ksiSu=150 ksi
polishedfor N=106 & 103
d= ? < 2in
1000…5000lbaxial load
Alb6000
ASFxFm
m ==σσm
SF=2
Alb4000
ASFxFa ==σa
σa(N=106)=38ksi d=0.367in < 3/8 in σa(Sy)=48ksi d=0.326in <11/32in
S=0.75Su=0.75x150ksi=112ksi

Homework P 8.23Known: D=in, Su = 110ksi, Sy = 77ksi,
reversed bending, axial, torsional loading, steel, machinedsurface
Find: Sn(6x10⁴ life cycles)

Homework P 8.23Known: D=in, Su = 110ksi, Sy = 77ksi,
reversed bending, axial, torsional loading, steel, machinedsurface
Find: Sn(6x10⁴ life cycles)

Homework P 8.23Known: D=in, Su = 110ksi, Sy = 77ksi,
reversed bending, axial, torsional loading, steel, machinedsurface
Find: Sn(6x10⁴ life cycles)

Homework P 8.23Known: D=in, Su = 110ksi, Sy = 77ksi,
reversed bending, axial, torsional loading, steel, machinedsurface
Find: Sn(6x10⁴ life cycles)