New empirical failure criterion for...
19
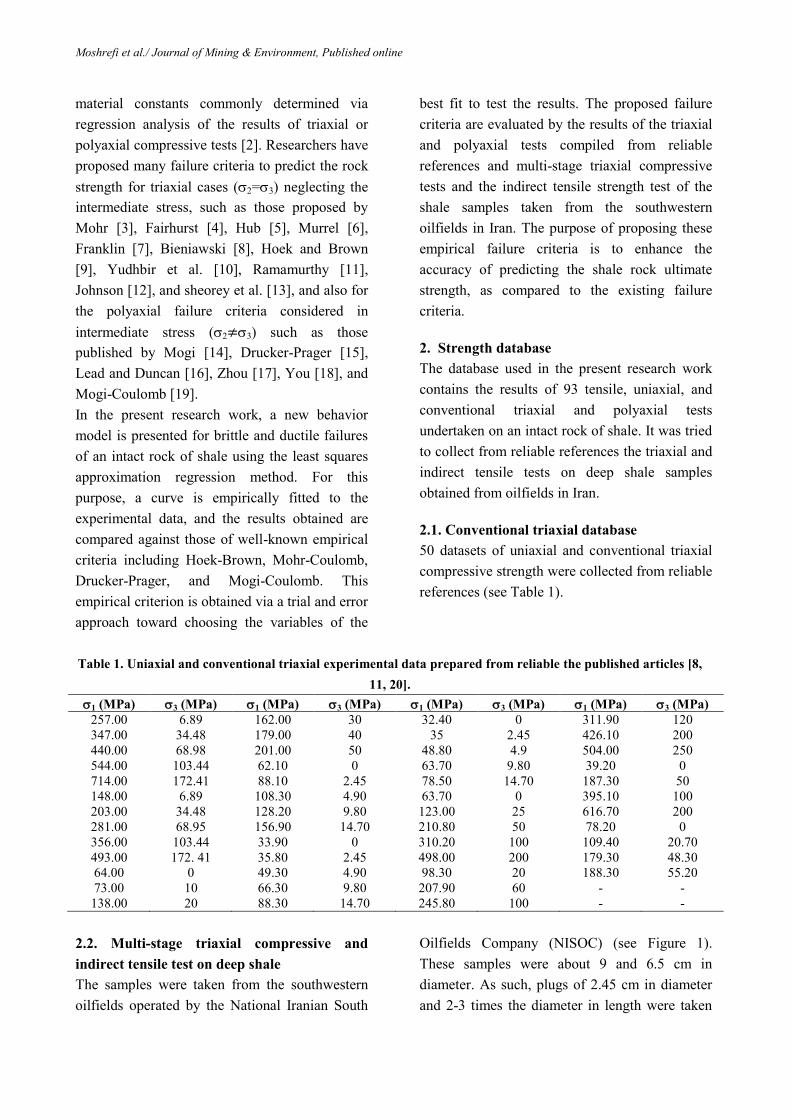
JME Journal of Mining & Environment, Published online: 19 November 2017. DOI: 10.22044/jme.2017.5871.1401 New empirical failure criterion for shale S. Moshrefi 1 , K. Shahriar 2* , A. Ramezanzadeh 3 and K. Goshtasbi 4 1. Department of Mining Engineering, Science and Research Branch, Islamic Azad University, Tehran, Iran 2. Mining and Metallurgical Engineering Department, Amirkabir University of Technology (Tehran Polytechnic), Tehran, Iran 3. School of Mining, Petroleum & Geophysics Engineering, Shahrood University of Technology, Shahrood, Iran 4. Department of Mining Engineering, Faculty of Engineering & Technology, Tarbiat Modares University, Tehran, Iran Received 11 June 2017; received in revised form 6 August 2017; accepted 3 November 2017 *Corresponding author: [email protected] (K. Shahriar). Abstract A new failure criterion was presented to predict the ultimate strength of shale under the triaxial and polyaxial state of stress. A database containing 93 datasets was obtained from the results of the uniaxial, triaxial, polyaxial compressive tests, an indirect tensile test was collected from reliable references, and this test was carried out on the shale samples taken from the southwestern oilfields in Iran. The database was used to evaluate the proposed criterion, and its accuracy was compared against the popular failure criteria in rock mechanics, particularly those used for stability analysis such as the Hoek-Brown, Mohr-Coulomb, Drucker-Prager, and Mogi-Coulomb failure criteria. In order to evaluate the model, seven important statistical indices were selected. Subsequently, curves from various failure criteria were fitted to the triaxial and polyaxial data, and the corresponding coefficients and statistical indices were determined. The results obtained indicated that, in all cases, compared to the other failure criteria, the proposed criterion succeeded to predict the ultimate strength at a higher accuracy. Also the proposed criterion was used calculate the uniaxial compressive and tensile strengths with a minimum error. For a further examination of the proposed criterion, a series of results from the triaxial test including the ductile failure data were utilized for evaluation of the applicability of the proposed criterion to the ductile zone. It showed that the criterion could predict the ultimate strength of shale over a wide range of stresses. Keywords: Empirical Criteria, Shale, Wellborn Stability, Rock Strength, Ductile Failure, Mechanical Behavior. 1. Introduction One of the main aspects of a well stability analysis is the choice of an appropriate failure criterion to predict the ultimate strength of rocks [1]. Rock strength is an important index when designing the rock structure. Thus analysis of rock structure requires an appropriate failure criterion. Any failure criterion has a number of
Transcript of New empirical failure criterion for...
JME Journal of Mining & Environment, Published online: 19 November 2017. DOI: 10.22044/jme.2017.5871.1401
New empirical failure criterion for shale
S. Moshrefi1, K. Shahriar
2*, A. Ramezanzadeh
3 and K. Goshtasbi
4
1. Department of Mining Engineering, Science and Research Branch, Islamic Azad University, Tehran, Iran
2. Mining and Metallurgical Engineering Department, Amirkabir University of Technology (Tehran Polytechnic), Tehran, Iran
3. School of Mining, Petroleum & Geophysics Engineering, Shahrood University of Technology, Shahrood, Iran
4. Department of Mining Engineering, Faculty of Engineering & Technology, Tarbiat Modares University, Tehran, Iran
Received 11 June 2017; received in revised form 6 August 2017; accepted 3 November 2017
*Corresponding author: [email protected] (K. Shahriar).
Abstract
A new failure criterion was presented to predict the ultimate strength of shale under the triaxial and
polyaxial state of stress. A database containing 93 datasets was obtained from the results of the uniaxial,
triaxial, polyaxial compressive tests, an indirect tensile test was collected from reliable references, and this
test was carried out on the shale samples taken from the southwestern oilfields in Iran. The database was
used to evaluate the proposed criterion, and its accuracy was compared against the popular failure criteria
in rock mechanics, particularly those used for stability analysis such as the Hoek-Brown, Mohr-Coulomb,
Drucker-Prager, and Mogi-Coulomb failure criteria. In order to evaluate the model, seven important
statistical indices were selected. Subsequently, curves from various failure criteria were fitted to the triaxial
and polyaxial data, and the corresponding coefficients and statistical indices were determined. The results
obtained indicated that, in all cases, compared to the other failure criteria, the proposed criterion succeeded
to predict the ultimate strength at a higher accuracy. Also the proposed criterion was used calculate the
uniaxial compressive and tensile strengths with a minimum error. For a further examination of the
proposed criterion, a series of results from the triaxial test including the ductile failure data were utilized
for evaluation of the applicability of the proposed criterion to the ductile zone. It showed that the criterion
could predict the ultimate strength of shale over a wide range of stresses.
Keywords: Empirical Criteria, Shale, Wellborn Stability, Rock Strength, Ductile Failure, Mechanical
Behavior.
1. Introduction One of the main aspects of a well stability
analysis is the choice of an appropriate failure
criterion to predict the ultimate strength of rocks
[1]. Rock strength is an important index when
designing the rock structure. Thus analysis of
rock structure requires an appropriate failure
criterion. Any failure criterion has a number of
Moshrefi et al./ Journal of Mining & Environment, Published online
material constants commonly determined via
regression analysis of the results of triaxial or
polyaxial compressive tests [2]. Researchers have
proposed many failure criteria to predict the rock
strength for triaxial cases (2=3) neglecting the
intermediate stress, such as those proposed by
Mohr [3], Fairhurst [4], Hub [5], Murrel [6],
Franklin [7], Bieniawski [8], Hoek and Brown
[9], Yudhbir et al. [10], Ramamurthy [11],
Johnson [12], and sheorey et al. [13], and also for
the polyaxial failure criteria considered in
intermediate stress (2 3) such as those
published by Mogi [14], Drucker-Prager [15],
Lead and Duncan [16], Zhou [17], You [18], and
Mogi-Coulomb [19].
In the present research work, a new behavior
model is presented for brittle and ductile failures
of an intact rock of shale using the least squares
approximation regression method. For this
purpose, a curve is empirically fitted to the
experimental data, and the results obtained are
compared against those of well-known empirical
criteria including Hoek-Brown, Mohr-Coulomb,
Drucker-Prager, and Mogi-Coulomb. This
empirical criterion is obtained via a trial and error
approach toward choosing the variables of the
best fit to test the results. The proposed failure
criteria are evaluated by the results of the triaxial
and polyaxial tests compiled from reliable
references and multi-stage triaxial compressive
tests and the indirect tensile strength test of the
shale samples taken from the southwestern
oilfields in Iran. The purpose of proposing these
empirical failure criteria is to enhance the
accuracy of predicting the shale rock ultimate
strength, as compared to the existing failure
criteria.
2. Strength database
The database used in the present research work
contains the results of 93 tensile, uniaxial, and
conventional triaxial and polyaxial tests
undertaken on an intact rock of shale. It was tried
to collect from reliable references the triaxial and
indirect tensile tests on deep shale samples
obtained from oilfields in Iran.
2.1. Conventional triaxial database
50 datasets of uniaxial and conventional triaxial
compressive strength were collected from reliable
references (see Table 1).
Table 1. Uniaxial and conventional triaxial experimental data prepared from reliable the published articles [8,
11, 20].
1 (MPa) 3 (MPa) 1 (MPa) 3 (MPa) 1 (MPa) 3 (MPa) 1 (MPa) 3 (MPa)
257.00 6.89 162.00 30 32.40 0 311.90 120
347.00 34.48 179.00 40 35 2.45 426.10 200
440.00 68.98 201.00 50 48.80 4.9 504.00 250
544.00 103.44 62.10 0 63.70 9.80 39.20 0
714.00 172.41 88.10 2.45 78.50 14.70 187.30 50
148.00 6.89 108.30 4.90 63.70 0 395.10 100
203.00 34.48 128.20 9.80 123.00 25 616.70 200
281.00 68.95 156.90 14.70 210.80 50 78.20 0
356.00 103.44 33.90 0 310.20 100 109.40 20.70
493.00 172. 41 35.80 2.45 498.00 200 179.30 48.30
64.00 0 49.30 4.90 98.30 20 188.30 55.20
73.00 10 66.30 9.80 207.90 60 - -
138.00 20 88.30 14.70 245.80 100 - -
2.2. Multi-stage triaxial compressive and
indirect tensile test on deep shale
The samples were taken from the southwestern
oilfields operated by the National Iranian South
Oilfields Company (NISOC) (see Figure 1).
These samples were about 9 and 6.5 cm in
diameter. As such, plugs of 2.45 cm in diameter
and 2-3 times the diameter in length were taken
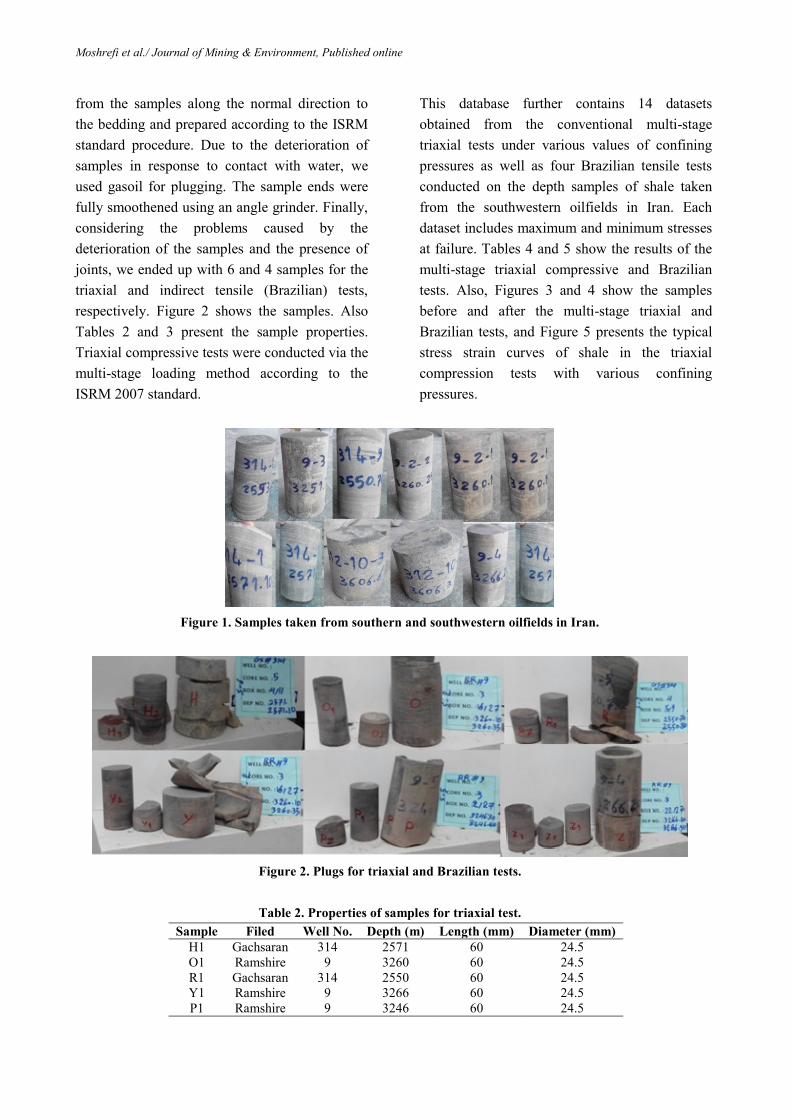
Moshrefi et al./ Journal of Mining & Environment, Published online
from the samples along the normal direction to
the bedding and prepared according to the ISRM
standard procedure. Due to the deterioration of
samples in response to contact with water, we
used gasoil for plugging. The sample ends were
fully smoothened using an angle grinder. Finally,
considering the problems caused by the
deterioration of the samples and the presence of
joints, we ended up with 6 and 4 samples for the
triaxial and indirect tensile (Brazilian) tests,
respectively. Figure 2 shows the samples. Also
Tables 2 and 3 present the sample properties.
Triaxial compressive tests were conducted via the
multi-stage loading method according to the
ISRM 2007 standard.
This database further contains 14 datasets
obtained from the conventional multi-stage
triaxial tests under various values of confining
pressures as well as four Brazilian tensile tests
conducted on the depth samples of shale taken
from the southwestern oilfields in Iran. Each
dataset includes maximum and minimum stresses
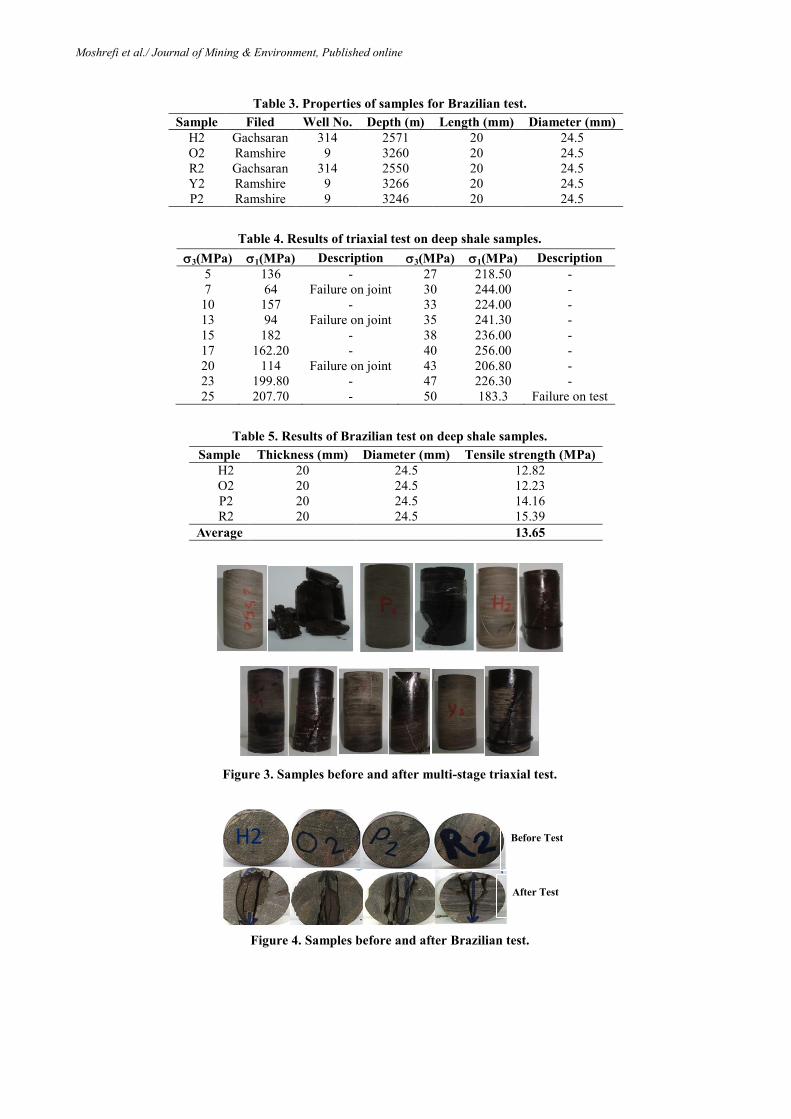
at failure. Tables 4 and 5 show the results of the
multi-stage triaxial compressive and Brazilian
tests. Also, Figures 3 and 4 show the samples
before and after the multi-stage triaxial and
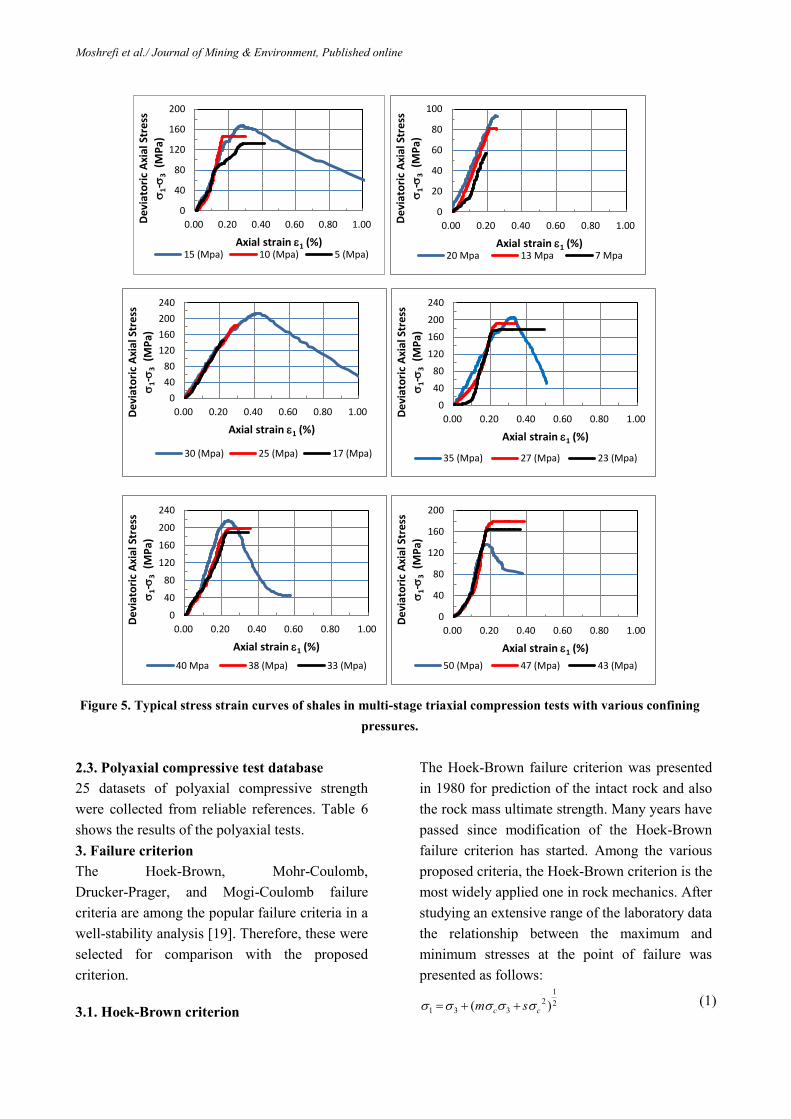
Brazilian tests, and Figure 5 presents the typical
stress strain curves of shale in the triaxial
compression tests with various confining
pressures.
Figure 1. Samples taken from southern and southwestern oilfields in Iran.
Figure 2. Plugs for triaxial and Brazilian tests.
Table 2. Properties of samples for triaxial test.
Diameter (mm) Length (mm) Depth (m) Well No. Filed Sample
24.5 60 2571 314 Gachsaran H1
24.5 60 3260 9 Ramshire O1
24.5 60 2550 314 Gachsaran R1
24.5 60 3266 9 Ramshire Y1
24.5 60 3246 9 Ramshire P1
Moshrefi et al./ Journal of Mining & Environment, Published online
Table 3. Properties of samples for Brazilian test.
Diameter (mm) Length (mm) Depth (m) Well No. Filed Sample
24.5 20 2571 314 Gachsaran H2
24.5 20 3260 9 Ramshire O2
24.5 20 2550 314 Gachsaran R2
24.5 20 3266 9 Ramshire Y2
24.5 20 3246 9 Ramshire P2
Table 4. Results of triaxial test on deep shale samples.
3(MPa) 1(MPa) Description 3(MPa) 1(MPa) Description
5 136 - 27 218.50 -
7 64 Failure on joint 30 244.00 -
10 157 - 33 224.00 -
13 94 Failure on joint 35 241.30 -
15 182 - 38 236.00 -
17 162.20 - 40 256.00 -
20 114 Failure on joint 43 206.80 -
23 199.80 - 47 226.30 -
25 207.70 - 50 183.3 Failure on test
Table 5. Results of Brazilian test on deep shale samples.
Tensile strength (MPa) Diameter (mm) Thickness (mm) Sample
12.82 24.5 20 H2
12.23 24.5 20 O2
14.16 24.5 20 P2
15.39 24.5 20 R2
13.65 Average
Figure 3. Samples before and after multi-stage triaxial test.
Figure 4. Samples before and after Brazilian test.
After Test
Before Test H2
Moshrefi et al./ Journal of Mining & Environment, Published online
Figure 5. Typical stress strain curves of shales in multi-stage triaxial compression tests with various confining
pressures.
2.3. Polyaxial compressive test database
25 datasets of polyaxial compressive strength
were collected from reliable references. Table 6
shows the results of the polyaxial tests.
3. Failure criterion
The Hoek-Brown, Mohr-Coulomb,
Drucker-Prager, and Mogi-Coulomb failure
criteria are among the popular failure criteria in a
well-stability analysis [19]. Therefore, these were
selected for comparison with the proposed
criterion.
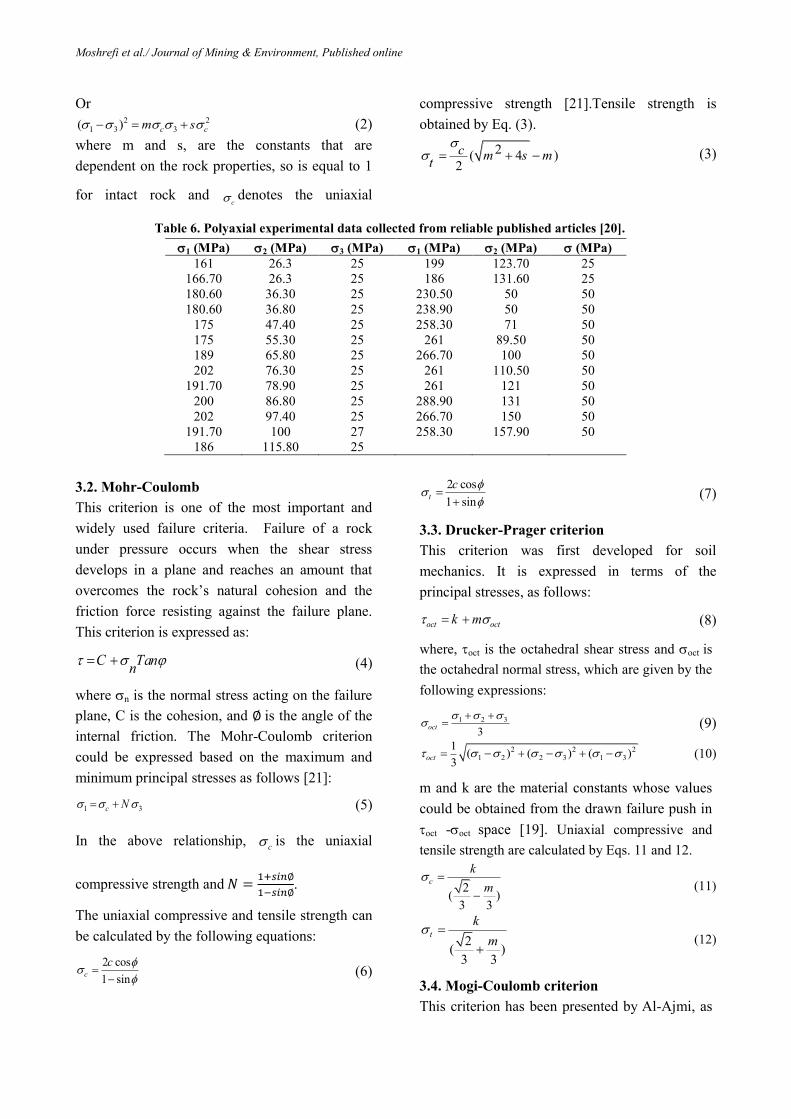
3.1. Hoek-Brown criterion
The Hoek-Brown failure criterion was presented
in 1980 for prediction of the intact rock and also
the rock mass ultimate strength. Many years have
passed since modification of the Hoek-Brown
failure criterion has started. Among the various
proposed criteria, the Hoek-Brown criterion is the
most widely applied one in rock mechanics. After
studying an extensive range of the laboratory data
the relationship between the maximum and
minimum stresses at the point of failure was
presented as follows: 1
2 21 3 3( ) c cm s (1)
0
40
80
120
160
200
0.00 0.20 0.40 0.60 0.80 1.00De
viat
ori
c A
xial
Str
ess
1-
3 (
MP
a)
Axial strain 1 (%) 15 (Mpa) 10 (Mpa) 5 (Mpa)
0
20
40
60
80
100
0.00 0.20 0.40 0.60 0.80 1.00De
viat
ori
c A
xial
Str
ess
1-
3 (
MP
a)
Axial strain 1 (%) 20 Mpa 13 Mpa 7 Mpa
0
40
80
120
160
200
240
0.00 0.20 0.40 0.60 0.80 1.00De
viat
ori
c A
xial
Str
ess
1-
3 (
MP
a)
Axial strain 1 (%)
30 (Mpa) 25 (Mpa) 17 (Mpa)
0
40
80
120
160
200
240
0.00 0.20 0.40 0.60 0.80 1.00De
viat
ori
c A
xial
Str
ess
1-
3 (
MP
a)
Axial strain 1 (%)
35 (Mpa) 27 (Mpa) 23 (Mpa)
0
40
80
120
160
200
240
0.00 0.20 0.40 0.60 0.80 1.00
De
viat
ori
c A
xial
Str
ess
1-
3 (
MP
a)
Axial strain 1 (%)
40 Mpa 38 (Mpa) 33 (Mpa)
0
40
80
120
160
200
0.00 0.20 0.40 0.60 0.80 1.00
De
viat
ori
c A
xial
Str
ess
1-
3 (
MP
a)
Axial strain 1 (%)
50 (Mpa) 47 (Mpa) 43 (Mpa)
Moshrefi et al./ Journal of Mining & Environment, Published online
Or 2 2
1 3 3( ) c cm s (2)
where m and s, are the constants that are
dependent on the rock properties, so is equal to 1
for intact rock and c denotes the uniaxial
compressive strength [21].Tensile strength is
obtained by Eq. (3).
2( 4 )2
c m s mt
(3)
Table 6. Polyaxial experimental data collected from reliable published articles [20].
1 (MPa) 2 (MPa) 3 (MPa) 1 (MPa) 2 (MPa) (MPa)
161 26.3 25 199 123.70 25
166.70 26.3 25 186 131.60 25
180.60 36.30 25 230.50 50 50
180.60 36.80 25 238.90 50 50
175 47.40 25 258.30 71 50
175 55.30 25 261 89.50 50
189 65.80 25 266.70 100 50
202 76.30 25 261 110.50 50
191.70 78.90 25 261 121 50
200 86.80 25 288.90 131 50
202 97.40 25 266.70 150 50
191.70 100 27 258.30 157.90 50
186 115.80 25
3.2. Mohr-Coulomb
This criterion is one of the most important and
widely used failure criteria. Failure of a rock
under pressure occurs when the shear stress
develops in a plane and reaches an amount that
overcomes the rock’s natural cohesion and the
friction force resisting against the failure plane.
This criterion is expressed as:
C Tann
(4)
where n is the normal stress acting on the failure
plane, C is the cohesion, and is the angle of the
internal friction. The Mohr-Coulomb criterion
could be expressed based on the maximum and
minimum principal stresses as follows [21]:
1 3 c N (5)
In the above relationship, c is the uniaxial
compressive strength and
.
The uniaxial compressive and tensile strength can
be calculated by the following equations:
2 cos
1 sin
c
c
(6)
2 cos
1 sin
t
c
(7)
3.3. Drucker-Prager criterion
This criterion was first developed for soil
mechanics. It is expressed in terms of the
principal stresses, as follows:
oct octk m (8)
where, oct is the octahedral shear stress and oct is
the octahedral normal stress, which are given by the
following expressions:
1 2 3
3
oct
(9)
2 2 21 2 2 3 1 3
1( ) ( ) ( )
3 oct (10)
m and k are the material constants whose values
could be obtained from the drawn failure push in
oct -oct space [19]. Uniaxial compressive and
tensile strength are calculated by Eqs. 11 and 12.
2( )
3 3
c
k
m
(11)
2( )
3 3
t
k
m
(12)
3.4. Mogi-Coulomb criterion
This criterion has been presented by Al-Ajmi, as

Moshrefi et al./ Journal of Mining & Environment, Published online
given below, and has been widely used in the oil
wellbore stability analysis. In fact, the
Mogi-Coulomb criterion is considered as the
extended form of the Mohr-Coulomb criterion in
three dimensions [19, 20].
.2 oct ma b (13)
Where:
1 3.2
2
m
(14)
a and b are the material constants whose values
could be obtained from the drawn failure push in
oct -m.2. Uniaxial compressive and tensile
strengths are obtained by the following equations.
2( )
3 2
c
a
b
(15)
2( )
3 2
t
a
b
(16)
4. Least squares approximation method
A good curve fitting not only requires a complete
range of data, but also relies on the application of
an appropriate mathematical method. Many
mathematical methods have been proposed for
curve fitting. Among various linear methods used
for estimating model parameters (β), the ordinary
least squares (OLS) method is known as the most
popular and dominant approach due to its desired
properties. Attributed to the German
mathematician Karl Fredrick Gauss, this method
seeks fitting the best regression line to all data
points by minimizing the sum of error terms
squared.
1 2 i i iy x e (17)
where xi is the independent variable, yi is the
dependent variable, and ei is the statistical error
that is a measure of deflection of yi from a
straight-line. Therefore, the OLS method tries to
minimize Equation (11) (see Figure 6):
2 2 21 2min ( ) ( ) i i i i ie y y y (18)
By minimizing Eq. (11), the OLS method
presents estimations of the parameters that are
calculated as follows:
2 2
1 2 2( )
i i i i i i
i i
x y x x x y
N x x (19)
2 22
i i
i
x y
x N x (20)
where N is the number of samples and x
represents the average of the independent
variables [22].
Figure 6. Linear curve fitting to data points.
5. Proposed failure criterion
Differently from other 3D failure criteria that are
related to the first stress invariant with the third
deviatoric stress invariant, the Lade’s failure
criterion uses a special relationship between the
first and third stress invariants. Therefore, we
fitted various functions on the dataset in the first
and third stress invariant spaces. The proposed
empirical failure criterion is described as a
relationship between the first and third stress
invariants in a compressive zone and maximum
and minimum stresses in the tensile zone:
(1/3)3 1 3 3
1 3 3
( ), 0
8 , 0
i a b i m
a
b
(21)
where 1i and 3i are the first and third stress
invariants, and can be calculated by Eq. (22),
respectively; and b denote material constants
which can be obtained by fitting a straight line to
the data in the (1/3)
3 1i i space.
1 1 2 3
3 1 2 3
i
i
(22)
In addition, m is the ductile limit correction
factor and can be calculated as follows:
Moshrefi et al./ Journal of Mining & Environment, Published online
3max 3min
53max
m
(23)
where 3min and 3max are the minimum and
maximum confining pressures among the
understudied datasets; m changes between
0 m 0.2. For the elastic zone (1>4.43), m=0
and ductile zone (1 4.43), m is calculated by
Eq. (23).
The uniaxial compressive (c) and tensile
strength (t) can be found by substituting 3=0
and 1=0 in Eq. (21), and thus:
c
a
b (24)
8t
a
b (25)
6. Performance evaluation indices for
prediction model
Various statistical indices have been proposed to
investigate the quality of curve fitting and
accurate predictions. Since each performance
evaluation index considers a certain aspect, seven
indices were used to evaluate the proposed
criterion. Of these, two indices are of standard
average error family: standard mean squared
error (MSE) and root-mean-square error (RMSE).
Two indices are the mean absolute error (MAE)
and root mean squared error (RMSE), and the
other two indices are related to the percent errors:
prediction percent error (APe) and squared
average prediction percent error (AVPE). The
smaller the above indices, the more accurate the
predictions are made by the corresponding
criterion [23, 24].
21 exp 1
1( ) i icalMSE
n (26)
21 exp 1( )
i ical
RMSEn
(27)
1 1 exp( ) ical i
MAEn
(28)
1 1exp
1exp
100 %
cal
eP
(29)
e
e
pAP
n (30)
21 eAVPE p
n (31)
The remaining two indices are coefficient of
determination (R2) and accommodation
coefficient ( 2 ). Coefficient of determination
represents the percentage of data that is closer to
the fitted line, and can be calculated by Eq. (32).
The value for the coefficient of determination
ranges within 20 1R . The closer the coefficient
approaches to 1, the better the fitting is. 2 is
greater than or equal to 0 ( 2 0 ). The smaller the
value for 2 is, the better the strength criterion
accords with the triaxial test data [25].
21 exp 1 1 exp 12
2 2 2 2 2 21 exp 1 exp 1 1
( / )
[ ( ) / ][ ( ) / ]
i ical i ical
i i ical ical
nR
n n
(32)
2( )1 exp 12
2)1 exp 1 exp
i ical
i i
(33)
In the above relationships, 1iexp and 3iexp
represent the maximum and minimum observed
stresses, respectively, while 1ical denotes the
predicted ultimate stress and n is the number of
observations.
7. Comparison between proposed criterion
and conventional triaxial criteria
In this section, 50 datasets (results of uniaxial and
triaxial tests on shale samples) given in table 1
were used to the undertake regression analysis to
obtain constants and statistical indices for model
evaluation. Linear regression was used in the
statistical analysis phase. Nonlinear indices were
also converted into linear models by variable
conversion. Eqs. (19) and (20) were utilized to
calculate the constants and coefficients.
In the present research work, SPSS 23, Sigma
Plot 12.3, MATLAB 2016, and Excel 2013 were
utilized to undertake statistical analyses,
determine the coefficients and indices, and plot
the results.
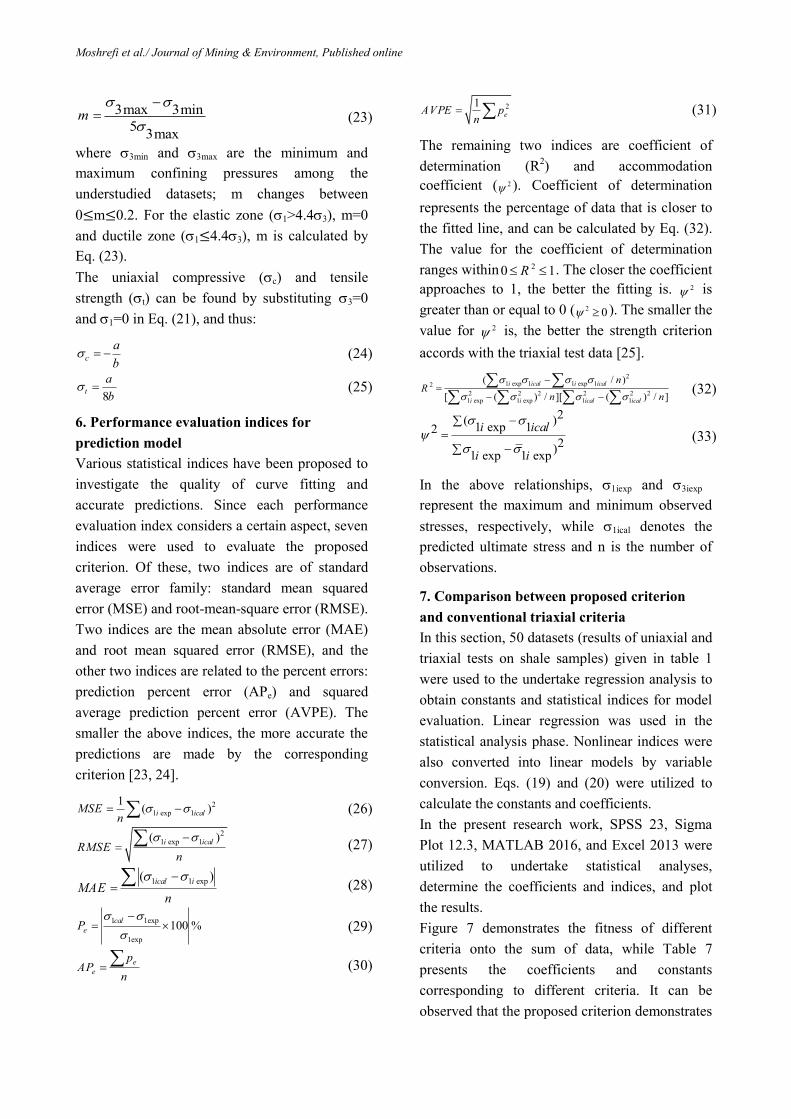
Figure 7 demonstrates the fitness of different
criteria onto the sum of data, while Table 7
presents the coefficients and constants
corresponding to different criteria. It can be
observed that the proposed criterion demonstrates
Moshrefi et al./ Journal of Mining & Environment, Published online
the best linear fitness value (0.98). Based upon
the coefficients obtained and the presented
equations in Section 3, the uniaxial compressive
strength was calculated for each criterion and
then compared against the experimental values.
Since more than one uniaxial compressive test
results existed within the database, their average
value was taken as the experimental uniaxial
compressive strength. Table 8 demonstrates the
corresponding predicted uniaxial compressive
strength and the error associated with each
criterion. In this table, it can be observed that,
compared to the other criteria, the proposed
criterion provides a more realistic prediction of
uniaxial compressive strength. This is while other
criteria, particularly the Hoek-Brown and
Mohr-Coulomb criteria, overestimate the uniaxial
compressive strength.
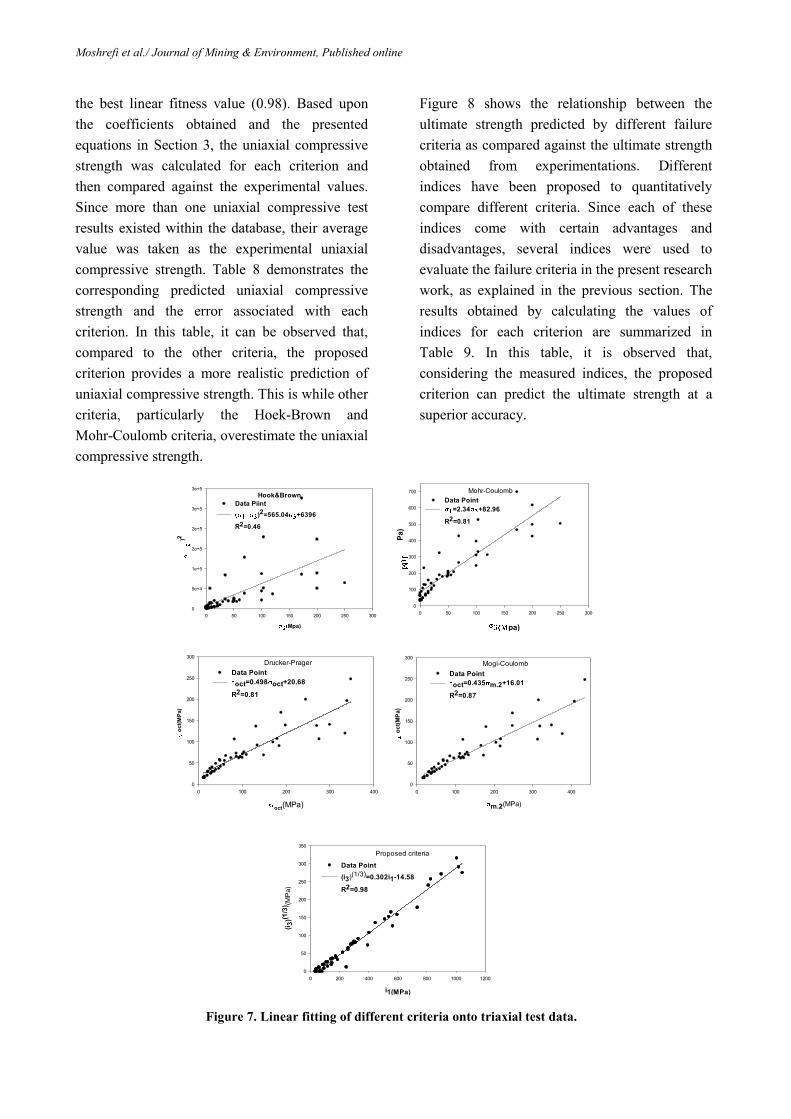
Figure 8 shows the relationship between the
ultimate strength predicted by different failure
criteria as compared against the ultimate strength
obtained from experimentations. Different
indices have been proposed to quantitatively
compare different criteria. Since each of these
indices come with certain advantages and
disadvantages, several indices were used to
evaluate the failure criteria in the present research
work, as explained in the previous section. The
results obtained by calculating the values of
indices for each criterion are summarized in
Table 9. In this table, it is observed that,
considering the measured indices, the proposed
criterion can predict the ultimate strength at a
superior accuracy.
Hook&Brown
Mpa)
0 50 100 150 200 250 300
()2
0
5e+4
1e+5
2e+5
2e+5
3e+5
3e+5
Data Piint
)2=565.04 +6396
R2=0.46
Mohr-Coulomb
pa)
0 50 100 150 200 250 300
Pa
)
0
100
200
300
400
500
600
700
Data Point
=2.34 +82.96
R2=0.81
Drucker-Prager
oct(MPa)
0 100 200 300 400
oct(
MP
a)
0
50
100
150
200
250
300
Data Point
oct=0.498 oct+20.68
R2=0.81
Mogi-Coulomb
m.2(MPa)
0 100 200 300 400
oct(
MP
a)
0
50
100
150
200
250
300
Data Point
oct=0.435 m.2+16.01
R2=0.87
Proposed criteria
i1(MPa)
0 200 400 600 800 1000 1200
(i3
)(1/3
) (MP
a)
0
50
100
150
200
250
300
350
Data Point
(i3)(1/3)=0.302i1-14.58
R2=0.98
Figure 7. Linear fitting of different criteria onto triaxial test data.
Moshrefi et al./ Journal of Mining & Environment, Published online
Table 7. Parameters obtained from fitting different failure criteria to available data.
Parameters Equation R2 Criteria
c 79.97 m=7.06 2 2
1 3 3( ) c cm s 0.46 Hoek&Brown
82.96 N=2.34 1 3c N 0.93 Mohr-Coulomb
m=0.498 K=20.68 oct octk m 0.81 Drucker-Prager
b=0.435 a=16.01 .2oct ma b 0.87 Mogi-Coulomb
b=0.302 a=-14.58 1
33 1 3( )I a b I m 0.98 Proposed criteria
Hook&Brown
Predicted value of ultimate strength(MPa)
0 200 400 600 800
Me
as
ure
d v
alu
es
ult
ima
te s
tre
ng
th(M
Pa
)
0
200
400
600
800
Data point
y=x
R2=0.82
RMSE=69.98
AVPE=58.85
Mohr-Coulomb
Predicted value of ultimate strength(MPa)
0 200 400 600 800
Me
as
ure
d v
alu
e o
f u
ltim
ate
str
en
gth
(MP
a)
0
200
400
600
800
Data Point
y=x
R2=0.81
RMSE=72.65
AVPE=55.70
Drucker-Prager
Predicted value of ultimate strength(MPa)
0 200 400 600 800
Me
as
ure
d v
alu
e o
f u
ltim
ate
str
en
gth
(MP
a)
0
200
400
600
800
Data Point
y=x
R2=0.80
RMSE=75.02
AVPE=41.92
Mogi-Coulomb
Predicted value of ultimate strength (MPa)
0 200 400 600 800
Me
as
ure
d v
alu
e o
f u
ltim
ate
str
en
gth
(M
Pa
)
0
200
400
600
800
Data Point
Y=X
R2=0.76
RMSE=76.64
AVPE=38.45
Proposed criteria
Ptrdicted values of ultimat strength(MPa)
0 200 400 600 800
Me
as
ure
d v
alu
es
of
ult
imat
str
en
gth
(MP
a)
0
200
400
600
800
Data Point
Y=X
R2=0.84
RMSE=68.29
AVPE=34.97
Figure 8. Relationship between, predicted and measured values for ultimate strength for all failure criteria.
Table 8. Predicted and measured uniaxial compressive strengths considering different failure criteria, in MPa.
Type Experimental Hoek&Brown
Mohr-
Coulomb
Drucker-
Prager Mogi-Coulomb
Proposed
criterion
Predict Error Predict Error Predict Error Predict Error Predict Error
UCS 50.80 77.38 26.58 80.23 29.43 76.87 26.06 75.65 24.76 49.32 1.57
c

Moshrefi et al./ Journal of Mining & Environment, Published online
Table 9. Statistical indices associated with predicting entire database on the basis of different failure criteria.
MAE 2 Pe AVPE MSE RMSE R2 Criteria
53.02 0.172 42.89 58.85 4897.20 69.98 0.82 Hoek&Brown
48.89 0.187 37 55.57 5278.02 72.65 0.81 Mohr-Coulomb
48.75 0.20 30.44 41.92 5628 75.02 0.80 Drucker-Prager
48.91 0.209 28.65 38.45 5873.68 76.64 0.76 Mogi-Coulomb
43.14 0.158 27 34.97 4663.57 68.29 0.84 Proposed criterion
8. Further testing of proposed failure criterion
Since one of the most important objectives
followed in the present research work was to use
the proposed failure criterion for an oil/gas
well-stability analysis, this section is dedicated to
the investigation of the accuracy of the proposed
model in predicting the ultimate strength at
ductile failure and also the performance of the
proposed model in terms of strength prediction in
deep shale samples.
8.1. Performance of proposed criterion at
ductile failure
Deformation behavior most of rocks (shales, in
particular) changes from brittle mode to ductile
mode. Therefore, the failure envelope reduces
near the brittle-to-ductile mode transition
pressure. The newly proposed criterion uses
coefficient m to predict the ultimate strength
under the ductile failure mode. For this propose,
the Mogi transition criterion (1=4.43) was
employed to distinguish the ductile data and
investigate the model accuracy in predicting the
ultimate strength (see Figure 9).
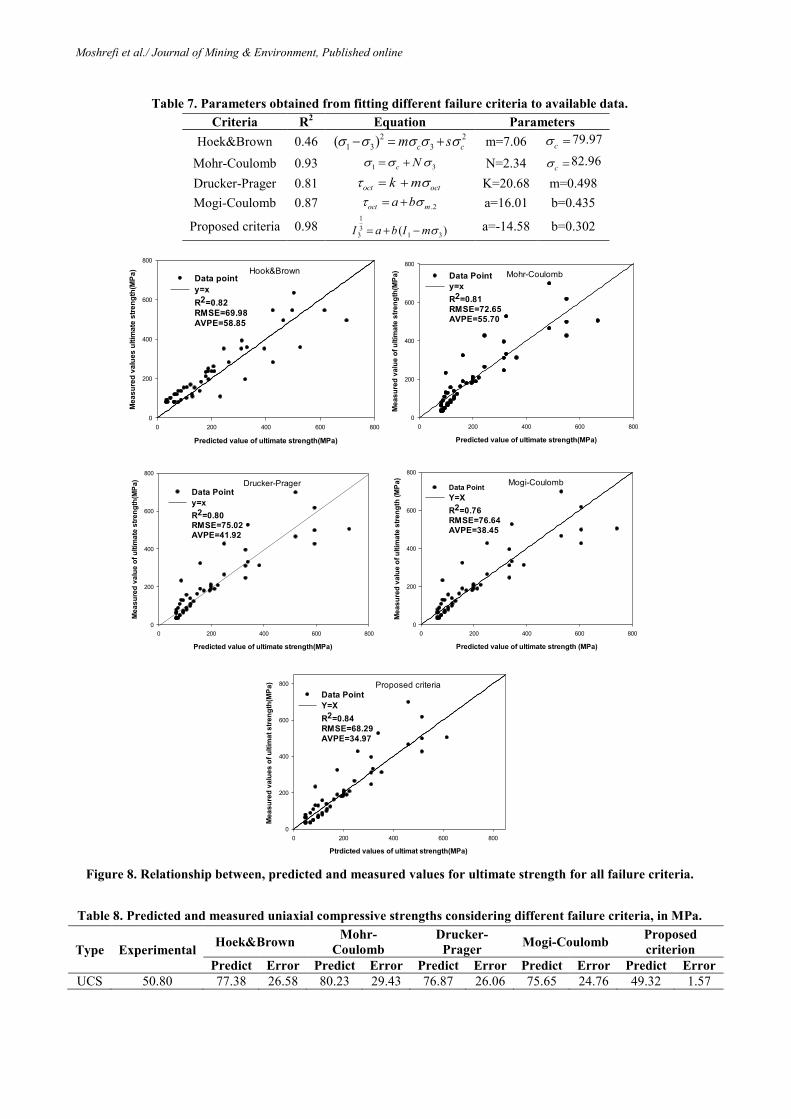
Figure 10 demonstrates the relationship between
the predicted and measured values within the
ductile zone. Moreover, Table 10 presents the
calculated statistical indices for comparing
various criteria within the ductile zone.
Accordingly, it was observed that the proposed
criterion was superior over other criteria in terms
of accuracy within the ductile zone as well. In
other words, the proposed criterion could be used
in a wide range of stress values.
8.2. Performance of proposed criterion in
predicting strength of deep shale samples
Using the data obtained from multistage triaxial
tests conducted on deep shale samples taken from
the southwestern oilfields in Iran, the coefficients
corresponding to different criteria were
determined by fitting curves to the data points.
Figure 11 and Table 11 show the fitness curve
and coefficients obtained for each model,
respectively. The data is shown in Table 3.
(MPa)
0 50 100 150 200 250 300
(Mp
a)
0
100
200
300
400
500
600
Data Point
=4.4
Ductile Zone
Brittle Zone
Mogi’sbrittle–ductile
transition limit
Figure 9. Separation of data points associated with brittle and ductile zones.
Moshrefi et al./ Journal of Mining & Environment, Published online
Hook&Brown
Predicted value of ultimate strength(Mpa)
0 200 400 600 800
Me
as
ure
d v
alu
e o
f u
ltim
ate
str
en
gth
(MP
a)
0
200
400
600
800
Data Point
y=x
R2=0.75
RSME=78.96
AVPE=19.42
Mohr-Coulomb
Predicted value of ultimate strength(MPa)
0 200 400 600 800
Mea
su
red
va
lue o
f u
ltim
ate
str
en
gth
(MP
a)
0
200
400
600
800
Data Point
y=x
R2=0.74
RSME=80.63
AVPE=16.71
Deracker-Prager
Predicted value of ultimate strength(MPa)
0 200 400 600 800
Me
as
ure
d v
alu
e o
f u
ltim
ate
str
en
gth
(MP
a)
0
200
400
600
800
Data Point
y=x
R2=0.67
RSME=90.67
AVPE=19.86
Mogi-Coulomb
Predicted value of ultimate strength(MPa)
200 300 400 500 600 700 800
Me
as
ure
d v
alu
e o
f u
ltim
ate
str
en
gth
(MP
a)
200
300
400
500
600
700
800
Data Point
y=x
R2=0.64
RSME=95.03
AVPE=21.01
Proposed criteria
Predicted value of ultimate strength(MPa)
0 200 400 600 800
Me
as
ure
d v
alu
e o
f u
ltim
ate
str
en
gth
(MP
a)
0
200
400
600
800
Data Point
y=x
R2=0.76
RSME=77.68
AVPE=15.15
Figure 10. Relationship between measured and predicted values of ductile failure data for different failure
criteria.
Table 10. Statistical indices corresponding to prediction of various criteria based on data within ductile zone.
MAE Pe AVPE MSE RMSE R2 Criteria
58.56 0.250 16.74 19.42 6234.68 78.96 0.75 Hoek&Brown
53.04 0.261 13.14 16.71 6501.19 80.63 0.74 Mohr-Coulomb
60.47 0.330 15.28 19.86 8221.04 90.67 0.67 Drucker-Prager
62.93 0.362 15.99 21.01 9030.70 95.03 0.64 Mogi-Coulomb
48.03 0.242 11.77 15.15 6034.18 77.68 0.76 Proposed criterion
2

Moshrefi et al./ Journal of Mining & Environment, Published online
Mohr-Coulomb
MPa)
0 10 20 30 40 50
(MP
a)
100
120
140
160
180
200
220
240
260
280
Data Point
=2.40 +140.20
R2=0.71
Hook&Brown
MPa)
0 10 20 30 40 50 60
15000
20000
25000
30000
35000
40000
45000
50000
Data Point
( - =478.65 +19491
R2=0.43
Drucker-Prager
oct(MPa)
40 60 80 100 120
oc
t(M
Pa
)
60
70
80
90
100
Data Point
oct=0.553 oct+36.05
R2=0.78
Mogi-Coulomb
m.2(MPa)
60 80 100 120 140 160
oc
t(M
Pa)
60
70
80
90
100
Data Point
oct=0.481 m.2+28.03
R2=0.84
Proposed criteria
i1(MPa)
150 200 250 300 350
(i3
)(1/3
) (MP
a)
20
40
60
80
100
Data Point
(i3)1/3=0.335i1-31.96
R2=0.95
Figure 11. Linearly fitted curves to experimental data obtained from samples taken from Iranian southern
oilfields for different failure criteria.
Table 11. Coefficients obtained by fitting curves corresponding to different failure criteria onto experimental
data obtained from tests undertaken on samples taken from Iranian southern oilfields.
Parameters Equation R2 Criteria
139.60 m=3.42 2 2
1 3 3( ) c cm 0.43 Hoek&Brown
140.20 N=2.40 1 3c N 0.71 Mohr-Coulomb
m=0.553 K=36.05 oct octk m 0.78 Drucker-Prager
b=0.481 a=28.03 .2oct ma b 0.84 Mogi-Coulomb
b=0.325 a=-31.96 1
33 1 3( )I a b I m 0.95 Proposed criterion
c
c

Moshrefi et al./ Journal of Mining & Environment, Published online
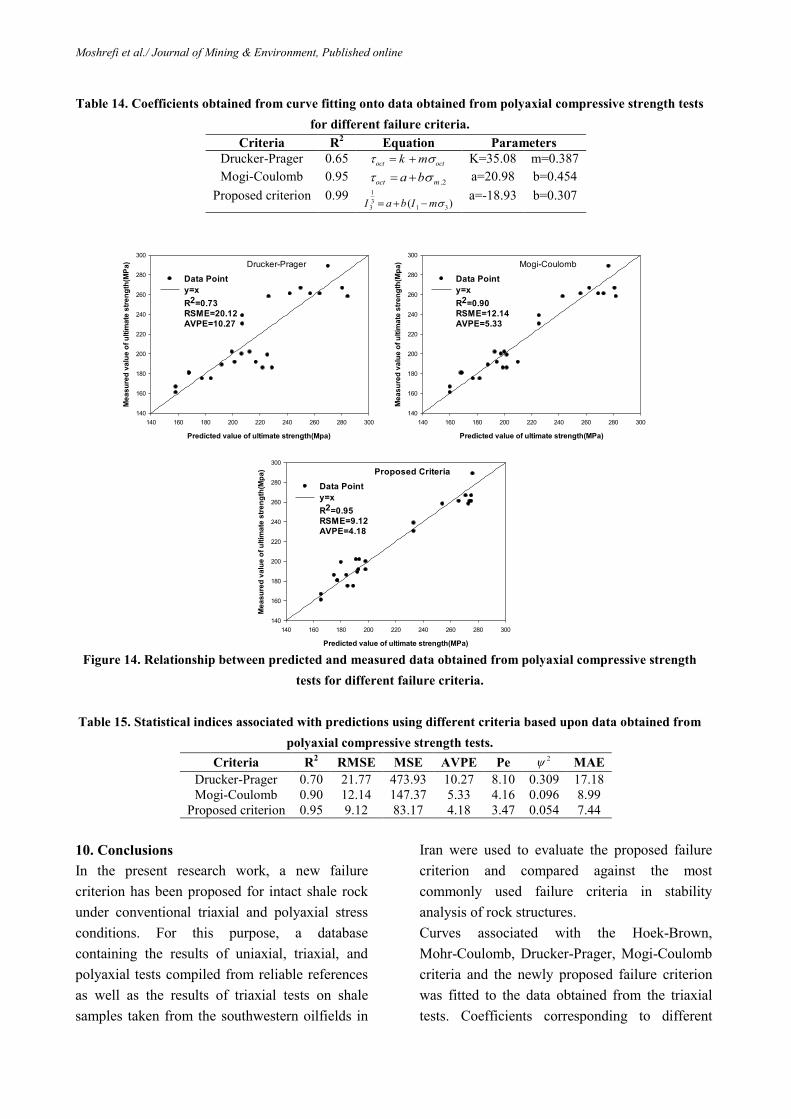
Figure 12 shows the relationship between the
predicted values for ultimate strength by different
criteria and the one obtained from
experimentation. In addition, Table 12 presents
the results obtained by calculating different
indices for each failure criterion. According to
this table, the newly proposed failure and
Hoek-Brown criteria ended up with equal MSE
and RMSE, but AVPE and MAE of the proposed
failure criterion were lower than those of the
Hoek-Brown criterion. Undertaking tensile
strength tests on the samples, tensile strength was
calculated based upon the determined coefficients
and the presented equations in Section 3, and
then the results were compared against those
measured in the tests. The results are summarized
in Table 13. These results indicate small errors
associated with the proposed failure criterion
when it comes to predicting the tensile strength,
as compared to the other failure criteria (data
shown in Table 5).
Hook&Brown
Predicted value of ultimate strength(Mpa)
140 160 180 200 220 240 260 280
Me
as
ure
d v
alu
e o
f u
ltim
ate
str
en
gth
(Mp
a)
140
160
180
200
220
240
260
280
Data Point
y=x
R2=0.73
RMSE=18.77
APVE=8.91
Mohr-Coulomb
Predicted value of ultimate strength(MPa)
140 160 180 200 220 240 260 280
Mea
su
red
va
lue o
f u
ltim
ate
str
en
gth
(MP
a)
140
160
180
200
220
240
260
280
Data Point
y=x
R2=0.71
RMSE=19.23
AVPE=8.96
Drucker-Prager
Predicted value of ultimate strength(MPa)
140 160 180 200 220 240 260 280
Me
as
ure
d v
alu
e o
f u
ltim
ate
str
en
gth
(MP
a)
140
160
180
200
220
240
260
280
Data Point
y=x
R2=0.68
RMSE=20.34
AVPE=9.11
Mogi-Coulomb
Predicted value of ultimate strength(MPa)
140 160 180 200 220 240 260 280
Me
as
ure
d v
alu
e o
f u
ltim
ate
str
en
gth
I(M
Pa
)
140
160
180
200
220
240
260
280
Data Point
y=x
R2=0.66
RMSE=21.03
AVPE=9.41
Proposed criteria
Predicted value of ultimate strength(MPa)
140 160 180 200 220 240 260 280
Me
as
ure
d v
alu
e o
f u
ltim
ate
str
en
gth
(MP
a)
140
160
180
200
220
240
260
280
Data Point
y=x
R2=0.73
RMSE=18.8
AVPE=8.50
Figure 12. Relationship between measured and predicted values for ultimate strength on samples taken from
Iranian southern oilfields for different failure criteria.
Moshrefi et al./ Journal of Mining & Environment, Published online
Table 12. Statistical indices associated with predicting different criteria based upon experimental data from
samples taken from Iranian southern oilfields.
MAE Pe AVPE MSE RMSE R2 Criteria
14.70 0.271 7.25 8.91 353.44 18.80 0.73 Hoek&Brown
15.47 0.285 7.55 8.96 369.80 19.23 0.71 Mohr-Coulomb
14.60 0.318 6.91 9.11 413.71 20.34 0.68 Drucker-Prager
14.88 0.340 7 9.41 442.26 21.03 0.66 Mogi-Coulomb
12.99 0.271 6.14 8.50 353.50 18.80 0.73 Proposed criterion
Table 13. Predicted and measured tensile strength for different failure criteria, in MPa.
Type Experimental Hoek&Brown
Mohr-
Coulomb
Drucker-
Prager
Mogi-
Coulomb
Proposed
criterion
Predict Error Predict Error Predict Error Predict Error Predict Error
BST 13.65 5.84 7.81 58.41 44.76 42.90 29.25 39.37 25.72 12.29 1.36
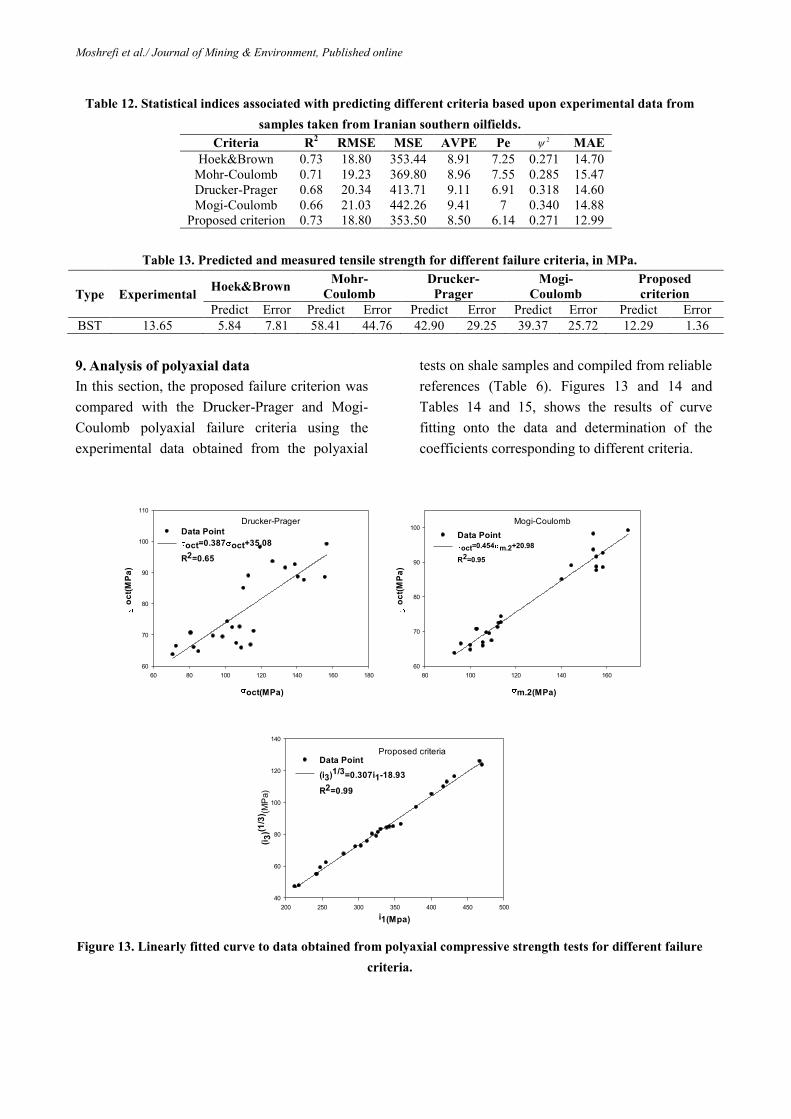
9. Analysis of polyaxial data
In this section, the proposed failure criterion was
compared with the Drucker-Prager and Mogi-
Coulomb polyaxial failure criteria using the
experimental data obtained from the polyaxial
tests on shale samples and compiled from reliable
references (Table 6). Figures 13 and 14 and
Tables 14 and 15, shows the results of curve
fitting onto the data and determination of the
coefficients corresponding to different criteria.
Drucker-Prager
oct(MPa)
60 80 100 120 140 160 180
oc
t(M
Pa
)
60
70
80
90
100
110
Data Point
oct=0.387 oct+35.08
R2=0.65
Mogi-Coulomb
m.2(MPa)
80 100 120 140 160
oc
t(M
Pa
)
60
70
80
90
100
Data Point
oct=0.454 m.2+20.98
R2=0.95
Proposed criteria
i1(Mpa)
200 250 300 350 400 450 500
(i3
)(1/3
) (MP
a)
40
60
80
100
120
140
Data Point
(i3)1/3=0.307i1-18.93
R2=0.99
Figure 13. Linearly fitted curve to data obtained from polyaxial compressive strength tests for different failure
criteria.
2
Moshrefi et al./ Journal of Mining & Environment, Published online
Table 14. Coefficients obtained from curve fitting onto data obtained from polyaxial compressive strength tests
for different failure criteria.
Parameters Equation R2 Criteria
m=0.387 K=35.08 oct octk m 0.65 Drucker-Prager
b=0.454 a=20.98 .2oct ma b 0.95 Mogi-Coulomb
b=0.307 a=-18.93 0.99 Proposed criterion
Drucker-Prager
Predicted value of ultimate strength(Mpa)
140 160 180 200 220 240 260 280 300
Me
as
ure
d v
alu
e o
f u
ltim
ate
str
en
gth
(MP
a)
140
160
180
200
220
240
260
280
300
Data Point
y=x
R2=0.73
RSME=20.12
AVPE=10.27
Mogi-Coulomb
Predicted value of ultimate strength(MPa)
140 160 180 200 220 240 260 280 300
Me
as
ure
d v
alu
e o
f u
ltim
ate
str
en
gth
(Mp
a)
140
160
180
200
220
240
260
280
300
Data Point
y=x
R2=0.90
RSME=12.14
AVPE=5.33
Proposed Criteria
Predicted value of ultimate strength(MPa)
140 160 180 200 220 240 260 280 300
Me
as
ure
d v
alu
e o
f u
ltim
ate
str
en
gth
(Mp
a)
140
160
180
200
220
240
260
280
300
Data Point
y=x
R2=0.95
RSME=9.12
AVPE=4.18
Figure 14. Relationship between predicted and measured data obtained from polyaxial compressive strength
tests for different failure criteria.
Table 15. Statistical indices associated with predictions using different criteria based upon data obtained from
polyaxial compressive strength tests.
MAE Pe AVPE MSE RMSE R2 Criteria
17.18 0.309 8.10 10.27 473.93 21.77 0.70 Drucker-Prager
8.99 0.096 4.16 5.33 147.37 12.14 0.90 Mogi-Coulomb
7.44 0.054 3.47 4.18 83.17 9.12 0.95 Proposed criterion
10. Conclusions
In the present research work, a new failure
criterion has been proposed for intact shale rock
under conventional triaxial and polyaxial stress
conditions. For this purpose, a database
containing the results of uniaxial, triaxial, and
polyaxial tests compiled from reliable references
as well as the results of triaxial tests on shale
samples taken from the southwestern oilfields in
Iran were used to evaluate the proposed failure
criterion and compared against the most
commonly used failure criteria in stability
analysis of rock structures.
Curves associated with the Hoek-Brown,
Mohr-Coulomb, Drucker-Prager, Mogi-Coulomb
criteria and the newly proposed failure criterion
was fitted to the data obtained from the triaxial
tests. Coefficients corresponding to different
1
33 1 3( )I a b I m
2
Moshrefi et al./ Journal of Mining & Environment, Published online
criteria were calculated. Afterwards, the
compressive and ultimate strength values were
predicted and compared. The newly proposed
failure criterion was found to produce the lowest
RMSE and the best statistical indices.
In order to test the performance of the newly
proposed criterion within the ductile zone, the
Mogi transition criterion was used to separate the
data points within the ductile zone, with the
coefficients and statistical indices determined for
different failure criteria. The results obtained
were indicative of the superior accuracy of the
proposed failure criterion in predicting the
ultimate strength within a wide range of stresses.
In order to further test the proposed criterion,
deep samples taken from the southwestern
Iranian oilfields were subjected to multi-stage
triaxial tests, and different criteria were fitted to
the data obtained, with the corresponding
statistical coefficients and indices calculated. The
results obtained show the higher accuracy of the
proposed failure criterion in predicting the
ultimate strength. In addition, the tensile test
results on samples were compared with the
predicted uniaxial tensile strength values
obtained on the basis of different criteria,
indicating that the proposed criterion could
predict the tensile strength at a minimum error.
In order to test the performance of the proposed
failure criterion under the polyaxial stress
conditions using curve fitting onto the polyaxial
test data on shale samples, the statistical
coefficients and indices were determined and the
indices corresponding to the proposed failure
criterion are compared against the
Drucker-Prager and Mogi-Coulomb criteria. The
results obtained indicate that the proposed
criterion exhibits the best agreement with the
experimental data.
In general, it was observed that the proposed
failure criterion was well in agreement with the
uniaxial, triaxial, and polyaxial
compressive/tensile strength tests, so that it could
be used within a wide range of stress values.
Acknowledgments
We wish to acknowledge the favor and
cooperation of the National Iranian
South Oil Company (NISOC) authorities,
especially Mr. Baghadashtaki who helped us in
the preparation of deep shale specimens.
References
[1]. Islam, A. and Skalla, P. (2009). Mud design
models for underbalance drilling wells in shale. Int.
conference on mechanical engineering. Daka.
Bangladesh.
[2]. Rafiai, H. (2011). New empirical polyaxial criteria
for rock. Internation Journal of Rock Mechanics &
Mining Sciences. 48: 922-931.
[3]. Mohr, O. (1900). Welche Umstände bedingen die
Elastizitätsgrenze und den Bruch eines Materials.
Zeitschrift des Vereins Deutscher Ingenieure. 46
(1524-1530): 1572-1577.
[4]. Fairhurst, C. (1964). On the validity of the
Brazilian test for brittle materials. Int. J. Rock Mech
Min Sci. 1: 515-546.
[5]. Hobbs, D.W. (1964). The strength and the stress-
strain characteristics of coal in triaxial compression.
The Journal of Geology. 72 (2): 214-231.
[6]. Murrell, S.A.F. (1965). The effect of triaxial stress
systems on the strength of rocks at atmospheric
temperatures. Geophysical Journal International. 10
(3): 231-281.
[7]. Franklin, J.A. (1971). Triaxial strength of rock
material. Rock Mech. 3: 86-98.
[8]. Bieniawski, Z.T. (1974). Estimating the strength of
rock materials. J S Afr Inst Min Metall. 74: 312-320.
[9]. Hoek, E. and Brown, E.T. (1980). Empirical
strength criterion for rock masses. Journal of
Geotechnical Engineering Division, ASCE. 106 (9):
1013-1035
[10]. Yudhbir, Y., Lemanza, W. and Prinzl, F. (1983).
An empirical failure criterion for rock masses. In 5th
ISRM Congress. International Society for Rock
Mechanics.
Moshrefi et al./ Journal of Mining & Environment, Published online
[11]. Ramamurthy, T., Rao, G.V. and Rao, K.S. (1985).
A strength criterion for rocks. In: Proceedings of the
Indian Geotechnical Conference. Roorkee. pp. 59-64.
[12]. Johnston, J.W. (1985). Strength of intact
geomechanical materials. J Geotech Eng. 111: 730-
749.
[13]. Sheorey, P.R., Biswas, A.K. and Choubey, V.D.
(1989). An empirical failure criterion for rocks and
jointed rock masses. Eng Geol. 26: 141-159.
[14]. Mogi, K. (1967). Effect of the intermediate
principal stress on rock failure. J Geophys Res. 72:
5117-5131.
[15]. Drucker, D. and Prager, W. (1952). Soil
mechanics and plastic analysis or limit design. Q Appl
Math. 10: 157-165.
[16]. Lade, P. and Duncan, J. (1975). Elasto-plastic
stress–strain theory for cohesion less oil. J Geotech
Eng Div ASCE. 101: 1037-1053.
[17]. Zhou, S. (1994). A program to model the initial
shape and extent of borehole breakout. Comput Geosci.
20 (7/8): 1143-1460.
[18]. You, M.Q.(2009). True-triaxial strength criteria
for rock. Int J Rock Mech Min Sci. 46: 115-127.
[19]. Al-Ajmi, A.M. and Zimmerman, R.W. (2005).
Relation between the Mogi and the Coulomb failure
criteria. Int J Rock Mech Min Sci. 42: 431-439.
[20]. Sheorey, P.R. (2007). Empirical rock failure
criteria. Rotterdam. Balkema.
[21]. Gholami, R., Moradzadeh, A., Rasouli, V. and
Hanachi, J. (2014). Practical application of failure
criteria in determining safe mud weight windows in
drilling operations. Journal of Rock Mechanics &
Geotechnical Engineering. 6: 13-25
[22]. Weisberg, S. (2014). Applied linear Regression,
Th3, Wiley.
[23]. Rafiai, H., Jafari, A. and Mahmoudi, A. (2013).
Application of ANN-based failure criteria to rocks
under polyaxial stress conditions. Internation Journal of
Rock Mechanics & Mining Sciences. 59: 42-49.
[24]. Singh, M., Raj, A. and Singh, B. (2011).
Modified Mohr-Coulomb criterion for non-linear
triaxial and polyaxsial strength of intact rock. Rock
Mechanics & Mining Sciences. 48: 546-555.
[25]. Bineshian, H., Ghazvinian, A. and Bineshian, Z.
(2012). Comprehensive compressive-tensial strength
criterion for intact rock. Journal of Rock Mechanics
and Geotechnical Engineering. 4: 140-148.
زیست، چاپ آنالینپژوهشی معدن و محیط -و همکاران/ نشریه علمی مشرفی
معیار شکست تجربی جدید برای شیل
4و کامران گشتاسبی 3زاده، احمد رمضان*2، کوروش شهریار1سهیل مشرفی
گروه مهندسی معدن، واحد علوم و تحقیقات، دانشگاه آزاد اسالمی، تهران، ایران -1
دانشکده مهندسی معدن و متالورژی، دانشگاه صنعتی امیرکبیر، ایران -2
یرانادانشکده مهندسی معدن، نفت و ژئوفیزیک، دانشگاه صنعتی شاهرود، -3
ایران خش مهندسی معدن، دانشکده فنی مهندسی، دانشگاه تربیت مدرس،ب -4
3/11/7112، پذیرش 11/6/7112ارسال
[email protected]* نویسنده مسئول مکاتبات:
چکیده:
داده 33ها شاامل های مختلف تنش ارائه شده است. پایگاه دادهبینی مقاومت نهایی شیل تحت حالتدر این پژوهش یک معیار شکست تجربی جدید برای پیش
هاای تهیاه شده بر روی نمونههای سه محوره و کششی انجام های معتبر و همچنین آزمایشآوری شده از مقالههای تک، سه و چند محوره جمعاز نتایج آزمایش
بینی مقاومت نهایی شیل بار اساام معیاار پیشانهادی باا معیارهاای ها برای ارزیابی و مقایسه، دقت پیشهای نفتی جنوب غرب ایران است. دادهشده از میدان
کلمب استفاده شاد. بارای ارزیاابی و مقایساه -موگیپراگر و -کلمب، دراگر -برون، موهر -هوک مانندشکست پر کاربرد در مکانیک سنگ برای تحلیل پایداری
هاای متناا ر هار هاا و شااخص های سه و چند محوره برازش شد و ضاریب شاخص آماری مهم استفاده شد. منحنی هر یک از معیارها بر روی داده 2ها از مدل
نهادی مقاومت نهایی شیل را با دقات بیشاتری نسابت باه ساایر معیارهاا ها معیار پیشمعیار تعیین شده و با یکدیگر مقایسه شد. نتایج نشان داد در همه حالت
زناد. بارای ارزیاابی بیشاتر معیاار کند. همچنین معیار پیشنهادی مقاومت فشاری تک محوره و مقاومت کششی را با کمتارین خااا تخماین مای بینی میپیش
که نتایج نشاان های محدوده خمیری مقایسه شدا سایر معیارها با استفاده از دادههای خمیری ببینی مقاومت نهایی در شکستپیشنهادی عملکرد مدل در پیش
دهنده دقت مدل در محدوده خمیری نسب به سایر معیارها بوده است.
.چاه، مقاومت نهایی، شکست خمیری، رفتار مکانیکی ، شیل، پایداریمعیار شکست تجربی کلمات کلیدی: