EVIDENCE FROM CHINA Lily Fang Josh Lerner · [email protected] Josh Lerner Harvard Business...
49
NBER WORKING PAPER SERIES INTELLECTUAL PROPERTY RIGHTS PROTECTION, OWNERSHIP, AND INNOVATION: EVIDENCE FROM CHINA Lily Fang Josh Lerner Chaopeng Wu Working Paper 22685 http://www.nber.org/papers/w22685 NATIONAL BUREAU OF ECONOMIC RESEARCH 1050 Massachusetts Avenue Cambridge, MA 02138 September 2016 We are grateful for the helpful comments from Andrew Karolyi and two anonymous referees. We thank Harvard Business School’s Division of Research for their financial support. Patent Sight provided helpful data. Di Tang at Xia Men University helped with data collection. Seminar audiences at the American Economic Association annual meeting, Cornell University, London Business School, the Tsinghua PBSCF Conference on Entrepreneurial Finance and Innovation Around the World (especially our discussant, T.J. Wong), and the University of Pennsylvania provided helpful comments. Josh Lerner has advised institutional investors in venture capital funds, venture capital groups, and governments designing policies relevant to venture capital and innovation policy. Any errors and omissions are our own. The views expressed herein are those of the authors and do not necessarily reflect the views of the National Bureau of Economic Research. At least one co-author has disclosed a financial relationship of potential relevance for this research. Further information is available online at http://www.nber.org/papers/w22685.ack NBER working papers are circulated for discussion and comment purposes. They have not been peer-reviewed or been subject to the review by the NBER Board of Directors that accompanies official NBER publications. © 2016 by Lily Fang, Josh Lerner, and Chaopeng Wu. All rights reserved. Short sections of text, not to exceed two paragraphs, may be quoted without explicit permission provided that full credit, including © notice, is given to the source.
Transcript of EVIDENCE FROM CHINA Lily Fang Josh Lerner · [email protected] Josh Lerner Harvard Business...
NBER WORKING PAPER SERIES
INTELLECTUAL PROPERTY RIGHTS PROTECTION, OWNERSHIP, AND INNOVATION: EVIDENCE FROM CHINA
Lily FangJosh Lerner
Chaopeng Wu
Working Paper 22685http://www.nber.org/papers/w22685
NATIONAL BUREAU OF ECONOMIC RESEARCH1050 Massachusetts Avenue
Cambridge, MA 02138September 2016
We are grateful for the helpful comments from Andrew Karolyi and two anonymous referees. We thank Harvard Business School’s Division of Research for their financial support. Patent Sight provided helpful data. Di Tang at Xia Men University helped with data collection. Seminar audiences at the American Economic Association annual meeting, Cornell University, London Business School, the Tsinghua PBSCF Conference on Entrepreneurial Finance and Innovation Around the World (especially our discussant, T.J. Wong), and the University of Pennsylvania provided helpful comments. Josh Lerner has advised institutional investors in venture capital funds, venture capital groups, and governments designing policies relevant to venture capital and innovation policy. Any errors and omissions are our own. The views expressed herein are those of the authors and do not necessarily reflect the views of the National Bureau of Economic Research.
At least one co-author has disclosed a financial relationship of potential relevance for this research. Further information is available online at http://www.nber.org/papers/w22685.ack
NBER working papers are circulated for discussion and comment purposes. They have not been peer-reviewed or been subject to the review by the NBER Board of Directors that accompanies official NBER publications.
© 2016 by Lily Fang, Josh Lerner, and Chaopeng Wu. All rights reserved. Short sections of text, not to exceed two paragraphs, may be quoted without explicit permission provided that full credit, including © notice, is given to the source.

Intellectual Property Rights Protection, Ownership, and Innovation: Evidence from ChinaLily Fang, Josh Lerner, and Chaopeng WuNBER Working Paper No. 22685September 2016JEL No. G24,J33,L26
ABSTRACT
Using a difference-in-difference approach, we study how intellectual property right (IPR) protection affects innovation in China in the years around the privatizations of state-owned enterprises (SOEs). Innovation increases after SOE privatizations, and this increase is larger in cities with strong IPR protection. Our results support theoretical arguments that IPR protection strengthens firms’ incentives to innovate and that private sector firms are more sensitive to IPR protection than SOEs.
Lily FangINSEAD77300 Fontainebleau, [email protected]
Josh LernerHarvard Business SchoolRock Center 214Soldiers FieldBoston, MA 02163and [email protected]
Chaopeng WuXia Men [email protected]

2
Introduction
Harkening back to Schumpeter (1934), the literature on law and finance argues that
effective legal and financial institutions lead to better economic outcomes (e.g., King and Levine
(1993); La Porta, Lopez-de-Silanes, Shleifer, and Vishny (1998); Rajan and Zingales (1998)).
But China’s rapid economic growth in the past thirty years raises questions about this view. As
Allan, Qian, and Qian (2005) point out, China has achieved the fastest sustained growth in
history despite having poor legal and financial institutions. This suggests that, at least in the case
of China, good institutions may not be necessary for economic development.
In this paper, we reexamine the importance of institutions in China’s development by
focusing on innovation, an activity that Schumpeter identified as critical to economic change. In
this context, institutional quality is gauged by the strength of intellectual property right (IPR)
protection. Specifically, we shed light on the following three questions:
1. Where has China’s innovation taken place: in state-owned enterprises (SOEs) or in
private sector firms?
2. Are legal institutions – in particular, IPR protection – important for innovation within
China?
3. If so, are SOEs or private sector firms more sensitive to IPR protection?
China’s ability to innovate is not only an interesting and relevant question for economists,
but also a timely matter of first-order policy importance to the Chinese. It is widely accepted that,
since China’s economic reforms of the late 1970s, the country’s economic development has
largely relied on cheap labor and investments in physical infrastructure. But as China’s labor
costs have surged and growth rates have declined in recent years, this investment-driven model
based on low costs has been widely seen as obsolete. China’s top leaders are promoting
innovation as the key to the country’s sustained economic growth: for instance, in the 13th Five-
3
Year Plan released in March 2016, innovation was listed as the first guiding principle of
economic policy. 2 But the extent to which the state can drive innovation without sound
institutions and economic incentives remains in question.
There are two competing hypotheses about where innovation is likely to take place and
the importance of IPR protection in China. Entrepreneurs’ incentives to innovate—what
Schumpeter terms the “entrepreneurial spirit”— depend on their ability to capture the profit from
innovation, which in turn depends on IPR protection and institutions such as the patent system.
The danger of ex post expropriation as a result of poor IPR protection will deter innovation,
consistent with arguments in Nelson (1959) and Arrow (1962). This line of reasoning concludes
that, in China, precisely because private firms face a high risk of expropriation, institutional
quality such as IPR protection standards should be particularly important for innovation in the
private sector. We call this the “Schumpeterian view.”
On the other hand, despite the country’s poor record of IPR protection, China has in
recent years become the most prolific patent-filing country in the world.3 One explanation for
this paradox is that in the absence of legal protection, state ownership acts as an alternative
mechanism, giving state-owned firms both incentives (or directives) for innovation and
protection against expropriation. SOEs in China, in fact, have a two-tiered defense against
expropriation: through administrative measures by the government (the firms’ owners), and
through the courts, which are often biased in their favor (Snyder (2012)). This explanation
suggests that China’s innovation should be led by the SOEs, and because they rely on the state,
2 See http://www.apcoworldwide.com/docs/default-source/default-document-library/Thought-Leadership/13-five-year-plan-think-piece.pdf?sfvrsn=2 (accessed April 27, 2016) for information on and analyses of the most recent Five-Year Plan. Five-year plans are China’s top policy blueprints containing its social, economic, and political goals. As the name suggests, each plan covers a five-year period. The 13th Five-Year Plan (the most recent) covers 2016 to 2020. 3 World Intellectual Property Indicators 2014 from the World Intellectual Property Organization, http://www.wipo.int/edocs/pubdocs/en/wipo_pub_941_2014.pdf (accessed April 6, 2016).

4
institutions such as IPR protection do not matter much. We call this the “alternative mechanisms
view.”
To test these hypotheses, we compare firm-level innovation (based on patent activity) of
SOEs and private firms across Chinese cities with varying levels of IPR protection. We do not,
however, undertake a simple cross-sectional comparison, because doing so raises two
endogeneity concerns. First, SOEs and private firms are inherently different: their geographic
and industry distribution is non-random and may be related to the quality of local IPR protection.
Second, even the quality of local IPR protection itself can be an endogenous outcome of local
innovative activities (and hence demand for IPR protection), rather than having a causal effect on
innovation.
To address these empirical challenges, we exploit China’s privatizations of SOEs as an
identification method. The idea is that the privatization events result in a sharp change in the
firms’ ownership structure and state affiliation, while keeping other firm attributes fixed. We can
therefore compare the rates of innovation before and after the change in ownership within the
same firm. By studying this before-and-after difference in innovation rates across firms in
regions with varying local IPR protection standards, we can identify the joint effect of ownership
type and IPR protection. In essence, these events allow us to use a difference-in-difference
method.
For SOE privatizations to be a valid identification instrument, however, it is crucial that
these events be exogenous to the innovation process. 4 Our identification approach would be
problematic, for example, if innovative firms and entrepreneurs felt shackled by state ownership
and initiated privatizations precisely in order to engage in more innovation. Fortunately, this
concern is allayed by China’s political economic history. SOE privatizations and restructurings 4 Fan, Wong, Zhang (2013) discusses the endogenous nature of state ownership structure.

5
were key policy initiatives of China’s top leaders from 1996 to 2005 (the ten-year period
covering the 9th and 10th Five-Year Plans). This policy drive led to a massive and sweeping
privatization wave, which by some estimates ultimately privatized two-thirds of the state sector
(Gan (2009)). The overarching goal of these privatizations was to increase the efficiency of
China’s vast state sector and to transition the country from central planning to a market
orientation. By way of contrast, innovation became a policy focus quite recently.
We document three main findings. First, innovation increases significantly after firms are
privatized. On average, firms’ patent stock increases by 200%-300% in the five years after
privatization compared to the five years before. Second, the increase in innovation is
significantly larger in cities with high IPR protection than in cities with low IPR protection. A
one standard-deviation increase in local IPR protection score nearly quadruples the post-
privatization increase in patent stock. We confirm these findings not only in privatizations, but
also in a few hundred cases of the opposite type of ownership change: i.e., nationalizations.
Third, we find evidence that patents of private sector firms are cited more often and have a
greater international presence – in other words, are of higher quality – than patents of SOEs,
suggesting that the increase in patent filings is not a consequence of “window dressing.” In sum,
our evidence is strongly supportive of the Schumpeterian view that institutions matter, even in
China. It is inconsistent with the alternative mechanisms view.
We believe our paper makes two key contributions to the literature and to the policy
discussion. First, we contribute to the empirical literature on the relationship between IPR
protection and innovation, and more broadly, on institutions and growth. Many papers in the
existing literature are based on cross-country evidence, which is subject to endogeneity concerns
and unobservable heterogeneity. By focusing within one country and using the unique

6
identification strategy afforded by the privatization events, our paper improves on and adds to
the existing empirical evidence.
Our second key contribution is to the policy discussion. China’s stellar economic growth
in the last thirty years has led some scholars to argue that the nation is an exception rather than
the rule when it comes to economic development. For instance, Allen, Qian, and Qian (2005)
propose that instead of formal institutions, China’s economic development is supported by
informal mechanisms such as trust and relationships. Our evidence in this paper shows that there
is a limit to this argument. When it comes to innovation, institutional quality does matter, and it
particularly matters to private sector innovation, the source of more impactful and important
technological advancement. Our evidence suggests that the success of the current efforts by
Chinese policymakers to shift to an innovation-driven economy will depend on building more
robust institutions.5
I. Data and Descriptive Statistics
A. IPR Protection in China
China began formal recognition and protection of IPR in 1980, when it became a member
of the World Intellectual Property Organization. It patterned its IPR law on the Berne
Convention for the Protection of Literary and Artistic Works and the Agreement on Trade-
Related Aspects of Intellectual Property Rights. The letter of the law governing IPR is consistent
with international standards and is the same across the entire country. In practice, however,
5 Our conclusion is broadly consistent with and related to that of Aghion, et al. (2015), which studies a comprehensive sample of medium- and large-sized firms in China and concludes that industrial policies that foster competition enhance productivity growth. Both that paper and ours indicate the importance of market-based mechanisms for China’s future productivity growth.
7
evidence abounds that China generally has a poor record on IPR protection and that significant
variations exist across regions in their interpretation and enforcement of IPR law.
In China, IPR protection matters at a local level for several reasons. First, there is very
little forum shopping in China. Unlike in the U.S., where firms can choose the court to file law
suits, which renders the local legal environment less relevant, the Chinese Intellectual Property
Law stipulates that plaintiffs can only file lawsuits either in the location of their domicile or
where the violation occurred, i.e., the location of the defendant. 6 Reflecting both the lack of
forum-shopping and the clustering of many industries, 80% of the IPR cases in the Chinese
Judicial Case Database7 involve both plaintiffs and defendants from the same province. Second,
filing for international patent protection is still rare among Chinese firms. Even among the most
prolific Chinese patent filers, 81% do not have U.S. filings, and over 90% do not have Japanese
or European filings. International filing rates would be even lower for the average firm,
especially the non-listed firms in our sample.8 Finally, most of the companies are focused on the
domestic market: 70.2% of the firms in our sample report no export revenue. Of those that report
exports, these account for just under 20% of total sales. Thus, their patent litigation is likely to
occur primarily in the Chinese court system rather than in foreign courts.9
Empirically, Ang, Cheng, and Wu (2014) demonstrate not only that there is significant
heterogeneity in local IPR protection within China, but also that this variation leads to divergent
6 See Rule 81 of the Chinese Intellectual Property Law Implementation Details. http://www.scipo.gov.cn/zcfg/fljzcfg/201504/t20150422_15458.html (accessed May 2, 2016). 7 This is the largest legal case database in China, and it is maintained by the Beijing University. http://www.pkulaw.cn/case (accessed April 15, 2016). 8 International filing rates are estimated based on a sample of 331 most prolific Chinese patent filing companies provided to us by Patent Sight. The average firm size in our unlisted sample is 65 million RMB in total assets (roughly 8 million USD based on an exchange rate of 1 USD = 8 RMB, approximately the prevailing rates between 2002 and 2006, the peak of the privatization wave), and 1.2 billion RMB (roughly 150 million USD) in total assets in the listed sample (details of our firm sample is discussed in Section 1.C.) Given the small firm size, international filing would be very rare, though we do not have detailed statistics. 9 Keller (2002) argues that technology is largely local, not global, as he shows that the benefits from technology spillovers decline with distance.

8
economic outcomes. They examine the plaintiffs’ win rates in IPR lawsuits across Chinese
provinces, and find that this rate ranges from 25% to 87%, a large variation given the null of 50%
predicted by theory (Priest and Klein (1984)).10 They show that this regional variation in IPR
protection is related to firms’ financing choices, R&D investments, and patenting. Hsu, Wang,
and Wu (2013) show that local IPR protection reduces piracy and enhances firm value.
Measuring the quality of IPR protection and relating it to innovation is challenging,
however, because many obvious types of IPR protection measures suffer from reverse causality
concerns. For example, measures based on the existence and provisions of IP laws or the
quantity of legal professionals are subject to the concerns that laws and the legal profession
evolve endogenously in response to firms’ demands for IPR protection, rather than causing
innovation. In any event, measures based on legal provisions are infeasible in our context, as our
goal is to measure local IPR protection within a single country which has no variation in the
letter of the law. Ang, Cheng, and Wu (2014) construct two novel measures of regional IPR
protection in China, one based on plaintiff win rates in provincial courts and another based on
the frequency of media mentions of IPR in Chinese official newspapers. But these measures are
difficult to interpret11 and raise reverse causality concerns.
To overcome these difficulties, we use a survey-based prefecture level IPR index
published by the Chinese Academy of Social Sciences (CASS), the leading research institution
on social and economic issues in China. Between 2002 and 2011,12 the CASS published an
10 Priest and Klein (1984) argue that a plaintiff’s decision to litigate is endogenous and takes into account the costs and benefits of litigation. Consequently, the win rates in all courts, whether pro-plaintiff or pro-defendant in orientation, should converge to 50%. 11 For instance, a higher plaintiff win rate could indicate more severe IPR infringements rather than better protection, and more frequent media mentions could also reflect more IPR violations. 12 The CASS continued to publish annual Urban Competitiveness Reports after 2011, but used a different methodology. To maintain data consistency, our analysis uses data up to 2011. In robustness checks, we find our results to be qualitatively and quantitatively very similar if we extend the sample through 2013.

9
annual Urban Competitiveness Report based on detailed surveys of 66 prefectures13 in China
across 25 provinces. 14 The report contains separate rankings of the prefectures along many
dimensions, such as IPR protection, business openness, talent availability, and livability. The
IPR protection ranking is based on a survey of legal professionals including judges, IPR lawyers,
and corporate executives, such as CEOs and technical heads. The annual survey contains on
average over 6,000 responses, or roughly 100 per prefecture surveyed. The format of the survey
follows “The Competitiveness of Cities” report published by the World Economic Forum.
Specifically, it asks the respondents to rate from 5 (best) to 1 (worse) three areas relating to local
IPR enforcement:
1) The length of time it takes for courts to resolve IP disputes,
2) The cost of resolving the dispute as a percentage of the value of the IP under dispute,
3) The fairness of court decisions.
The responses to each of the three questions from each prefecture are aggregated as follows:
Prefecture Response = (−2) ∗ 𝑤1 + (−1) ∗ 𝑤2 + (0) ∗ 𝑤3 + (1) ∗ 𝑤4 + (2) ∗ 𝑤5 (1)
where w1 – w5 are the proportion of responses from 1 to 5, respectively. The responses to the
three questions are then averaged, and based on this average, a prefecture’s final IPR score is
calculated as follows:
𝑃𝑟𝑒𝑓𝑒𝑐𝑡𝑢𝑟𝑒 𝐼𝑃𝑅 𝑆𝑐𝑜𝑟𝑒 = 𝑃𝑟𝑒𝑓𝑒𝑐𝑡𝑢𝑟𝑒 𝐴𝑣𝑒𝑟𝑎𝑔𝑒 𝑅𝑒𝑠𝑝𝑜𝑛𝑠𝑒𝑀𝑎𝑥(𝑃𝑟𝑒𝑓𝑒𝑐𝑡𝑢𝑟𝑒 𝐴𝑣𝑒𝑟𝑎𝑔𝑒 𝑅𝑒𝑠𝑝𝑜𝑛𝑠𝑒)
(2)
13 A prefecture is an administrative division, ranking below a province and above a county in China's administrative structure. A prefecture is larger than a "city" in the usual sense of the term (i.e., a continuous urban settlement). It is an administrative unit comprised of a main central urban area (usually with the same name as the prefecture) and its larger surrounding rural area, containing many smaller cities, towns, and villages. 14 Mainland China has 31 provincial-level entities, including four provincial-level municipalities (Beijing, Tianjin, Shanghai, and Chongqing), and five autonomous regions. The four provincial-level municipalities are each considered as a prefecture for the purposes of this analysis. The six provinces/regions that are not in the survey are Gansu, Guizhou, Qinghai, Ningxia Hui Autonomous Region, Xingjian Uyghur Autonomous Region, and Tibet Autonomous Region.

10
where max(Prefecture Average Response) is the maximum response across all 66 prefectures.
Therefore, the ultimate score reflects a percentage of the highest score.
The advantage of this survey-based measure is that it directly reflects the perceived
quality of IPR protection, which affects the incentives to innovate.15 Within China, this IPR
measure is widely used by top government entities, including the State Council (China’s top
administrative authority), the National Reform and Development Commission, and the China
Academy of Urban Planning and Design.
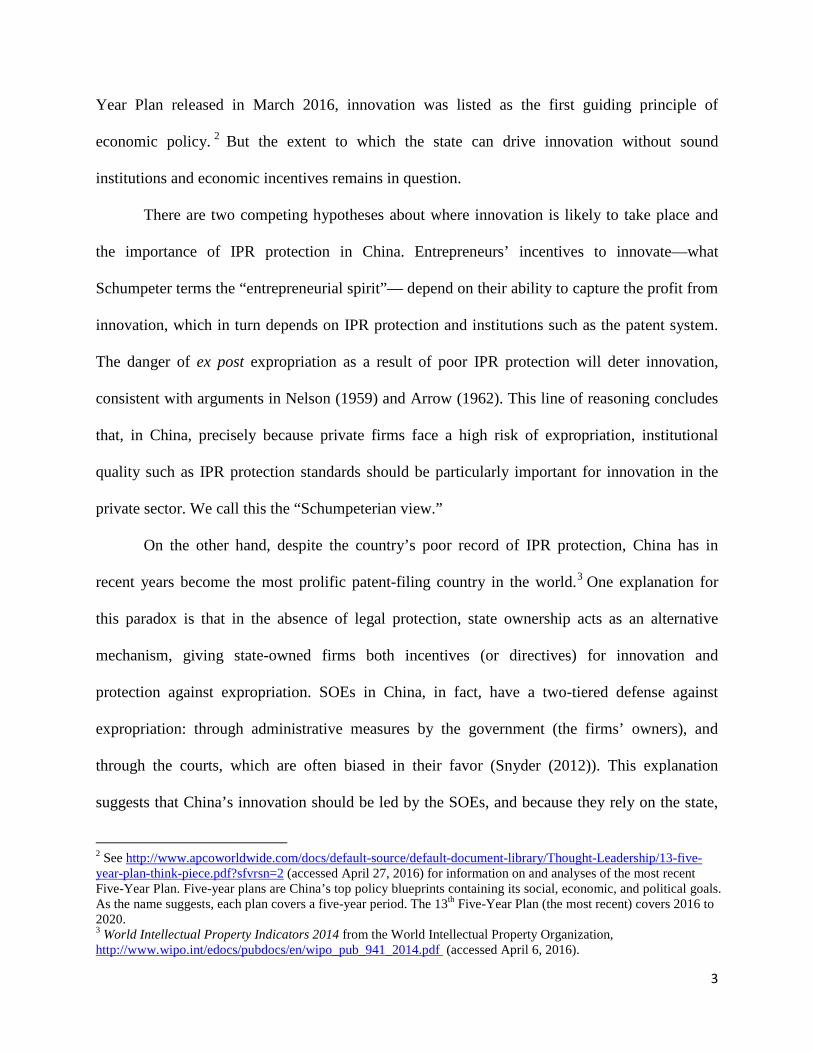
Figure 1 provides a provincial map of China and shows the regional variations in IPR
protection. Our data are at the prefecture level, but we aggregate the data to the province level
here for ease of presentation. Thus, the map does not fully represent the heterogeneity in the data.
But even at this coarse level, we see significant variations across regions. Unsurprisingly, coastal
areas, such as Shanghai, Jiangsu, and Zhejiang, have the highest levels of IPR protection. But
there are notable exceptions. For example, Guangdong Province, which is one of the most
developed regions with the highest per capita GDP, is not among the group of provinces with the
highest IPR protection scores, while inland, poorer provinces such as Anhui and Guangxi are. In
our empirical analysis, we control for provincial fixed effects to remove any region-level effects.
Table 1 provides summary statistics of the IPR protection data aggregated at the province
level. The 25 provinces in the sample are listed in ascending order of the average IPR score. The
table reveals significant time series and cross-section variation in local IPR scores. Take
Shanghai, for instance. Since it is a single prefecture, the variation in its IPR score is a function
of time only. The table shows that its highest score was 1, meaning it was the prefecture with the
15 We calculated the correlation between our survey-based measure and the two provincial-level measures used by Ang, et al. (2014). We find that the correlation between our measure and plaintiff win rate measures is 18% and the correlation between our measure and the media-based measure is 35%, both significantly different from zero. Our results are robust to using these alternative measures.

11
highest raw score (this was achieved in 2007), and its lowest score was 0.69 (this occurred in
2006). There are also significant variations across prefectures within the same province. For
instance, Jiangsu Province has an average IPR score of 0.76, ranking second highest among all
provinces. Its highest score was also 1 (obtained by Wuxi City in 2005) and its lowest score was
0.42 (Changzhou City in 2003). It might be conjectured that IPR scores are highly correlated
with a region’s coastal status. However, this conjecture overlooks the heterogeneity within
provinces. While the correlation between the mean (maximum) IPR score and the coastal status
of a province is 0.68 (0.48), the correlation between the minimum IPR score in a province and
the coast status is only 0.12. Thus, even in wealthy coastal provinces with relatively high average
IPR scores, there are prefecture-years where IPR score is low. This richness in the IPR data is
ideal for our identification strategy, which relies on SOE privatizations that occur in many
different prefectures and over a decade.
Figure 2 depicts the mean IPR trend over our sample period. We use the median in each
year to divide the sample into a “high IPR” and a “low IPR” group and plot the means of each
group. Since the IPR score is a percentage of the highest score, the mean indicates whether
various prefectures are converging to the “best,” or diverging from it. It is interesting to note that
the mean of both groups steadily rose between 2002 and 2009, but declined slightly afterwards.
This means that while perceived IPR protection quality has generally increased and converged
across prefectures, the trend shows some sign of reversing.
B. Patents
We use patents to measure firm-level innovation. Equating patents to innovation is
clearly imperfect, as noted by the literature on innovation. For example, Jaffe and Lerner (2004)

12
document numerous problems in the U.S. patent system in the last two decades, including trivial
patents being awarded and companies hoarding patents to engage in abusive, anti-competitive
behaviors. More recent empirical evidence has shown that strong IPR protection can encourage
patent assertion entities (colloquially known as “trolls”) who deter subsequent innovation (e.g.,
Cohen, Gurun, and Kominers (2016); Williams (2013)). Despite their limitations, patents remain
a standard measure of innovation. Moreover, many of the recent problems documented in the
U.S. are likely confined to highly evolved patent systems, unlike China.
We manually collect patent data for Chinese firms from the website of the Chinese State
Intellectual Property Office (CSIPO), China’s counterpart to the United States Patent and
Trademark Office (USPTO).16 The Chinese patent application procedure is similar to that in the
U.S. and Europe. Before filing an application, the applicant is encouraged to search existing
patent and publication databases to ensure the novelty of the application. After undertaking its
own examination, the CSIPO grants two types of patents for innovation: invention and utility.17
Invention patents have the highest innovative content, as they cover novel technologies. Utility
patents cover new applications of existing technologies. The innovative content in each type of
patent is reflected in the length of time required to obtain the patent. Invention patents involve
two rounds of officer examination (preliminary and detailed examinations) lasting 18 to 36
months. Utility patents require one round of examination that lasts from three to six months.
Statistics from 2012 indicate that the application success rates are 33% and 77%, respectively,
for innovation and utility patents.18
16 http://epub.sipo.gov.cn/gjcx.jsp (accessed May 2, 2016). 17 There is a third patent category, design patents. These patents cover novel packaging and design. For the purpose of this study, we focus only on invention and utility patents. 18 For more information, see the CSIPO website (accessed May 2, 2016), http://epub.sipo.gov.cn/gjcx.jsp.

13
Following prior work (e.g., Griliches (1984); Hall (1993); Hall, Jaffe and Trajtenberg
(2005)), to reflect the long-term nature of patent assets, we construct the patent stock measure as
follows:
𝐾𝑖,𝑡 = (1 − 𝜃)𝐾𝑖,𝑡−1 + 𝑟𝑖,𝑡 (3)
where
• 𝐾𝑖,𝑡 is the patent stock of firm i in year t,
• 𝜃 is the rate of depreciation of the patent stock, which is set to 15% in accordance with
prior work, and
• 𝑟𝑖,𝑡 is the ultimately granted patents applied for by firm i in year t.
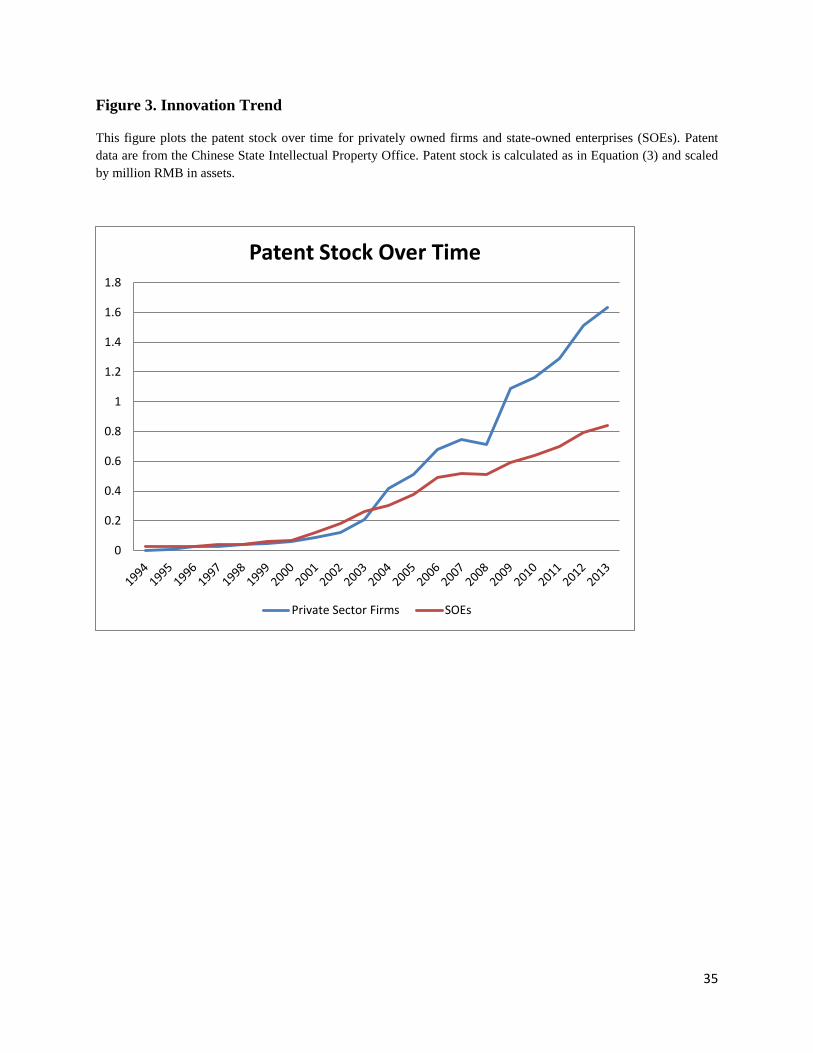
Figure 3 plots the average patent stock (scaled by million RMB in assets) for listed
Chinese companies between 1992 and 2013. We present private firms and SOEs separately (the
identification of these firm types is discussed in detail in the next sub-section). The figure shows
a steady increase of patent stock over time among both sets of firms. Notably, growth in the
patent stock among private firms accelerates after 2004, surpassing the patent stock of SOEs. In
unreported statistical tests, we find that the difference between the two sets of firms is highly
significant after 2006: SOEs dominated China’s innovation in early years but were then
surpassed by private firms. Coincidentally, 2006 was a pivotal year in China’s recent economic
history: in that year, China agreed to follow the conventions set out by the World Trade
Organization and fully implemented the revisions of its IPR legal framework, thus significantly
strengthening its IPR protection.

14
C. SOE Privatizations
In China’s transformation from a centrally planned economy to a market-oriented one,
the country experienced the largest wave of SOE privatization in history (Gan (2009)). Large-
scale SOE privatizations began in the mid-1990s as part of broad economic reforms outlined in
the 9th and 10th Five-Year Plans. Gan, Guo, and Xu (2008) estimate that between 1995 and 2005,
firms with an aggregate 11.4 trillion RMB in assets were privatized in China, comprising two-
thirds of China’s SOE and state assets.
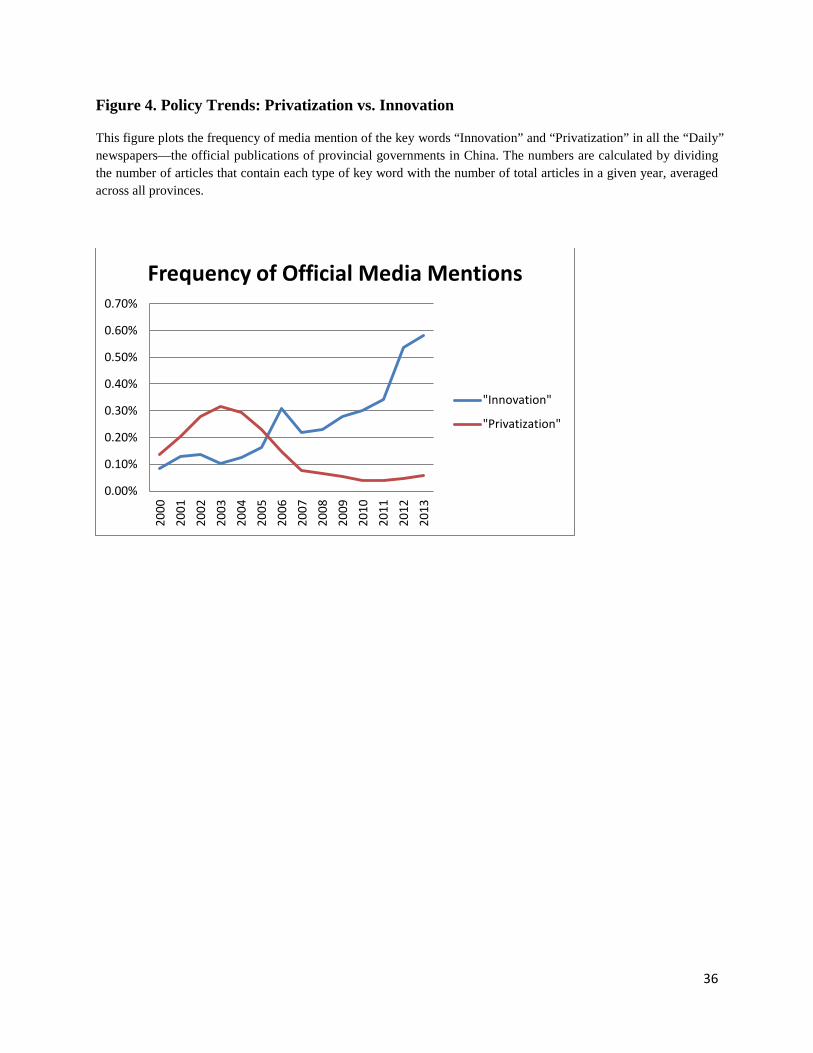
These sweeping privatizations were part of China’s overall economic reform, rather than
the result of a desire to enhance innovation. Figure 4 supports this notion. We searched the key
words “privatization” and “innovation” in all official provincial (“Daily”) newspapers between
2000 and 2013. 19 In China, the media are strictly controlled by the state. While the central
Chinese Communist Party (CCP) has the ultimate control over all newspapers, each provincial
government controls the local media and publishes three types of newspapers. The first is the
“Daily,” which is directly owned by the provincial CCP committee and whose editorial policies
are strictly supervised by CCP officials: for example, the “Beijing Daily” and the “Henan Daily”
are the official publications of those province-level governments. The second type of newspaper
is the “Evening” publication, which is owned by a CCP committee but enjoys substantially more
editorial autonomy than the “Daily.” The third type consists of subsidiary newspapers with
various names, such as the “Metro,” which enjoy further editorial autonomy though they are still
19 Newspaper articles are searched through the CNKI China Core Newspaper Full-text Database (重要报纸全文数
据库), available at http://epub.cnki.net/kns/brief/result.aspx?dbPrefix=CCND (accessed May 2, 2016). The CNKI database collects articles from 605 newspapers (which account for over 70% of the total newspaper circulation in China) since 2000 and is updated continuously.
15
controlled by the state.20 In this hierarchical and strictly controlled system, a search in the “Daily”
papers yields a clear indication of the policy focus at various points of time.
The graph shows two distinct waves of policy focus. Reflecting the historical fact that the
privatization wave occurred before the focus on innovation, we see that “privatization” enjoyed a
surge in media mentions before 2005 and then subsided. In contrast, there is a surge in the media
mentions of “innovation” after 2011. Between 2000 and 2013, we found only 55 articles that
mention both key words “privatization” and “innovation,” all of which appeared in the years
between 2011 and 2013 (as noted above, our SOE privatization sample ends in 2011).
Thus, for the purpose of analyzing innovation, SOE privatizations provide a largely
exogenous change to the ownership structure, which allows us to make a causal inference about
the relation between ownership type and innovation. If ownership type affects firms’ incentives
to innovate, then the before-and-after change in innovation as a result of SOE privatizations
should be a clean indication of that effect. In addition, if private firms are more sensitive to IPR
protection, then the before-and-after change in innovation should be larger for privatizations that
occurred in prefectures with stronger IPR protection (i.e., a difference-in-difference approach).
To construct a comprehensive sample of SOE privatizations, we rely on two leading
corporate datasets on Chinese firms. The first is CSMAR/WIND, a dataset similar to (and, in fact,
fashioned on) the CRSP and COMPUSTAT databases in the U.S. This database covers Chinese
publicly listed firms and has been used in studies published in leading journals (Xiong and Yu
(2011), among others). The second is the Chinese Industrial Enterprises Database, a longitudinal
micro-level database compiled by the National Bureau of Statistics of China (NBSC) based on
annual surveys of industrial firms (manufacturing, mining, and construction) that have more than
20 See Qin, Stromberg, and Wu (2014) and references therein for a more detailed discussion of the organization of the media industry in China.

16
five million RMB in annual sales. Similar to the U.S. Census data, this database is the most
comprehensive source of information on unlisted firms. 21 The drawbacks of this database,
however, are that due to size requirements, many firms do not have a complete time series, and
linking records across years can be problematic. Leading academic papers have used this
database to study Chinese firms’ productivity (e.g., Hsieh and Klenow (2009); Song, Storesletten,
and Zilibotti (2011)).
Identifying privatizations among the listed sample from CSMAR is relatively
straightforward. Since 2001, Chinese listed firms are required to report their ownership (equity)
structure. Following prior literature (e.g., Wang, Wong, and Xia (2008)), we define a company
as state-owned if its largest ultimate shareholder is a government entity, which can either be the
central government (e.g., the Ministry of Finance) or local governments. Otherwise, we define
the company as a private enterprise (i.e., if the largest ultimate owner of these firms is either an
individual—we aggregate individual investors who are family members—or a private
institutional investor). We identify SOE privatizations by comparing changes of ownership status
between two consecutive years. On average, government ownership was 43.1% of firms’ equity
in the five years before the privatizations; in the five years after, the average state ownership was
23.0%.
To identify privatizations of unlisted companies from the Chinese Industrial Enterprises
Database, we first construct complete firm histories from the dataset by matching data from
consecutive years. When available, we use a firm’s unique permanent ID (known in China as the
21 The database is called 工业企业数据库 in Chinese, whose direct translation is “Industrial Enterprises Database.” In earlier papers published in leading academic journals, it has been called the “China Industrial Survey” (e.g., Hsieh and Klenow (2009)).
17
Legal Person Code22) to trace the firm over time. Unfortunately, this ID is often missing in the
Industrial Enterprises Database as firms sometimes omit this field in their survey reports. In
those instances, we follow prior literature and use a combination of five variables to identify
firms: company name, sector code, province, city, and address.23 Erring on the side of caution, all
five variables need to match exactly for us to consider two records to be from the same firm. We
then rely on two data items to identify SOE privatizations. First, when available, we use the
detailed equity ownership information in the “Financial Information” section of the database.
Equity ownership is reported by the following owner categories: state, collective, individual,
legal persons,24 overseas Chinese (Hong Kong/Macau/Taiwan), and other overseas. With this
information, we calculate the percentage of state ownership in overall equity and classify a firm
as a SOE if this percentage exceeds 50%. A firm is considered to have gone through a
privatization if this ratio goes below 50% in the subsequent year. Second, when this detailed
information is not available, we use the field entitled “Capital Holding Situation” in the “Basic
Information” section of the database, in which firms identify themselves as either SOEs or other.
We consider a privatization to have occurred if this status changes from SOE to other
ownership.25
Table 2 summarizes our privatization sample by year (before being matched to the IPR
data, which – as noted above – covers only 25 provinces). An overwhelming majority of the
22 According to Chinese law, a legal person is an organization that is incorporated in accordance with the law and that has its own assets, name, and address, exercises civil rights and assumes civil legal liabilities on its own, independent of its members. In essence, the notion of a legal person organization is similar to the notion of a limited liability firm in the west. A company’s Legal Person Code is the company ID created upon the legal creation and registration of the company and remains unchanged throughout the company’s existence. 23 See Hsieh and Klenow (2009), Song, et al. (2011), and Dougherty et al. (2007) for discussions of the data. Nie, et al. (2012) provides a detailed summary of the potential pitfalls and remedies when using the Chinese Industrial Enterprises Database. 24 These refer to shares held by other corporate entities. 25 As a robustness check, we repeated all our analyses using only the sample pertaining to the listed firms. The results are qualitatively the same as those reported here.

18
privatizations occur between 2002 and 2006, consistent with historical accounts. The
privatizations are geographically diverse: in the peak years between 2002 and 2006, on average
27 provinces (out of 31) are represented in the sample. This reflects the sweeping nature of
China’s privatization wave. In all, our sample consists of 1,331 privatization events. After
matching with the IPR score data, the ultimate sample later used in our analyses consists of 898
privatizations spanning 25 provinces. While this is likely to be only a fraction of all the
privatizations that took place in China, our sample size is comparable to other large sample
studies of SOE privatizations in China.26
To further allay the concern that privatization events may be related to systematic
changes in key firm attributes, Table 3 compares key firm characteristics in the year before
privatization with the year after. We examine firm size (measured as the logarithm of total assets
in RMB), the ratio of intangible assets to total assets, return on assets (calculated as net income
divided by total assets), and leverage (calculated as total debt divided by total assets). All ratios
are expressed in decimal points. The table reveals no meaningful changes in any of these
statistics.
D. Other Data
In our regression analysis, we use a number of control variables, such as annual province-
level GDP growth and university density (the number of four-year colleges per 100,000
population). These data come from the Chinese Annual Statistical Yearbooks. 27 Firm-level
26 We miss some privatization events because of gaps in the databases and because these databases do not cover all Chinese firms. Our stringent firm identification criteria mean that our sample errs on the conservative side. The sample in Gan, et al. (2008) consists of roughly 900 privatized firms. 27 http://www.stats.gov.cn/english/statisticaldata/AnnualData/ (accessed May 2, 2016).
19
control variables come from CSMAR and the Industrial Enterprises Database. See Appendix 1
for a list of our data sources.
II. Findings
A. Baseline Results
We begin by examining the univariate relationship between ownership type and
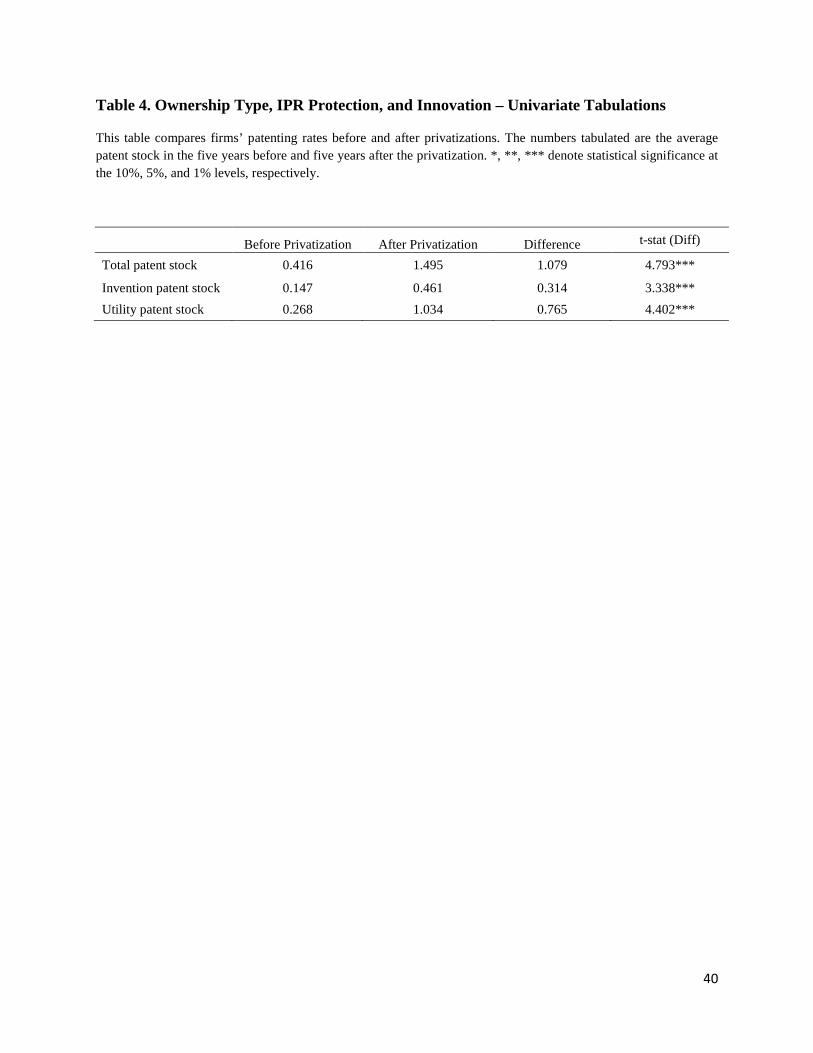
innovation. Table 4 compares the five-year average patent stock before privatization with the
five-year average after. Privatizations are positively related to innovation. Not only are the
results statistically significant, but the economic magnitudes are also large: the average patent
stock increases from 0.416 before privatization to 1.495 afterwards, an increase of over 250%
(1.495/0.416-1).
Finding that private firms are more innovative is unsurprising in a Western context,
where private ownership and decentralized decision-making is often associated with better
management (e.g., Bloom and Van Reenen (2007)). But it is noteworthy in the Chinese context.
With poor property rights and weak rule of law, it is not clear a priori that private firms would
have stronger incentives to innovate than SOEs, as they are ill-protected from expropriation. The
fact that even in China private ownership increases innovation suggests the power of incentives.
Next, we focus on the central question of this paper: What is the interactive effect of
ownership type and IPR protection on innovation? Are private firms more sensitive to IPR
protection than SOEs? If so, we should find that the increase in post-privatization innovation is
larger in regions with stronger IPR protection than in regions with weaker protection.
Table 5 presents the results of a difference-in-difference analysis where we compare the
post-privatization increase in firms’ patent stock across prefectures with high and low IPR
20
protection (that is, an IPR score above or below the median score) in the year of the privatization.
We report the average patent stock in the five years before and five years after privatization.
Panels A, B, and C report the results for all patents, invention patents, and utility patents,
respectively. All panels reveal a consistent pattern:
• First, firms’ patent stock always increases significantly after the privatization, which is
consistent with results in Table 4. The ratio of after/before patent stock is generally
between 3 and 4, implying an increase of between 200% and 300%.
• Second, both before and after privatization, the patent stock is higher in high IPR
protection regions than in low IPR protection regions. The differences are large
economically and statistically. For instance, even before privatization, firms’ total patent
stock (Panel A) is over three times higher in high IPR protection regions than in low IPR
protection regions (0.579 versus 0.177). Firms’ invention patent stock (Panel B) is more
than four times higher in high IPR protection regions than in low IPR protection regions
(0.219 versus 0.047).
• The post-privatization increase in patent stock is significantly larger in high IPR
protection regions than in low IPR protection regions. The magnitudes of the differences
are large. Overall patent stock (Panel A) more than quadrupled after privatization in
regions with high IPR protection (2.474 versus 0.579), and it nearly tripled in regions
with low IPR protection (0.528 versus 0.177). While patent stock growth rates are high
across the board, the difference between high and low IPR protection regions is
significant.
In Table 6, we estimate panel regressions to control for additional factors that could
confound the difference-in-difference analysis. The sample consists of firm-year observations of

21
firms that have undergone a privatization between 2002 and 2011. For each privatization event,
we use five years of data before and five years of data after the event. The key regression we
estimate is the following:
log (𝑃𝑎𝑡𝑒𝑛𝑡_𝑆𝑡𝑜𝑐𝑘𝑖,𝑡 + 1) = 𝑎 + 𝑏1𝑃𝑂𝑆𝑇𝑖,𝑡 + 𝑏2𝐼𝑃𝑅𝑖,𝑡−1 + 𝑏3𝑃𝑂𝑆𝑇𝑖,𝑡 × 𝐼𝑃𝑅𝑖,𝑡−1 +
𝐶𝑜𝑛𝑡𝑟𝑜𝑙𝑠𝑖,𝑡−1 + 𝜀𝑖𝑡 (4)
The dependent variable is the (natural logarithm) of (one plus) a firm’s patent stock in year t.
POST is an indicator variable that takes on the value of one for years after privatization and zero
otherwise; IPR is the measure of the IPR score in the prefecture where the firm is located in year
t-1; and POST × IPR is the interaction between the two variables. Control variables include firm
level characteristics measured at the end of year t-1: size (expressed as the logarithm of assets
measured in RMB), intangible assets (as a fraction of total assets), return on assets (defined as
net income divided by total assets), leverage (defined as total debt divided by total assets), and
age (the number of years since the firm’s inception). Province-level controls include GDP
growth from years t-1 to t (in decimals), university density in year t-1 (measured as number of
four-year universities per 100,000 population), and the increase in government R&D subsidies
(calculated as the change in the amount of government R&D subsidy from year t-1 to t divided
by the provincial GDP in year t-1).28 We also include industry and province fixed effects. In one
specification, we also include firm fixed effects. Standard errors are clustered by province.
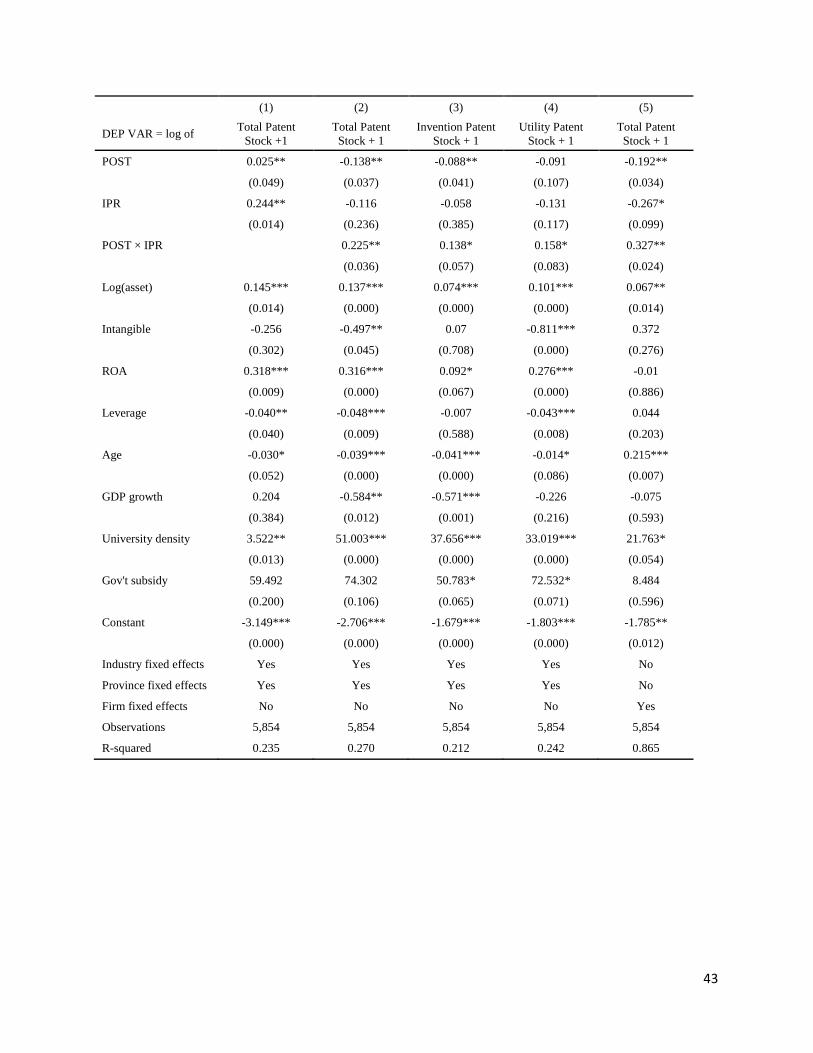
The results in Table 6 are consistent with those in Tables 4 and 5. In model (1), both the
POST and the IPR variable are positive and significant, indicating that better IPR protection and
private ownership are both positively associated with innovation. In models (2) through (4), the
key variable of interest—the interaction term between the POST and IPR protection measures— 28 The Chinese government routinely subsidizes R&D efforts in local firms, a legacy of the centrally planned economy; hence, we control for government spending on R&D by including this variable.
22
is positive and significant, indicating that the post-privatization increase in innovation is larger
when local IPR protection is stronger. The magnitude is large. For instance, at the median IPR
value of 0.65 between 2002 and 2006 (the peak of the privatization wave), the coefficients of the
POST dummy and the POST × IPR interaction term in model (2) indicate that the average post-
privatization increase in patent stock is just 0.01 (-0.138 + 0.225*0.65). With a one standard-
deviation increase in IPR score (0.179), however, the post-privatization effect quadruples to
0.048 (-0.138 + 0.225*(0.65+0.179)). Thus, the effect of privatization on innovation depends
significantly on the extent of local IPR protection. In unreported specifications where we convert
the continuous IPR measure to a binary high IPR indicator, we find that only privatizations in
high IPR protection regions lead to higher innovation. In model (5), we include firm fixed effects
to control further for unobserved firm-level attributes. With the inclusion of firm fixed effects,
the R2 increases to 86.5%. The coefficients suggest an even larger role for IPR protection in
modulating privatization’s effect on innovation: a one standard-deviation increase in the IPR
score increases the post-privatization effect from 0.02 (-0.192 + 0.327*0.65) to 0.07 (-0.192 +
0.327*(0.65+0.179)).
Overall, the results in this section are consistent with the Schumpeterian view: within
China, both private ownership and IPR protection are conducive to innovation. Importantly, the
effect of privatization on innovation is highly influenced by local IPR protection; privatization
has essentially no effect on innovation when IPR protection is weak, and a moderate increase in
IPR protection can lead to large gains in post-privatization innovation. This is strong evidence
that private sector innovation in China is particularly sensitive to IPR protection.

23
B. Nationalizations
So far, we rely on SOE privatizations to identify the causal effect of private ownership
and IPR protection on innovation. If these results are robust, we would expect to see the opposite
pattern in the (relatively rare) incidences of nationalizations, when the state takes control of a
firm. Specifically, if the combination of private ownership and strong IPR protection is
conducive to innovation, we should find that the reduction of innovation would be particularly
severe when a firm in a region with high IPR protection becomes nationalized. In other words, in
estimating the same type of regression as in Table 6 on a sample of nationalization events, we
expect the interaction term between nationalization and IPR protection to be negative.
We collected nationalization events in the same way as we identified privatizations. We
found 252 cases of nationalizations in our sample (218 cases involved unlisted firms and 34
cases involved listed firms). We employed the same methodology and set of variables as in Table
6, reporting the results in Table 7. Consistent with our hypothesis, we find that indeed the
interaction term between IPR protection and the nationalization indicator is negative, indicating
that nationalization is particularly detrimental to innovation in regions with high IPR protection.
The economic magnitude implied by the coefficient estimates is in line with, if not larger than,
the privatization results in Table 6. Using coefficient estimates in model (5) of Table 7 with firm
fixed effects, a similar set of calculations as before shows that, on average, firms’ patent stocks
increase slightly (by 0.02, which is calculated as 0.29 – 0.403*0.65) after nationalization.
However, a one standard-deviation increase in local IPR protection leads to a predicted negative
effect of -0.04 (0.29 – 0.403*(0.65+0.179)), indicating a reduction of patent stock post
nationalization. Nationalizations thus have an especially detrimental effect on innovation for

24
firms from high IPR regions. These results are the mirror image of the privatization analysis,
providing support to the Schumpeterian view.
C. Instrumental Variables Regression
In our empirical design, we use a survey-based IPR protection measure to capture directly
the perceived quality of local IPR protection. While this survey-based measure alleviates reverse
causality concerns that some other measures face, it is not ironclad.
To address these concerns, in this section we use instrumental variable (IV) regressions to
provide a further check on the robustness of our results. We borrow from Ang, Cheng, and Wu
(2014) and use two province-level instruments for IPR protection. The first is the number of
Christian colleges founded by missionaries in a province by 1920 (Stauffer, Wong, and
Tewksbury (1922)). Christian colleges were important in instilling Western values such as the
respect for private property among the Chinese people. 29 The second instrument is British
settlement, an indicator variable that equals one if a province had a British concession during the
Qing dynasty. The British, along with other colonial powers, established the local administrative
and legal systems according to their own values. British settlements would thus be instrumental
in spreading common-law values such as property rights.30 Thus, these two variables should be
correlated with provincial IPR protection, as they measure the provinces’ historical exposure to
the idea of property rights. At the same time, they should only affect current day innovation
29 Well-known Christian colleges include, for example, St John’s University, which was founded by the American Episcopal Church, and Soochow University, founded by American Methodist missionaries. 30 The British concessions (or leased territories) included Xiamen city in Fujian, Hankou city in Hubei, Jiujiang city in Jiangxi, Zhenjiang City in Jiangsu, Guangzhou City in Guangdong, Weihaiwei in Shandong, Tianjin, and Shanghai (Yang and Ye (1993)).

25
through IPR protection, once other regional factors that could affect innovation have also been
controlled for.
Table 8 reports both the first and second stage results from the IV regression. In the first
stage, we use the two instrumental variables – Christian College (the number of colleges founded
by Christian missionaries in a province before 1920) and British Settlement (a dummy variable
that equals one if the province had a British concession in the Qing Dynasty and zero otherwise)
– and other province level variables to predict IPR protection score. The results show that both
instruments are highly significant in predicting IPR protection. The F-test for instrument strength
is highly significant (an F-statistic of 143.84, with a p-value of 0.000), indicating the two
instruments are strong.
In the second stage, the unit of observation is (as in Table 6) annual observations of each
privatized firm for the five years before and the five years after the privatization. The dependent
and independent variables are identical to those in regressions (1) through (3) of Table 6, except
that here we employ the instrumented value of the IPR protection measure.
Consistent with Table 6, the key interaction term between POST and the instrumented
IPR has a positive sign, meaning that local IPR protection significantly moderates the effect of
privatization on innovation: strong IPR protection makes privatizations more conducive to
innovation. The magnitudes are in line with the baseline. The mean instrumented value of IPR
score is 0.65, and its standard deviation is 0.067. Therefore, based on model (1) estimates, the
mean post-privatization change in innovation is essentially 0 (-0.34+0.523*0.65). With a one
standard-deviation increase in the (instrumented) IPR score, the effect increases to 0.035 (-
0.34+0.523*(0.65+0.067)). These estimates suggest that the post-privatization gains in
innovation are concentrated in regions with high (above average) IPR protection; in regions with

26
low IPR protection, the gain is negligible. Finally, the Sargan-Hansen test for over-identifying
restrictions does not reject the null hypothesis that the residuals are uncorrelated instruments.
Overall the IV regression analysis in this section confirms our baseline finding.
III. Patent Quality
The analysis so far focuses on the quantity of patents, but this is hardly the only
important measure of innovation. Since the pioneering work of Griliches (1990), it has been
widely recognized that patent quality varies significantly. Even though privatized firms generate
more patents, this proliferation may not represent a boost to innovation if they are filing trivial
patents. Private business owners may be more likely to file for trivial patents to “game the
system,” for instance, in the hopes of impressing prospective investors, or in the Chinese context,
being classified as “high tech” and gaining a government subsidy. Thus, it is important to assess
the quality of the patents.
To do so, we collected the global patent application and citation data for the 331 firms
publicly listed firms in China with the most Chinese patents.31 Of these 331 firms, 162 are SOEs
(49%) and 169 (51%) private enterprises. We look at data across multiple patent offices rather
than just using U.S. filings, because a relatively modest share of Chinese firms’ patents have
been filed in the U.S. To analyze these, we use data from Patent Sight GmbH, which has
compiled a rich array of information on global patent families (a patent family includes all
versions of a given patent filed in different national or regional patent offices). These data allow
us to compare patent quality across firm types and over time. Firms are classified as SOEs or
31 Due to the rarity of international patents among unlisted Chinese firms, the analysis in this section pertains to listed firms and also deviates from the difference-in-difference approach.

27
private firms based on their status in the year of the first publication of the patent (which
typically occurs 18 months after filing) according to the methodology described above.
We concentrate on a number of key measures:
• “Citations received per patent” is the number of citations received worldwide per patent
family owned by each firm as of year-end 2014. This is akin to the typical measure of
importance, as explored in Jaffe and Trajtenberg (2005) and many subsequent works.
• “IPC groups per patent” is the mean number of IPC groups that each patent family has
been assigned to (a proxy for patent scope, as in Lerner (1994)).
• “% patents active in the U.S./Japan/European Patent Offices (EPO)” is the fraction of a
firm’s patent families awarded through that date that have patents that are pending and/or
are granted in the respective patent offices as of year-end 2014. “% patent active in
WIPO” is the share of the firm’s patents active under the Patent Cooperation Treaty as of
year-end 2014.32 Again, the extent of patent families has been used as a proxy for patent
importance by Lanjouw, Pakes, and Putnam (1998) and subsequent authors.
We examine these patterns using all patents (in Panel A), those first published between
the beginning of 1990 and the end of 2005 (Panel B), and those first published between 2006 and
2014 (Panel C). We use 2006 as a division since our earlier evidence shows that 2006 was a
critical transition year.
Table 9 shows the results. When we examine the overall sample, we see that private firms’
patents, far from being of lower quality, actually have significantly more citations and fall into
more four-digit IPC groups (a proxy for broader scope). Moreover, they are significantly more
32 The World Intellectual Property Organization (WIPO) administers the Patent Cooperation Treaty, which provides a streamlined way for firms to apply for patent protection in multiple patent offices. Applicants need not use the WIPO and can file directly with the national patent offices, but going through WIPO provides a number of advantages.

28
likely to be still active in the U.S. and at the WIPO. The results regarding citations and patents
active in the U.S. are statistically significant in both time periods examined; the remaining results
are only present in the 2006-2014 period. (The result regarding the greater tendency of SOE
patents in the later period to be active in Japan is harder to explain.) In short, the results are
inconsistent with the notion that the growth of private firm patenting is due to a proliferation of
low-quality awards: if anything, the opposite pattern is at work.
IV. Conclusion
In this paper, we study how intellectual property right protection affects innovation in
China in the years around the privatizations of state-owned enterprises. Focusing on SOE
privatizations allows us to use a difference-in-difference approach to identify the causal impact
of ownership type (state-owned versus private) and IPR protection on innovation.
Consistent with the Schumpeterian view of the role of institutions, we find two main
results. First, within China, privatizations are associated with an increase in innovation. Firms’
mean patent stocks are 200%-300% larger in the five years after privatizations, compared to the
five years before. Second, local IPR protection is a significant moderator of this relationship: A
one standard-deviation increase in local IPR protection score almost quadruples the post-
privatization increase in patent stock. In fact, nearly all the post-privatization increase in
patenting is achieved by firms in regions with high IPR protection standards.
Our results contribute to the literature in two ways. First, these results address the “China
puzzle”: the perception that China is an outlier in the law and finance framework. Our single-
country focus and unique identification technique suggest a more normal relationship between

29
institutions and economic outcomes, one that is more consistent with the Schumpeterian views
on institutions and growth.
Our second contribution is the policy implications of our results. Innovation today is a
matter of first-order importance to China and its leaders. In order to successfully transition the
country from a development model that is dependent on cheap labor and physical investments to
one that is innovation-driven, our results suggest that the role of the private sector will be crucial,
as private firms are more innovative both in terms of quantity and quality of patents. For
innovation in the private sector, legal institutions appear critical.

30
References
Aghion, P., Cai, J., Dewatripont, M., Du, L., Harrison, A., and Legros, P., 2015, Industrial policy and competition, American Economic Journal: Macroeconomics 7, 1-32. Allen, F., Qian, J., and Qian, M., 2005, Law, finance, and economic growth in China, Journal of Financial Economics 77, 57-116. Ang, J., Cheng, Y., and Wu, C., 2014, Does enforcement of intellectual property rights matter in China? Evidence from financing and investment choices in the high tech industry, Review of Economics and Statistics 96, 332-348. Arrow, K., 1962, Economic welfare and the allocation of resources for invention, in The Rate and Discretion of Inventive Activity, edited by R. Nelson. Princeton, NJ, Princeton University Press. Bloom, N., and Van Reenen, J., 2007, Measuring and explaining management practices across firms and countries, Quarterly Journal of Economics 122, 1351-1408. Cohen, L., Gurun, U., and Kominers, S., 2016, Patent trolls: Evidence from targeted firms, Harvard Business School working paper. Dougherty, S., Herd, R., and He, P., 2007, Has a private sector emerged in China’s industry? Evidence from a quarter of a million Chinese firms, China Economic Review 18, 309-334. Fan, J., Wong, T., and Zhang, T., 2013, Institutions and organizational structure: The case of state-owned corporate pyramids, Journal of Law, Economics, and Organization, 29, 1217-1252. Gan, J., 2009. Privatization in China: Experiences and lessons, in China’s Emerging Financial Markets: Challenges and Opportunities, edited by J. Barth, J. Tatom, and G. Yago. New York, Springer. Gan, J., Guo, Y., and Xu, C., 2008, A nationwide survey of privatized firms in China, Unpublished working paper. Griliches, Z., 1990, Patent statistics as economic indicators: A survey, Journal of Economic Literature 28, 1661-1707. Griliches, Z. (editor), 1984, R&D, Patents and Productivity, Chicago, University of Chicago Press for the National Bureau of Economic Research. Hall, B. H., 1993, The stock market’s valuation of R&D investment in the 1980s, American Economic Review 83, 259-264. Hall, B. H., Jaffe, A., and Trajtenberg, M., 2005, Market value and patent citations, RAND Journal of Economics 36, 16-38.

31
Hsieh, C. and Klenow, P., 2009, Misallocation and manufacturing TFP in China and India, Quarterly Journal of Economics 124, 1403-1448. Hsu, P., Wang, C., and Wu, C., 2013, Banking systems, innovations, intellectual property protections, and financial markets: Evidence from China, Journal of Business Research 66, 2390-2396. Jaffe, A., and Lerner, J., 2004, Innovation and its Discontents, Princeton, Princeton University Press. Jaffe, A., and Trajtenberg, M., 2005. Patents, Citations, and Innovations: A Window on the Knowledge Economy, Cambridge, MIT Press. Keller, W., 2002, Geographic localization of international technology diffusion, American Economic Review 92, 120-142. King, R., and Levine, R., 1993, Finance and growth: Schumpeter might be right, Quarterly Journal of Economics 108, 717–738. La Porta, R., Lopez-de-Silanes, F., Shleifer, A., and Vishny, R., 1998, Law and finance, Journal of Political Economy 106, 1113–1155. Lanjouw, J., Pakes, A., and Putnam, J., 1998, How to count patents and value intellectual property: The uses of patent renewal and application data, Journal of Industrial Economics 46, 405–432. Lerner, J., 1994, The importance of patent scope: An empirical analysis, RAND Journal of Economics 25, 319—333. Nelson, R., 1959, The simple economics of basic scientific research, Journal of Political Economy 67, 297-306. Nie, H., Jiang, T., and Yang, R., 2012, A review and reflection on the use and abuse of Chinese Industrial Enterprises Database (Chinese), World Economy 5, 142-158. Priest, G., and Klein, B., 1984, The selection of disputes for litigation. Journal of Legal Studies 13, 1-55. Qin, B., Stromberg, D., and Wu, Y., 2014, The determinants of media bias in China, Unpublished working paper. Rajan, R. and Zingales, L., 1998. Financial dependence and growth, American Economic Review 88, 559–586. Schumpeter, J., 1934, The Theory of Economic Development: An inquiry into profits, capital, credit, interest and the Business Cycle, Cambridge, MA: Harvard University Press.

32
Snyder, N., 2012, Putting numbers to feelings: Intellectual property rights enforcement by Chinese courts—Evidence from Zhejiang trademark infringements, 2004-2009, Northwestern Journal of Technology and Intellectual Property 10, 349-376. Song, Z, Storesletten, K., and Zilibotti, F., 2011. Growing like China, American Economic Review 101, 202-241. Stauffer, M., Wong, C., and Tewksbury, M. (editors), 1922, The Christian Occupation of China: A General Survey of the Numerical Strength and Geographical Distribution of the Christian Forces in China, Shanghai, China Continuation Committee Press. Wang, Q., Wong, T., and Xia, L., 2008, State ownership, the institutional environment, and auditor choice: Evidence from China, Journal of Accounting and Economics 46, 112-134. Williams, H., 2013, Intellectual property protection and innovation: Evidence from the human genome, Journal of Political Economy 121, 1-27. Xiong, W., and Yu, J., 2011, The Chinese warrants bubble, American Economic Review 101, 2723-2753. Yang, Z., and Ye, F., 1993, Studies on Semi-Colonization of Qing Dynasty, Beijing, Higher Education Press.

33
Figure 1. Intellectual Property Protection in China: Geographic Variation
This map depicts the regional variation in IPR protection across mainland Chinese provinces. The IPR protection data are from 2002-2011 and are at the prefecture-year level. We calculate province-level results using averages of prefectures within each province every year, and then calculate and graph the time-series averages of each province.

34
Figure 2. IPR Score Over Time
This figure plots the mean IPR scores across prefectures over time. The IPR score data are from the Chinese Academy of Social Sciences and its calculation is detailed in the text. Prefectures in the high (low) IPR group are those whose IPR scores are above (below) the median each year.
0.3
0.4
0.5
0.6
0.7
0.8
0.9
1
IPR Score Over Time
Low IPR
High IPR
35
Figure 3. Innovation Trend
This figure plots the patent stock over time for privately owned firms and state-owned enterprises (SOEs). Patent data are from the Chinese State Intellectual Property Office. Patent stock is calculated as in Equation (3) and scaled by million RMB in assets.
0
0.2
0.4
0.6
0.8
1
1.2
1.4
1.6
1.8
Patent Stock Over Time
Private Sector Firms SOEs
36
Figure 4. Policy Trends: Privatization vs. Innovation
This figure plots the frequency of media mention of the key words “Innovation” and “Privatization” in all the “Daily” newspapers—the official publications of provincial governments in China. The numbers are calculated by dividing the number of articles that contain each type of key word with the number of total articles in a given year, averaged across all provinces.
0.00%
0.10%
0.20%
0.30%
0.40%
0.50%
0.60%
0.70%
2000
20
01
2002
20
03
2004
20
05
2006
20
07
2008
20
09
2010
20
11
2012
20
13
Frequency of Official Media Mentions
"Innovation"
"Privatization"

37
Table 1. Summary Statistics on IPR Protection Index
This table reports summary statistics of IPR scores provided by the Chinese Academy of Social Sciences. The calculation of the IPR score is detailed in the text. The data are from 2002-2011 and are at the prefecture-year level. We calculate and report provincial-level statistics based on prefectures and years pertaining to each province. The provinces are listed in ascending order of the average IPR score.
Within Province Variation
Province Coastal (Y/N)
Average IPR Score Max. Min. Std. Dev.
1 Heilongjing N 0.58 0.81 0.42 0.13
2 Yunnan N 0.59 0.84 0.33 0.17
3 Jilin N 0.62 0.81 0.33 0.20
4 Inner Mongolia N 0.63 0.80 0.38 0.10
5 Shaanxi * N 0.64 0.77 0.48 0.09
6 Chongqing N 0.64 0.72 0.50 0.08
7 Hunan N 0.64 0.82 0.48 0.13
8 Liaoning Y 0.65 0.82 0.42 0.12
9 Henan N 0.65 0.87 0.56 0.09
10 Hubei N 0.66 0.90 0.42 0.16
11 Jiangxi N 0.66 0.86 0.50 0.12
12 Shanxi * N 0.67 0.77 0.48 0.09
13 Sichuan N 0.67 0.80 0.58 0.08
14 Hainan Y 0.68 0.85 0.38 0.10
15 Guangdong Y 0.70 0.96 0.25 0.17
16 Guangxi Y 0.71 0.86 0.61 0.07
17 Beijing N 0.71 1.00 0.55 0.14
18 Hebei Y 0.72 0.87 0.58 0.08
19 Anhui N 0.72 1.00 0.53 0.08
20 Fujian Y 0.72 1.00 0.48 0.10
21 Tianjin Y 0.74 0.87 0.58 0.09
22 Shandong Y 0.75 0.95 0.50 0.09
23 Zhejiang Y 0.76 1.00 0.50 0.09
24 Jiangsu Y 0.76 1.00 0.42 0.12
25 Shanghai Y 0.83 1.00 0.69 0.09
*: Shaanxi is for 山西 in Chinese. Shanxi is for 陕西 in Chinese. These two Chinese provinces have the same phonetic spelling (Chinese pinyin) but with different intonations. We adopted a slightly different spelling to make the distinction.

38
Table 2. The Privatization Sample
This table lists the basic information for our privatization sample. SOE privatizations are identified from the CSMAR database for listed firms and from the Industrial Enterprises Database from the National Statistical Bureau of China (NSBC) for unlisted firms. Details of the identification are discussed in Section I.C.
Year Number of
Privatizations Number of Cities Number of Provinces 2000 175 103 27
2001 199 109 27
2002 110 70 25
2003 141 89 26
2004 242 136 29
2005 166 97 26
2006 232 133 29
2007 25 22 14
2008 10 10 7
2009 7 6 5
2010 6 5 5
2011 18 17 12
39
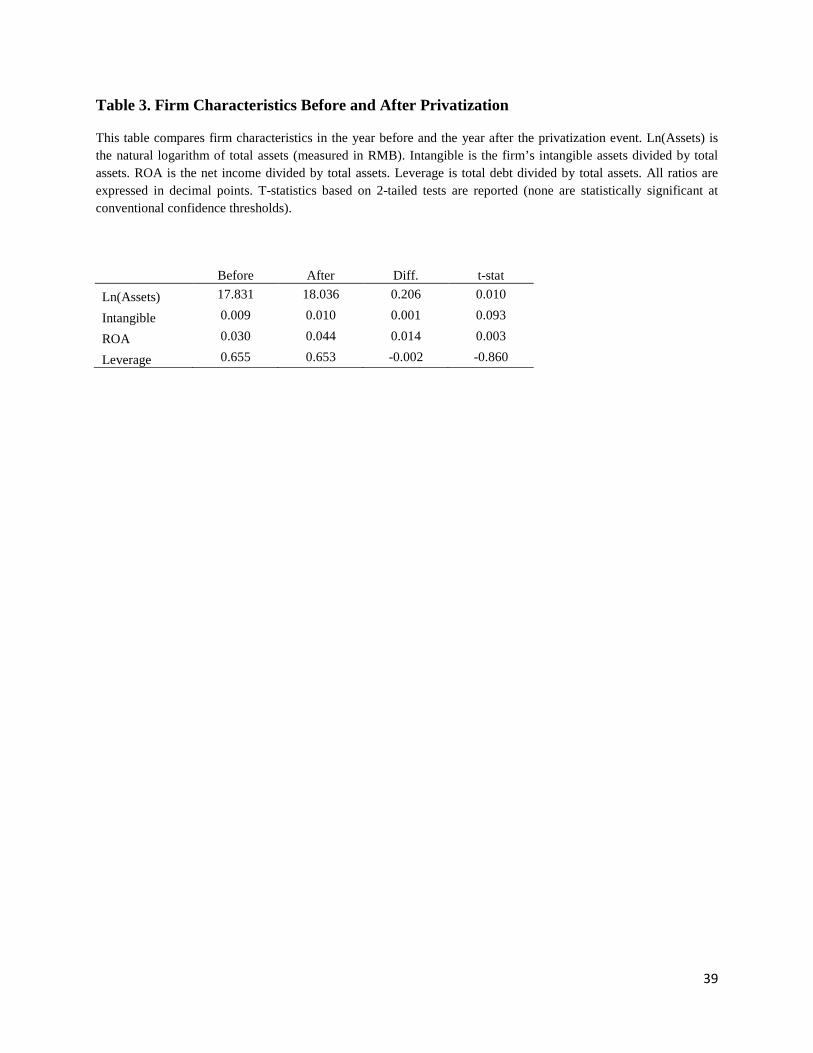
Table 3. Firm Characteristics Before and After Privatization
This table compares firm characteristics in the year before and the year after the privatization event. Ln(Assets) is the natural logarithm of total assets (measured in RMB). Intangible is the firm’s intangible assets divided by total assets. ROA is the net income divided by total assets. Leverage is total debt divided by total assets. All ratios are expressed in decimal points. T-statistics based on 2-tailed tests are reported (none are statistically significant at conventional confidence thresholds).
Before After Diff. t-stat Ln(Assets) 17.831 18.036 0.206 0.010
Intangible 0.009 0.010 0.001 0.093
ROA 0.030 0.044 0.014 0.003
Leverage 0.655 0.653 -0.002 -0.860
40
Table 4. Ownership Type, IPR Protection, and Innovation – Univariate Tabulations
This table compares firms’ patenting rates before and after privatizations. The numbers tabulated are the average patent stock in the five years before and five years after the privatization. *, **, *** denote statistical significance at the 10%, 5%, and 1% levels, respectively.
Before Privatization After Privatization Difference t-stat (Diff)
Total patent stock 0.416 1.495 1.079 4.793***
Invention patent stock 0.147 0.461 0.314 3.338*** Utility patent stock 0.268 1.034 0.765 4.402***

41
Table 5. The Interactive Effect of Ownership and IPR Protection: Difference-in-Difference
This table reports the results of a difference-in-difference analysis where we compare the increase in patent stock before and after privatizations in prefectures with high and low IPR protection. The numbers tabulated are the average patent stock in the five years before and five years after privatization. High (low) IPR protection is based on whether a prefecture’s IPR score is above (below) the median score in the year of a privatization event.*, **, *** indicate statistical significance at the 10%, 5%, and 1% levels, respectively. Panel A: All Patent Stock
High IPR Protection Low IPR Protection Diff (High-Low) Diff-In-Diff
Before 0.579 0.177 0.402*** After 2.474 0.528 1.946***
After - Before 1.896*** 0.351*** 1.545***
Panel B: Invention Patent Stock
High IPR Protection Low IPR Protection Diff (High-Low) Diff-In-Diff
Before 0.219 0.047 0.172** After 0.801 0.137 0.664*** After - Before 0.582*** 0.089** 0.492***
Panel C: Utility Patent Stock
High IPR Protection Low IPR Protection Diff (High-Low) Diff-In-Diff
Before 0.360 0.130 0.230*** After 1.674 0.392 1.282*** After - Before 1.314*** 0.262*** 1.052***

42
Table 6. Ownership Type, IPR Protection, and Innovation – Regression Analysis
This table examines the relation between ownership type, IPR protection, and innovation in a panel regression. The sample consists of firm-year observations of firms that have undergone a privatization between 2000 and 2011. For each privatization event, we use five years of data before and five years of data after the event as observations. The key regression we estimate is:
log (𝑃𝑎𝑡𝑒𝑛𝑡_𝑆𝑡𝑜𝑐𝑘𝑖,𝑡 + 1) = 𝑎 + 𝑏1𝑃𝑂𝑆𝑇𝑖 ,𝑡 + 𝑏2𝐼𝑃𝑅𝑖,𝑡−1 + 𝑏3𝑃𝑂𝑆𝑇𝑖 ,𝑡 × 𝐼𝑃𝑅𝑖,𝑡−1 + 𝐶𝑜𝑛𝑡𝑟𝑜𝑙𝑠𝑖,𝑡−1 + 𝜀𝑖𝑡 The dependent variable is the (natural logarithm) of (one plus) a firm’s patent stock in the year t. POST is an indicator variable that takes on the value of one for years after privatization, and zero otherwise; IPR is the measure of the IPR score in the prefecture where the firm is located in year t-1; and POST × IPR is the interaction between the two variables. Control variables include firm level characteristics measured at the end of year t-1: size (expressed as the logarithm of assets measured in RMB), intangible assets (as a fraction of total assets), return on assets (defined as net income divided by total assets), leverage (defined as total debt divided by total assets), and age (the number of years since the firm’s inception). Province-level controls include GDP growth from years t-1 to t (in decimals), university density in year t-1 (measured as number of four-year universities per 100,000 population), and the increase in government R&D subsidies (calculated as the increase in the amount of government R&D subsidy from years t-1 to t divided by the provincial GDP in year t-1). Standard errors are clustered by province. P-values are in parentheses. *, **, *** indicates statistical significance at the 10%, 5%, and 1% level, respectively.
43
(1) (2) (3) (4) (5)
DEP VAR = log of Total Patent Stock +1
Total Patent Stock + 1
Invention Patent Stock + 1
Utility Patent Stock + 1
Total Patent Stock + 1
POST 0.025** -0.138** -0.088** -0.091 -0.192**
(0.049) (0.037) (0.041) (0.107) (0.034)
IPR 0.244** -0.116 -0.058 -0.131 -0.267*
(0.014) (0.236) (0.385) (0.117) (0.099)
POST × IPR 0.225** 0.138* 0.158* 0.327**
(0.036) (0.057) (0.083) (0.024)
Log(asset) 0.145*** 0.137*** 0.074*** 0.101*** 0.067**
(0.014) (0.000) (0.000) (0.000) (0.014)
Intangible -0.256 -0.497** 0.07 -0.811*** 0.372
(0.302) (0.045) (0.708) (0.000) (0.276)
ROA 0.318*** 0.316*** 0.092* 0.276*** -0.01
(0.009) (0.000) (0.067) (0.000) (0.886)
Leverage -0.040** -0.048*** -0.007 -0.043*** 0.044
(0.040) (0.009) (0.588) (0.008) (0.203)
Age -0.030* -0.039*** -0.041*** -0.014* 0.215***
(0.052) (0.000) (0.000) (0.086) (0.007)
GDP growth 0.204 -0.584** -0.571*** -0.226 -0.075
(0.384) (0.012) (0.001) (0.216) (0.593)
University density 3.522** 51.003*** 37.656*** 33.019*** 21.763*
(0.013) (0.000) (0.000) (0.000) (0.054)
Gov't subsidy 59.492 74.302 50.783* 72.532* 8.484
(0.200) (0.106) (0.065) (0.071) (0.596)
Constant -3.149*** -2.706*** -1.679*** -1.803*** -1.785**
(0.000) (0.000) (0.000) (0.000) (0.012)
Industry fixed effects Yes Yes Yes Yes No
Province fixed effects Yes Yes Yes Yes No
Firm fixed effects No No No No Yes
Observations 5,854 5,854 5,854 5,854 5,854
R-squared 0.235 0.270 0.212 0.242 0.865

44
Table 7. Nationalizations
This table examines the change in firms’ patent stock before and after nationalizations. The sample consists of firm-year observations of firms that have undergone a nationalization between 2000 and 2011. For each nationalization event, we use five years of data before and five years of data after the event as observations. The key regression we estimate is the following:
log (𝑃𝑎𝑡𝑒𝑛𝑡_𝑆𝑡𝑜𝑐𝑘𝑖,𝑡 + 1) = 𝑎 + 𝑏1𝑃𝑂𝑆𝑇𝑖 ,𝑡 + 𝑏2𝐼𝑃𝑅𝑖,𝑡−1 + 𝑏3𝑃𝑂𝑆𝑇𝑖 ,𝑡 × 𝐼𝑃𝑅𝑖,𝑡−1 + 𝐶𝑜𝑛𝑡𝑟𝑜𝑙𝑠𝑖,𝑡−1 + 𝜀𝑖𝑡 The dependent variable is the (natural logarithm) of (one plus) a firm’s patent stock in the year t. POST is an indicator variable that takes on the value of one for years after nationalization, and zero otherwise; IPR is the measure of the IPR score in the prefecture where the firm is located in year t-1; and POST × IPR is the interaction between the two variables. Control variables include firm level characteristics measured at the end of year t-1: size (expressed as the logarithm of assets measured in RMB), intangible assets (as a fraction of total assets), return on assets (defined as net income divided by total assets), leverage (defined as total debt divided by total assets), and age (the number of years since the firm’s inception). Province-level controls include GDP growth from years t-1 to t (in decimals), university density in year t-1 (measured as number of four-year universities per 100,000 population), and the increase in government R&D subsidies (calculated as the increase in the amount of government R&D subsidy from years t-1 to t divided by the provincial GDP in year t-1). Standard errors are clustered by province. P-values are in parentheses. *, **, *** indicates statistical significance at the 10%, 5%, and 1% level, respectively.
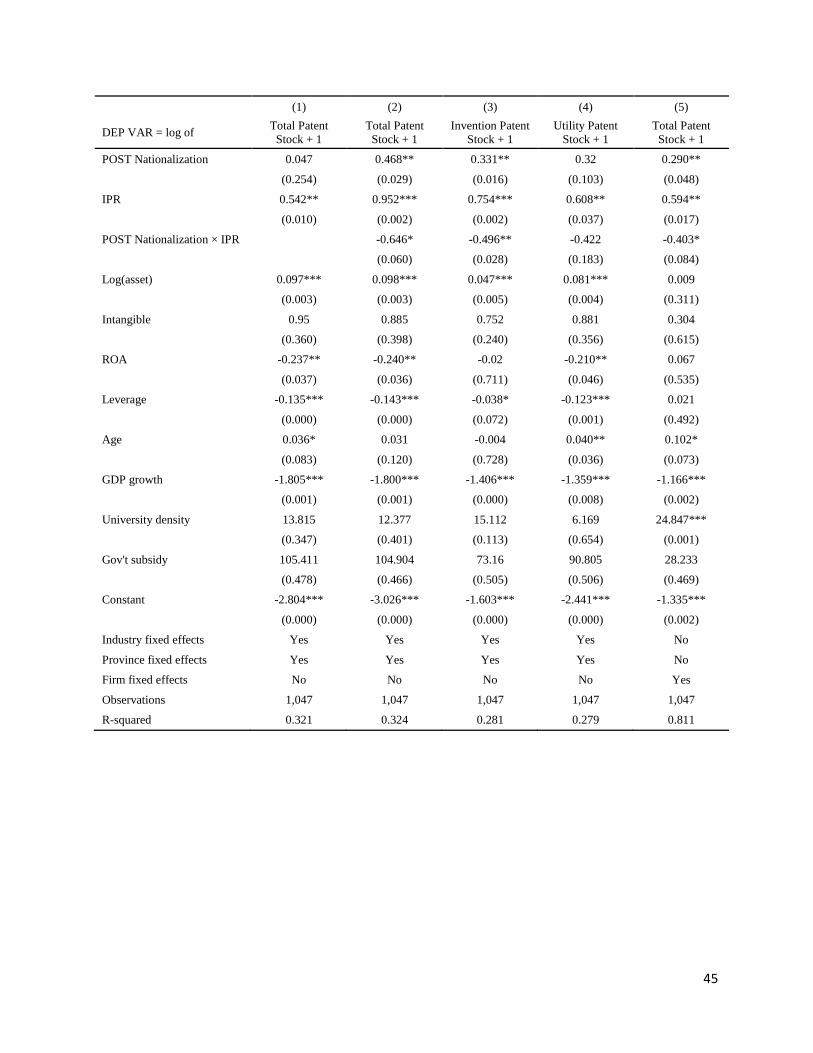
45
(1) (2) (3) (4) (5)
DEP VAR = log of Total Patent Stock + 1
Total Patent Stock + 1
Invention Patent Stock + 1
Utility Patent Stock + 1
Total Patent Stock + 1
POST Nationalization 0.047 0.468** 0.331** 0.32 0.290**
(0.254) (0.029) (0.016) (0.103) (0.048)
IPR 0.542** 0.952*** 0.754*** 0.608** 0.594**
(0.010) (0.002) (0.002) (0.037) (0.017)
POST Nationalization × IPR -0.646* -0.496** -0.422 -0.403*
(0.060) (0.028) (0.183) (0.084)
Log(asset) 0.097*** 0.098*** 0.047*** 0.081*** 0.009
(0.003) (0.003) (0.005) (0.004) (0.311)
Intangible 0.95 0.885 0.752 0.881 0.304
(0.360) (0.398) (0.240) (0.356) (0.615)
ROA -0.237** -0.240** -0.02 -0.210** 0.067
(0.037) (0.036) (0.711) (0.046) (0.535)
Leverage -0.135*** -0.143*** -0.038* -0.123*** 0.021
(0.000) (0.000) (0.072) (0.001) (0.492)
Age 0.036* 0.031 -0.004 0.040** 0.102*
(0.083) (0.120) (0.728) (0.036) (0.073)
GDP growth -1.805*** -1.800*** -1.406*** -1.359*** -1.166***
(0.001) (0.001) (0.000) (0.008) (0.002)
University density 13.815 12.377 15.112 6.169 24.847***
(0.347) (0.401) (0.113) (0.654) (0.001)
Gov't subsidy 105.411 104.904 73.16 90.805 28.233
(0.478) (0.466) (0.505) (0.506) (0.469)
Constant -2.804*** -3.026*** -1.603*** -2.441*** -1.335***
(0.000) (0.000) (0.000) (0.000) (0.002)
Industry fixed effects Yes Yes Yes Yes No
Province fixed effects Yes Yes Yes Yes No
Firm fixed effects No No No No Yes
Observations 1,047 1,047 1,047 1,047 1,047
R-squared 0.321 0.324 0.281 0.279 0.811

46
Table 8. Instrumental Variables (IV) Regression
This table reports IV regression results. In the first stage, we predict IPR scores using two instrumental variables: Christian College (the number of colleges founded by Christian missionaries in a province before 1920) and British Settlement (a dummy variable that equals one if the province had a British concession in the Qing Dynasty and zero otherwise). In the second stage, the unit of observation is (as in Table 6) annual observations of each privatized firm for the five years before and the five years after the privatization. The dependent and independent variables are identical to those in regressions (1) through (3) of Table 6, with the exception that we employ the instrumented value for the IPR protection measure. P-values are reported in parentheses. *, **, *** indicates statistical significance at the 10%, 5%, and 1% levels, respectively.
Panel A: First Stage Results DEPVAR = IPR Christian College 0.017***
(0.000) British Settlement 0.031***
(0.000) Gov't subsidy -8.891
(0.266) University density 3.044*** (0.000) GDP growth 0.681*** (0.000) Observations 5,854
R-squared 0.226 Partial-F test for IVs 143.84 (p=0.000)
Panel B: Second Stage Results (1) (2) (3)
DEP VAR = log of Total Patent Stock + 1 Invention Patent Stock + 1 Utility Patent Stock + 1
POST -0.340** -0.215* -0.206
(0.049) (0.064) (0.162) IPR (IV) 0.448 0.133 0.181
(0.156) (0.529) (0.502) POST × IPR (IV) 0.523** 0.344* 0.327*
(0.048) (0.052) (0.097) Controls Yes Yes Yes Observations 5,854 5,854 5,854 R-squared 0.234 0.18 0.209
Sargan-Hansen J statistic (Over-identifying restrictions)
1.715 4.251 0.717 (p=0.424) (p=0.119) (p=0.699)
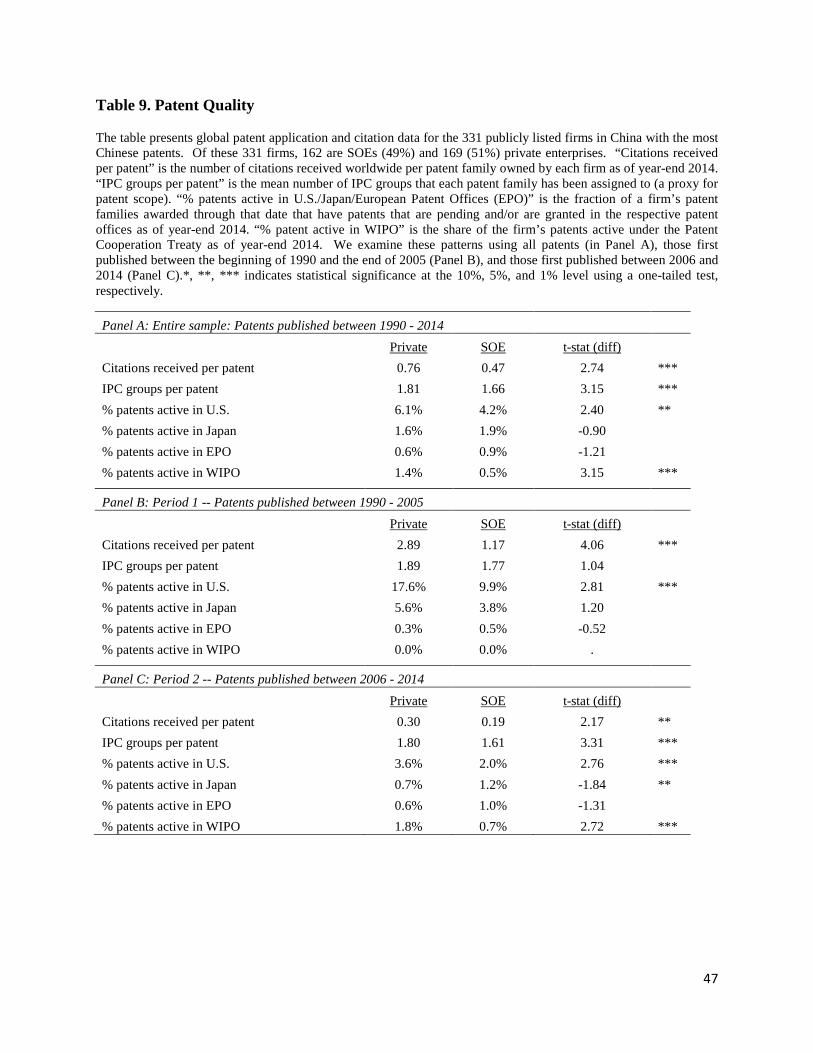
47
Table 9. Patent Quality
The table presents global patent application and citation data for the 331 publicly listed firms in China with the most Chinese patents. Of these 331 firms, 162 are SOEs (49%) and 169 (51%) private enterprises. “Citations received per patent” is the number of citations received worldwide per patent family owned by each firm as of year-end 2014. “IPC groups per patent” is the mean number of IPC groups that each patent family has been assigned to (a proxy for patent scope). “% patents active in U.S./Japan/European Patent Offices (EPO)” is the fraction of a firm’s patent families awarded through that date that have patents that are pending and/or are granted in the respective patent offices as of year-end 2014. “% patent active in WIPO” is the share of the firm’s patents active under the Patent Cooperation Treaty as of year-end 2014. We examine these patterns using all patents (in Panel A), those first published between the beginning of 1990 and the end of 2005 (Panel B), and those first published between 2006 and 2014 (Panel C).*, **, *** indicates statistical significance at the 10%, 5%, and 1% level using a one-tailed test, respectively.
Panel A: Entire sample: Patents published between 1990 - 2014
Private SOE t-stat (diff)
Citations received per patent 0.76 0.47 2.74 *** IPC groups per patent 1.81 1.66 3.15 *** % patents active in U.S. 6.1% 4.2% 2.40 ** % patents active in Japan 1.6% 1.9% -0.90
% patents active in EPO 0.6% 0.9% -1.21 % patents active in WIPO 1.4% 0.5% 3.15 ***
Panel B: Period 1 -- Patents published between 1990 - 2005
Private SOE t-stat (diff)
Citations received per patent 2.89 1.17 4.06 *** IPC groups per patent 1.89 1.77 1.04
% patents active in U.S. 17.6% 9.9% 2.81 *** % patents active in Japan 5.6% 3.8% 1.20
% patents active in EPO 0.3% 0.5% -0.52 % patents active in WIPO 0.0% 0.0% . Panel C: Period 2 -- Patents published between 2006 - 2014
Private SOE t-stat (diff)
Citations received per patent 0.30 0.19 2.17 ** IPC groups per patent 1.80 1.61 3.31 *** % patents active in U.S. 3.6% 2.0% 2.76 *** % patents active in Japan 0.7% 1.2% -1.84 ** % patents active in EPO 0.6% 1.0% -1.31
% patents active in WIPO 1.8% 0.7% 2.72 ***

48
Appendix 1 – Data Sources
This table lists the data sources used in this paper.
Source Data Provider IPR Protection Urban Competitiveness Report Blue Book The Chinese Academy of Social Sciences
Firm level patents http://epub.sipo.gov.cn/gjcx.jsp
The Chinese State Intellectual Property Office (CSIPO)
SOE Privatization 1. CSMAR CSMAR
2. Industrial Enterprises Database The National Statistical Bureau of China
Provincial level controls China Statistical Yearbooks The National Statistical Bureau of China
Firm level controls 1. CSMAR 2. Industrial Enterprises Database