Every Child Counts - UNICEF · Every Child Counts 2-i Note: Maps in this brochure are stylized and...
8
• In Africa, mortality rates among children under five decreased by 45 per cent between 1990 and 2012, but still half of the world's 6.6 million under-five deaths occur in Africa. • Pneumonia, malaria and diarrhoea account for 40% of all under-five deaths in Africa. • At least 1 in 3 children under five in Africa were stunted in 2011. • In 2012, there were an estimated 2.9 million children under 15 years living with HIV in Sub-Saharan Africa. • Over half of the world’s out-of- school children (33 million) live in Africa. • The population in Africa with access to an improved drinking source more than doubled from 1990 to 2012. • There has been major progress in the last decade in the use of insecticide- treated nets among children. Children in Africa Key statistics on child survival, protection and development The child population in Africa is burgeoning; by 2050, 1 in every 3 children under 18 will be African Between 2010 and 2025, the child population of sub-Saharan Africa will rise by 130 million. From around 2030, sub-Saharan Africa will be the single region with the greatest number of children under 18. By 2050, 1 in every 3 births and almost 1 in every 3 children under 18 will be African 0 10 20 30 40 50 1950 1970 1990 2010 2030 2050 Population (in millions) CEE/CIS East Asia and Pacific Industrialized countries Latin America and Caribbean Middle East and North Africa South Asia Sub-Saharan Africa Source: You, D., and D. Anthony. “Generation 2025: The critical importance of understanding demographic trends for the children of the 21st century”. UNICEF Occasional Paper, no. 1, September 2012. Prepared by: UNICEF Data & Analytics Division of Policy and Strategy May 2014 Find the latest statistics on children in Africa at the UNICEF-Statistics website: www.childinfo.org Key Statistics Sub-Saharan Africa South Asia East Asia and Pacific Number of births by UNICEF regions, 1950 - 2050 Every Child Counts UNICEF/NYHQ2012-1060/Noorani Note: Maps in this brochure are stylized and not to scale. They do not reflect a position by UNICEF on the legal status of any country or territory or the deliminatation of any frontiers. The final boundary between the Republic of the Sudan and the Republic of South Sudan has not yet been determined.
Transcript of Every Child Counts - UNICEF · Every Child Counts 2-i Note: Maps in this brochure are stylized and...
• In Africa, mortality rates among children under five decreased by 45 per cent between 1990 and 2012, but still half of the world's 6.6 million under-five deaths occur in Africa.
• Pneumonia, malaria and diarrhoeaaccount for 40% of all under-five deaths in Africa.
• At least 1 in 3 children under five in Africa were stunted in 2011.
• In 2012, there were an estimated 2.9 million children under 15 years living with HIV in Sub-Saharan Africa.
• Over half of the world’s out-of-school children (33 million) live in Africa.
• The population in Africa with access to an improved drinking source more than doubled from 1990 to 2012.
• There has been major progress in the last decade in the use of insecticide-treated nets among children.C
hild
ren
in A
fric
aK
ey s
tati
stic
s o
n c
hild
su
rviv
al, p
rote
ctio
n a
nd
dev
elo
pm
en
t
The child population in Africa is burgeoning; by 2050, 1 in every 3 children under 18 will be African
Between 2010 and 2025, the child population of sub-Saharan Africa will rise by 130 million.
From around 2030, sub-Saharan Africa will be the single region with the greatest number of children under 18.
By 2050, 1 in every 3births and almost 1 in every 3 children under 18 will be African
0
10
20
30
40
50
1950 1970 1990 2010 2030 2050
Po
pu
lati
on
(in
mill
ion
s)
CEE/CIS East Asia and PacificIndustrialized countries Latin America and CaribbeanMiddle East and North Africa South AsiaSub-Saharan Africa
Source: You, D., and D. Anthony. “Generation 2025: The critical importance of understanding demographic trends for the children of the 21st century”. UNICEF Occasional Paper, no. 1, September 2012.
Prepared by: UNICEF Data & AnalyticsDivision of Policy and StrategyMay 2014
Find the latest statistics on children in Africa at theUNICEF-Statistics website: www.childinfo.org
Key Statistics
Sub-Saharan Africa
South Asia
East Asia and Pacific
Number of births by UNICEF regions, 1950 - 2050
Every Child Counts
UN
ICEF/N
YHQ
2012
-1060/N
oo
rani
Note: Maps in this brochure are stylized and not to scale. They do not reflect a position by UNICEF on the legal status of any country or territory or the deliminatation of any frontiers. The final boundary between the Republic of the Sudan and the Republic of South Sudan has not yet been determined.

4
1110 8
1619
2827
11
25
16
35
4845
41
49
6057
88
23
32
38 38
46
62
69
50 52
62
71
85
0
10
20
30
40
50
60
70
80
90
100
Niger('08, '09,'10, '12)
Sierra Leone('05, '08, '10)
Burkina Faso('09, '11, '12)
Guinea Bissau('06, '11)
Mauritania('07, '08,'09, '10)
Togo('06, '08, '11)
Burundi('05, '10)
UnitedRepublic
of Tanzania('05, '10)
Ethiopia('05, '11)
Uganda('06, '11)
Malawi('06, '10)
Rwanda('05, '10)
Child Malnutrition in Africa
Recent advances in 7 African countries show that rapid progress in exclusive breastfeeding is possible
Key facts:• Stunting, or being too short for one’s age, is
linked with irreversible long term consequences; it diminishes chances of succeeding in school and of living healthy and productive lives.
• Africa is the only region with nearly negligible changes in the percentage (%) of stunted children since 1990.
• While other regions have halved the number of stunted children, Africa has increased by one third (due both to population growth and minimal progress in reduction of the percentage of stunted children).
• There are stark disparities between the richest and poorest in most AU sub-regions.
Stunting disparities are greatest in Western Africa
Source for all charts: UNICEF global databases 2014, based on DHS, MICS, and other national surveys; UNICEF, World Bank, WHO Joint Malnutrition Estimates, 2013.
Percentage of under-fives stunted (moderate and severe), by wealth quintile, 2007-2012 (%)
Trends in the percentage of infants 0-5 months old that are exclusively breastfed, in well-performing countries, 2005-2012 (%)
Well-performing countries Significant (> 15 percentage point) increases in the last 5 years
Additional well-performing countries Current high (>50 per cent) achievement
14.3million
newborns in the African Union were exclusively
breastfed in 2012
24.3
24.3 million newborns in the African Union were
not exclusively
breastfed in 2012
Non-exclusively breastfed infants could be at a substantially greater risk of death from diarrhoea than exclusively breastfed infants.
Rapid progress in exclusive breastfeeding is possible and needs to be prioritized
Stunting in Africa: falling far behind other regionsMillions of under-fives stunted, by region, 1990-2012 and Percentage of under-fives stunted, by region, 1990-2012 (%)
48
17
48
25
48
28
45
26
30
27
0
10
20
30
40
50
60
0.5 5.5Western Central Southern Eastern Northern
Africa Africa Africa Africa Africa
● poorest quintile● richest quintile--- gap
46 Africa 59
192 Asia91
14 LAC
7
42%
35%
48%
25%
25%
13%
40%
25%
1990 1995 2000 2005 2010 2012
0
10
20
30
40
50
0
100
200
300
400
500
600
700
800
Pro
po
rtio
n o
f st
un
ted
un
der
-fiv
es (
line)
Mill
ion
s o
f st
un
ted
un
der
-fiv
es (
bar
)
Exclusive breastfeeding

HIV/AIDS and Malaria in Africa
An estimated 2.9 million children under 15 years were living with HIV in Sub-Saharan Africa as of 2012; about 10 per cent of which were newly infected, mainly through mother-to-child transmission of HIV
Key facts:• Although progress has been made in
Africa to increase the prevention of mother to child transmission (PMTCT) of HIV and increasing pediatric anti-retroviral therapy (ART) coverage, much more progress is needed.
• In 2012, around 230,000 children were newly infected with HIV in Sub-Saharan Africa.
• Across Africa, about 3% of all under-five deaths are caused by HIV/AIDS, and in Southern Africa, an estimated 11% of under-five deaths are attributed to HIV/AIDS.
• Although some progress has been made, ARV coverage for PMTCT varied from 30% in Western Africa to 81% in Southern Africa in 2012.
Source: UNAIDS, UNICEF, WHO, 2013 Global AIDS Response Progress Reporting, and UNAIDS, Report on the Global AIDS Epidemic, 2013
Source: UNICEF global databases 2014, based on DHS, MICS, and other national surveys
Major progress during the last decade in the use of Insecticide Treated Nets (ITNs) among children
• During the last decade, the proportion of children sleeping under ITNs in sub-Saharan Africa increased from less than 5 per cent to over a third.
• In Madagascar and the United Republic of Tanzania, coverage increased from less than 3 per cent to over 70 per cent.
• Mass campaigns for distribution of ITNs are used to ensure that everyone is reached.
Children under-five sleeping under ITNs in Africa, early 2000s and around 2012
Coverage of Prevention of Mother To Child Transmission (PMTCT) and pediatric Anti-Retroviral Therapy (ART) coverage, by region, 2012 (%)
Malaria case management in endemic countries
• The use of Rapid Diagnostic Tests (RDT) to confirm malaria infection before starting treatment is still low.
• In most endemic countries, less than 50 per cent of febrile children under-five who receive anti-malarials are treated with artemisinin-based combination therapy (ACT), the recommended first line antimalarial drug.
Less than 10%
10-24%
25-50%
51-80%
Not malaria endemic
Data not available
Early 2000s
Around 2012
30
35
43
63
81
63
0
20
40
60
80
100
Coverage of the most effective ARVs for PMTCT
16 1518
30
46
32
Pediatric ART coverage
Western Africa
Central Africa
Northern Africa
Eastern Africa
Southern Africa
AFRICA
Child marriage, birth registration and Female Genital Mutilation/Cutting (FGM/C)
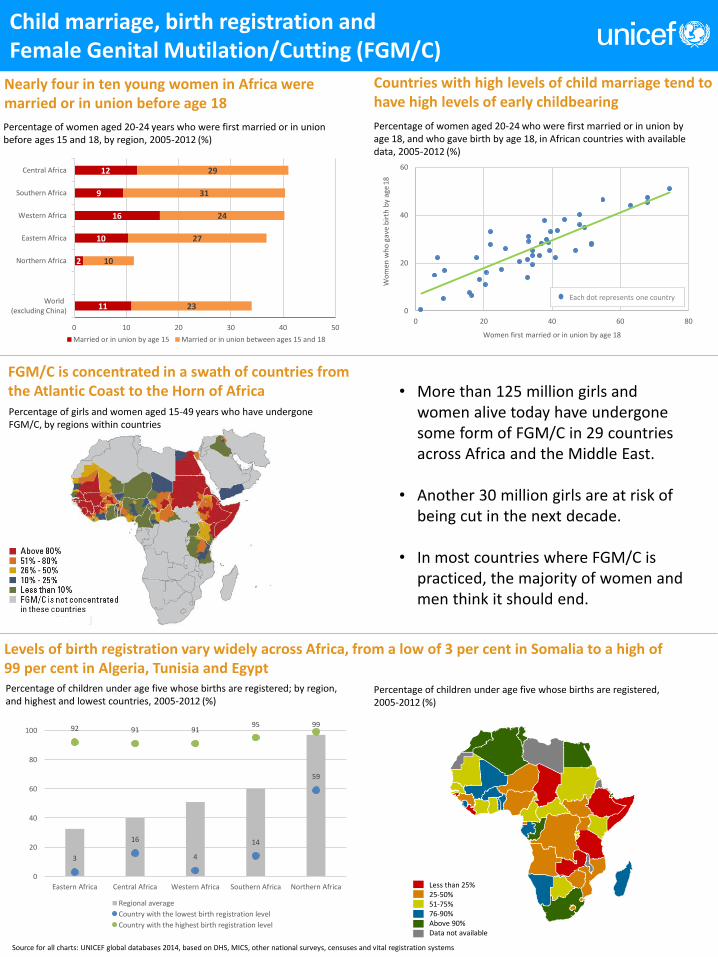
Countries with high levels of child marriage tend to have high levels of early childbearing
Nearly four in ten young women in Africa were married or in union before age 18
Source for all charts: UNICEF global databases 2014, based on DHS, MICS, other national surveys, censuses and vital registration systems
• More than 125 million girls and women alive today have undergone some form of FGM/C in 29 countries across Africa and the Middle East.
• Another 30 million girls are at risk of being cut in the next decade.
• In most countries where FGM/C is practiced, the majority of women and men think it should end.
FGM/C is concentrated in a swath of countries from the Atlantic Coast to the Horn of AfricaPercentage of girls and women aged 15-49 years who have undergone FGM/C, by regions within countries
Percentage of women aged 20-24 who were first married or in union by age 18, and who gave birth by age 18, in African countries with available data, 2005-2012 (%)
Percentage of women aged 20-24 years who were first married or in union before ages 15 and 18, by region, 2005-2012 (%)
11
2
10
16
9
12
23
10
27
24
31
29
0 10 20 30 40 50
World(excluding China)
Northern Africa
Eastern Africa
Western Africa
Southern Africa
Central Africa
Married or in union by age 15 Married or in union between ages 15 and 18
Levels of birth registration vary widely across Africa, from a low of 3 per cent in Somalia to a high of 99 per cent in Algeria, Tunisia and Egypt
Percentage of children under age five whose births are registered, 2005-2012 (%)
3
16
4
14
59
92 91 9195 99
0
20
40
60
80
100
Eastern Africa Central Africa Western Africa Southern Africa Northern Africa
Regional average
Country with the lowest birth registration level
Country with the highest birth registration level
Percentage of children under age five whose births are registered; by region, and highest and lowest countries, 2005-2012 (%)
0
20
40
60
0 20 40 60 80
Wo
me
n w
ho
gav
e b
irth
by
age
18
Women first married or in union by age 18
Less than 25%25-50%51-75%76-90%Above 90%Data not available
Each dot represents one country

0.6
0.7
0.8
0.9
1.0
1.1
1.2
Education in Africa
Only twelve African countries are near achieving universal primary education
Sources for above charts and map: UNICEF global databases, 2014 and UNESCO Institute for Statistics databases, 2013
Progress in primary enrolment has stagnated in recent years
Key facts:• Over half of the world’s out-of-school children
(33 million) live in Africa.• Girls are more likely to be out of school than
boys.• Children with disabilities are over-represented in
the out-of-school population.• Progress in reducing the out-of-school children
population has slowed down since 2005.• Many children fail to complete a full primary
education and fail to master basic literacy and numeracy skills.
In Africa, boys are more likely to be enrolled in primary school than girls
Net enrolment/attendance rate, 2007-2012
Net enrolment/ attendance rate
Gender parity index of primary enrolment, girls as a percentage of boys, African countries, 2008-2012
Even if they progress through the grades, many primary school children do not acquire basic knowledge and skillsPercent of cohort who reach grade 4 and achieve a minimal education level
0
20
40
60
80
100
Did not reach grade 4
Reached grade 4
Reached grade 4 and achieved minimum level of learning
Note: The definition of minimum learning levels differs between the two surveys, the Southern and Eastern Africa Consortium for Monitoring Educational Quality (SACMEQ) and the Programme of Analysis of Education Systems of the CONFEMEN (PASEC) and thus the results are not comparable. Source: EFA Global Monitoring Report 2012
SACMEQ, 2007 PASEC, 2004 - 2008
Parity
<70%70 – 84%85 – 94%95 – 100%Data not available
Girls more likely to be enrolled
Boys more likely to be enrolled
46 44 43 41 39 37 35 33 32 33 34 33
0
10
20
30
40
50
60
70
80
90
100
0
10
20
30
40
50
60
70
80
90
100
2000 2001 2002 2003 2004 2005 2006 2007 2008 2009 2010 2011 2012 2013 2014 2015
Ou
t-o
f-sc
ho
ol p
op
ula
tio
n o
f p
rim
ary
sch
oo
l age
(m
illio
ns)
Ad
just
ed n
et e
nro
lmen
t ra
te (
%)
Out-of-school boys of primary school age Out-of-school children of primary school age, Total Adjusted primary net enrolment rate for girls
Adjusted primary net enrolment rate for boys Adjusted primary net enrolment rate total
Out-of-school girls of primary school age
Primary school adjusted net enrolment rate (%) and out-of-school population of primary school age (millions) in Africa by sex, 2000-2011
Each marker represents the GPI of one country

All regions in Africa have experienced marked declines in under-five mortality since 1990In Africa, mortality rates among children under five (U5MR) have decreased by 45 per cent from 162 deaths per 1,000
live births in 1990 to 90 in 2012, but still half of the world's 6.6 million under-five deaths occur in Africa.
Child Mortality in Africa
Pneumonia, malaria and diarrhoea account for40% of all under-five deaths in Africa
Under-five mortality rate by country (deaths per 1,000 live births) and number of under five deaths by sub-region, 2012
Source: UNICEF analysis based on IGME 2013 and WHO & CHERG 2014
Distribution of under-five deaths in Africa by cause, 2012
Western Africa 1,386,000
Central Africa 631,000
Eastern Africa790,000
Northern Africa 98,000
Southern Africa 427,000
Despite declining rates, neonatal deaths are growing as a share of under-five deaths, amid faster progress in reducing mortality in the post-neonatal period
Age distribution of under-five deaths, Africa, 1990-2012
Under-five mortality rate, 1990-2012
Under-five mortality rate
Globally, almost half of all under-five deaths are attributable to malnutrition0%
20%
40%
60%
80%
100%
1990 1995 2000 2005 2010
Child deaths(ages 1 to 4)
Post-neonatal deaths(1-11 months)
Neonatal deaths(first month)
27%34%
48
90
131
113
90
70
24
90
162
165
206
148
167
74
0 50 100 150 200 250
World
Africa
Central Africa
Western Africa
Southern Africa
Eastern Africa
Northern Africa
Under-five deaths per 1,000 live births
1990
2012
Pneumonia (neonatal), 2%
Preterm birth complications, 11%
Intrapartum-related events, 10%
Sepsis, meningitis and
encephalitis, 6%
Tetanus, 1%
Congenital abnormalities, 2%
Other neonatal, 2%
Diarrhoea (neonatal), 0%
Diarrhoea (post-neonatal), 10%
Malaria, 14%
Injuries, 5%
Meningitis and encephalitis, 3%
AIDS, 3%
Measles, 2%
Other, 16%
Pneumonia (post-neonatal), 14%
Pneumonia 16%
All other causes of
death 23%
Neonatal 34%
Diarrhoea 10%Malaria
14%

Drinking Water and Sanitation in Africa
The population with access to an improved drinking water source in Africa more than doubled, from 351 million in 1990 to 746 million in 2012
In Africa only 39% of the population uses an improved sanitation facility; the population without access grew by 239 million despite 214 million people gaining access since 1990
Key facts:
• Drinking water coverage in Africa increased from 56% in 1990 to 69% in 2012.
• This rate of progress is not sufficient to meet the continent’s MDG drinking water target of 78% by 2015.
• Just over a quarter (27%) of the African population enjoys the convenience and associated health benefits of a piped drinking water supply on premises.
• The population without access to an improved drinking water source increased from 279 million in 1990 to 389 million in 2010, and then decreased to 338 million in 2012.
• Open defecation rates in Eastern Africa declined most from 45% in 1990 to 27% in 2012.
• Western and Central Africa made the least progress on sanitation.
• In Southern Africa 18% of the population still practices open defecation.
• Malawi, Angola, Ethiopia and Benin registered declines in open defecation rates of 25 percentage points or more since 1990. Sierra Leone, Sudan and Tanzania registered an increase in open defecation rates (see below).
Improved drinking water coverage in Africa, 2012 (%)
Sanitation coverage trends in Africa, sub-regions and urban and rural areas, 1990-2012
Source for all charts: WHO/UNICEF JMP, 2014 Update (forthcoming – April 2014) Open defecationImproved facilities Shared facilities Unimproved facilities
Western Southern Eastern Central NorthAfrica Africa Africa Africa Africa
32
19 2112
5
6
9
15
21 249
14
11
13
12
16
63
78
1425
27 26 3133
44
53
35 40
40
2534
2834
2432
23
2615
23
38
71
3424 25
32
49
90
39
0
20
40
60
80
100
WesternAfrica
EasternAfrica
CentralAfrica
SouthernAfrica
NorthernAfrica
Africa
(Co
vera
ge %
)
1990 2012
112229
15
29
(mill
ion
s)
99196
186
205
(mill
ion
s)
Urban
Rural
1990 2012
1990 2012
3 3
Sierra Leone
52
60
60
64
67
74
74
74
75
76
80
82
87
89
90
46
51
68
74
75
75
92
97
50
84
84
97
99
Niger
Togo
Sierra Leone
Nigeria
Mali
Guinea-Bissau
Guinea
Liberia
Senegal
Benin
Côte d’Ivoire
Burkina Faso
Ghana
Cape Verde
Gambia
DR Congo
Chad
CAR
Cameroon
Burundi
Congo
Gabon
Sao Tomé & Pr.
Mauritania
Morocco
Algeria
Tunisia
Egypt
50
52
53
55
62
71
75
92
96
Ethiopia
Tanzania
Sudan
Kenya
Rwanda
Uganda
Djibouti
Seychelles
Mauritius
Madagascar49
54
63
74
80
81
85
92
95
97
Mozambique
Angola
Zambia
Swaziland
Zimbabwe
Lesotho
Malawi
Namibia
South Africa
Botswana
South Sudan ND
Somalia ND
Eritrea ND
Comoros ND
Equatorial Guinea ND
Libya ND
57
92
66
80
38
18
9
24
37 40
5446
28
13
1990
2012
Per
cen
tage
(%
)
Open defecation rates, selected countries, 1990-2012
100
ND= No data
0 20 40 60 80 100
World
Africa
Southern Africa
Eastern Africa
Northern Africa
Western Africa
Around 1990
Around 2000
Around 2012
Maternal Health in Africa
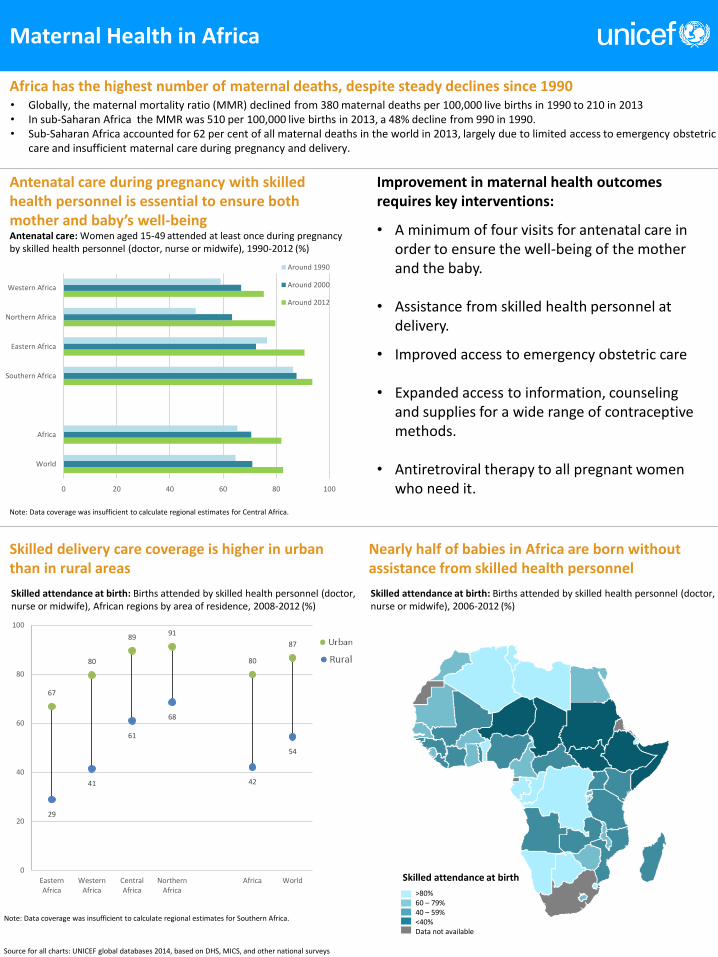
• Globally, the maternal mortality ratio (MMR) declined from 380 maternal deaths per 100,000 live births in 1990 to 210 in 2013• In sub-Saharan Africa the MMR was 510 per 100,000 live births in 2013, a 48% decline from 990 in 1990.• Sub-Saharan Africa accounted for 62 per cent of all maternal deaths in the world in 2013, largely due to limited access to emergency obstetric
care and insufficient maternal care during pregnancy and delivery.
Africa has the highest number of maternal deaths, despite steady declines since 1990
Antenatal care during pregnancy with skilled health personnel is essential to ensure both mother and baby’s well-being
Improvement in maternal health outcomes requires key interventions:
• A minimum of four visits for antenatal care in order to ensure the well-being of the mother and the baby.
• Assistance from skilled health personnel at delivery.
• Improved access to emergency obstetric care
• Expanded access to information, counseling and supplies for a wide range of contraceptive methods.
• Antiretroviral therapy to all pregnant women who need it.
Source for all charts: UNICEF global databases 2014, based on DHS, MICS, and other national surveys
Skilled delivery care coverage is higher in urban than in rural areas
Skilled attendance at birth
Note: Data coverage was insufficient to calculate regional estimates for Central Africa.
Antenatal care: Women aged 15-49 attended at least once during pregnancy by skilled health personnel (doctor, nurse or midwife), 1990-2012 (%)
Skilled attendance at birth: Births attended by skilled health personnel (doctor, nurse or midwife), 2006-2012 (%)
29
41
61
68
42
54
67
80
8991
80
87
0
20
40
60
80
100
EasternAfrica
WesternAfrica
CentralAfrica
NorthernAfrica
Africa World
Nearly half of babies in Africa are born without assistance from skilled health personnel
Skilled attendance at birth: Births attended by skilled health personnel (doctor, nurse or midwife), African regions by area of residence, 2008-2012 (%)
Note: Data coverage was insufficient to calculate regional estimates for Southern Africa.
>80%60 – 79%40 – 59%<40%Data not available


![Every Child Counts Initiative For Education [eccifed]](https://static.fdocuments.in/doc/165x107/615c3fb32010491908308a85/every-child-counts-initiative-for-education-eccifed.jpg)