evelopment and Testing Standards for Professional BI Reports · Web viewThe purpose of this...
43
Development and Testing Standards for BI Reports Version 1.4 /home/website/convert/temp/convert_html/5bc9d43309d3f2aa798d53fb/document.docx
Transcript of evelopment and Testing Standards for Professional BI Reports · Web viewThe purpose of this...

Development and Testing Standards for BI Reports Version 1.4
/tt/file_convert/5bc9d43309d3f2aa798d53fb/document.docx

Revision HistoryDate Version Author Description26/11/2015 0.1 Mary Rezvani Initial Draft
26/02/2016 0.2 Adam Gardner Initial review
21/03/2016 0.2 Don Telford Review and Added test section
22/03/2016 0.3 Adam Gardner First draft for review
26/04/2016 0.4 Mary Rezvani Review and correct various misspellings
04/05/2016 1.0 Adam Gardner First version for release
23/05/2017 1.1 Mary Rezvani Department level security has been added into “Security” section
11/07/2017 1.2 Christine Szell Added Applying Local Classes to Reports and General Data Format Recommendations
07/08/2018 1.3 Nick Holt Added Business Rules section
20/08/2018 1.4 Nick Holt Added Quick Reference Guide section
ApprovalsName Title Date of Issue VersionDan McHolm Director, Planning and Analytics
Adam Gardner Manager, Business Intelligence
DistributionName AreaDan McHolm Planning and Analytics
Durand De Zylva Business Intelligence (Planning and Analytics)
Nick Holt Business Intelligence (Planning and Analytics)
Robert Davies Business Intelligence (Planning and Analytics)
Mary Rezvani Business Intelligence (Planning and Analytics)
Ash Rakesh Business Intelligence (Planning and Analytics)
Don Telford Business Intelligence (Planning and Analytics)
Greg Edmonds Management Accounting and Reporting (Financial Services)
Rachel Casilla Management Accounting and Reporting (Financial Services)
David Parker Financial Planning and Analysis (Financial Services)
Greg Gorczynski Financial Planning and Analysis (Financial Services)
Jodie Butler Performance Reporting (Planning and Analytics)
Mary-Anne Craddock Performance Reporting (Planning and Analytics)
Su-Teng Kok Performance Reporting (Planning and Analytics)
Russel Sayers Performance Reporting (Planning and Analytics)
Josh Keain Performance Reporting (Planning and Analytics)
Senaka Ranbandara Performance Reporting (Planning and Analytics)
David Hirst Performance Reporting (Planning and Analytics)
Malcolm Knight HR Workforce and Performance Reporting (Human Resources)
Tamara Beames HR Workforce and Performance Reporting (Human Resources)
Development and Testing Standards for Professional BI Reports (<Project Component>) Version 1.4 Page 2 of 34

Table of Contents
1. Introduction.................................................................................................................... 51.1. Purpose.................................................................................................................................................51.2. Audience...............................................................................................................................................51.3. Scope....................................................................................................................................................5
1.3.1. In Scope........................................................................................................................................51.3.2. Out Scope.....................................................................................................................................5
1.4. Dependencies.......................................................................................................................................51.5. Assumptions.........................................................................................................................................51.6. Related Documents..............................................................................................................................5Terms and Abbreviations.............................................................................................................................6
2. Requirements................................................................................................................. 72.1. Documentation of Business Requirements...........................................................................................72.2. Originator.............................................................................................................................................72.3. Report Properties.................................................................................................................................72.4. Business Rules.......................................................................................................................................92.5. Prompt Page Mock-ups.......................................................................................................................102.6. Report Page Mock-ups........................................................................................................................112.7. Filters..................................................................................................................................................142.8. Security Requirments..........................................................................................................................142.9. Acceptance Criteria.............................................................................................................................15
3. Build Standards............................................................................................................163.1. Templates...........................................................................................................................................16
3.1.1. Template for Basic Reports.........................................................................................................163.1.2. Applying Local Classes to Reports...............................................................................................173.1.3. General Data Format Recommendations...................................................................................193.1.4. Template for Dashboards...........................................................................................................20
3.2. Naming Standards...............................................................................................................................203.2.1. Query..........................................................................................................................................203.2.2. Data Items with Queries.............................................................................................................203.2.3. Containers..................................................................................................................................213.2.4. Parameters.................................................................................................................................213.2.5. Prompts......................................................................................................................................223.2.6. Variables.....................................................................................................................................223.2.7. Report Description......................................................................................................................233.2.8. Report Output Format................................................................................................................243.2.9. Hiding Drill Through Report........................................................................................................24
4. Testing Standards........................................................................................................254.1. Report Development Process Flow.....................................................................................................254.2. Testing Acceptance Criteria................................................................................................................25
4.2.1. Test Report Against Acceptance Criteria....................................................................................25
Development and Testing Standards for Professional BI Reports (<Project Component>) Version 1.4 Page 3 of 34

4.3. Testing Accuracy.................................................................................................................................264.3.1. Reconcile report outputs with Source System............................................................................264.3.2. Reconcile Drill through reports with Parent...............................................................................26
4.4. Test Evidence......................................................................................................................................264.4.1. Report vs Source data comparions.............................................................................................274.4.2. Report vs source screen shots....................................................................................................274.4.3. Comments..................................................................................................................................28
4.5. Test Outcome.....................................................................................................................................284.5.1. UAT Pass.....................................................................................................................................284.5.2. UAT Fail.......................................................................................................................................28
5. Change Management...................................................................................................295.1. Change Management Page.................................................................................................................295.2. Change Control...................................................................................................................................305.3. Quick Reference Guide.......................................................................................................................30
6. Security.........................................................................................................................316.1. Data Level Security Implementation...................................................................................................316.2. Finance Department Codes with Cognos Local Groups......................................................................316.3. HR Department Tree with User List Framework.................................................................................33
Development and Testing Standards for Professional BI Reports (<Project Component>) Version 1.4 Page 4 of 34

1. Introduction
1.1. Purpose
The purpose of this document is to define a set of base standards for developing professional reports in Cognos Report Studio to ensure consistency, testing compliance, change management and best practice. There standards are intended to be ‘light’ and not restrict an iterative approach to report development but ensure the minimum information is collected to meet internal audit requirements.
1.2. Audience
The intended audience for this document are: Professional Report Authors (RA) working in the Business Intelligence and Management Accounting and
Reporting teams. Business, Functional and Management Information Analysts, Project Officers (BA) from various business
units or project teams (Requirements and Testing sections only). Subject Matter Experts involved in testing.
1.3. Scope
1.3.1. In ScopeThis document covers minimum standards for developing reports with Cognos Report Studio at the University of Adelaide including User Acceptance Testing (UAT)
1.3.2. Out ScopeThis document does NOT cover the following:
Specific Report Studio development techniques or any aspect of authoring reports with Cognos Workspace Advanced.
Testing of data warehouse ETL processes and functionality of Cognos BI Individual Test Plans (scripts) for a report that detail step by step instructions for testing, these should
be developed in conjunction with the requirements document. JIRA will not be used to execute test scripts
1.4. DependenciesAll Business Analysts and Subject Matter Experts (SME) will have access to JIRA and the Business Analytics Project.
1.5. AssumptionsAll testers will be familiar with JIRA functionality and workflow processes.
1.6. Related Documents
Name Version Location
Testing Standards.vsd S:\DVCA\S&P\Business Intelligence\Cognos\BI\Documentation\Admin
Development and Testing Standards for Professional BI Reports (<Project Component>) Version 1.4 Page 5 of 34

Terms and AbbreviationsTerm /Abbreviation Meaning
BI Business Intelligence
DEV Development Environment
TST Test Environment
PRD Production Environment
UofA University of Adelaide
LMM Load Management Model
EFTSL Equivalent Full Time Student Load
OLAP Online Analytical Processing
HR Human Resources
GL General Ledger
JIRA UofA’s task and issues tracking system for BI development
BA Business Analysts
SME Subject Matter Expert
RA Report Author
UAT User Acceptance Testing
ETL Extract Transform Load, the process of transferring data from the sources systems to the Data Warehouse.
BIA BI Administrator
Development and Testing Standards for Professional BI Reports (<Project Component>) Version 1.4 Page 6 of 34

2. Requirements
2.1. Documentation of Business Requirements
A minimum set of information must be collated in the JIRA for a new professional report or changes to an existing report. Preferably this activity is undertaken by a Business/Functional Analyst from the requesting area but given the diversity of the University it may need to be done by the Report Developer under some circumstances.
The Originator of the request Business rules
o List of business definitions used by the report (including source field mappings)o Report filter logico Identify criteria for extracting data from source tables, include extraction logic, transformation logic,
and how the data will be calculated before it is displayed Report properties For new reports:
o Mock ups for each prompt page showing the types of parameters requiredo Mock ups for each report page identifying, formatting, grouping, sorting and calculationso Filters hardcoded in the report (i.e. non parametrised filters)
For changes to existing reports:o Screenshot or output of the existing report with changes required clearly marked on prompt or
report pageso Clear articulation of any changes to formatting or calculationo If the change is significant enough then treat it as a new report
Security requirements Acceptance Criteria which will be used as a basis for testing the report
Typically most of this information can be provided in one Excel workbook and attached the JIRA, for example:
Sheet 1 Report properties, security requirements, filters, acceptance criteria and other supporting information
Sheet 2 Business Rules
Sheet 3 Prompt Page Mock-up
Sheet 4 Summary Report Output Mock-up
Sheet 5 Drill 1 Report Output Mock-up
Sheet 6 Drill 2 Report Output Mock-up
Sheet 7 User Acceptance Criteria
2.2. Originator
The original request including report purpose must be captured in JIRA, this can be done by attaching an email, memo or meeting minutes. The developer cannot be the originator.
2.3. Report Properties
A basic set of report properties must be captured in JIRA, these will be used to configure the report entry in the Cognos Connection portal. If these change throughout iterative development of the report then they need to be updated.
Development and Testing Standards for Professional BI Reports (<Project Component>) Version 1.4 Page 7 of 34

Item Description
Report Name Concise report name that differentiates its purpose from similar reports
Report Description Detailed report description including intended use and audience
Default Output Format HTML / Excel / PDF
Report Type Prompted / Dashboard / Burst / Scheduled
Development and Testing Standards for Professional BI Reports (<Project Component>) Version 1.4 Page 8 of 34

2.4. Business Rules
The expectation from this section is that the requestor has consulted source system or business owners to understand if the request is achievable and have identified underlying data sources, business rules and calculations. It is not always possible to get a BI developer assigned to a request that has domain knowledge and in some cases the developer may be a contractor or consultant external to the University.
Business rules are required to guide the development process and assist in understanding the complexity of the request. It will also enable the BI team to more accurately estimate report development effort, drive discussions and manage expectations.
This input will provide the basis for transformations and aggregations used in the report build, in addition to keeping business definitions consistent between reports. It is envisaged that this document will be updated with business rules when they are altered or known during this process (by the developer or requestor) and it is anticipated to be used post report build to keep business definitions consistent between reports.
Business rules should be captured in the same excel file used for report mock-ups in a tab called Business Rules, which should identify business definitions, source fields and any logic that can assist the request.
Below is an example of an acceptable business rule mock-up:
Additionally, providing SQL (If possible) for the desired result will assist the developer in building the correct output and speed up development time.
/tt/file_convert/5bc9d43309d3f2aa798d53fb/document.docx

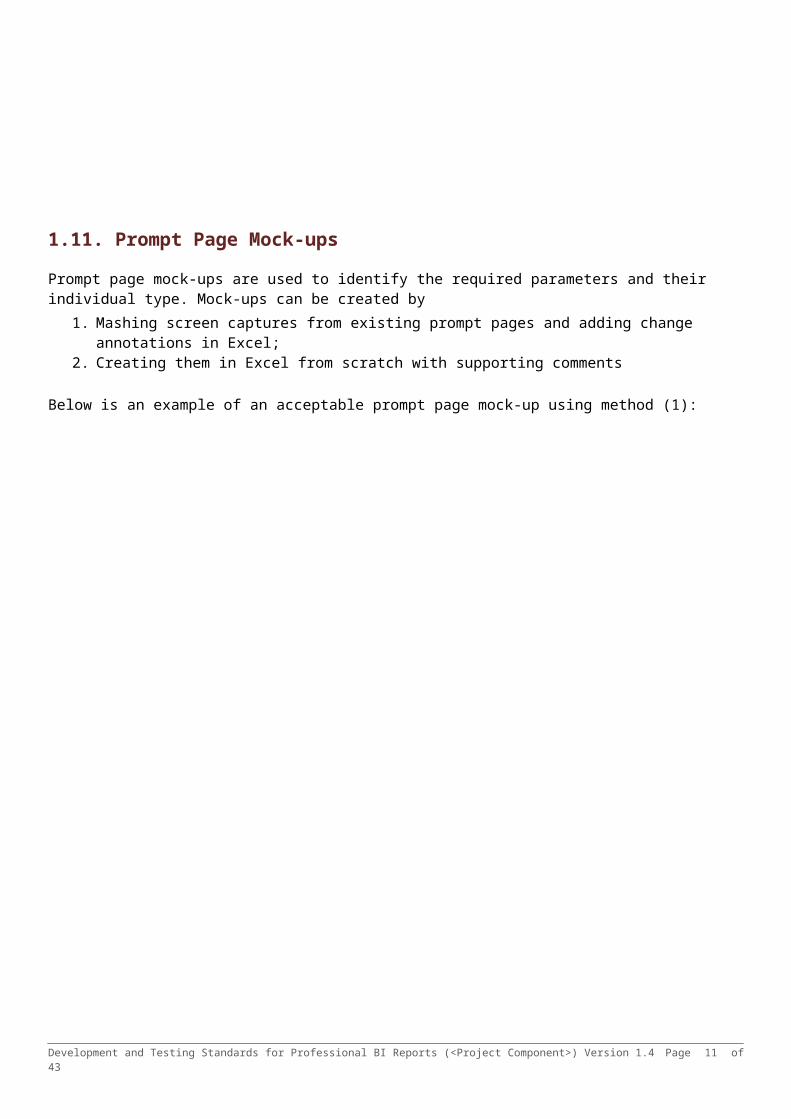
2.5. Prompt Page Mock-ups
Prompt page mock-ups are used to identify the required parameters and their individual type. Mock-ups can be created by
1. Mashing screen captures from existing prompt pages and adding change annotations in Excel;2. Creating them in Excel from scratch with supporting comments
Below is an example of an acceptable prompt page mock-up using method (1):
Cognos Report Requirement:
Project Inactivation and Balances (Summary)
(1)(4)
(2)
(5)(3)
(1) Ability to run report for: Whole University Research Accounting staffFaculty/Division Faculty/Divisional finance staffSchool/Branch School/Branch finance staffDepartment Optional
(2) Run for a particular month and for all or selected segments
(3) Ability to return Plan or Forecast data for tied projects
(4) & (5) Ability to run report for particular CI/PM or Project
Report to return all ACTIVE projects irrespective of balance value (including $0.00 balance) and INACTIVE projects where balance ≠ $0.00. Include year to date actuals totals for revenue and expenditure, and full year plan/forecast (based on selection) revenue and expenditure for tied projects
Note: It is unlikely the resulting prompt page will matched to the mock-up exactly as there may be technical or space restrictions. The purpose of the mock-up is to provide the developer with an understanding of how the user will interact with the report.
Development and Testing Standards for Professional BI Reports (<Project Component>) Version 1.4 Page 10 of 34
2.6. Report Page Mock-ups
Report page mock-ups are used to identify the fields, calculations, summaries, visualisations and formatting of report output. Multiple worksheets can be used when there is more than one output container, for example a report with drill through. Mock-ups are provided in Excel as:
1. Worksheets showing examples of report output with annotations for data sources, calculations, conditional formatting, etc.2. An existing report that has been output to Excel with changes and enhancements marked up
Below is an example of an acceptable report page mock-up using method (1):
/tt/file_convert/5bc9d43309d3f2aa798d53fb/document.docx

Salary Supplementation report requirements:Report Requirements, Mock-up & Short Description
1. Report Requirements
Report salary data per person, from MM/YYYY to MM/YYY selected in the report prompt Include multiple rows and a total for academics with mutiple records for the period selected, no total required for academics with a single record for the period selected Columns required per the report mock-up in 2., including separate columns for total salary components (Base Salary, Leave Taken, Provisions, etc.), returned to 2 decimal places Report to only be run for TIED segments (can choose to run for all or selected tied segments) Report to be run only for ACADEMIC salaries per HR system Include HR P/Soft Job Code per person/record Report security - University level (if possible, size of report may be too large) or otherwise at Faculty level Accessible by Research Accounting team (University level access) as the primary user group, potential to release to faculties/schools based on user security in future
2. Report Mock-up
Actual Tied Funds Academic SalariesYear/Month from: 2015 Jan Faculty/Division: header info to be returnedYear/Month to: 2015 Mar School/Branch:
Run Date: Cost Centre:*new
2015 Jan to 2015 Mar
Name Project ID Dept/Cost Centre Position/Job Title HR P/Soft Job Code
Person ID Cont Start Date
Cont Exp End Date
Grade-Step Base Salary Leave Taken Casual Loadings Overtime Terminations Others On Costs Provisions TOTAL
Doonan,Christian James 27107682 284 ARC Future Fellow (D) 1208890 1/01/2011 31/12/2014 Level D / 1 (977.41) 977.41 0.00 0.00 0.00 0.00 0.00 0.00 (42.72) (42.72) **Tully,Phillip 44111537 384 NHMRC NHF Clin Overseas Fellow 1068163 29/06/2013 28/06/2017 Level B / 1 100.00 100.00 0.00 100.00 0.00 0.00 0.00 100.00 (100.00) 300.00Tully,Phillip 44111537 384 NHMRC NHF Clin Overseas Fellow 1068163 29/06/2013 28/06/2017 Level B / 2 19,984.10 2,306.33 0.00 5,938.31 0.00 0.00 0.00 5,380.14 (224.72) 33,384.16
Total Tully, Phillip 20,084.10 2,406.33 0.00 6,038.31 0.00 0.00 0.00 5,480.14 (324.72) 33,684.16 ** e.g. totalWarin,Megan Jane 27114104 401 ARC Future Fellow (D) 1066097 12/01/2015 11/01/2019 Level D / 3 26,668.49 3,131.12 0.00 385.40 0.00 0.00 0.00 7,030.54 247.42 37,462.97 **
return to 2 decimal places** agrees to general ledger Mar-15
3. Report Short Description
This report provides a listing of academic salaries for the faculty selected, paid from tied funds projects per person (including accrual transactions) for the period selectedand is used for the calcuation of salary supplementation shortfall for externally-funded research-only fellows.
Below is an example of an acceptable report page mock-up using method (2):
Development and Testing Standards for Professional BI Reports (<Project Component>) Version 1.4 Page 12 of 34

Cognos Report Requirement:
Project Inactivation and Balances (Summary)Faculty of SciencesSchool of Biological Sciences
YTD: Mar/2015No CI/PM selectedAll ProjectsAll SegmentsPlanRun Date: 14/04/2015
Incomplete data - example report format only Additional data
Additional date - not yet in data
warehouse (refer "Actual Finish
Date" tab)
All Active and Inactive where
balance ≠ $0.00
$0.00 if no data for same month last year (e.g. new projects) $0.00 if no data $0.00 if no data
Project ID Project CI/PM Formal Name CI/PM ID No. Parent Project Department Start Date End Date Actual Finish Date
Peoplesoft Project Status
Actual Balance Actual End of Month Balance Same Month
Last Year
Actual Year to Date
Revenue
Actual Year to Date
Expenditure
Full Year Revenue
Plan/Forecast (tied funds
projects only)
Full Year Expenditure
Plan/Forecast(tied funds
projects only)20111077 13ARC_DP130103261_Climate mode Prof Tom Wigley axxxxxx 285 04/12/2012 31/12/2015 dd/mm/yyy Active
20111207 13ARC_DP130103842_Generalised Prof Corey Bradshaw 285 09/01/2013 30/06/2016
20111492 13ARC_DE130101567_Skulls as ma Dr Marc Jones 285 21/02/2013 10/06/2017
20111596 13ARC_DP130104055_Reconstructi APrf Jeremy Austin 285 13/03/2013 01/03/2016
20111733 13ARC_DP130102158_refining the Dr Wolfgang Haak 285 17/04/2013 31/03/2015
20111742 13ARC_DP130104314_The eocene h Dr John Conran 285 19/04/2013 31/12/2015
20112443 13ARC_DP130104078_Resilience APrf Justin Brookes 285 20/09/2013 31/12/2014
20112714 13ARC_DP0988846_Molecular and Dr Iain Searle 285 05/12/2013 30/09/2014
20112796 14ARC_DE140100963_Biof ilmandQu Dr Claudia Trappetti 285 17/12/2013 28/02/2017
20112846 13ARC_DP120104443_The Genetic Prof Robert Saint 285 20/12/2013 31/12/2015
20112949 14ARC_DP140102319_Transport ri APrf Phillip Cassey 285 13/01/2014 31/12/2016
20113400 14ARC_DP140104233_UsingPhyloge Prof Alan Cooper 285 28/03/2014 31/03/2017
20113522 14ARC_DP140103965_Genetic cont Prof Paul Thomas 285 23/04/2014 31/12/2016
20113929 14ARC_DP140104093_The applicat Dr Jonathan Tyler 285 25/07/2014 29/06/2017
20113940 14ARC_DP140100307_Fire,Water Prof Robert Hill 285 28/07/2014 31/12/2016
Development and Testing Standards for Professional BI Reports (<Project Component>) Version 1.4 Page 13 of 34

2.7. Filters
Some reports require additional filters that are not parameterised from the prompt page. These filters should be identified where possible for each report output.
The following table lists some of the common filters across the main reporting areas:
Category Data Item Filter Definition
Finance Reports
GL Accounting Period Excludes (0, 998, 999) Excludes financial periods not used in P/L
GL Account Level 1 Node Equals to 'NET OPERATING RESULT' Excludes balance sheet accounts
GL Ledger Code Equals to 'ACTUALS' Actuals ledger values only
HR Reports
Pay Grouping Code Not equals to ‘NA’ Payroll costs only
Org Relationship Code Equals to 'EMP' Staff records only
Empl Status Code Includes ('A','P') Active staff only
GP Pay Group Code Not equals to 'UNK' Payroll activated
Student Reports
EFTSL Greater than 0 Excludes enrolments with no load
Program Level Code Excludes ('01', '84', '85', '86', '98', '99','UNK') Exclude program load not funded
Campus Code Excludes ('BRAD', 'SIT', 'UWA') Exclude non UofA campuses
2.8. Security Requirments
Security requirements for the report should also be identified at this stage in terms of 1. Object security: the group of users who have access to run the report2. Data security: what data is accessible within the report
In most cases existing Object and Data security groups can be utilised, there are a large number of Object security groups that cover all of the existing report folders. For data security there are two models currently available and these must always be used for Finance and Human Resources reporting:
1. Finance Department Codes with Cognos Local Groups (Department level security)2. Human Resource Department Tree with User List Framework (Department level security)
There is no data level security in Student based reports, only object level security is applied.
If unsure what model to use the at least identify the intended audience of the report so it can be mapped to an existing group, or in the unlikely case that new security groups are required.
/tt/file_convert/5bc9d43309d3f2aa798d53fb/document.docx

The Report Studio implementation standard for different data security models is detailed in section 5.
2.9. Acceptance Criteria
Acceptance criteria will provide a basis for testing the report and should address the following categories:
Item Description Example
Accuracy The report can be reconciled to a trusted source of truth
Report summaries and totals match General Ledger account balances
Functionality Specific prompt page and/or drill functionality required in the report
The report can be filtered by Leave Type and drill through to individual leave taken transactions by day
Security The report can only be run by authorised users and output is filtered by their data security profile
Report is available to Faculty/Division level users and above. User can only see data that related to their Faculty/Division.
Presentation Variations from the basic template relating to fonts, size, colour, position, chart, formatting (and especially conditional formatting)
If there are less than 5 survey question responses the field value should be hidden
Performance Acceptable performance threshold given processing frequency, complexity and output volume
The report should execute within 20 seconds
The acceptance criteria can be entered directly into JIRA projects using the agile template or alternatively captured in the requirements workbook.
Development and Testing Standards for Professional BI Reports (<Project Component>) Version 1.4 Page 15 of 34

3. Build Standards
3.1. Templates
3.1.1. Template for Basic ReportsAll Professional Report development should be based on the standards in Basic Report Template – UoA Local Classes.This report is available in the development environment in the following folder:
Report Authors need to follow the standards in this template when they develop a new report or change an existing report.This Template shows Prompt Page look, Report Output format and the naming standard for Variable, Query and Parameter.Note: JavaScript is not permitted in Professional Reports unless approved by Manager, Business Intelligence.Note: to keep reports’ style consistent, make sure 10.x styles has been selected in the Report Properties when you apply changes to an existing report (some reports have been developed in Cognos 8 which come up with 8 styles).
Development and Testing Standards for Professional BI Reports (<Project Component>) Version 1.4 Page 16 of 34

3.1.2. Applying Local Classes to ReportsA set of report style classes have been created as ‘Local Classes’ in the report template to standardise the format of some objects for UoA reports.
These can be seen from the ‘Page Explorer’ by selecting ‘Classes’:
List of ‘Local Classes’:
The Local Classes can be transferred across to existing BI reports by highlighting / selecting them all from the template and then copying and pasting them across into the existing report’s Local Classes list by clicking into the empty Local Classes section and using Ctrl C and Ctrl V or the Edit Copy and Paste Functionality. Note: Use Internet Explorer when doing this as this does not work using Firefox.
The Local Classes are used to augment the default Global Class Extensions applied to the relevant objects. As such the existing Global Class Extensions are left against the object and the Local Class is then added, and left ordered beneath the existing class(es) on the list.
Development and Testing Standards for Professional BI Reports (<Project Component>) Version 1.4 Page 17 of 34

When applying to existing reports, ensure that any object formatting options that may have already been applied manually to the selected object(s) via the properties panel are first removed, otherwise these may over-ride the formatting of the newly applied Local Class.
Example: Where to Apply the UoA Local Classes
FACULTY/DIVISION ANNUAL BUDGET VIEW BY SCHOOL/BRANCH2016 March Forecast vs 2017 Live Budget UoA Report Header ParameterRun Date: Jul 11, 2017 2:36:46 PM
Local Class
UoA List Title Row
2016 March Forecast 2017 Live Budget Variance UoA List Column Title RowStudent Services (505,948) (505,948) (0)Teaching & Research Materials (367,768) (367,057) (711)Building & Grounds (463,008) (461,070) (1,938) UoA Column HighlightFinance & Fun Administration (22,757) (22,758) 1Non Salary Expenditure (2,065,267) (2,064,642) (626)Capital (170,434) (170,433) (0)Internal Transfers In 1,285,293 0 1,285,293Internal Transfers Out (1,281,586) 0 (1,281,586) UoA Data Header / Total Row Lvl 3Net Internal Transfers 3,708 0 3,708 UoA Data Header / Total Row Lvl 2Operating Expense (6,567,156) (6,459,710) (107,446) UoA Data Header / Total Row Lvl 1Net Operating Result 3,137,400 2,665,934 471,466 UoA Data Header / Total Row Lvl 0
All ProjectsAustralian School of Petroleum
Development and Testing Standards for Professional BI Reports (<Project Component>) Version 1.4 Page 18 of 34

3.1.3. General Data Format RecommendationsNumbers
No wrap Negatives bracketed Right Align
Dollars No wrap 2 decimal places Right align
Text Fields (Includes: Department ID, Account, Project ID) No wrap Left align
Dates / Fiscal Yr / Period No wrap dd/mm/yyyy Right align
Fiscal Yr No wrap YYYY Left align
Period No wrap Display Number not Description Left align
3.1.4. Template for DashboardsThere are no specific templates developed for Dashboards however any future dashboard development should be based on those used in Workforce Analytics. For copies of these objects to use as a template contact the Business Intelligence Administrator.
Development and Testing Standards for Professional BI Reports (<Project Component>) Version 1.4 Page 19 of 34

3.2. Naming Standards
3.2.1. QueryAll queries must be given a meaning full name in line with its purpose in the report:
3.2.1.1. Prompt Query
Queries used to source prompt objects must be named meaningfully and postfixed with ‘Prompt’(Meaningful Business Name) + PromptExamples:
3.2.1.2. Non-Prompt Query
Queries used to source other queries or data containers must be named appropriately so the dependencies can be traced and postfixed with ‘Query’(Meaningful Business Name) + QueryExamples:
3.2.2. Data Items with QueriesEnsure data items have meaningful names but most importantly only include data items in the query that are required for presentation, filtering or calculation. Including data items in the query that are not actually required may diminish performance and makes into more difficult for another developer to understand report logic.
Development and Testing Standards for Professional BI Reports (<Project Component>) Version 1.4 Page 20 of 34

3.2.3. ContainersContainers are objects used to present data on a report page, common examples are List, Crosstab, Chart and Singleton. Containers must use the same meaningful names as the provider query but postfixed with the container type rather than the word ‘Query’.
(Meaningful Business Name) + (Container’s Type)Example 1: Query: International Applications Acceptances Query
A chart container using the same query as the crosstab above.
Example 2:
Example 3 Query: Project Balances Query
3.2.4. ParametersParameter names are to be prefixed with a lowercase ‘p’ before a meaningful name in mixed case with no spaces. Ideally the meaningful name should be a simplified version of the data item name it is being used to filter, however this can not always be the case when a parameter is used to filter multiple data items.p+(MeaningfulName)Examples:
Development and Testing Standards for Professional BI Reports (<Project Component>) Version 1.4 Page 21 of 34

3.2.5. PromptsIn addition to normal prompt configuration ensure the ‘Header Text’ property is always set to indicate the required action. Select + (Prompt’s Label in the Prompt Page)
3.2.6. VariablesVariables names are to be prefixed with a lowercase ‘v’ before a meaningful name in mixed case with no spaces. Where possible the name should indicate the purpose of the variable and the condition if it can be simplified.v+(MeaningfulName)Example:
Development and Testing Standards for Professional BI Reports (<Project Component>) Version 1.4 Page 22 of 34

3.2.7. Report DescriptionThe report description within report properties must always be set to the description provided in the report requirements so it is visible to users in Cognos Connection.
To set the Description follow the steps below:Click on the Properties of the report
Enter the description in the highlighted field and press OK.
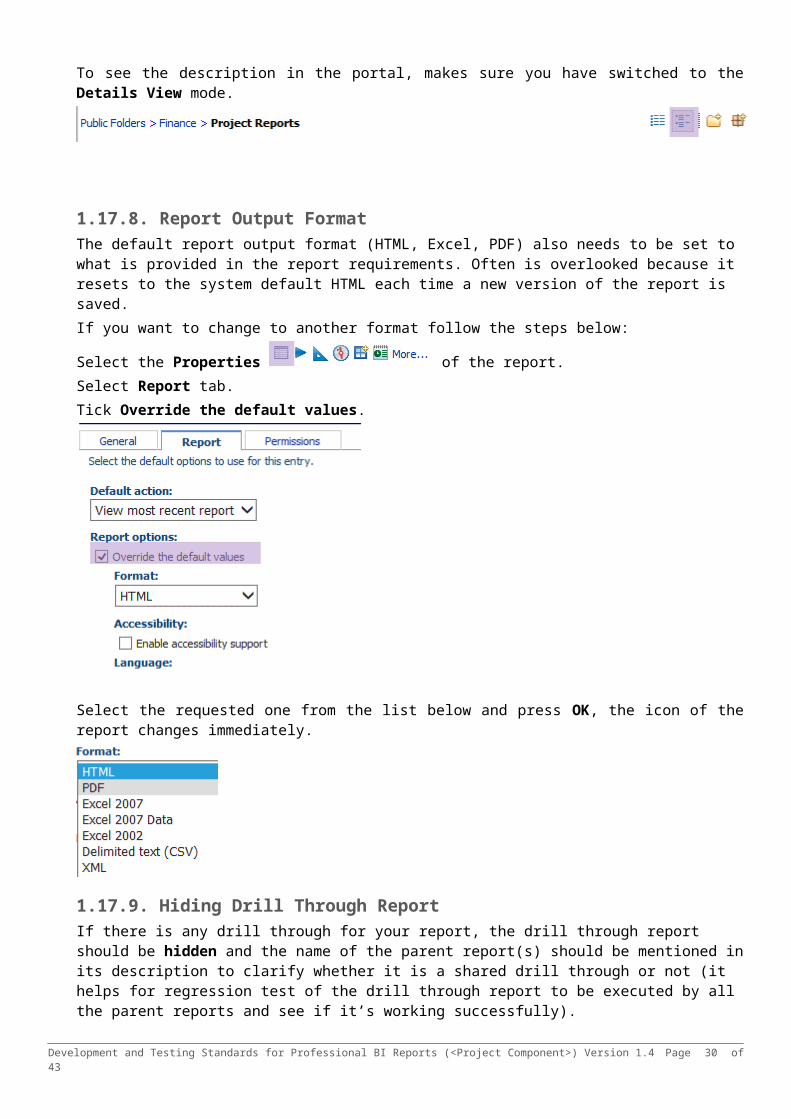
To see the description in the portal, makes sure you have switched to the Details View mode.
Development and Testing Standards for Professional BI Reports (<Project Component>) Version 1.4 Page 23 of 34

3.2.8. Report Output FormatThe default report output format (HTML, Excel, PDF) also needs to be set to what is provided in the report requirements. Often is overlooked because it resets to the system default HTML each time a new version of the report is saved.If you want to change to another format follow the steps below:
Select the Properties of the report.Select Report tab. Tick Override the default values.
Select the requested one from the list below and press OK, the icon of the report changes immediately.
3.2.9. Hiding Drill Through ReportIf there is any drill through for your report, the drill through report should be hidden and the name of the parent report(s) should be mentioned in its description to clarify whether it is a shared drill through or not (it helps for regression test of the drill through report to be executed by all the parent reports and see if it’s working successfully).
To hide a drill through report select the Properties and tick the Hide this entry.
Development and Testing Standards for Professional BI Reports (<Project Component>) Version 1.4 Page 24 of 34

Development and Testing Standards for Professional BI Reports (<Project Component>) Version 1.4 Page 25 of 34

4. Testing Standards
4.1. Report Development Process Flow
Once a report request is created in JIRA (issue) it progresses through the following work flow: 1) Open – no work has commenced.2) Requirements – as per Requirements in section 23) Design – mock-ups as per Requirements in section 24) Build – Develop reports/dashboards/drill throughs in Report Studio5) Functional Test – unit testing by developer and other BI unit members6) User Acceptance Testing – Conducted by SME’s or BA’s including the collection of test evidence against
acceptance criteria7) Deploy/Fail – Depending on testing outcome, if all testing passes then issue set to Deploy otherwise fail and
the issue status is then set back to Build.8) Closed
4.2. Testing Acceptance Criteria
The following diagram provides an overview of the responsibilities and process flow for report testing:
The focus of this standard is the testing of Acceptance Criteria by BA’s and SME’s as part of the UAT workflow status, notably the collection of test evidence to prove Accuracy.
4.2.1. Test Report Against Acceptance CriteriaBased on the Acceptance Criteria in the requirements documentation the following specific tests should be performed for the report (where applicable)
Item Description Types of tests
Functionality Specific prompt page and/or drill functionality required in the report
Prompt pages are run with a variety of combinations to ensure the following meet the requirements:
Use values, display values and sort orders Inclusions and exclusions Mandatory vs optional Default values
All drill through links should be tested to ensure correct target is activated. Drill through reports should be tested with their own discrete set of acceptance criteria.
Security The report can only be run by authorised users and output is filtered by their data security profile
Reports are run using different test accounts with various University, Faculty and School profiles to ensure data and object level security meets the requirements. Contact the Business Intelligence Administrator for access to these accounts.
Development and Testing Standards for Professional BI Reports (<Project Component>) Version 1.4 Page 26 of 34

Presentation Variations from the basic template relating to fonts, size, colour ,position, chart, formatting (and especially conditional formatting)
Presentation of lists, crosstabs and charts are consistent with mock-ups. Target output format is set correctly.Test cases for all permutations of conditional formatting should be executed to confirm expected behaviour.
Performance Acceptable performance threshold given processing frequency, complexity and output volume.
Report execution is timed for prompt combinations to ensure it is within thresholds.
Accuracy The report can be reconciled to a trusted source of truth
See next section.
4.3. Testing Accuracy
Accuracy is the most import acceptance test because it ensures reports can be used confidently to support decision making. While most of the other test criteria can be performed simply by running various report permutations and observing results testing report accuracy requires more rigour and the collection of evidence in the forms of reconciliation with the source of truth.
4.3.1. Reconcile report outputs with Source SystemOnce the report has been tested against the requirements and information is presented as expected the next step is to reconcile the data with the source system taking into account any filters/logic that are applied to the report and the data warehouse ETL process.
If there are existing trusted operational reports in the source system these should be used to compare and reconcile data with the Cognos report.
If existing reports are not available and the report is complex and high impact then specific SQL scripts may need to be developed directly against the source to be used as a source of truth. Particular when the report is being used to test the accuracy of a new data warehouse subject area.
Other BI reports that have passed UAT and are considered a source of truth can be used as a baseline for reconciling new reports that reference the same measures.
When the previous options are not feasible a series of spot checks may need to be performed by comparing source system screen outputs with reports values. While this method is not full proof it is acceptable for simple reports or those developed from a mature data warehouse subject area.
To reconcile the data a number of approaches are advised: Comparing both data sets in Excel with vlookups and other Excel functions SQL comparisons within a database where possible Individual record comparison
4.3.2. Reconcile Drill through reports with ParentDrill through targets should match exactly with the summary value from the parent report. All drill through links should be tested with a variety of prompt values.
4.4. Test Evidence
In order to satisfy audit requirements and ensure accuracy of report data one or more of following test evidence items must be recorded in the JIRA issue as an output of the testing process.
Development and Testing Standards for Professional BI Reports (<Project Component>) Version 1.4 Page 27 of 34

4.4.1. Report vs Source data comparions Excel Workbook where data extracts from the report and source are loaded into the workbook and then
compared using appropriate functions and techniques Output from SQL script comparing two data sources
Below is an example where data from Orbit and a BI report have been extracted into the same Excel workbook and comparisons are made, expected differences have been highlighted so the test was passed:
Here is a different example where data from a BI report is being reconciled against data extracted from PeopleSoft in a spreadsheet, vlookup is used to compare the data and identify variances:
4.4.2. Report vs source screen shots Screen captures of the source system with highlighted fields that were compared with the report output Cognos Report output in excel, with annotations indicating matches/non matches with other report outputs
Below is an example of screen shots of both the parent report output and the drill through report output for a selected intersection in crosstab. The total of the drill report matches the parent reports intersection therefore the test is passed:
Development and Testing Standards for Professional BI Reports (<Project Component>) Version 1.4 Page 28 of 34

4.4.3. CommentsWhen any document is uploaded an accompanying comment must be provided in JIRA regarding the testing outcome, for example, ‘All data matches - UAT PASS’ or ‘Missing Data – UAT FAIL’.
4.5. Test Outcome
4.5.1. UAT PassWhere all data reconciles, the report is functioning as expected and test evidence has been recorded in the JIRA, then UAT has passed and the report will be moved to production on the next available release date, refer to ‘Request Migration to PRD and Assign to BA’ step in the process flow.
4.5.2. UAT FailWhere all data does not reconcile and/or the report is not functioning as expected, test evidence must still be recorded in the JIRA and UAT has failed. The defect will need to be investigated by the BA and may need to go back to the Report Author for more build work. In some circumstances, defects may not really be a result of an error in the report but an invalid combination of parameters that return an unexpected results in these circumstances the report may UAT passed and move to production.
Development and Testing Standards for Professional BI Reports (<Project Component>) Version 1.4 Page 29 of 34
5. Change Management
5.1. Change Management Page
The Change Management Page is a method of sharing business and technical change details with other report developers. It is a normal report page that has been set to not render at report execution. All new reports must have a Change Management Page and it is built into the basic template. When changing existing legacy reports the page must be added manually if it hasn’t been done already.
The Change Management page contains a table to be completed as a change log every time a report is created or modified. The key purpose is to enable future developers to understand the full history of the report with the focus on the more complex development techniques used.
In each section notes must be entered to assist other report developers understand the implementation, the JIRA number, Author and Date must also be recorded for every instance.Purpose/Description: This would encompass the report description captured in properties but include additional technical information such as data sources, data quality issues or limitations.Query Comments: Note any specific Query properties settings (such as Auto Group & Summarize, Cross Product Allowed, Preserve Duplicates on Union, Use SQL With Clause, Use SQL Parameters) that have been changed from the default and why. Explain if there is any specific implementation in queries to reach the expected result like feeding a query to another one, joins, unions, etc. Comment on any complex calculations or filters to aid understanding.Layout/Formatting Comments: Explain any specific presentation object setting especially conditional formatting or rendering logic, conditional blocks and block variables, drill behaviour or drill through.Other Comments: Burst report, Scheduling, etc.
Note: if there is a User Guide for the report ensure the business or functional analyst updates the user guide as required.
Development and Testing Standards for Professional BI Reports (<Project Component>) Version 1.4 Page 30 of 34

5.2. Change Control
The following process is to be used when making changes to report in the BI development environment. This simple method aims to ensure developers do not make changes to a report that is currently undergoing changes by another developer.
1. The developer must first ‘check out’ the report by disabling the report under the Reports folder. This will indicate to other developers that the report is currently being changed by someone. Additionally the developer should also add their name in the description field to say who has a hold of the report, eg. text on a separate line saying ‘CHECKED OUT BY: John Smith ext1111’. During the time the report is disabled the report belongs to the developer who disabled it and no other developer should be working on it. Also, it shows there is a report under development, if other reports in that folder need to be migrated to TST environment.
2. Report developer should log each change into the Change Management Page of the report.
3. When the report is ready for migration to TST environment, then the report be ‘checked in’ by re-enabling the report, and removing the ‘CHECKED OUT BY..’ in the description field.
5.3. Quick Reference Guide
The report requestor will need to provide a quick reference guide (one per report with the same name as the report) before the report is released to production. Quick reference guides will be added to the same location as the report in a folder called “Quick Reference Guides”. This document should provide information on how to run the report and more importantly the intended use of the report..
Examples of quick references guides provided by HR for CAPS reporting are in the following location:
Development and Testing Standards for Professional BI Reports (<Project Component>) Version 1.4 Page 31 of 34

[6.] Security
5.4.[6.1.] Data Level Security Implementation
This section describes the coding standards for implementing the data level security models:1. Finance Department Codes with Cognos Local Groups (Department level security)2. Human Resource Department Tree with User List Framework (Department level security)
The purpose of this section is not to define the how these security models are configured across the Cognos/TM1 environments but how they should be applied in Report Studio.
5.5.[6.2.] Finance Department Codes with Cognos Local Groups
This security model is based on the department, school and faculty node name from the ‘ALL_DEPARTMENTS’ tree in PeopleSoft Finance. This tree structure is replicated as Cognos namespace groups that are then assigned to users based on their access authorisation.
The macro CSVIdentityNameList() has been used in Framework Manager to define filter which can be used in reports to filter data. In TM1 the Cognos namespace groups are imported and used for element level security in Finance Department dimensions across various applications. Element security is applied directly in Cognos BI through the integrated security mode.
Relational Data SourcesThe following filter (has been defined in FM) must be included on prompt queries (i.e. Faculty/Division, School/Branch, Dept/Cost Centre) and other base data queries (this is overkill but better to be safe than sorry).
Filter Definition:
Development and Testing Standards for Professional BI Reports (<Project Component>) Version 1.4 Page 32 of 34

TM1 Data SourcesElement security is automatically applied to the underlying TM1 department dimension exposed in Cognos BI packages e.g. GL Department. However, due to element security the Faculty/Division Level in the Department dimension will display empty in prompts and reports if the user only has school level access. This means prompt pages and query containers need to present differently depending on the users security profile. This is achieved by using conditional variables and blocks/rendering based on whether the user’s CSVIdentityNameList() includes Cognos_FI_School. I.e. they are a ‘school level user’.
Below is the standard for how a conditional block is used to determine which prompts to display on a prompt page:
Data Item set to return CSVIdentityNameList():
Variable vAccessLevel created to test if ‘Cognos_FI_School’ exists in data item:
Prompt Page with a conditional block:Current Block: Yes
Current Block: No
Block Variable set to use vAccessLevel variable:
Note: Data security at Department level has been only applied into Finance Self Service package. Data security in cube-based finance reports are still at School level.
Development and Testing Standards for Professional BI Reports (<Project Component>) Version 1.4 Page 33 of 34

5.6.[6.3.] HR Department Tree with User List Framework
This security model is based on the BIACC list from HCM PeopleSoft User List Framework. This list was specifically created to manage data level access to reports in BI that are driven by the HR Department Tree (DEPT_SECURITY).
This data is surfaced in BI to authorised developers as a Query Subject and provides a list of user ID and all of the different HR departments to which they have been granted access including the current tree rollup. This dataset supports Faculty, School and Department level security but only for relational data sources.
Below is the development standard for how the Query Subject is used in prompt pages and dashboards:
Relational Data SourcesA prompt query is created based on data items from the [Security].[Department (HR) (Current) Secured] Query Item.
The following set of filters can be optionally included to show only active or recent departments:
[Effective Status Code] = 'A' or [Effective Date] > to_date (greatest(to_char(to_number(to_char({sysdate}, 'YYYY')) - 4), '2011') || '0101', 'YYYYMMDD')
A set of cascading prompts based on the prompt query then restricts the user’s selection to their security profile:
Additionally parameter should be applied to the secured data items in other non-prompt queries:
[Security].[Department (HR) (Current) Secured].[Faculty/Division] = ?pFacultyDivision?[Security].[Department (HR) (Current) Secured].[School/Branch] = ?pSchoolBranch?[Security].[Department (HR) (Current) Secured].[Department] = ?pDepartment?
Development and Testing Standards for Professional BI Reports (<Project Component>) Version 1.4 Page 34 of 34