Evaluation of thermal and mechanical properties of the...
41
Evaluation of thermal and mechanical properties of the composite material of LignoBoost- lignin and recycled polyurethane A preliminary feasibility study for a novel composite material from waste materials Utvärdering av termiska och mekaniska egenskaper hos kompositmaterialet av LignoBoost- lignin och återvunnen polyuretan. En preliminär genomförbarhetsstudie för ett nytt kompositmaterial från avfallsmaterial Shaymaa Al- Taee Faculty of Health, Science and Technology Department of Engineering and Chemical Sciencs, Chemical Engineering, Karlstad University Master thesis, 30 credits Supervisors: Maria Sandberg (Karlstad University), Fernando Alvarado (RISE Bioeconomy), Fredrik Berthold (RISE Bioeconomy), Examiner: Lars Jänrström 2017-08-24
Transcript of Evaluation of thermal and mechanical properties of the...
Evaluation of thermal and
mechanical properties of the
composite material of LignoBoost-
lignin and recycled polyurethane
Ppolypolyurethane.
A preliminary feasibility study for a novel composite material from waste
materials
Utvärdering av termiska och mekaniska egenskaper hos
kompositmaterialet av LignoBoost- lignin och återvunnen polyuretan. En
preliminär genomförbarhetsstudie för ett nytt kompositmaterial från
avfallsmaterial
Shaymaa Al- Taee
Faculty of Health, Science and Technology
Department of Engineering and Chemical Sciencs, Chemical Engineering, Karlstad University
Master thesis, 30 credits
Supervisors: Maria Sandberg (Karlstad University), Fernando Alvarado (RISE Bioeconomy), Fredrik
Berthold (RISE Bioeconomy),
Examiner: Lars Jänrström
2017-08-24

I
Abstract
The purpose of this study was to investigate the possibility of producing a composite material
of lignoBoost- lignin and recycled polyurethane. Also, the study evaluated the thermal and
mechanical properties of the composite materials. These properties were investigated in a
number of steps by applying different: additives, concentrations, conditions (temperature,
time, and pressure), and equipment. The results from the preliminary trials show that it was
impossible to produce a composite material from lignin/polyurethane blends. Hence, the
blends were modified by adding acrylate and glycerol as a copolymer and plasticizer,
respectively, to improve the compatibility of the blends. Fourier Transform Infrared
Spectroscopy (FTIR), differential scanning calorimetry (DSC), and tensile tests were carried
out to study the thermal and mechanical properties of (lignin/ polyurethane/ acrylate/
glycerol) composite materials. The FTIR results indicated the existence of intermolecular
interactions between the components in the blends. The DSC analysis revealed the existence
of two glass transition temperature (Tg) values, indicative of an immiscible blend. However,
the first Tg and melting temperature (Tm) of composite material decreased with increased
lignin content up to 40%. As a result of interactions, the maximum strength and Young’s
modulus increased with increased lignin content up to 40 %. Meanwhile, elongation at break
decreased with increased lignin content.
Sammanfattning
Syftet med denna studie var att undersöka möjligheten att producera ett kompositmaterial av
LignoBoost- lignin och återvunnet polyuretan. Studien utvärderade också de termiska och
mekaniska egenskaperna hos kompositmaterialen. Dessa egenskaper undersöktes i ett antal
steg genom att använda olika tillsatser, koncentrationer, förhållanden (temperatur, tid och
tryck) och utrustning. Resultaten från de preliminära försöken visar att det var omöjligt att
framställa ett kompositmaterial från enbart lignin och polyuretan. För att förbättra
kompatibiliteten hos blandningarna tillsattes akrylat, som extra polymer och glycerol som
mjukgörare. Fourier Transform Infrared Spectroscopy (FTIR), differentialscanning
kalorimetri (DSC) och dragprov utfördes för att studera de termiska och mekaniska
egenskaperna hos kompositmaterialet av (lignin / polyuretan / akrylat / glycerol). FTIR-
resultaten indikerade förekomsten av intermolekylära interaktioner mellan komponenterna i
blandningarna. DSC-analyserna visade att det förekom två glasövergångstemperaturer (Tg),
vilket indikerar att komponenterna inte är helt blandade. Det första Tg och smälttemperaturen
(Tm) för kompositmaterialen minskade med ökande ligninhalt upp till 40 %. Den maximala
hållfastheten och Youngs modul ökade med ökad ligninhalt upp till 40 % på grund av
interaktioner mellan polymererna i blandningarna. Samtidigt minskade brottöjningen med
ökad ligninhalt.

II
Executive Summary
Kraft lignin represents a major byproduct of the pulp and paper industry, but due to its poor
thermal stability, it is hard to use kraft lignin as a single- component thermoplastic. Still a
lot of lignin is burned as fuel to generate energy. In order to make value- added components
from lignin, lignin was copolymerized with synthetic polymers
The aim of this study was to produce a composite material of lignin and recycled
polyurethane which are undervalued by- products of many different industries. This may
contribute to solving environmental problems by reducing the use of non-renewable
resources in the future
In this study, different ratios of lignin / polyurethane were investigated to determine if it is
possible to produce polymer composites with a higher lignin contents (≥ 60 wt.%). At the
same time, the polyurethane content needs to be as high as possible to develop economically
viable biodegradable thermoplastics.
The polymer blends were developed in various ways. Different plasticizers and additives
were added to the blends. Different mold temperatures, mold times and pressures were
utilized. The chemical bonds in the composite materials was characterized using Fourier
Transform Infrared Spectroscopy (FTIR), the compatibility between polymers was
determined using differential scanning calorimetry (DSC), and mechanical properties of
composite materials were determined using tensile tests.
The concentration for lignin varied from 0- 100 wt. %; and for polyurethane (PU) 0- 70 wt
%; and for acrylate (AC) 0- 25 wt %; and for glycerol (G) 0-25 wt %. The polymers were
mixed manually. The blends were molded in three different frames with a different thickness
(1 mm and 3 mm). The blends were pressed at 29 bar and 83 bar at a platen press, and 64,
100 and 200 bar at a single pelletize press. The blends were molded at temperatures of
100°C, 110°C, 120°C and 140 °C. and the mold time varied from 15 min- to 30 min. This
range of temperatures was chosen because the degradation temperature for lignin is between
(150- 300 °C)
First eight lignin/PU blends with a varying lignin concentration (60, 70, 80 wt %) were
pressed at 29 bar in a frame with 1 mm thickness, in order to choose the range of the
concentrations and conditions which may give a reasonable result. The composite materials
of the lignin/PU blends were unsatisfactory because the samples were very brittle, and
inconsistent.
The lignin/PU blends were developed by adding a plasticizer to decrease the brittleness of
the composite material and improve compatibility. Poly (ethylene glycol) (PEG) was
selected because it has a similar structure to that of lignin and a low degree of
polymerization. After adding 1 wt % PEG to the lignin/PU blends, the materials were still
brittle.
Glycerol (G) was used instead of PEG, due to the fact that it is a hydrophilic plasticizer and
has the ability to break hydrogen bonds in the polymer chains. A third polymer is needed for
improving the compatibility and morphology of the blends. Acrylate (AC) was selected
because it is a rubbery polymer, has a low glass transition temperature and it has the ability
to react with lignin from its carbonyl group. By adding AC (5, 10, 15 wt %) and 5 wt % G
to the lignin/PU blends, the composite materials showed a better visual property (cohesive
and homogenous) than previous trials. However, the tensile test was not conducted on these
samples, due to their high porosity.

III
The concentrations of components were optimized by blending a 25 wt % of each component
(lignin, PU, AC, G). The resultant materials were stronger and less porous than in the
previous result. However, no sample could be successfully tested (tensile test) because the
samples broke into small pieces during the cutting process.
A series of sex (lignin/PU/AC/G) blends with a different lignin concentration (25, 30, 35, 40
wt %), were molded at pressure of 83 bar in a frame with 3 mm thickness. Four blends were
pressed at a temperature of 140°C for 30 min; one blend pressed at 110°C for 30 min; and
one blend pressed at 140°C for 15 min. The results were strong, consistent and not easy to
break. The tensile testing was carried out for this series and the results showed that the
maximum strength and Youngs’s modulus increased with increased lignin content,
accompanied by decrease elongation at break. The molding of the blends at a temperature of
140°C and for 15 min succeeded in rendering a stronger material compared with a mold
temperature of 110°C and a mold time of 30 min. From the tensile strength measures for this
series.it seems that the changing mold time had a greater effect than changing the mold
temperature.
It was interesting to use the thicker frame (3mm) at low pressure 29bar (instead of 83bar) to
see whether the materials had same properties. The properties of the materials that were
pressed at 29bar and at 83bar were quite similar when they were pressed at the thicker frame.
Thus, it can be concluded that the modification of frame thickness had a great influence on
the cohesion and hardness of the product. However, the results were not changed to any great
extent through modification of the pressure from 29 bar to 83 bar.
It can be seen when making the composite materials that a greater thickness (3mm) in the
frame makes the materials less brittle and stronger. Also, a higher mold temperature (140°C)
gives a consistent material.
Two series of (lignin/ PU/ AC/ G) blends were implemented to confirm that that the mold
temperature 140 °C and mold times 15 min and 30 min were best setting for producing a
proper composite material. Eight samples were carried out for series 1, in which the blends
were pressed for 15 min in this series. Four samples were carried out for series 2; here the
blends were pressed for 30 min. The samples in both series were molded at a pressure of 29
bar
The FTIR spectra indicate the presence of intermolecular interactions between the functional
groups of lignin, PU, and AC. This is due to the disappearance of the peaks of the lignin
hydroxyl groups, PU ether groups and AC ester bond in the blend spectra.
DSC analysis revealed the existence of two glass transition temperature (Tg) values
indicative of an immiscible blend. However, the first Tg and melting temperature (Tm) of
composite materials are decreased with increased lignin content up to 40 wt %. but, the
second Tg kept almost constant.
The maximum strength and Youngs’s modulus decreased with increased lignin content up
to 40 wt %. This is due to the presence of an intermolecular interaction between the polymer
molecules as suggested by FTIR analysis which showed that there was an interaction
between the functional groups of lignin, PU, AC, and G.

IV
Table of Contents
1. Introduction ....................................................................................................................... 1
Aims and objectives .......................................................................................................... 2
2. Background ....................................................................................................................... 2
2.1 Polyblends ................................................................................................................... 2
2.2 Lignin .......................................................................................................................... 2
2.2 1 Lignin structure .................................................................................................... 2
2.2.3 Lignin derivatives- Kraft lignin ............................................................................ 3
LignoBoost- Lignin ................................................................................................... 4
2.2.4 Lignin based composite ........................................................................................ 4
2.2.5 Properties of lignin- based composite .................................................................. 5
Glass transition temperature ...................................................................................... 5
Tensile Strength ........................................................................................................ 5
2.3 Polyurethane ................................................................................................................ 6
2.4 Acrylic ......................................................................................................................... 6
2.5 Plasticizers .................................................................................................................. 7
2.6 Process analytical chemistry ....................................................................................... 7
2.6.1 Differential Scanning Calorimetry (DSC) ............................................................ 7
2.6.2 Fourier Transform Infrared Spectroscopy (FTIR)................................................ 8
3.Methods .............................................................................................................................. 9
3.1 Materials ...................................................................................................................... 9
3.1 Preparation of the blends ............................................................................................. 9
3.2 Production Equipment ............................................................................................... 10
3.2.1 Compression equipment ..................................................................................... 10
A. LabEcon 300, Fontune Presse ............................................................................ 10
B. Polystat 200T, Servitec Presse............................................................................ 10
C. Pelletization ........................................................................................................ 11
3.2.3 Frames ................................................................................................................ 12
3.3 Cutting sample .......................................................................................................... 12
3.4 Characterization and Measurements ......................................................................... 13
3.4.1 Differential Scanning Calorimetry (DSC) .......................................................... 13
3.4.2 Fourier Transform Infrared Spectroscopy (FTIR).............................................. 13
3.4.3. Mechanical properties ....................................................................................... 13

V
3.5 Experimental ............................................................................................................. 14
3.5.1 Preliminary Experiment ..................................................................................... 14
3.5.2 Changing of pressing method (Pelletization) ..................................................... 14
3.5.3 Adding plasticizers and acrylate resin(AC)........................................................ 14
3.5.4 Changing of mixing ratios .................................................................................. 15
3.5.5 Changing of frame and pressing method ............................................................ 15
3.5.6 Experimental testing ........................................................................................... 15
4. Results and discussions ................................................................................................... 16
4.1 Preliminary Experiments ........................................................................................... 16
4.2 Change of pressing method (Pelletization) ............................................................... 16
4.3 Adding plasticizers and acrylate resin(AC) .............................................................. 16
4.4 Changing of mixing ratios ......................................................................................... 17
4.5 Changing of frame and pressing method ................................................................... 17
4.6 Screening Test ........................................................................................................... 17
4.7 Experimental testing.................................................................................................. 18
4.8 Characteristics and measurements of samples .......................................................... 19
4.8.1 Fourier transform infrared spectroscopy ............................................................ 19
4.8.2 Glass Transition Temperature and Melting Temperature .................................. 23
4.8.3 Mechanical properties ........................................................................................ 27
5. Conclusion ...................................................................................................................... 29
6 Future work ...................................................................................................................... 29
7. Acknowledgment ............................................................................................................ 29
8. References ....................................................................................................................... 30
9. Appendix ......................................................................................................................... 34

1
1. Introduction
The interest in replacing non- renewable resources with renewable feedstock in the chemical industry has been
increased, due to the increasing environmental concerns[1]. Therefore, a bio -based material is considered an
attractive approach of sustainable development and limiting environmental problems[2].
Research show that the production bio- based materials have a great positively environmental effect, due to their
biodegradability, low cost compared to petroleum- based material, conservation of petroleum resources, reduce the
production of toxic by- products, and low CO2 emissions.[3, 2]. This replacing must be acceptable not only
environmentally but also socially.
In order to conserve oil resources, the motivation to incorporate biological resources into composite materials and
polymer blends has increased. Bio- composites are considered a good alternative to petroleum based composite
materials in production plastic material. In addition, the production of bio- composite material can lead to reduce
the energy consumption, production cost and waste generation. Plastic materials can be defined as the materials
who has ability for moulding and deforming into any form when they exposed to pressure and high temperature[4].
Biodegradability of plastics produced from biological resources depends on the structure of plastics during the
moulding of biocompatible materials[5].
There are two common classes of polymers based upon their structure and behavior when heated and the physical
properties of products; thermoset and thermoplastic. Thermoplastic is a polymer that becomes pliable when exposed
to heat, and in a solid state when cooled. In contrast, thermoset polymer is usually pliable before curing, and it turns
into an infusible polymer after curing. Thus, thermoset polymers have a negative environmentally impact due its
low recyclability [6, 4]
Annually pulp and paper industry generates a large quantity of lignin as a byproduct[7], only 2% of this byproduct
is employed for specialty products, and the rest is burned as a low- grade fuel to generate energy[4].
Lignin could be used as a new raw material in the formation of supramolecular materials and polymers appropriate
for the environment due to its chemical composition and its functional characteristic in plants[8, 9].
Lignin has been used in the production of plastics for several years[10]. It was found that the use of lignin instead
of fossil fuel in the polymers industry, is a way for reducing the environmental pollution and production cost.
Literatures show that industrially isolated lignin from wood can be used directly in the manufacturing of polymeric
materials. That will lead to introduction of a new renewable material, that’s make lignin a more attractive bio-
polymer.
In this work, a recycled polyurethane was mixed with lignin to produce a new bio- product. Polyurethane is a plastic
polymer, produced by combining a diisocyanate with a polyol. There are different types of polyurethane: rigid or
flexible foam, binders, coatings, thermoplastic polyurethane etc. Polyurethane can be used for different purposes
depending on its structure. Polyurethane is used as three dimension polymer in a different application such as
textiles, medicine etc[11].The rigid polyurethane foam is widely used as a good insulation material in building,
refrigerators, and freezers[12]. In these applications, the polyurethane contributes to sustainability and eco-design
due to its ability to save energy and decreae food waste, resulting in environmental protection and reducing costs.
In addition, low weight and reasonable prices for polyurethanes reduce the cost of products and transportation. On
the other hand, the wide use of polyurethane inevitably leads to the formation of a large amount of polyurethane
waste. Landfill and incineration are ineffective methods to dispose polyurethane foam wastes[13]. Polyurethane
foam wastes are very difficult to degrade and polyurethane contains an aromatic diisocyanate and nitrogen
components which causes serious air pollution and increase the health risk when polyurethane foam is burned[12].
Therefore, an appropriate way of treating or disposing of polyurethane waste needs to be found. In order to reduce
pollution and protect the environment. The attention toward recycling of polyurethane has become greater [13].
In this study lignin was mixed with recycled polyurethane to investigate the feasibility of using these polymers as
bio-components in producing a composite material. The new composite material should be have a certain properties
such as: environmentally friendly, low cost, fire-resistant, hydrophobic, insulating, and lightweight polymer
composites.

2
Aims and objectives
The aim of this study was to investigate the possibility of producing a composite material of lignin and polyurethane
materials which are undervalued materials of many various industries. In this study, different ratios of lignin /
polyurethane were investigated to determine if it is possible to produce polymer composites with a high lignin
contents (≥ 60 wt.%). At the same time, the polyurethane content needs be as high as possible, to develop
economically viable biodegradable thermoplastics.
2. Background
2.1 Polyblends
Polyblends have received a great attention in recent years. By combining an inexpensive byproduct (bio- based
component) with an expensive synthetic polymer (non- biodegradable component) it is possible to reduce the
production cost of thermoplastics polymers. At the same time, the amount of plastic wastes decreases. Combining
two or more polymers chemically and physically, leads to a new material with a specific functional that differ from
those of the individual polymers.
In general, there are two types of polyblends; miscible and immiscible blends which have been classified by the
type of intermolecular interactions between the polymers. One glass transition temperature can be observed for
miscible blends, and two glass transition temperatures can be observed for immiscible blends.
The degree of interaction between polymers and dimensions of the dispersed polymer in the blends, act a crucial
role on the toughness properties of blends. An immiscible blend can be obtained if its components form separate
phases. The nature of the component polymers in blends and degree of interactions between them, have a great
impact on the mechanical and thermal properties of blends. As well as, the properties of the blends are largely
influenced by the processing method used. There are several interactions types in polymer blends. The strongest
one is hydrogen bonding due to its high effect on the miscibility of the blend and its low impact on properties of the
polymers in the blends
2.2 Lignin
Lignin is second most abundant biopolymer on earth after cellulose. This aromatic polymer can be found in the
wood cell wall between cellulose and hemicellulose which cementing them towards each other. The content of
lignin in softwood is about 15- 35%, and about 20% in the hardwood. Lignin has some important functions in plants
like; it helps to transport water, makes cell wall hydrophobic and protects the plants from microbial and insects
attack.[14, 15, 9]
2.2 1 Lignin structure
Lignin is a three-dimensional polymer which composes of phenylpropane units and various functional groups
include methoxyl, carbonyl, phenolic hydroxyl, and aliphatic hydroxyl (Figure 1a). This complex structure of lignin
is suggested that lignin is a heterogeneous polymer. Where, hydroxyl functional groups are main groups that help
for using lignin as a polymeric material, i.e., hydroxyl groups have a crucial role for the interaction lignin with other
polymers. Native lignin includes of three monomers units which they are called ρ-hydroxyphenyl (H), guaiacyl (G),
and syringyl (S), as shown in Figure 1b. Generally, softwood lignin consists of around 95% G units, while hardwood
lignin is consisted of G and S, and a minor amount of H units. These monomers are linked by different types of
ether (β-o-4, α-o-4, 5-5, 4-0-α, β-5, β-1) and carbon- carbon linkages.[16, 17, 18]

3
A)
B)
Figure 1 (a) Representative structure of lignin, (b) structural lignin units(figure 1b redrawn from Watkins et al.
[19]).
2.2.3 Lignin derivatives- Kraft lignin
The properties of isolated lignin rely on the approach that is used to isolate the lignin from lignocellulosic material.
Industrial lignin obtained from different chemical industries, is divided into: kraft lignin; lignosulfonate; soda lignin;
and organosolv lignin. These lignins have various chemical structure and various physical properties. The kraft
pulping process constitutes about 95% of total chemical pulp produced, therefore kraft lignin is represented a main
byproduct of the pulp and papermaking processes[20]. In the kraft pulping process, lignin is existed in black liquor
that is burned to recycle chemicals and generate power. In order to use kraft lignin into a valuable product
production, the LignoBoost process has been developed to remove the dissolved lignin in black liquor as described
in the following section (LignoBoost-Lignin))[21, 22].
Kraft lignin has a high amount of phenolic groups as a result of refraction of β- aryl ether bonds by the benzylthiolate
anions and it has high conduced C-C bonds which are formed at the end of pulping process. Kraft lignin also contains
sulfur, ash and organic material. Kraft lignin can dissolve in the water under a certain condition, and its glass
transition temperature (Tg) is between 124- 147°C, in which polymers become more plastic and rubbery. However,
Kraft Lignin has a complex structure which could affect the mechanical properties of the material based kraft lignin.

4
LignoBoost- Lignin
In order to produce a solid biofuel with a low ash content and high energy density, the LignoBoost process is used
for the isolation of kraft lignin from the black liquor[23]. Here, precipitation is a main method for the separation
of kraft lignin. In this process, the black liquor is acidified in two stages. Carbon dioxide is used in the first stage
in order to lower the pH of the black liquor to about 10. Then lignin is filtrated by using a chamber filter press. In
the second stage, lignin is re- dissolved to be purified, at pH 2- 4. Next, the resulting slurry is filtered and washed
with acidified wash water to separate the lignin[24]. During this stage, the kraft black liquor obtains a hygroscopic
nature due to residual sulfuric acid and sodium salts, which increases the moisture content of LignoBoost- lignin.
A modern kraft mill produces a large quantity of lignin as a byproduct, although it used within the pulp mill in
chemical and energy generation [21]. This process is a good way to increase the pulping capacity without expansion
in the recovery boiler. Furthermore, this process increases the purity and solid content of lignin. Figure 2 shows the
lignoBoost process stages[25].
However, the processability of lignoBoost- lignin is generally low due to high chemical heterogeneity and poor
properties[26].
This technology was developed by RISE Bioeconomy and Chalmers University (Sweden), after which it was
acquired by Metso in 2008, which in turn sold the commercial plant for LignoBoost technology to two different
mills; Domtar (NC, USA) and Stora Enso (Sweden).[20]
Figure 2. Schematic diagram of the lignoBoost process (Redrawn from Kalogiannis et. al [26])
The potential of using lignin in some applications is strongly influenced by its brown color and odor, which are
considered critical factors when final products are made public. The isolated lignin contains a chromophores
group which has ability to absorb the light and gives lignin the dark brown color. However, this brown color can
be removed if the isolated lignin is subjected to a bleaching agent[24]. The isolated lignin contains sulfurous and
guaiacol which give the lignin unpleasant odour. Together Valmet and RISE Bioeconomy have developed
concepts to achieve an odour free lignin. The sulfur compounds in lignin can be removed by heating, while,
guaiacol can be removed either to 60% or 97% when a treatment stage is used with or post lignoBoost process,
respectively[27].
2.2.4 Lignin based composite
The utilization of lignin as a potential reinforcement in composites and polymeric materials has been increased in
the last 10 years[28]. The lignin from industries has a number of ideal properties, such as natural abundance,
biodegradability, low cost, good absorbent, non- toxic and environmentally friendly.
Lignin considers to be as a thermoplastic material due to its intra- and intermolecular hydrogen bonds. However, it
is difficult to produce a thermoplastic product using only kraft lignin due to its poor thermal stability and flow
properties[4]. In order to make value added components from lignin, lignin has to be copolymerized with synthetic
polymers. Thus, the physicochemical properties of lignin- based materials is governed by the intermolecular
interactions between the lignin and polymers in a blend. However, the miscibility or good compatibility of a polymer
blend are largely depended on the intermolecular interactions between polymers in the blend.

5
Researches show that applying moderate thermal conditions on the isolated lignin, can improve its blending
ability with other synthetic polymers and producing a thermoplastic material. The use of the byproduct lignin in the
various applications as a polymeric component, has been dependent on functionality of its hydroxyl groups.
Currently, the main applications for isolated lignin are production of thermoplastic composite, polyblends,
thermoset , carbon fiber, dispersants, epoxy resins and molding[29]. The properties of final composite products are
largely affected by the properties of lignin such as molecular weight, hydroxyl groups and the glass transition
temperature (Tg)[30]
2.2.5 Properties of lignin- based composite
Glass transition temperature
The aromatic structure of lignin helps it to be moderately stable at high temperature. At the same time, it was found
that lignin can behave as thermosetting material at high temperature due to its ability to form cross- linked structure
at high temperatures[4]. The glass transition temperature (Tg) of the isolated lignin depends largely on the pulping
process, moisture content, and impurities content, but normally the Tg value is between 90- 170 °C[31]. This
relatively high Tg of lignin is due to its strong intermolecular interactions, which is considered a major hindrance
from using lignin in high performance thermoplastic materials. The Tg, thermal stability and mechanical properties
of lignin can be improved by combining lignin with plasticizers or synthetic polymers. Generally, the Tg of a
polymer blend is largely based on the Tg for each component in the blend, the intermolecular interactions between
them, and the content of each component in the blend[4].
Boujila et al.[32] studied the plasticization effects on the dry and hydrate kraft lignin by using different plasticizers
including water, poly (ethylene glycol) (PEG), ethylene glycol (EG), vanillin etc.. They found that increasing water
content in the dry kraft lignin (0- 30 wt%) decreased Tg of the system from 160- 60 °C. Whereas, the increasing
water content in the hydrate kraft lignin had a smaller effect on Tg compared with dry one. In contrast, vanillin was
a good plasticizer for hydrate kraft lignin, because it contains aromatic molecules similar to those in kraft lignin.
They also found that PEG is a good plasticizer for lignin and its efficiency is proportional to the concentration of
the oxygen atoms. They also showed that the plasticizer efficiently can form hydrogen bonds with lignin.
Miscibility of polymer blend is usually indicated by its glass transition temperature. One value Tg is observed for
miscible polymer blend and two or more values are observed for immiscible polymer blends[33]. There are several
investigations on the characterization of lignin and its blends. Kadla and Kubo[3],[34], examined the miscibility of
hardwood kraft lignin with four synthetic polymers; poly(propylene) (PP), poly(ethylene oxide) (PEO),
poly(ethylene terephthalate) (PET) and poly(vinyl alcohol) (PVA) which they prepared by thermal extrusion. The
lignin concentrations in the blends were between (0- 100 wt%). They found that lignin/PEO and lignin/PET blends
exhibited miscible behavior. The Tg of these blends increased with increasing lignin content, while melting
temperature (Tm) for both polymer blends decreased with increasing lignin content. Although, the lignin/PVA
appeared as immiscible blends. The FTIR- results (FTIR is a technique that used to analyze the structure of
polymers) showed that there was a specific intermolecular interaction between lignin and PVA. Also, this study
showed that lignin samples formed immiscible polymer blends with PP.
Li et al.[35] studied the miscibility of blends composed of 85wt% softwood kraft lignin and poly(vinyl acetate) with
presence of two plasticizers (diethyleneglycol and indene), and they found that these blends (lignin, poly(vinyl
acetate), plasticizers) formed homogeneous materials with very promising mechanical properties.
Tensile Strength
Several studies suggest that the incorporation of high concentrations of lignin may negatively affect the mechanical
properties of products.
A study shows that the tensile strength and Yonge’s modulus of alkylated lignin/polypropylene (PP) blends
decreased as alkylated lignin content increased in the blends. Where, the blends were preparade by melt mixing
process with lignin concentrations between (0- 100 wt%).[36]
Jianchun et al[37]. found that the Youngs’s modulus of the poly (ɛ- caprolactone)/lignin blends increased when the
lignin content was 40%, while maximum strength, elongation at break and elongation at maximum strength
decreased with increasing lignin content up to 25%.
6
Mousavioun et al.[38] reported that the soda lignin formed single phase blends with poly(hydroxybutyrate)(PHB)
when the lignin content in the blends was lower than 40wt%. Above this concentration two Tg values were observed.
This result was supported by the infrared data, where the specific hydrogen bonds were observed between the
reactive functional groups in lignin and the carbonyl groups of PHB, in blends with soda lignin content of up to
40wt%.
A single Tg was observed for the polybutylene succinate (PBS)/ lignin blends which were prepared using a melt
mixing process, and there was an improvement in the mechanical properties for the blends containing up to 65 wt%
of lignin[39].
In another study, the FTIR results suggested that the hydrogen bonds were formed between the functional groups
of lignin and chitosan when lignin content was below 20wt%. Thus, the Tg, tensile strength, and Youngs’s modulus
of the chitosan/lignin blends increased with the increase lignin content beyond 20wt%.[40]
Li et al.[41] found that the maximum strength and elongation at break of the biodegradable blends of poly (L-lactic
acid) (PLLA) and lignin decreased when lignin content increased to 20wt%, but there was no significant change in
the Young’s modulus of the materials with the same components ratios. Both Tg and Tm of these blends were
decreased with increasing lignin content up to 40wt%. These results were induced by the existence of an
intermolecular interaction between PLLA and lignin, and these contentions were also supported by the information
obtained from FTIR analysis.
Various researches reported that lignin based synthetic polymers were brittle due to the high crosslink density and
high molecular weight of technical lignin. Those properties were likely the mainly reasons for limiting using lignin
into value- added polymer.[42]
It can be concluded that the miscibility and mechanical properties of lignin- polymer blends can be controlled by
reducing lignin content in blends because immiscible behaviour and poor mechanical properties were observed in
the blends with a high lignin content.
2.3 Polyurethane
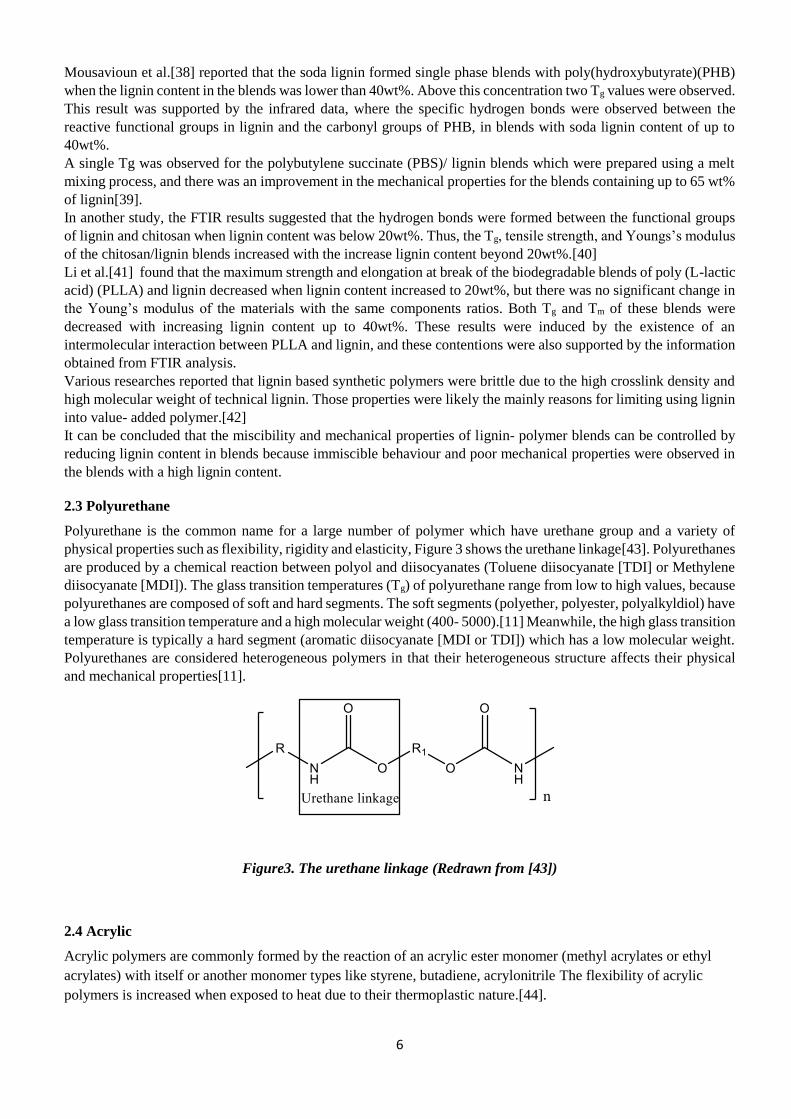
Polyurethane is the common name for a large number of polymer which have urethane group and a variety of
physical properties such as flexibility, rigidity and elasticity, Figure 3 shows the urethane linkage[43]. Polyurethanes
are produced by a chemical reaction between polyol and diisocyanates (Toluene diisocyanate [TDI] or Methylene
diisocyanate [MDI]). The glass transition temperatures (Tg) of polyurethane range from low to high values, because
polyurethanes are composed of soft and hard segments. The soft segments (polyether, polyester, polyalkyldiol) have
a low glass transition temperature and a high molecular weight (400- 5000).[11] Meanwhile, the high glass transition
temperature is typically a hard segment (aromatic diisocyanate [MDI or TDI]) which has a low molecular weight.
Polyurethanes are considered heterogeneous polymers in that their heterogeneous structure affects their physical
and mechanical properties[11].
Figure3. The urethane linkage (Redrawn from [43])
2.4 Acrylic
Acrylic polymers are commonly formed by the reaction of an acrylic ester monomer (methyl acrylates or ethyl
acrylates) with itself or another monomer types like styrene, butadiene, acrylonitrile The flexibility of acrylic
polymers is increased when exposed to heat due to their thermoplastic nature.[44].

7
Acrylics are widely used in different industries such as paint, textile, and paper coating due to its good
appearance, weatherability and high light transmission. These good properties give an explanation for the high
cost of this polymer as compared with other polymers.
It was found that the treatment of lignin with polyacrylate improves the compatibility of the composite material
and properties in the final product[45]. Such treatment helps to form hydrogen bonds between carboxyl groups of
polyacrylate and hydroxyl groups of lignin during melt mixing [46]. In addition, the polyacrylate is considered a
soft and rubbery polymer owing to its low glass transition temperatures which is between -56 and 30C. RISE
Bioeconomy company has a project with a company, where they use lignoBoost- lignin and acrylic polymer in the
car’s structure. Thus, it was thought that acrylate polymer would be a good material for improving the properties of
the composite materials in this study.
2.5 Plasticizers
Plasticizers are commonly used as an additive in polymer industries, in order to increase the flexibility and
workability of the polymers[47]. The average molecular weight of plasticizers should be low, and they must be a
non- volatile, non- crystalline solid at the ambient temperature and have a similar solubility to that of the polymer
[48].
Here, the addition of plasticizers increases the free volume and molecular mobility due to their small molecular
weight which has easily occupied intermolecular spaces between polymer chains and formed hydrogen bonds with
polymer chains[47]. The forming of hydrogen bonds and solubility parameters, can indicate a high compatibility
between polymer and plasticizers. The addition of plasticizers increases the mobility of polymer chains and lowers
the Tg which both lead to softer polymers. The plasticizers content is considered an important factor in determining
the properties of plasticizer- polymer blends. Low plasticizer content can reduce the interactions between the
polymer and plasticizers. High plasticizers content can cause a phase separation in a system. Thus, the processability
, mechanical and thermal properties of the polymer blends can be controlled by adding an optimum concentration of a
plasticizer. [47, 32, 49, 50]
The strong intermolecular interactions between the kraft lignin components may affect the ability of kraft lignin to
plasticize. Therefore, an appropriate plasticizer should be added to reduce these strong forces between kraft lignin
components without destroying the properties of the material[7, 32]. Poly ethylene glycol (PEG) and glycerol have
been selected for this project. Ethyl glycol is considered a good plasticizer for lignin[32], because it has a similar
structure to that of lignin and a low degree of polymerization (DP)[51]. These plasticizers are hydrophilic, thus they
have the ability to break hydrogen bonds in the polymer chains[52] as well as they help to decrease material
brittleness[47]. Schematic chemical structures of PEG and glycerol are shown in Figure 4.
Figure 4: Schematic chemical structures of (a) glycerol and (b) Poly (ethylene glycol) (PEG).
2.6 Process analytical chemistry
In this chapter, the technologies on analyzation of the composite materials will be reviewed
2.6.1 Differential Scanning Calorimetry (DSC)
Differential Scanning Calorimetry (DSC) is used to measure the heat flow for a material as a direct function of time
or temperature. It is considered a useful method for evaluating the thermal properties of lignin and composite
materials such as; glass transition temperature, melting temperature and crystallization temperature[53].The typical
components of DSC are disk, furnace, lid, differential thermocouples, programmer and controller[53]. A sample
and a reference sample are located on a thermally disk and heated in the furnace (i.e., the same heater). When heat
is transferred through the disk a differential signal is obtained which is proportional to a difference in heat flow

8
between the sample and reference sample. Also, DSC measure the enthalpy changes associated with the phase
transition occurring on heating or cooling. DSC curve shows the melting point of a polymer and the area of the
melting point peak represents the enthalpy change of the phase transition.
The DSC plot gives the heat capacity and heat flow rate of the sample as a function of temperature or time. By this
plot, the glass transition temperature for polymer composites can be determined. It is represented as the point of the
infliction of the DSC curve, as in figure 5, resulting from changes in heat capacity and free volume (as it takes
energy to break bonds). There are some factors affect the Tg value like heating rate used in the DSC measuring,
molecular weight, plasticizer content, molecular flexibility, and crystallinity of polymers. A high molecular weight
of a polymer leads to an increase in the Tg. On the other hand, the addition of a plasticizer to the polymer composite
decreases the Tg because the plasticizer makes the polymer composite more flexible and easy to work with.[53]
The value of Tg of the different types lignin is reported between 110−150 °C[32].
When using DSC, the temperature of the sample and reference sample increase at a constant heat rate. The heat
rate used to increase the temperature of the sample and refence sample can be determined. The chain segment
motion of lignin is increased due to heating. This motion is usually characteristic of a glass transition which can be
indicated by an endothermic shift in the DSC curve.[54]
The DSC also can be used to determine melting temperature of a polymer composite. Melting is a transition
which happens in a thermoplastic polymer when the polymer chains fall out of their crystal structure and become a
disordered liquid. The melting process appears as an endothermic peak in DSC curve since the intermolecular bonds
of a polymer absorb energy in order to move freely at melting temperature[55]. Some of the polymers have both
glass and melting temperature due to the existence of an amorphous portion. The more branched and/or cross-linked
structure present in softwood lignins leads to a slightly higher Tg as compared with hardwood.
The degree of order within the hard segment of a polyurethane depends upon the chemistry, rigidity, and degree of
hydrogen bonding within the hard segment. The higher the degree of order within the hard segments, the higher the
melting point of the polyurethane.[56]
An exothermic peak could appear in the DSC curve when the polymers is heated above the Tg, and that indicates
the polymer chains have more mobility and undergo crystallization. The lowest point at the crystallization peak
represents crystallization temperature(Tc)[57].
Figure 5. Typical DSC curve of a crystalline polymer showing glass transition temperature (Tg), crystallization
temperature (Tc) and melting temperature (Tm). (Redrawn from Multur S. [57])
2.6.2 Fourier Transform Infrared Spectroscopy (FTIR)
Infrared spectroscopy is widely used to identify functional groups in a compound. Moreover, this technique can be
used to evaluate the stability of substances and the mechanism of chemical reactions. The common components of
a FTIR spectrometer are source, interferometer, beam splitter, sample compartment, detector, amplifier, ADC
analog digital- convertor, and a computer [54].
The IR source generates radiation which is divided into two beams by the beam splitter. One half of the beam is of
fixed length (fixed mirror) and the other half of variable length (moving mirror) [28]. The light beam passes the
sample through the interferometer, then the detector receives an analog signal. The analog signal is digitalized by

9
an analog- to- digital converter. The digital signal is transferred and stored in a computer [58]. IR absorption
spectrum is commonly identifiable with absorption intensity or % transmittance as a function to the wavelength or
wavenumber. The range of IR wavelengths are usually between 4000-400 cm-1.
When the sample is exposed to infrared radiation, the molecular will vibrate and absorb specific frequencies of the
spectrum which leads to a change in the diplo moment of molecules. The absorption peak is evaluated by vibrational
energy gap, and the number of vibrational freedom of the molecule will decide the number of the absorption peaks
[54]. The vibration of molecules bonds has two mods: stretching and bending. A vibrational mod is where the
interatomic distance is decreasing or increasing. A bending vibration can present a molecule with three or more
atoms when the changing in the angel between atoms occurs. So, useful structure information about a material can
be obtained by evaluating the FTIR spectrum [58].
3.Methods
Several different methods were used in this thesis. Different plasticizers and additives were added to the blends.
Different mold temperatures, mold times and pressures were utilized. The intermolecular interaction of the
composite materials was characterized using Fourier Transform Infrared Spectroscopy (FTIR), the compatibility
between polymers was determined using differential scanning calorimetry (DSC), and mechanical properties of
composite materials were determined using tensile tests.
3.1 Materials
In this thesis three polymers were used to make composite materials, lignoBoost- lignin, recycled polyurethane and
acrylate. Also, different plasticizers were investigated, poly ethylene glycol and glycerol. Table 1 shows the
materials used in this thesis. Here, lignoBoost lignin will be referred to lignin, and recycled polyurethane foam,
acrylate resin and glycerol will be called PU, AC and G., respectively. It should be mentioned that there have not
been reported about the characteristics of acrylate and polyurethane that were used in this study.
Table 1. The materials used in this thesis.
Material Supplier Details
LignoBoost- lignin RISE's pilot plan in
Bäckhamer mill - Sweden.
Dry solid content 65%;
ash content 3-5 %
Recycled
polyurethane
Svensk Freonåtervinning
company- Sweden Dry solid content 95.2 %
Acrylate PPG Scandinavia
company- Sweden -
Poly (ethylene glycol)
(PEG)
RISE Bioeconomy
Company
PEG number average
molecular weight (Mn) =
600 (g/mole)
Glycerol Struers KEBO Lab A/S
Albertstund- Denmark 86%
3.1 Preparation of the blends
The blends were prepared using two different methods.
A. Powders with different ratios of lignin and PU were weighted separately and placed in a mortar for thorough
manual mixing for 5 min. The powder blend was then put in a frame between two sheets of Mylar® (Mylar®
polyester film, 100µm, DuPont Teijin Films™, Hopewell, USA) which they were placed between two metal
plates, and then pressed in a hot press.

10
B. The substances were weighed and mixed as in (A) method, but after mixing in the mortar, a plasticizer was
added and mixed manually with a spoon in a beaker to get as homogeneous distribution as possible. The
dough was put in a frame between two sheets of Mylar® (Mylar® polyester film, 100µm, DuPont Teijin
Films™, Hopewell, USA) which also were placed between two metal plates, and then preheated in an oven
to 120°C for 15min before pressing in a hot press. This was made with the purpose to increase the solid
content of the blend and improve the processability.
3.2 Production Equipment
3.2.1 Compression equipment
Three different hot presses have been used for molding the samples: Laboratory platen press (LabEcon 300,
Fontune Presse), and Pellet press at Karlstad university, Sweden. And Laboratory Press Polystat 200T, Servitec at
RISE Bioeconomy - institutes
A. LabEcon 300, Fontune Presse
This laboratory platen press was selected for molding the material due to the suitable equipment which was available
on site and would give the required product, see Figure 6. which contains two square metal plates (320 x 320 mm).
Both plates can be heated electrically. Controllers measure and control the temperature, pressure, time, and position
of the lower press plate since the top one is fixed. The maximum closing force and temperature are 300kN (29 bar)
and 300°C, respectively. The actual closing force can be determined according to Eq. 1.
𝐹𝑝𝑟𝑒𝑠𝑠 = 𝐹𝑚𝑎𝑥 ×𝐴𝑓
𝐴𝑝𝑟𝑒𝑠𝑠 [1]
Here, Fpress is the pressing force [kN], and Fmax is the maximum force [kN]. The Af is the frame area [mm2] and Apress
is the pressing unit area [mm2]
Figure 6. LabEcon 300, Fontune Presse
B. Polystat 200T, Servitec Presse
This laboratory platen press has the same operation and control principles as LabEcon 300, Fontune Presse, see
Figure 7, with a smaller press surface area (200x 200 mm2) and 200kN (400bar) as a maximum closing force. The
whole purpose of using this equipment was to compare material´s properties produced under a higher pressure value

11
(83bar) with those produced earlier by LabEcon 300, Fontune Presse. The surface pressure can be determined
according to Eq. 2.
𝑃𝑚𝑒𝑐ℎ = 𝑃ℎ𝑦𝑑𝑟 ×𝑃𝑠𝑢𝑟𝑓𝑎𝑐𝑒
𝐴𝑓 [2]
Here, Pmech is the effective mechanical surface pressure between the press plates [N/cm2], Phydr is the maximum force
of pressure [bar], Psurface is the effective press surface [N/cm2] and Af is the frame area [cm2].
Figure 7. Polystat 200T, Servitec Presse
C. Pelletization
A single pelletizer was used to see if the low pressure in the Laboratory platen press contributes to poor material
properties. Here, the blends can be pressed up to 3000 bar. At the department of Energy, Environmental and Building
Technology at Karlstad University- Sweden, there is a pilot plant for small scale pellet production, see Figure 8.
The pelletizer consists of a stainless-steel plunger, a flat die, two Teflon compression assist rods and a removable
backstop. The pellet unit is also equipped with a heater to heat the sample to a desired temperature
Figure 8. Pellet production unit

12
3.2.3 Frames
Frames are referred to the structure into which the dough is poured before the pressing to form the samples. Forming
of the samples was performed using three different frames:
i- The experiment started with a square plate which was available in the lab, see Figure 9a. The side length of the
plate is 150 mm with a thickness of 1mm. The side length of inner frame is 100 mm
ii- Because of the limited amount of raw materials, a stainless steel plate with a smaller square frame was ordered
at a workshop (Figure 9b)). The side lengths of the plate and inner frame are 150 and 50 mm, respectively, and at a
thickness of 1 mm.
iii- When a part of the work was carried out in the RAIS's labs, a new frame was used to study the effect of increasing
the frame thickness (i.e., material thickness) on the product's properties. The dimensions of the plate are (20x 12x
3 mm and hole diameter is 49 mm, see Figure 9c.
(a) (b) (c)
Figure 9. The different frames used in this study
3.3 Cutting sample
The samples need to be cut into strips for tensile testing, however the samples were fragile due to their porous
structure. Therefore, different approaches were applied to cut the samples. The first approach involved using a sharp
knife but samples broke into small pieces. Because of the limited amount of samples, a second approach was using
a soft saw for cutting which worked successfully with the rest of samples. In this approach, a wooden mold was
invented specially for this work, where the mold sets, and surrounding the circular samples. It contains three tracks
in the middle with a 10mm distance among them, see Figure 10.
Figure 10. The picture to the left shows the mold with a circular sample and the picture to the right shows how
the circular sample looks after cutting.

13
3.4 Characterization and Measurements
The samples were placed in a conditioned room (23°C and 50% RH) for at least 48 hours before to testing.
3.4.1 Differential Scanning Calorimetry (DSC)
In this thesis, DSC Q2000 from TA Instruments was used to determine the thermal properties of composite
materials. The weight of the sample was between 5-11 mg. The sample was cut into small pieces, placed and sealed
in standard aluminium pans used to keep the sample under the test. The equilibrium temperature was 20°C, and
samples were run at a heating rate of 10°C/min from 10 to 300°C under nitrogen atmosphere.
The glass transition temperature Tg and melting temperature Tm were recorded as onset and the peak minimum
temperature of the heating process, respectively. In our case, it could be difficult to analysis the DSC data due the
blends containing moisture and plasticizers which make the behaviour of polymers completely different from pure
polymers.
3.4.2 Fourier Transform Infrared Spectroscopy (FTIR)
Fourier transform infrared analysis (FTIR) was done using FTIR-ATR spectroscopy (Agilent Cary 630). The weight
of the sample was about 2 mg and it was fixed in the cell by skews. The range of wave number was between 4000-
800 cm-1.
3.4.3. Mechanical properties
Mechanical properties of the materials were estimated by measuring tensile strength, Young's modulus, and
elongation at break using a Zwick/Roell Z005 (Ulm- Germany) tensile tester according to ISO 1924-3: 2011. These
measurements were carried out by fixing the sample between two grips and applying a tensile stress until break
occurred. The thickness and width for each test strip were 3 and 10 mm, respectively. The applied load was 500 N
with a test speed of 10 mm/min and clamping length was 20 mm. These mechanical properties were determined
from the stress- strain curves. The tensile tests were performed in 23°C and 50% RH. The average values with
standard deviation of four stripes for each sample are presented.

14
3.5 Experimental
This study is an attempt to make a composite material with good properties (e.g., flexibility, strength, stiffness, etc.),
of different combinations of lignin and PU. The methods have been developed in many steps by using different
additives and changing equipment. The effects of some parameters (e.g., temperature, time, pressure, etc.) have also
been studied and optimized for this work. The different steps of the method are presented in this chapter.
3.5.1 Preliminary Experiment
The different concentrations of lignin and PU at different conditions were optimized in a univariate approach (one
factor at a time). A screening test was carried out to choose the ranges of the concentrations and conditions which
can be used to produce samples for the subsequent step (properties analyses and tensile testing). Lignin
concentrations were set to 60- 80 % (Table 2). The mold temperature was 100, 120 and 140°C and the mold time
was 15 min. This range of temperatures were chosen because the degradation temperature for lignin is between
(150- 300 °C) [58]. Two trials were done at each mold temperature. The last two trials were the centrum points.
This test series was done using LabEcon 300, Fontune Presse at a pressure of 29bar (which is the maximum pressure
achieved by this equipment). In this step, blends prepared as described in the Section 3.1 (A). The total weight of
the blend was 14 g and the used frame was 100x 100 x1 mm (Section 3.2.3 (i)).
Table 2. Specification of the blends and condition at the low pressure (29) bar
Lignin% PU% Temperature (°C)
60 40 100
60 40 100
80 20 100
80 20 100
60 40 140
60 40 140
80 20 140
80 20 140
70 30 120
70 30 120
3.5.2 Changing of pressing method (Pelletization)
In order to improve the composite material properties, molding was performed at a higher pressure as long as mold
temperature should not exceed 150 °C, because the nature of lignin changed above than this degree. The single
pelletize press was used for this purpose (Section 3.2.1 (C)). Two grams of the mixture were put into the flat die
and pressed with a piston for 5, 15 and 20 min at pressure 64, 100 and 200 bar. The mold time and pressure were
varied to investigate their effects on the material properties. The same concentration in the preliminary experiments
was applied in this step.
3.5.3 Adding plasticizers and acrylate resin(AC)
The blends (lignin/PU) were further optimized by adding 1%wt PEG as a plasticizer to decrease the brittleness of
the material and improve compatibility PEG is in a greasy form and therefore it was hard to mix PEG with other
substance in a powder form and produce a homogenous blend. The blends were preheated in an oven to 120°C for
15 min as described in the Section 3.1 (B). The blends were molded at a pressure of 29 bar by using the LabEcon
300, Fontune press. Here, conditions, weight of the blend and frame type were all same as in preliminary experiment.
The blends were then further optimized by using glycerol instead of PEG because some literatures show that
glycerol is a good plasticizer for lignin [59, 47, 49], the G concentration was 5 wt %. AC was added to the blends as
a copolymer with concentrations of 5, 10, 15 wt %, in order to improve the compatibility and morphology of the

15
blends. The preparation and pressing of the blends were carried out, as described in the previous step, and with two
mold times were applied 15 and 30 min
In this step, a few attempts were investigated with only lignin, AC, and glycerol, to see the effect of removing
PU from blends on the material properties. Also, a smaller frame was also used to mold the samples (Section
3.2.3(iii)), where the total weight of the mixture reduced from 14g to 3,5g.
3.5.4 Changing of mixing ratios
This step was carried out with a great change of mixing ratios (lignin: PU: AC: G). It was done to investigate the
effect of increasing the content of G and AC, as well as decreasing lignin and PU content on the strength properties
of the desired product. Several attempts were performed. The mixture contains a quarter of each component (lignin,
PU, AC, G). The blends were prepared as described in Section 3.1 (B)). The blends were pressed at a pressure of
29 bar, at temperatures 110°C and 1400C, for 15 min and 30 min
3.5.5 Changing of frame and pressing method
A new platen press with a higher pressure than that used in the previous step was used to examine if it affects
positively on product characteristics, and that one was available at RISE's laboratory, (Section, 3.2.1. (B)).
Due to limited working time at the RISE's lab, a series of sex blends were made there (Table 3), all pressed at
pressure of 83bar -maximum pressure can be obtained from this type of press. Four blends pressed at temperature
140°C for 30 min, one blend at 110°C for 30min, and one blend at 140°C for 15 min. The weight of the blend was
12g. A new frame was used to explore the effect of increasing thickness of the frame on the final product properties.
The thickness of this frame was 3mm (Section 3.2.3(iii)). These trials were considered to serve as a screening series
which had undergone to the mechanical testing. In order to choose the mold temperature and time in the following
experimental testing (i.e., the parameters that can give a higher tensile properties).
Table 3. Specification of blends and conditions in the press at high pressure (83bar)
Lignin
(wt%)
PU
(wt%)
AC
(wt%)
G
(wt%)
Temperature
(°C)
Time
(min)
25 25 25 25 140 30
30 20 25 25 140 30
35 20 20 25 140 30
40 20 15 25 140 30
25 25 25 25 110 30
25 25 25 25 140 15
3.5.6 Experimental testing
In order to confirm that the selected mould time and mould temperature in the screening experiments (previous
trials) were the best setting, a few experiments were carried out. Two series were implemented, which will be
referred to as series 1 and 2.

16
4. Results and discussions
In this chapter results from the different parts of this study will be presented and discussed.
4.1 Preliminary Experiments
The materials from the initial trials that produced at 29 bar and high lignin concentrations, were unsatisfactory
because the samples were very brittle, completely incoherent and not homogenous (see figure 11). The reason
behind this result could be the concentrations or conditions were not optimized.
Figure 11. Sample molded at LabEcon 300, Fontune Presse. At pressure was 29bar, mold temperature 140°C
and lignin / PU ratio (wt%) 80/20
4.2 Change of pressing method (Pelletization)
The using single pelletize press (i.e. applying a higher pressure than that in the platen press) did not improve the
material properties, however the samples were still brittles, see figure 12. The fact that the lignin contained 35%
moisture which evaporated as gases and could not be released out of the product under press/heat, partly explains
why the product was brittle. This issue was less because the platen press is not completely closed while filling.
One can conclude from this experiment that this equipment was inefficient in this study.
Figure 12. Samples molded at the single pelletizer unit. at 200 bar and 140°C. The samples were 8 mm in
diameter and 15 mm long
4.3 Adding plasticizers and acrylate resin(AC)
The addition of PEG as a plasticizer did not reduce the brittleness of the materials. This might be due to insufficient
PEG dispersion, because the used PEG was in a greasy form and therefore it was hard to mix PEG with other
components in a powder form and produce a homogenous blend
The replacing of PEG by G and adding AC improved to some extent the cohesion of the materials. It is clear that
adding glycerol and AC have an influence on the interaction between lignin and PU. However, the tensile test was
not conducted on these samples, due to a high porosity of the samples.

17
The experiments which they were carried out without PU (i.e. only lignin, AC and G), resulted in only flakes of
lignin, no plate at all. This gives an evidence that the addition of PU is very important for cohesion and stabilization.
Also, a high level of lignin usually produced weak and brittle materials because lignin itself is a brittle material
[36]. However, the low concentration of AC might not be sufficient to improve the matrix integrity.
4.4 Changing of mixing ratios
The desired specifications of the product (cohesiveness, hardness, etc.) were not successfully reached despite all the
previous optimizations for the conditions (temperature, time, pressure) and the composition of the blends.
It was interesting to see the effect of decreasing lignin and PU content to 25 wt %, as well as increasing AC and G
content to 25 wt % on the strength properties of materials. Since the results of the previous steps claim that the
addition of AC and G provides a better material from those with only lignin and PU. Initially, the visual properties
of the samples at that time were better than the previous ones, in terms of cohesiveness and homogeneity. Therefore,
it was interesting to conduct tensile testing on these samples. In order to fit the sample into the tensile instrument,
the sample needed to be cut into stripes. A sharp knife was used for this purpose, unfortunately, the strips broke into
pieces and did not maintain their cohesion.
.
4.5 Changing of frame and pressing method
After all the above optimizations were performed following different methods, the results were not satisfactory.
Hence, there was a need for a total evaluation of the laboratory work, with the conclusion that the using platen press
with a higher pressure than that used in previous steps (29 bar) could affect positively on product properties.
The results of the samples that was done at RISE's lab (Table 3), were the best compared to the previous ones, they
were strong, consistent, and not easy to break (Figure 13), in particular those produced at 140°C. This result suggests
that the higher thickness (3 mm) and pressure (83 bar) were crucial parameters in improving the product properties
in this study. This could be due to the increasing pressure (from 29 bar to 83 bar) and thickness (from1 mm to 3
mm) had enhanced the compatibility and interactions between the components.
Figure 13. Sample molded at Polystat 200T, Servitec Presse. At pressure of 83bar, mold temperature 140°C and
ratio of (lignin: PU: AC: G ) was (40:20:15:25).
After that the new frame (3 mm thickness) was also used at lower pressure value (29 bar), to see which one of these
two parameters (thickness and pressure) affected more in all the previous insufficient results. One attempt was
carried out with 25wt % for each component (lignin, PU, AC, G), at presser 29 bar, temperature 140°C for 30min.
A similar result was obtained to that produced at the higher pressure (83bar) It can be concluded that the frame
thickness has a great influence in the cohesion and hardness of the product.
4.6 Screening Test
The satisfactory previous attempts of the samples in the Table 3 were considered to serve as screening test which
was used to choose the mold temperature and time in the following experimental testing (i.e., the parameters that
can give a higher tensile properties).

18
Table (4) shows the summary of the tensile testing results for this series. It can be observed that the maximum
strength and toughness of the first four samples slightly increases with increasing lignin content, accompanied by
decreasing elongation at break. The deviation between the test are too large for significant results, however the trend
may indicate an increase in the interactions between the hydroxyl groups of lignin and functional groups of the
others component (e.g. urethan, carboxyl, etc.) in the blend.
When comparing sample.5 with 1(both had the same concentrations), decreased mold temperature to 110°C caused
decreased maximum strength and elongation at break, while at the same time increased toughness. Moreover,
comparing sample 6 with 1 (again both had the same concentrations), shows that reducing mold time to 15min
caused an increase in maximum strength, toughness, and elongation at break.
Hence 15 min and 140°C were selected as the optimum mold time and mold temperature, respectively, which used
in the following experimental testing.
Table 4. A table of the calculated mean values with a 95% confidence interval for maximum strength, Young’s
modulus, and elongation at break for the samples that produced at 83 bar. Each sample was tested four times.
Sample
Concentration
(lignin: PU: AC: G)
(wt%)
Temperature
(°C)
Time
(min)
Maximum
strength,
σmax
(N/mm2)
Young's modulus, E
(Mpa)
Elongation at
break, ɛb (%)
1 25:25:25:25 140 30 2.5 ± 0.6 249 ± 59 2.1 ± 1.6
2 30:20:25:25 140 30 3.6 ± 0.7 258 ± 22.1 1.9 ± 1.2
3 35:20:20:25 140 30 3.4 ± 1.1 267 ± 30.3 1,8 ± 0.4
4 40:20:15:25 140 30 3.6 ± 1.7 282 ± 41.6 1,7 ± 0,2
5 25:25:25:25 110 30 1.9 ± 1.1 176 ± 46.3 1.9 ± 1.2
6 25:25:25:25 140 15 3.8 ± 0.5 255 ± 72.5 2.4 ± 1.5
4.7 Experimental testing
In order to confirm that the selected mould time and mould temperature in the screening experiments were the best
setting, a few experiments were carried out. Despite the fact that the assessment was done by comparing only two
samples for each factor, it seems that optimizing mould time (30 min, 15min) affected more than the optimizing
mould temperature (140°C, 110°C) on the sample's strength properties. Two series were implemented, which will
be referred to as series 1 and 2. These were pressed at a pressure of 29 bar and with a temperature of 140°C. The
blends in series 1 and 2 were pressed for 15 and 30 min, respectively.
Eight samples were suggested to be carried out for each series, but due to technical issues with the pressing
equipment, series 2 had been implemented with only four samples. Table 5 shows the concentrations of compounds
in the blends. It should be noticed that the concentration of AC was kept constant for all blends.
Table 5. Composition of lignin, PU, AC, G blends for both series (1 and 2).that produced at 29bar
Series 1
(15min)
Series 2
(30min)
Lignin
(wt%)
PU
(wt%)
AC
(wt%)
G
(wt%)
1 not done 0 70 15 15
2 2 25 42 15 18
3 3 30 38.5 15 16.5
4 4 35 35 15 15
5 5 40 31.5 15 13.5
6 not done 50 24.5 15 10.5
7 not done 60 17.5 15 7.5
8 not done 70 0 15 15

19
4.8 Characteristics and measurements of samples
4.8.1 Fourier transform infrared spectroscopy
FTIR is a powerful technique used to understand the interactions in polymer blends. The infrared spectrum
represents the sum of the spectra of components in the blend, when the polymers are immiscible. The immiscibility
of polymers indicates that the polymers in the blend have an environment similar to the pure polymers. The
differences between the spectra of the pure polymers and the spectra of the components in the blend are generally
due to chemical interactions between polymers in the blend. These chemical interactions can be inferred through
the wavenumber shifts and band broadening.[60]
Polymers like PU, AC, and G all have functional groups which are able to interact with lignin by hydrogen bonding,
such as; ester groups of AC, ether groups of PU and hydroxyl groups of G. Therefore, FTIR spectroscopy was used
to investigate the intermolecular interactions of PU, AC, and G with lignin.
FTIR spectrum of neat AC is shown in Figure 14. This shows weak peak at 3000 cm-1 representative of methyl
symmetric C−H stretching. The strong peak at 1721 cm-1 is that of ester carbonyl C=O stretching vibration. The
weak peaks at 1367 and 1450 cm-1 are assigned to C−H stretching vibration of aromatic groups or C=C band. Weak
peak appearing at 1245 cm-1 and strong peak at 1136 cm-1 indicate C−O (ester band) stretching vibration and C−O−C
(ether group) stretching vibration, respectively. Peaks due to the bonding of C−H appear at 950- 650 cm-1.[61]
Figure 14. FTIR spectra of AC.
Figure 15 shows FTIR analysis of neat PU. The broad band at 3320 cm-1 is assigned to N−H (amide group) vibration.
Peak at 3029 cm-1 relates to C=C stretching vibration. Peaks situated at 2968 and 2920 correspond to C−H of methyl
and methylene group, respectively. The C=O peak of hydrogen bonded carbonyl urethane group appears at 1707
cm-1. The brand at 1593 cm-1 indicates to C−N (carbamate group). The strong peak appears at 1509 cm-1 corresponds
to C=C vibration stretching. Peaks due to the bonding of C−H appear at 1410- 1306 cm-1. Characteristics peaks in
the spectra appearing at 1219 and 1070 cm-1 are due to C−O−C and CH2−O−CH2 stretching vibration, respectively.
[62]

20
Figure 15. FTIR spectra of PU.
FTIR spectra of (0% lignin, 70%PU, 15%AC, 15%G) composite material is shown in Figure 16. Compared with
the neat PU and AC spectra, there are some noticeable changes that occur in the spectrum of lignin/PU/AC/G blend
sample. The strong vibration at 3277 cm-1 that can be attributed to OH group of G plus N−H stretching of PU.
However, there was little change of N−H bond for both blend and neat PU
The band of C=O stretching of PU and AC is broadened and shifts to the one at 1718 cm-1, this result may be due
to the development of hydrogen bonding between the PU and AC. There is obvious change in the shape of C−H
absorption between 1300- 1450 cm-1. This result may be due to the formation hydrogen bonds between PU carbonyl
urethane, AC ester carbonyl and G hydroxyl groups.
It may also be a small shift of position of the methyl symmetric C−H stretching peak from 2920 cm-1 in neat PU to
2930 cm-1 in the blend. FTIR spectra of copolymers shows two new peaks at 1035 and 1106 cm-1, these new peaks
could be related to C−O bond of alcohol related to G.
The methyl symmetric C−H stretching peak and C=C at wavenumbers > 2950 cm-1 disappear. Also, there is an
interesting observation, about the strong peaks for ether group of PU at 1070 cm-1 and C-O ester band of AC at 1136
cm-1 in that both disappear. This may be due to hydrogen bonding that formed between hydroxyl groups in G, ester
carbonyl groups in AC and ether carbonyl groups in PU.

21
Figure 16. FTIR spectra of PU/AC/G (0%lignin, 70%PU).
Figure 17 shows the FTIR spectra of the pure lignin, a broad peak situated around 3368 cm-1, which is visible which
imputed to the presence of hydroxyl groups of phenolic and aliphatic structures[36]. Peak at 2935 cm-1 is related to
a C−H stretching vibration in methoxyl, methyl, and methylene groups of side chains of lignin. Peaks at 1596, 1510,
1495 and 1425 are due to aromatic C=C (conjugated carbonyl/carboxyl) Weak peak appearing at 1364 cm-1
corresponds to OH vibration of syringyl ring. In addition, strong peak appears at 1263 cm-1 relates to OH vibration
of guaiacyl ring. This indicates that the chemical structure of lignin consists of both syringyl and guaiacyl rings.
Peak at 1212 cm-1 relates to C−O−C stretching of aryl ether. Characteristics peaks in the spectra appearing at 1029,
1078 and 1125 cm-1 are due to C−O stretching from ether groups.[40, 39, 63, 19]
Figure 17. FTIR spectra of lignin
A Comparison the spectrum of (40%lignin,31.5%PU,15%AC,13.5%G) composite material with the spectrum of
neat lignin, showed several differences between them, Figure 18. The peak of lignin at 3368 cm-1 for hydroxyl group
is shifted to 3334 cm-1, with a weaker intensity; 1596 cm-1 and 1510 cm-1 for aromatic C=C stretching are shifted to

22
a medium intensity; 1236 cm-1 for OH vibration of guaiacyl ring disappears 1029, 1078 and 1125 cm-1 for C−O
stretching of ether groups also disappear. It can be observed that all characteristics peaks of PU and AC are almost
similar to that in the spectrum of (0%.70%PU,15%AC,15%G) composite material.
Figure 18. FTIR spectra of lignin/ PU/AC/G (30%lignin).
The most interesting observation in the FTIR spectrum of lignin blend, are that the strong peaks of free phenolic
group of lignin at 1236 cm-1, ether group of PU at 1070 cm-1 and C-O ester band of AC at 1136 cm-1 almost
disappeared. This means that these groups actively participated in a possible copolymerization. These changes in
wavenumbers indicate that there are an interaction between hydroxyl and carbonyl groups of the components
(lignin, PU, AC, G) in the composite material. For example, hydrogen bonding probably formed between hydroxyl
groups of lignin and carbonyl, ether groups in PU and carbonyl, ester band in AC. Figure 19 shows the schematics
of the possible interactions.
It can be concluded that there are some promising interactions between functional groups of lignin, PU, AC, and G.
This means that the components are not only melted together during molding but they interacted with each other.
However, what was formed or happened is very hard to know, because the blends are a mixture of four polymers,
and the FTIR technique gives very general information.
Figure 19. Hydrogen bonding interactions between hydroxyl groups in lignin and carbonyl groups of PU and
carbonyl groups of AC

23
4.8.2 Glass Transition Temperature and Melting Temperature
The DSC analysis were performed in order to measure Tg and Tm of the polymers and their components in the
blends. A single glass transition temperature of blends is usually taken as evidence of miscibility. On the other hand,
the two glass transition temperatures are evidence that blends exhibit immiscible blend behavior[64].
Figure 20 illustrates DSC curves for polyurethane (PU) and acrylate (Ac)control samples. The DSC curve of the
neat PU shows no melting endotherm peak up to 280°C, but shows the Tg at around 143°C and a crystalline peak
temperature at around 203°C. The Tg of the pure acrylate is at approximately124°C and melting point at about
177°C.
Figure 20. Deferential scanning calorimetry profiles of pure polyurethane (PU) and acrylate (Ac).
The DSC curve of the pure lignin (Figure 21) illustrations two Tg at 121°C and 134°C. It is difficult to get a precise
value of Tg for any type of lignin due to many factors. Examples of factors that have impact on the Tg of lignin are
the existence of water, thermal history, pressure, molecular weight and cross- linking[54]. It is apparent that the Tg
values of lignin are low due to the presence of water (approximately 35 wt %) which helps to decrease the
intermolecular interactions between hydroxyl groups of lignin. However, these values are consistent with those
reported for several types of lignin with Tg values between 90- 180 °C[65]. In addition, in the DSC curve of lignin,
melting endotherm is visible in the range of temperature from 137- 162 °C with a sharp peak located at about 139°C.
Clearly pure lignin has a large enthalpy relaxation that may be due to its complex interactions between hydrogen
molecules which can induce more energy for absorption.

24
Figure 21. Deferential scanning calorimetry profiles of pure lignin.
In the series 1 (15min), the DSC curve of the samples with 70wt%PU, melting endotherm is visible with a sharp
peak located at about 267°C and Tg at around 1560C, Figure 22. The existence of acrylate and glycerol in the blend
with 70wt%PU seems to show the melting point of the blend. As mentioned before that the higher the degree of
order within the hard segments, the higher the melting point of the polyurethane. This fact can explain the high
melting temperature of this blend.
The blend with 25wt%lignin contents exhibits a single Tg at about 154°C in the three series (screening series, series
1 and series 2). However, the Tm of this blend in screening series is higher than that in series 1 and 2. This probably
due to that more AC is added to the blend in screening series, and more intermolecular hydrogen bonds are created
between the polymers. That can lead to an increase in the heat required to break and loosen the bonds.
The two Tg values are observed when the lignin contents are increased to 30 wt % and 35 wt % in the three series.
(screening series, series, and series 2). These two values indicate that the blends with 30 wt % and 35 wt % lignin
exhibit immiscible blends behavior.
A single glass transition can be found when lignin content is increased to 40wt% in the screening series and 1, but,
this blend shows two Tg in the series 2. The blends with 50 wt %, 60 wt % and 70 wt % lignin concentrations in
series 1 do not exhibit miscible behaviour because in these blends two Tg values are in existence.
The presence of two Tg in the DSC measurement is an indication of a non- homogeneous structure, which may
affect other properties of the blends. The immiscibility of the polymers suggests that there is a phase separation
between the components, where each polymer in the blend has its own behavior. This fact can be used as an
explanation for the probable immiscibility of the two or more polymers in the blend[66]. FTIR results support this
conclusion, where a part of each component has been reacted with each other during the melting.
The measured glass transition temperatures have been affected by the crystallinity in PU- rich blends, where a high
energy is required for the transition due to the crystalline regions’ place on the amorphous regions and that effects
the segmental motion, thereby leading to a raised Tg. It should be noted that there are no correlations between the
relaxation energy endotherms of the different blends system.

25
Figure 22. DSC curves of lignin/polyurethane/acrylate/glycerol blends for series 1. (Table 5. shows the
compositions of lignin, PU, AC, G blends and conditions that were applied in series 1)
The DSC curves of three series ((screening series, series 1 and series 2) appears to exhibit an immiscible blend
behaviour. Two Tg values are observed for almost all blends. In the first one, Tg seems to decrease with increasing
lignin content up to 40 wt %. At the same time, a slight decrease of Tm for the blends, can be observed when the
content of lignin increases to 40 wt %, see Figure 23 and Figure 24. This fact can be used as an argument for that
the polymers are likely miscibility in the blends. Meanwhile, the second Tg values are around 155°C for all blends
with up to 40 wt % lignin contents.
This thermal phenomenon probably is a consequence of some interactions between lignin, PU, AC and G. and this
is in consistent with FTIR results. However, the presences two Tg values of the blend doesn’t mean that there are
no interactions between lignin, PU, AC and G.
It can be concluded that a partial miscibility probably takes place in these blends. Similar results were obtained by
Mousavioun et al.[38],[33] for soda lignin / poly(hydroxybutyrate) (PHB) blends and by Feldman et al[66] for poly
(vinyl chloride)/ organsosolv lignin blends. Kadla et al.[3] found that Tm of the poly(ethylene terephthalate)/lignin
blends decreased with increasing lignin content
Generally, the values obtained in the present study are slightly higher than that reported in literatures.
According the literature, samples are usually exposed to an initial heating process (above its Tg) to reduce the
enthalpy relaxation that may affect the Tg evaluation[18] ( i.e. the samples are heated above its Tg then cooled and
again reheated to measure the Tg from the second heating process). Whereas in this work the samples exposed to
only one heating process due to the absence of possibility (the limiting time of this project)
Series with low mold time (series 1 (15min)) shows slightly lower Tg and Tm values compared to the composite
materials produced with longer mold (series 2 (30 min))
It is interesting to note that the Tg of the blends increases with increasing plasticizer (G) and PU contents. This
doesn’t follow the assumption that the increasing plasticizers content reduces the Tg of polymers. due to increasing
free volume of a system[32]. This result could be due to a high intermolecular interaction between the PU chains,
which prevents the plasticizer to form hydrogen bonds with PU chains.
Addition of plasticizers increase the free volume and molecular mobility due their small molecular weight which
are easily occupied intermolecular spaces between polymer chains and formed hydrogen bonds with polymer
chains[47]

26
In the series 1, the Tg and Tm increase when the lignin content increase to 50wt%. But increasing lignin content
>50wt%, further increased Tm while it has no significant impact on the Tg.
Figure 23. The calculated mean values for glass transition temperature for lignin/PU/AC/G blends for three
different series, Tg which observed during DSC measurement. Each sample was tested two times. (Table 3 and 5
show the compositions of lignin, PU, AC, G blends and conditions that were applied in screening series and
series (1 and 2), respectively,).
0
50
100
150
200
250
300
0 20 40 60 80
Mel
ting t
emp
erat
ure
, T
m
(°C
)
Lignin content (%)
Secreening series
0
50
100
150
200
250
300
0 20 40 60 80Mel
ting t
emp
erat
ure
, T
m
(°C
)
Lignin content (%)
Series 1 (15min)
0
50
100
150
200
250
300
0 20 40 60 80Mel
ting t
emp
erat
ure
, T
m
(°C
)
Lignin content (%)
Series 2 (30 min)
50
70
90
110
130
150
170
0 20 40 60 80
Gla
ss t
ransi
tio
n
tem
per
ature
,T
g(°
C)
Lignin content (%)
Screening series
50
70
90
110
130
150
170
0 20 40 60 80
Gla
ss t
ransi
tio
n
tem
per
ature
, T
g (
°C)
Lignin content (%)
Series 1 (15min)
50
70
90
110
130
150
170
-10 10 30 50 70 90
Gla
ss t
ransi
tio
n
tem
per
ature
, T
g(°
C)
Lignin content (%)
Series 2 (30 min)

27
Figure 24. The calculated mean values for the melting temperature for lignin/PU/AC/G blends for three different
series, that observed during the DSC measurement. Each sample was tested two times. Tm which observed during
DSC measurement. Each sample was tested two times. (Table 3 and 5 show the compositions of lignin, PU, AC,
G blends and conditions that were applied in screening series and series (1 and 2), respectively).
4.8.3 Mechanical properties
The mechanical properties of the series 1 & 2 are presented here. Where, the mechanical properties of screening
series have been presented in the table 4 (Section 4.6)
The results of the maximum strength of series 1 and 2 are shown in figure 25. One can see that the maximum
strength of the composite materials slightly increases with increasing lignin content for series 1 and 2. Deviations
are too large which indicate for significant differences. The series 1 shows that a further increase in lignin content
leads to a reduction of the maximum strength and a significant spread in the results.
Figure 25, Maximum strength of lignin/PU/AC/G composite materials for two series. The error bars are showing
the standard deviation of four measurements for each sample. (Table 5 shows the compositions of lignin, PU,
AC, G blends and conditions that were applied in series 1 & 2).
The increased lignin contents in the blends up to 40 wt % also contributed to decrease the elongation at break value
for two series, Figure 26. This indicates that the flexibility of the blends is decreased, hence their toughness
increases, with increasing lignin content in the composites under mechanical stress.
Figure 26, Elongation at break of lignin/PU/AC/G composite materials for two series. The error bars are
showing the standard deviation of four measurements for each sample. (Table 5 shows the compositions of
lignin, PU, AC, G blends and conditions that were applied in series 1 & 2).
0
1
2
3
4
5
0 10 20 30 40 50 60 70Max
imum
str
ength
(M
Pa)
Lignin content (%)
Series 1 (15 min)
0,00,51,01,52,02,53,03,54,0
0 10 20 30 40 50 60 70
Elo
ngat
ion a
t b
reak
(%
)
Lignin content (%)
Series 1 (15min)
0,00,51,01,52,02,53,03,54,0
0 10 20 30 40 50 60 70
Elo
ngat
ion a
t b
rrea
k (
%)
Lignin content (%)
Series 2 (30)
0
1
2
3
4
5
0 10 20 30 40 50 60 70Max
imum
str
ength
(M
Pa)
Lignin content (%)
Series 2 (30 min)

28
The Yonge’s modulus of composite materials is increased with the increasing lignin content in the blends, Figure
27. Additionally, this result supports the results of elongation at break of materials, that the hardness of composites
increases with increasing lignin content.
Figure 27, Youngs’s modulus of lignin/PU/AC/G composite materials for two series. The error bars are showing
the standard deviation of four measurements for each sample. (Table 5 shows the compositions of lignin, PU,
AC, G blends and conditions that were applied in series 1 & 2).
The increase of tensile strength, increase in Youngs’s modulus, and the decrease of elongation at break when the
lignin content increased to 40wt% could be attributed to the presence of hydrogen bonds between polymer
molecules. FTIR results support the conclusion that there was an interaction between some functional groups in
polymers
Higher lignin contents show a great scattering in the tensile strength results, indicating that 25- 40 wt% is a suitable
range for the composition of polymers in this study. It should be noted that the mechanical properties of blend with
70 wt % lignin contents cannot be measured because the material was broken into small pieces during the cutting
process.
On the other hand, the results indicate that the increasing the PU content leads to decreased tensile strength,
decreased in Youngs’s modulus, and increased elongation at break. This can be explained by weak interactions
between the polymers’ molecules when the PU content was increased.
The impact of increasing plasticizer content on mechanical properties of the composite materials was negative. An
increased plasticizer content decreases the tensile strength, decreases Young’s modulus, and increases elongation
at break, in the case of series 1 and 2. due to that the presence of plasticizers increases the breaking of the bonds
between molecules[31]. The results show that the mold time has no significant impact on the strength properties of
composites materials.
The mechanical properties of a material depended directly on the morphology of the polymers such as the polymers
size and distribution[37]. The particles of PU in the blends have a different size in which the manual mixing could
not be enough to make the polymer components blend at the same level (i.e. homogenous), regardless of the
intermolecular interactions in the blend. In general, the materials exhibited low tensile strength, the range of tensile
strength for this study was between 2 and 3.5 MPa with addition 40 wt % lignin.
Many studies have reported that the mechanical performance of the lignin based blends is poor. Li et al[37]. reported
that tensile strength of poly(ɛ-caprolactone)/ lignin blends decreased from 36 MPa to 6.9 MPa with addition 40wt%
lignin. Chen et al[40]. found that the tensile strength of chitosan/lignin blends increased from 43.3 to 68 MPa with
addition 20 wt % lignin, but a further increase of lignin content led to decrease in the tensile strength of
chitosan/lignin blends. Chen et al[36]. showed that the tensile strength and modulus of polypropylene/lignin blends
decreased with increasing lignin content up to 70 wt %, tensile strength from 32 to 7 MPa and modulus from 27 to
18 MPa. Whereas, in this study, the results of the Youngs’s modulus were higher (159- 282 MPa) compared with
previous studies. These results could be due to the high thickness of the composite materials (3 mm)
The lignin products generally considered heterogeneous products with a high content of impurities and this affects
the mechanical properties of lignin based blends. Additionally, low purity of the polyurethane used in this study
could have contributed to the weakening of the strength properties of the blends.
0
50
100
150
200
250
300
350
0 10 20 30 40 50 60 70
E-
mo
dulu
s (M
pa)
Lignin content (%)
Series 1 (15min)
0
50
100
150
200
250
300
350
0 10 20 30 40 50 60 70
E-m
od
ulu
s (M
pa)
Lignin content (%)
Series 2 (30 min)

29
5. Conclusion
The aim of this study was to produce a composite material of lignin and polyurethane materials which are
undervalued by- products of many different industries. And this may contribute to solving environmental problems
by reducing the use of non-renewable resources in the future
The results of this study illustrate that it is possible to produce lignin based PU blends, but lignin concentration
should not be more than 40 wt%. In addition, there is a need for addition a third polymer and a plasticizer to obtain
a coherent material. Therefore, AC and G were added to the lignin/PU blends as copolymer and plasticizer,
respectively. It can be seen when making the composite material that a higher thickness of the frame makes the
materials less brittle and stronger. Also, a higher mold temperature gives a consistent material. The FTIR spectrums
indicate the presence of hydrogen bonding interactions between the functional groups of lignin, PU, and AC. The
IR absorption peaks corresponding to the lignin hydroxyl groups, the PU ether group and AC ester bond have been
disappeared in the blend, indicating the presence of a hydrogen bonding interaction between these functional groups.
DSC analysis revealed the existence of two glass transition temperature (Tg) values indicative of an immiscible
blend. However, the first Tg and melting temperature (Tm) of composite material are decreased with increasing
lignin content up to 40 wt %. but, the second Tg kept almost constant. The incorporation of lignin up to 40 wt%
increases the maximum strength and Young’s modulus of composite material, but the elongation at break decreased
6 Future work
• The hypothesis of this study was to produce insulating, fire-resistant and hydrophobic composite materials.
Therefore, future work into whether these composite materials conform to these specifications is necessary.
• More samples using different conditions would be preferable to reduce the errors and be able to find
significant differences between the samples made under different conditions.
• The investigation would be regarding the method optimizing, such as increasing the acrylate concentration
even more, or using another plasticizer instead of glycerol such as vanillin, as the literature shows that the
vanillin-like molecules are a good plasticizer for the wet lignin.
• Future work may be to expand the study by using another polymer instead of acrylate. According to the
literature, chitosan may be a good alternative to acrylate due to its good biodegradability and
biocompatibility, and it has several functional groups that can react with functional groups of lignin and
PU.
7. Acknowledgment
I would like to express my gratitude and appreciation to my supervisors Maria Sandberg (Karlstad
University), Fernando Alvarado (RISE Bioeconomy) and Fredrik Berthold (RISE Bioeconomy), for
guiding and supporting me through the learning process of this master thesis. A special thanks to Henrik
Ullsten (Karlstad University) for the useful discussions and helping me with the equipment.
Thanks to Ammar for all the support and understanding.
I would like to thank my loved ones, my amazing kids (Muhammed and Hamza) who have supported
and encouraged me throughout my journey

30
8. References
[1] R. Hatti-Kaul, U. Törnvall, L. Gustafsson, and P. Börjesson, “Industrial biotechnology for the
production of bio-based chemicals - a cradle-to-grave perspective,” Trends Biotechnol., vol. 25,
no. 3, pp. 119–124, 2007.
[2] T. F. Garrison, A. Murawski, and R. L. Quirino, “Bio-based polymers with potential for
biodegradability,” Polymers (Basel)., vol. 8, no. 7, pp. 1–22, 2016.
[3] J. F. Kadla and S. Kubo, “Lignin-based polymer blends: Analysis of intermolecular interactions in
lignin-synthetic polymer blends,” Compos. Part A Appl. Sci. Manuf., vol. 35, no. 3, pp. 395–400,
2004.
[4] S. Sen, S. Patil, and D. S. Argyropoulos, “Thermal properties of lignin in copolymers, blends, and
composites: a review,” Green Chem., vol. 17, pp. 4862–4887, 2015.
[5] A. K. Mohanty, M. Misra, and L. T. Drzal, “Sustainable Bio-Composites from renewable
resources: Opportunities and challenges in the green materials world,” J. Polym. Environ., vol. 10,
no. 1–2, pp. 19–26, 2002.
[6] L. Carroll, “Chapter 5 : Structure of Polymers,” pp. 1–12, 1872.
[7] S. Li, Yan. Sarkanen, “Thermoplastics with Very High Lignin Contents,” in Lignin: Historical,
Biological, and Materials Perspectives, Washington, DC, 1999, pp. 351–366.
[8] E. de Jong, A. Higson, P. Walsh, and M. Wellisch, “Task 42 Biobased Chemicals - Value Added
Products from Biorefineries,” A Rep. Prep. IEA Bioenergy-Task, p. 36, 2011.
[9] H. Hatakeyama and T. Hatakeyama, “Lignin Structure, Properties, and Applications,” 2009, pp.
1–63.
[10] D. Feldman, M. Lacasse, and L. M. Beznaczuk, “Lignin-polymer systems and some applications,”
Prog. Polym. Sci., vol. 12, no. 4, 1986.
[11] M. Szycher, “Structure- Property Relations in Polyurethanes,” in Szycher`s handbook of
polyurethanes, 2nd ed., 2012, pp. 37–86.
[12] P. Jeppsson and P. Jeppsson, “Processing and recycling polyurethane as thermo and thermosetting
plastic,” 2005.
[13] W. Yang, Q. Dong, S. Liu, H. Xie, L. Liu, and J. Li, “Recycling and disposal methods for
polyurethane foam wastes,” Procedia Environ. Sci., vol. 16, pp. 167–175, 2012.
[14] G. Henriksson, “Lignin,” in The Ljungberg Teztbook Wood Chemistry and Pulp Technology,
2010.
[15] S. Haghdan, shayesteh Renneckar and S. D. Gregory, “Sources of Lignin,” in Lignin in polymer
composites, O. Faruk and M. Sain, Eds. 2016.
[16] C. Welker, V. Balasubramanian, C. Petti, K. Rai, S. DeBolt, and V. Mendu, “Engineering Plant
Biomass Lignin Content and Composition for Biofuels and Bioproducts,” Energies, vol. 8, no. 8,
pp. 7654–7676, 2015.
[17] Y. Li and S. Sarkanen, “Biodegradable kraft Lignin- based Thermoplastics,” Biodegrad. Polym.
Plast., pp. 121–139, 2003.
[18] C. Cui, H. Sadeghifar, S. Sen, and D. S. Argyropoulos, “Toward thermoplastic lignin polymers;
Part II: Thermal & polymer characteristics of kraft lignin & derivatives,” BioResources, vol. 8,
no. 1, pp. 864–886, 2013.
[19] D. Watkins, M. Nuruddin, M. Hosur, A. Tcherbi-Narteh, and S. Jeelani, “Extraction and

31
characterization of lignin from different biomass resources,” J. Mater. Res. Technol., vol. 4, no. 1,
pp. 26–32, 2015.
[20] T. H. E. Importance, O. F. A. Full, and V. C. Approach, “the Importance of a Full Value Chain
Approach,” no. June, 2016.
[21] P. E. R. Tomani, “THE LIGNOBOOST PROCESS,” vol. 44, no. October 2005, pp. 53–58, 2010.
[22] J. Sameni, S. Krigstin, D. dos S. Rosa, A. Leao, and M. Sain, “Thermal characteristics of lignin
residue from industrial processes,” BioResources, vol. 9, no. 1, pp. 725–737, 2014.
[23] C. Wang, S. S. Kelley, and R. A. Venditti, “Lignin-Based Thermoplastic Materials,”
ChemSusChem, vol. 9, no. 8, pp. 770–783, 2016.
[24] J. Berghel et al., “The effects of kraft lignin additives on wood fuel pellet quality, energy use and
shelf life,” Fuel Process. Technol., vol. 112, pp. 64–69, 2013.
[25] C. In, I. Applications, and O. F. Technical, “Challenges in industrial applications of technical
lignins,” vol. 6, no. Sjöström 1982, pp. 3547–3568, 2011.
[26] K. G. Kalogiannis, S. D. Stefanidis, C. M. Michailof, A. A. Lappas, and E. Sjöholm, “Pyrolysis of
lignin with 2DGC quantification of lignin oil : Effect of lignin type , process temperature and
ZSM-5 in situ upgrading,” J. Anal. Appl. Pyrolysis, vol. 115, pp. 410–418, 2015.
[27] H. Lignoboost, “Characterization of Softwood and Hardwood LignoBoost Kraft Lignins with
Emphasis on their Antioxidant Activity,” vol. 9, pp. 2051–2068, 2014.
[28] “The 7th Nordic Wood Biorefinery Conference,” in The next generation LignoBoost- Tailor made
lignin production for different lignin bio- product markets, 2017.
[29] B. M. Upton and A. M. Kasko, “Strategies for the Conversion of Lignin to High-Value Polymeric
Materials: Review and Perspective,” Chem. Rev., vol. 116, p. 2277, 2015.
[30] D. Feldman, “Lignin and its Polyblends- A review,” Chem. Modif. Prop. Usage Lignin, pp. 81–
99, 2002.
[31] V. K. Thakur, M. K. Thakur, P. Raghavan, and M. R. Kessler, “Progress in green polymer
composites from lignin for multifunctional applications: A review,” ACS Sustain. Chem. Eng.,
vol. 2, no. 5, pp. 1072–1092, 2014.
[32] J. Bouajila, P. Dole, C. Joly, and A. Limare, “Some laws of a lignin plasticization,” J. Appl.
Polym. Sci., vol. 102, no. 2, pp. 1445–1451, 2006.
[33] P. Mousavioun, P. J. Halley, and W. O. S. Doherty, “Thermophysical properties and rheology of
PHB/lignin blends,” Ind. Crops Prod., vol. 50, pp. 270–275, 2013.
[34] S. Kubo and J. F. Kadla, “The formation of strong intermolecular interactions in immiscible
blends of poly (vinyl alcohol)(PVA) and lignin,” Biomacromolecules, vol. 4, no. 3, pp. 561–567,
2003.
[35] Y. Li, J. Mlyn, and S. Sarkanen, “The First 85% Kraft Lignin-Based Thermoplastics*,” J Polym
Sci B Polym Phys, vol. 35, no. February 1997, pp. 1899–1910, 1997.
[36] F. Chen, H. Dai, X. Dong, J. Yang, and M. Zhong, “Physical Properties of Lignin-Based
Polypropylene Blends,” Polym. Polym. Compos., vol. 32, no. 7, pp. 1019–1025, 2011.
[37] J. Li, Y. He, and Y. Inoue, “Study on Thermal and Mechanical Properties of Biodegradable
Blends of Poly(ɛ-caprolactone) and Lignin,” Polym J, vol. 33, no. 4. pp. 336–343, 2001.
[38] P. Mousavioun, W. O. S. Doherty, and G. George, “Thermal stability and miscibility of

32
poly(hydroxybutyrate) and soda lignin blends,” Ind. Crops Prod., vol. 32, no. 3, pp. 656–661,
2010.
[39] S. Sahoo, M. Misra, and A. K. Mohanty, “Enhanced properties of lignin-based biodegradable
polymer composites using injection moulding process,” Compos. Part A Appl. Sci. Manuf., vol.
42, no. 11, pp. 1710–1718, 2011.
[40] L. Chen, C. Tang, N. Ning, C. Wang, Q. Fu, and Q. Zhang, “Preparation and Properties of
Chitosan/Lignin Composite Films,” Chinese J. Polym. Sci., vol. 27, no. 5, pp. 739–746, 2009.
[41] J. Li, Y. He, and Y. Inoue, “Thermal and mechanical properties of biodegradable blends of
poly(L-lactic acid) and Lignin,” Polym. Int., no. September 2002, pp. 949–955, 2003.
[42] T. Saito et al., “Turning renewable resources into value-added polymer: development of lignin-
based thermoplastic,” Green Chem., vol. 14, no. 12, p. 3295, 2012.
[43] R. O. Ebewele, “Polymer Properties and Applications,” in Polymer science and technology, 2000.
[44] M. Miller, “Common Polymers used in the Formation of Concrete and Cementitious Products,” in
Polymers in cementitious materials, 2005, pp. 30–32.
[45] D. Feldman, “Lignin and Its polyblends- A review,” in Chemical modification, Properties, and
Usage of Lignin, Springer US, 2002, pp. 81–99.
[46] F. Liu, K. Xu, M. Chen, and D. Cao, “The Roles of Polyacrylate in Poly ( vinyl chloride ) -Lignin
Composites,” no. 1, 2011.
[47] M. G. A. Vieira, M. A. Da Silva, L. O. Dos Santos, and M. M. Beppu, “Natural-based plasticizers
and biopolymer films: A review,” Eur. Polym. J., vol. 47, no. 3, pp. 254–263, 2011.
[48] J. A. Brydson, PLASTICS MATERIIALS, Sixth edit. 1995.
[49] F. M. Vanin, P. J. A. Sobral, F. C. Menegalli, R. A. Carvalho, and A. M. Q. B. Habitante, “Effects
of plasticizers and their concentrations on thermal and functional properties of gelatin-based
films,” Food Hydrocoll., vol. 19, no. 5, pp. 899–907, 2005.
[50] T. Mekonnen, P. Mussone, H. Khalil, and D. Bressler, “Progress in bio-based plastics and
plasticizing modifications,” J. Mater. Chem. A, vol. 1, pp. 13379–13398, 2013.
[51] A. Gandini and M. Naceur, “Lignins as Components of Macromolecular Materials,” in
Monomers, Polymers and Composites from Renewable Resources, 1st editio., 2008, pp. 243–273.
[52] R. Sothornvit and J. M. Krochta, “Plasticizer effect on mechanical properties of β-lactoglobulin
films,” J. Food Eng., vol. 50, no. 3, pp. 149–155, 2001.
[53] M. Suchitra, “Thermal Analysis of Composites Using DSC,” Adv. Top. Charact. Compos., pp.
11–33, 2004.
[54] H. Hatakeyama, “Characterization in solid state,” in Methods in Lignin Chemistry, 1992, pp. 200–
213.
[55] Humboldt University of Berlin, “Advanced Lab: DSC Investigation of Polymers,” pp. 1–17,
2009.
[56] M. Szycher, “Structure- Property Relations in Polyurethanes,” in Szycher`s handbook of
polyurethanes, 2nd ed., 1999, pp. 37–85.
[57] S. Multur, “Thermal Analysis of Composities Using DSC,” in Advanced Topics in
Characterization of Composities, 2004, pp. 11–33.
[58] S. L. LeVan, “Thermal Degradation,” Concise Encycl. Wood Wood-based Mater., pp. 271–273,

33
1989.
[59] N. E. Suyatma, L. Tighzert, A. Copinet, and V. Coma, “Effects of Hydrophilic Plasticizers on
Mechanical , Thermal , and Surface Properties of Chitosan Films Effects of Hydrophilic
Plasticizers on Mechanical , Thermal , and Surface Properties of Chitosan Films,” Differences, pp.
3950–3957, 2005.
[60] B. H. Stuart, “Polymer,” in Infrared Spectroscopy: Fundamentals and Applications, vol. 8, 2004,
pp. 113–135.
[61] A. A. S. Al-ali and T. Y. Kassab-bashi, “Fourier Transform Infra Red ( FTIR ) Spectroscopy of
New Copolymers of Acrylic Resin Denture Base Materials,” vol. 4, no. 4, pp. 172–180, 2015.
[62] K. Badri, S. Wong Chee, S. Maisara, H. Liow, B. Norhafiza Yuhana, and N. Nor Rabbi’atul
‘Adawiyah, “FTIR Spectroscopy Analysis of the Prepolymerization of Palm-Based
Polyurethane,” Solid State Sci. Technol., vol. 18, no. 2, pp. 1–8, 2016.
[63] R. Rana, R. Langenfeld-Heyser, R. Finkeldey, and A. Polle, “FTIR spectroscopy, chemical and
histochemical characterisation of wood and lignin of five tropical timber wood species of the
family of Dipterocarpaceae,” Wood Sci. Technol., vol. 44, no. 2, pp. 225–242, 2010.
[64] G. Bisso, P. Casarino, and E. Pedemonte, “Poly ( ɛ -caprolactone )/ poly ( vinyl methyl ether )
blends : miscibility by calorimetric measurements,” Thermochim. Acta, vol. 321, pp. 81–87, 1998.
[65] N. E. El Mansouri, Q. Yuan, and F. Huang, “Characterization of alkaline lignins for use in
phenol-formaldehyde and epoxy resins,” BioResources, vol. 6, no. 3, pp. 2647–2662, 2011.
[66] D. Feldman and V. Forge, “Rigid Poly ( viny1 chloride ) -Organosolv Lignin Blends for
Applications in Building.”

34
9. Appendix
Table 1. Maximum tensile strength, elongation at break and Youngs’s modulus of the screening series reported in
mean values with confidence interval.
Lignin
(%) PU (%) AC (%) G (%)
Maximum tensile
strength, σ max
(Mpa)
C
(t95%)
Elongation
at break, ɛ
(%)
C
(t95%)
Youngs
modulus, E
Mpa
C
(t95%)
25 25 25 25 2,53 0,57 2,05 1,66 218,25 59,02
30 20 25 25 3,62 0,70 1,90 1,18 258,00 22,09
35 20 20 25 3,41 1,08 1,84 0,39 267,25 30,29
40 20 15 25 3,61 0,45 1,68 0,24 282,00 41,64
Table 2. Maximum tensile strength, elongation at break and Youngs’s modulus of the series 1 (15 min) reported in
mean values with confidence interval.
Lignin
(%)
PU
(%)
AC
(%) G (%)
Maximum
tensile strength,
σ max (Mpa)
C(t95%) Elongation
at break, ɛ
(%)
C(t95%) Youngs
modulus, E
Mpa
C(t95%)
25 25 25 25 2,53 0,57 2,05 1,66 218,25 59,02
30 20 25 25 3,62 0,70 1,90 1,18 258,00 22,09
35 20 20 25 3,41 1,08 1,84 0,39 267,25 30,29
40 20 15 25 3,61 0,45 1,68 0,24 282,00 41,64
Lignin
(%) PU (%) AC (%) G (%)
Maximum
tensile
strength, σ max
(Mpa)
C (t95%)
Elongation
at break, ɛ
(%)
C (t95%)
Youngs
modulus, E
Mpa
C (t95%)
0 70 15 15 0,85 0,08 2,60 0,91 69 7,56
25 42 15 18 2,00 0,53 1,98 0,27 159 15,40
30 38.5 15 16.5 2,46 0,29 1,75 0,28 198 20,75
35 35 15 15 2,75 0,63 1,75 0,28 191 53,89
40 31.5 15 13.5 2,55 0,06 1,65 0,21 212 10,47
50 24.5 15 10.5 2,40 0,60 1,78 0,78 213 20,48
60 17.5 15 7.5 3,08 1,51 1,60 0,68 216 47,03

35
Table 3. Maximum tensile strength, elongation at break and Youngs’s modulus of the series 2 (30 min) reported in
mean values with confidence interval.
Lignin
(%) PU (%) AC (%) G (%)
Maximum tensile
strength, σ max
(Mpa)
C (t95%) Elongation at
break, ɛ (%) C (t95%)
Youngs
modulus, E
Mpa
C (t95%)
25 42 15 18 2,3 0,8 2,3 0,9 172,3 39,0
30 38.5 15 16.5 2,4 0,5 1,9 0,4 189,5 39,8
35 35 15 15 3,3 0,7 1,8 0,4 200,0 72,9
40 31.5 15 13.5 3,4 0,4 1,6 0,4 248,3 44,7