Advanced Multi-Product Coal Utilization Byproduct ... Library/Research/Coal/major... · Advanced...
32
Advanced Multi Advanced Multi - - Product Coal Utilization Product Coal Utilization Byproduct Processing Plant: Byproduct Processing Plant: Project Status Report Project Status Report Tom Robl Tom Robl 1 1 , Jack Groppo , Jack Groppo 1 1 , Robert Rathbone , Robert Rathbone 1 1 , Steve Bryan , Steve Bryan 2 2 and and Kenny Tapp Kenny Tapp 3 3 1 1 The University of Kentucky, Center for Applied Energy Research; The University of Kentucky, Center for Applied Energy Research; 2 2 CEMEX, Inc.; CEMEX, Inc.; 3 3 LG&E Energy, Inc. LG&E Energy, Inc.
Transcript of Advanced Multi-Product Coal Utilization Byproduct ... Library/Research/Coal/major... · Advanced...

Advanced MultiAdvanced Multi--Product Coal Utilization Product Coal Utilization Byproduct Processing Plant: Byproduct Processing Plant:
Project Status ReportProject Status Report
Tom RoblTom Robl11, Jack Groppo, Jack Groppo11, Robert Rathbone, Robert Rathbone11, Steve Bryan, Steve Bryan22 and and Kenny TappKenny Tapp33
11The University of Kentucky, Center for Applied Energy Research; The University of Kentucky, Center for Applied Energy Research; 22CEMEX, Inc.; CEMEX, Inc.;
33LG&E Energy, Inc.LG&E Energy, Inc.

Outline of DiscussionOutline of Discussion
Organization of ProjectOrganization of Project–– Project SiteProject Site–– Proposed TechnologyProposed Technology–– Task Outline Task Outline
Current Project StatusCurrent Project Status–– Resource Assessment ActivitiesResource Assessment Activities–– Pilot Circuit TestingPilot Circuit Testing–– Initial Product TestingInitial Product Testing–– Near Term Project ActivitiesNear Term Project Activities

Project Partners: CEMEX, Inc., LG&E Energy (KU),Project Partners: CEMEX, Inc., LG&E Energy (KU),UKUK--CAER (UKRF), U.S. CAER (UKRF), U.S. DoEDoE (CCPI Project)(CCPI Project)
Project ObjectiveProject ObjectiveDemonstration of an advanced coal ash Demonstration of an advanced coal ash beneficiation processing plant at LG&E Energy beneficiation processing plant at LG&E Energy Corp.’s 2,200 Corp.’s 2,200 MWMWee Ghent Power Plant in Ghent, Ghent Power Plant in Ghent, Kentucky.Kentucky.The plant represents the next generation in coal The plant represents the next generation in coal utilization byutilization by--product (CUB) beneficiation in that product (CUB) beneficiation in that it addresses the entire CUB stream and it addresses the entire CUB stream and generates a variety of useful products. generates a variety of useful products. Total project funding: $8,916,800Total project funding: $8,916,800DOE share: $4,450,200 (49%)DOE share: $4,450,200 (49%)

Ghent Power Station,Ghent Power Station,From Upper PondFrom Upper Pond

Why Ghent ?Why Ghent ?–– Large PlantLarge Plant–– Large Stored Ash ReserveLarge Stored Ash Reserve–– Immediate Need for Ash Disposal ReductionImmediate Need for Ash Disposal Reduction–– River Port, Rail AccessRiver Port, Rail Access–– KU System Member (ECR facility)KU System Member (ECR facility)–– Ash Quality not Much Worse than other PlantsAsh Quality not Much Worse than other Plants
Good Fines Content Good Fines Content
Advanced MultiAdvanced Multi--Product Coal Utilization Product Coal Utilization Byproduct Processing PlantByproduct Processing Plant

Advanced Ash Beneficiation Plant Based on Advanced Ash Beneficiation Plant Based on Hydraulic Classification and Froth FlotationHydraulic Classification and Froth Flotation–– Flotation Flotation
Offers High Yield and SelectivityOffers High Yield and SelectivityConsistently Produce Ash with Low Carbon (<2%)Consistently Produce Ash with Low Carbon (<2%)
–– Hydraulic Classification Hydraulic Classification Gives Control of Fineness (>ASTM CGives Control of Fineness (>ASTM C--618)618)Allow for Higher Levels of OPC SubstitutionAllow for Higher Levels of OPC SubstitutionProvides Provides MultiproductMultiproduct capabilitycapability
Advanced MultiAdvanced Multi--Product Coal Utilization Product Coal Utilization Byproduct Processing PlantByproduct Processing Plant

BLOCKBLOCKSANDSAND
PRODUCTPRODUCT
COARSECOARSECARBONCARBONPRODUCTPRODUCT CARBONCARBON
FUELFUELPRODUCTPRODUCT
DAMPDAMPFILLERFILLER
PRODUCTPRODUCT
Fine Ash ClassifierFine Ash ClassifierFILLERFILLER
THICKENERTHICKENER
FILLERFILLERCONDITIONINGCONDITIONING
TANKTANK
DISPERSANTDISPERSANT
FILLERFILLERFILTERFILTER
DRYDRYPRODUCTSPRODUCTS
Generalized Circuit Generalized Circuit
Primary ClassifierPrimary Classifier
Spiral SeparatorSpiral Separator
ThicknerThickner
Froth CellsFroth Cells

Characteristics of Ghent MaterialsCharacteristics of Ghent Materials
Fly Ash InputFly Ash Input–– 5 to 7% LOI5 to 7% LOI–– 31 to 33% +45 µm31 to 33% +45 µm–– 18% 18% --5 µm 5 µm –– 7 day SI ~ 75%7 day SI ~ 75%–– 28 day SI ~ 85%28 day SI ~ 85%
PozzolanPozzolan Output*Output*–– 2% LOI2% LOI–– 20%20%--22% +45 µm22% +45 µm–– 2121--23% 23% --5 µm 5 µm –– 7 day SI ~ 85%7 day SI ~ 85%–– 28 day SI ~ 95%28 day SI ~ 95%
*Assume Primary Classifier is run at *Assume Primary Classifier is run at --200 Mesh200 MeshResulting in 12% Rejection of Ash FeedResulting in 12% Rejection of Ash Feed

Subtask 1.1 Initial Sample Collection and Characterization
Subtask 1.2 Pond Assessment
Subtask 1.3 Bulk Sample Collection and Characterization
Subtask 1.4. Pilot-Scale Evaluations
Subtask 1.5 Product Evaluation
Subtask 1.6 Marketing Assessment & Business Plan
Subtask 1.7 Final Plant Location and Infrastructure
Task 1. Project Definition
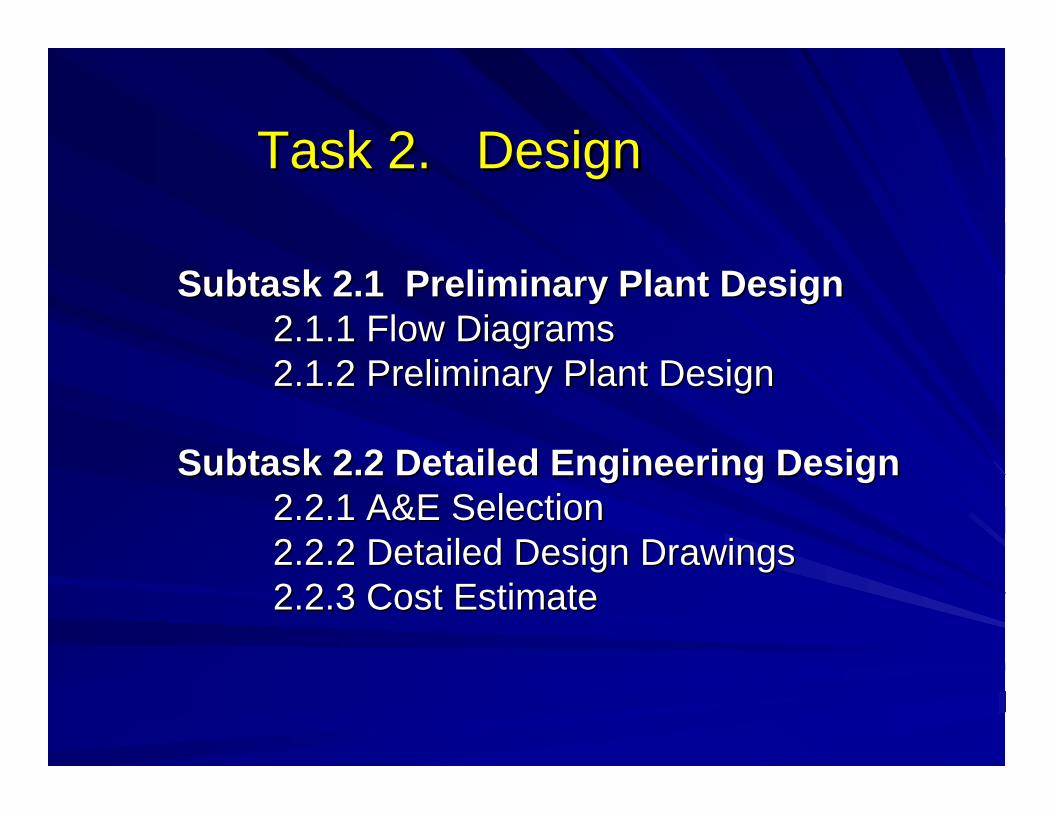
Task 2. DesignTask 2. Design
Subtask 2.1 Preliminary Plant DesignSubtask 2.1 Preliminary Plant Design2.1.1 Flow Diagrams2.1.1 Flow Diagrams2.1.2 Preliminary Plant Design2.1.2 Preliminary Plant Design
Subtask 2.2 Detailed Engineering DesignSubtask 2.2 Detailed Engineering Design2.2.1 A&E Selection2.2.1 A&E Selection2.2.2 Detailed Design Drawings2.2.2 Detailed Design Drawings2.2.3 Cost Estimate2.2.3 Cost Estimate

Task 3. Construction of Processing PlantTask 3. Construction of Processing Plant
Subtask 3.1 Plant ConstructionSubtask 3.1 Plant Construction3.1.1 Selection of Contractor3.1.1 Selection of Contractor3.1.2 Plant Construction3.1.2 Plant Construction
Subtask 3.2 Plant StartSubtask 3.2 Plant Start--Up and ShakeUp and Shake--DownDown3.2.1 Startup Planning3.2.1 Startup Planning3.2.2 Water Balance Verification3.2.2 Water Balance Verification3.2.3 Solids Balance Verification3.2.3 Solids Balance Verification3.2.4 Acceptance Testing3.2.4 Acceptance Testing
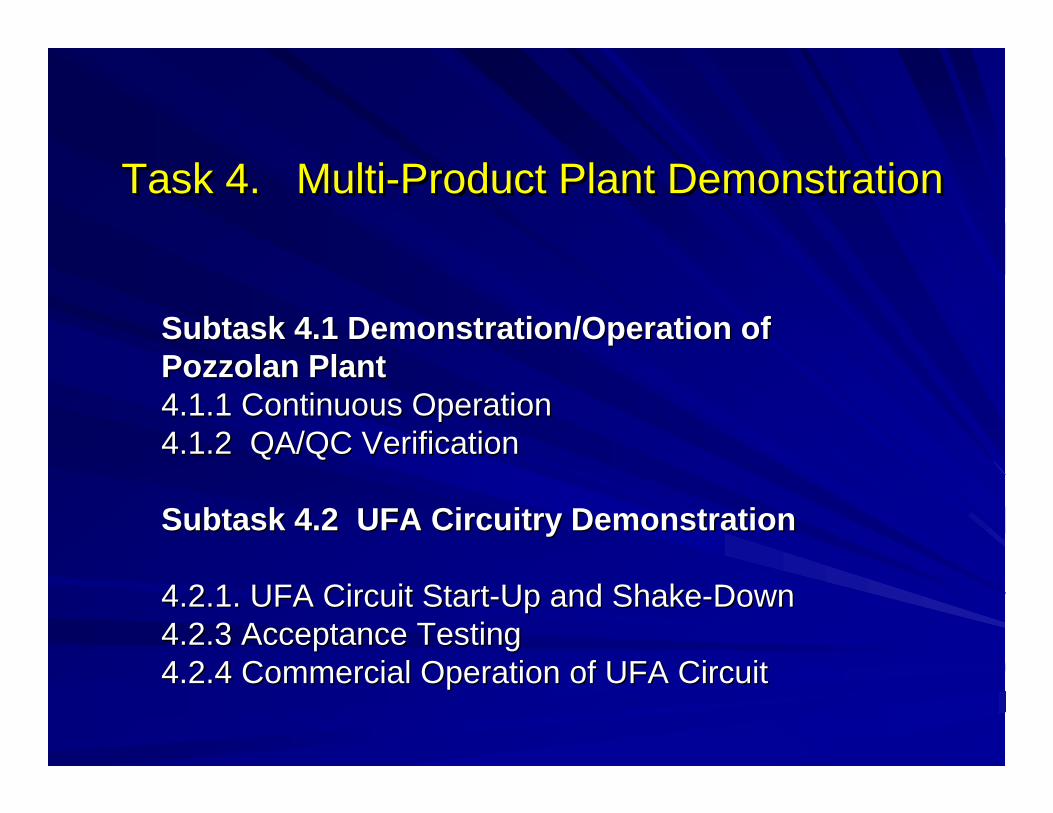
Task 4. Multi-Product Plant DemonstrationTask 4. Multi-Product Plant Demonstration
Subtask 4.1 Demonstration/Operation of Subtask 4.1 Demonstration/Operation of PozzolanPozzolan PlantPlant4.1.1 Continuous Operation4.1.1 Continuous Operation4.1.2 QA/QC Verification4.1.2 QA/QC Verification
Subtask 4.2 UFA Circuitry DemonstrationSubtask 4.2 UFA Circuitry Demonstration
4.2.1. UFA Circuit Start4.2.1. UFA Circuit Start--Up and ShakeUp and Shake--DownDown4.2.3 Acceptance Testing 4.2.3 Acceptance Testing 4.2.4 Commercial Operation of UFA Circuit4.2.4 Commercial Operation of UFA Circuit

Pond LocationPond Location

Sampling of Ponds is Problematic
WKE Coleman
Argo Based Drill

VibracoreVibracore--Hole Location MapHole Location Map
Slurry Input
Pond Effluent
Surface Water

CoresCores

SurfaceSurface--Water BodiesWater Bodies
Photograph taken from the east embankment
Photograph taken from the west embankment

Sample AnalysisSample AnalysisCore DescriptionsCore Descriptions–– 13 vibracores13 vibracores–– Divided into 381 samplesDivided into 381 samples
DryDry--Sieve AnalysisSieve Analysis–– No.100 mesh No.100 mesh
150 µm150 µm–– 762 samples762 samples
Laser particleLaser particle--size analyzersize analyzer–– Mean particleMean particle--sizesize
<100 mesh<100 mesh–– % <5µm; % <10µm% <5µm; % <10µm
Weight and depth of cored holesWeight and depth of cored holes
11.3%11.3%88.7%88.7%PercentPercent
405.3405.323.5123.51184.43184.43SumSum
21.421.44.334.336.666.662020
30.230.21.591.5913.8613.861919
35.835.81.281.2818.2218.221818
30.130.11.331.3315.0315.031717
33.933.91.461.4616.7916.791616
31.431.42.952.9513.8513.851515
37.537.51.791.7916.2016.201414
34.634.61.531.5314.8714.871313
34.034.02.052.0516.1216.121212
37.437.42.252.2514.3514.351111
37.037.01.301.3016.2716.271010
31.031.01.321.3216.4016.4099
11.011.00.310.315.815.8188
Total Depth (ft)Total Depth (ft)>100 mesh (kg)>100 mesh (kg)<100 mesh (kg)<100 mesh (kg)Core #Core #

Stacked Isolith MapsStacked Isolith MapsCreated to spatially Created to spatially demonstrate the demonstrate the distribution of analytical distribution of analytical datadata
Isolith maps based on Isolith maps based on averaged data for each averaged data for each intervalinterval
Core data divided into Core data divided into eight, 5eight, 5--foot (1.5foot (1.5--m) m) intervalsintervals

IsolithIsolith MapMap(% of ash less than 10 (% of ash less than 10 µµm)m)
<20
20-22
22-24
24-26
26-28
28-30
30-32
32-34
36-38
%

35-40 ft
30-35 ft
25-30 ft
20-25 ft
15-20 ft
10-15 ft
5-10 ft
0-5 ft
0.0 10.0 20.0 30.0 40.0
Weight (%)
Dep
th (f
eet)
>100 Mesh
0-55-1010-1515-2020-2525-3030-3535-40
Average weight percent Average weight percent data (>100 mesh)data (>100 mesh)
Overall coarseningOverall coarsening--upward upward and laterally fining ashand laterally fining ash

35-40 ft
30-35 ft
25-30 ft
20-25 ft
15-20 ft
10-15 ft
5-10 ft
0-5 ftAverage percent of Average percent of unburned carbon unburned carbon (>100 mesh)(>100 mesh)
Increased unburned Increased unburned carbon concentrations in carbon concentrations in the distal end of the pondthe distal end of the pond
0.0% 10.0% 20.0% 30.0% 40.0%
Core-08Core-09Core-10Core-11Core-12Core-13Core-14Core-15Core-16Core-17Core-18Core-19Core-20
-100+100
LOI

Resource EstimatesResource Estimates
7,020,000209,080,0005,227,000Pond Estimate
1,060,00031,480,000787,000Drilled Estimate
(total)(total)(cu ft)(cu ft)(sq ft)(sq ft)
tons ashtons ashVolumeVolumeAreaAreaPolygon MethodPolygon Method
1,544,000260,0001,824,0001,052,000Pond
Estimate
232,00039,000275,000158,000Drilled
Estimate
Coarse CCoarse CFine CFine C<10<10µµm)m)<5<5µµm)m)
tonstonstonstonstonstonstonstons

Flotation of Ghent Materials Flotation of Ghent Materials
Ghent Pond Ash -100 Mesh
05
101520253035404550
0 20 40 60 80 100
Cumulative Wt %
Cum
ulat
ive
Frot
hG
rade
(% L
OI)
00.5
11.5
22.5
33.5
4
Cum
ulat
ive
Taili
ngs
Gra
de (%
LO
I)
FrothTails
Release Analysis CompleteRelease Analysis Complete

Compressive Strength of Fly Ash Mortar Cubesat 20% Cement Replacement
Curing Time (days)
0 20 40 60 80 100 120
Unc
onfin
ed C
ompr
essi
ve S
treng
th (P
SI)
0
2000
4000
6000
8000
10000
ControlSP 12/18/2003SP 1/27/2004F Fly AshCI Fly AshProduct Testing of UFAProduct Testing of UFA
ASTM ASTM ––C311 Mortar TestsC311 Mortar Tests

Pilot Plant Operation Pilot Plant Operation Coleman Project*Coleman Project*
First Run of Pilot Plant was SuccessfulFirst Run of Pilot Plant was Successful–– Made Required Slate of ProductsMade Required Slate of Products–– Demonstrated OperabilityDemonstrated Operability
Uncovered Weaknesses in DesignUncovered Weaknesses in Design–– Improve Feed SystemImprove Feed System–– Improve Valves and Sampling PortsImprove Valves and Sampling Ports–– Add Continuous Monitor to Classifier FeedAdd Continuous Monitor to Classifier Feed
Operational Reliability Function of Circuit Operational Reliability Function of Circuit ComplexityComplexity–– If it can break, it willIf it can break, it will
*Similar to Coarse Portion of Circuit for Ghent

Flotation Unit Primary Classifier
Spiral Concentrator
38 KVA Power Unit

Pilot Flotation Cells 6x4


Our Priorities for the Near TermOur Priorities for the Near Term
Complete Construction of Field Test Unit Complete Construction of Field Test Unit –– Hydraulic ClassifierHydraulic Classifier–– Circuit ConfigurationCircuit Configuration
Conduct Field Tests Conduct Field Tests –– Examine Coarse CarbonExamine Coarse Carbon–– Test Flotation CharacteristicsTest Flotation Characteristics–– Test ClassifierTest Classifier–– Generate Large Sample (i.e. tons) of Generate Large Sample (i.e. tons) of PozzolanPozzolan for Testingfor Testing
Make Initial Decision about CircuitMake Initial Decision about Circuit

Thanks!Thanks!
Jeff JoyceJeff Joyceand the rest of the folks at the and the rest of the folks at the
Ghent Power StationGhent Power Station

DISCLAIMER
This presentation was prepared as an account of work sponsored by an agency of the United States Government. Neither the United States Government nor any agency thereof, nor any employees, makes any warranty, expressed or implied, or assumes any legal liability or responsibility for the accuracy, completeness, or usefulness of any information, apparatus, product, or process disclosed, or represents that its use would not infringe privately owned rights. Reference herein to any specific commercial product, process, or service by trade name, trademark, manufacturer, or otherwise does not necessarily constitute or imply its endorsement, recommendation, or favoring by the United States Government or any agency thereof. The views and opinions of the authors expressed herein do not necessarily state or reflect that of those of the United States Government or any agency thereof.