Evaluation of the Role of Routine Laboratory Biomarkers in ...
12
ORIGINAL RESEARCH ARTICLE Evaluation of the Role of Routine Laboratory Biomarkers in COVID-19 Patients: Perspective from a Tertiary Care Hospital in India Barnali Das 1 • Seema Y. Bhatia 1 • Poonam M. Pal 1 Received: 22 August 2020 / Accepted: 17 February 2021 / Published online: 23 April 2021 Ó Association of Clinical Biochemists of India 2021 Abstract To evaluate the role of routine laboratory biomarkers like C Reactive Protein (CRP), Lactate Dehy- drogenase (LDH), Interleukin 6 (IL6), Ferritin, Creatinine, Procalcitonin (PCT), Aspartate aminotransferase (AST), Alanine aminotransferase (ALT), Serum Albumin, Total Bilirubin (T Bil), High Sensitive Troponin I (hs troponin I), N Terminal-pro B-type Natriuretic Peptide (NT proBNP), Blood Urea Nitrogen (BUN) and Blood Gases in COVID 19 patients who are admitted with SARS CoV-2 positive test results by real-time reverse transcriptase polymerase chain reaction (rRT PCR) in Kokilaben Dhirubhai Ambani Hospital & Medical Research Institute, Mumbai, India. 100 individuals detected with COVID-19 belonging to the age group 12–83 years (median age 62 years) within the period of 1st March 2020 to 10th July 2020 were studied. The case group consisted of 72 males and 28 females. 40 healthy adults without any history or clinical evidence suggestive of COVID-19 and without any comorbidities, like diabetes, hypertension chronic lung disease, cardiac disease, cancer, and immune-compromised individuals were considered as a control group for the study. Routine laboratory findings of these 100 patients were used to evaluate the abnormal- ities found in COVID-19 patients. Statistical analysis was carried out on the data after determining whether the data had a normal/log-normal distribution and their significance was determined by calculating the p-value. The percentage of patients showing a decrease or increase from the normal value was calculated. Trend analysis was carried out for the 100 patients considered in the case group. Among them, 6 patients were used as representatives to show the trend in these biomarkers during the course of hospital stay. These 5 severe cases consisted of 2 adult males, 2 adult females, and 1 adolescent girl. This selection is to demonstrate the representation of COVID-19 infection in adult males and females and pediatric multisystem inflammatory syndrome associated with COVID-19 in the younger age group. One mild case (adult male) was also selected in the case study. We found a significant increase in mean values of AST, ALT, Total Billirubin, Creatinine, CRP, PCT, LDH, IL6, Ferritin, Lactate, hsTroponin I, NT Pro BNP and decrease in mean values of Albumin, SO2, and PO2 in COVID 19 cases than control. We applied Receiver Operating Curve (ROC) curve to discriminate case population more pre- cisely than the control population. Therefore, Routine laboratory biomarkers appear to play a significant role in COVID-19 patients. Keywords SARS-CoV-2 Á COVID 19 Á ARDS Á Laboratory medicine Á Biomarkers Introduction & Background Coronavirus disease 2019 (COVID-19), is caused by a virus that belongs to the family of Coronaviridae [1]. It is a form of respiratory and systemic zoonosis that was origi- nated in Wuhan (China) and is now a pandemic that has spread worldwide [1, 2]. The virus is a novel enveloped RNA beta-coronavirus known as severe acute respiratory syndrome coronavirus 2 (SARS-CoV-2) [3, 4]. The SARS- CoV-2 causing the coronavirus disease 2019 (COVID-19) has a large clinical spread that included patients with asymptomatic infection, severe viral pneumonia with & Barnali Das [email protected] 1 Department of Biochemistry & Immunology, Kokilaben Dhirubhai Ambani Hospital and Medical Research Institute, Mumbai, Maharashtra, India 123 Ind J Clin Biochem (Oct-Dec 2021) 36(4):473–484 https://doi.org/10.1007/s12291-021-00978-x
Transcript of Evaluation of the Role of Routine Laboratory Biomarkers in ...

ORIGINAL RESEARCH ARTICLE
Evaluation of the Role of Routine Laboratory Biomarkersin COVID-19 Patients: Perspective from a Tertiary Care Hospitalin India
Barnali Das1 • Seema Y. Bhatia1 • Poonam M. Pal1
Received: 22 August 2020 / Accepted: 17 February 2021 / Published online: 23 April 2021
� Association of Clinical Biochemists of India 2021
Abstract To evaluate the role of routine laboratory
biomarkers like C Reactive Protein (CRP), Lactate Dehy-
drogenase (LDH), Interleukin 6 (IL6), Ferritin, Creatinine,
Procalcitonin (PCT), Aspartate aminotransferase (AST),
Alanine aminotransferase (ALT), Serum Albumin, Total
Bilirubin (T Bil), High Sensitive Troponin I (hs troponin I),
N Terminal-pro B-type Natriuretic Peptide (NT proBNP),
Blood Urea Nitrogen (BUN) and Blood Gases in COVID
19 patients who are admitted with SARS CoV-2 positive
test results by real-time reverse transcriptase polymerase
chain reaction (rRT PCR) in Kokilaben Dhirubhai Ambani
Hospital & Medical Research Institute, Mumbai, India. 100
individuals detected with COVID-19 belonging to the age
group 12–83 years (median age 62 years) within the period
of 1st March 2020 to 10th July 2020 were studied. The case
group consisted of 72 males and 28 females. 40 healthy
adults without any history or clinical evidence suggestive
of COVID-19 and without any comorbidities, like diabetes,
hypertension chronic lung disease, cardiac disease, cancer,
and immune-compromised individuals were considered as
a control group for the study. Routine laboratory findings
of these 100 patients were used to evaluate the abnormal-
ities found in COVID-19 patients. Statistical analysis was
carried out on the data after determining whether the data
had a normal/log-normal distribution and their significance
was determined by calculating the p-value. The percentage
of patients showing a decrease or increase from the normal
value was calculated. Trend analysis was carried out for the
100 patients considered in the case group. Among them, 6
patients were used as representatives to show the trend in
these biomarkers during the course of hospital stay. These
5 severe cases consisted of 2 adult males, 2 adult females,
and 1 adolescent girl. This selection is to demonstrate the
representation of COVID-19 infection in adult males and
females and pediatric multisystem inflammatory syndrome
associated with COVID-19 in the younger age group. One
mild case (adult male) was also selected in the case study.
We found a significant increase in mean values of AST,
ALT, Total Billirubin, Creatinine, CRP, PCT, LDH, IL6,
Ferritin, Lactate, hsTroponin I, NT Pro BNP and decrease
in mean values of Albumin, SO2, and PO2 in COVID 19
cases than control. We applied Receiver Operating Curve
(ROC) curve to discriminate case population more pre-
cisely than the control population. Therefore, Routine
laboratory biomarkers appear to play a significant role in
COVID-19 patients.
Keywords SARS-CoV-2 � COVID 19 � ARDS �Laboratory medicine � Biomarkers
Introduction & Background
Coronavirus disease 2019 (COVID-19), is caused by a
virus that belongs to the family of Coronaviridae [1]. It is a
form of respiratory and systemic zoonosis that was origi-
nated in Wuhan (China) and is now a pandemic that has
spread worldwide [1, 2]. The virus is a novel enveloped
RNA beta-coronavirus known as severe acute respiratory
syndrome coronavirus 2 (SARS-CoV-2) [3, 4]. The SARS-
CoV-2 causing the coronavirus disease 2019 (COVID-19)
has a large clinical spread that included patients with
asymptomatic infection, severe viral pneumonia with
& Barnali Das
1 Department of Biochemistry & Immunology, Kokilaben
Dhirubhai Ambani Hospital and Medical Research Institute,
Mumbai, Maharashtra, India
123
Ind J Clin Biochem (Oct-Dec 2021) 36(4):473–484
https://doi.org/10.1007/s12291-021-00978-x

respiratory tract failure, or mild upper respiratory tract
infection [2]. COVID-19 has been reported as a public
health concern as per World Health Organization (WHO)
[3]. According to the World Health Organization (WHO),
there have been 140,322,903 confirmed cases, with
3,003,794 deaths, as of 18th April, 2021 [5].
The virus mainly transmits through respiratory droplets,
direct human to human contact, or by touching the nose,
eyes, or mouth after touching a contaminated surface
[3, 6, 7]. As per Centre of Disease Control (CDC), people
with COVID-19 have had a wide range of symptoms
reported—ranging from mild to severe illness. The incu-
bation period for the same is 2–14 days after exposure to
the virus.
Further, as per CDC, major symptoms of COVID-19
include fever, chills, cough, tiredness, muscle or body
aches and pains, and sore throat. In some other cases,
congestion or runny nose, nausea or vomiting, diarrhea,
skin manifestations (rash) headache, and loss of taste or
smell are also observed [3]. Other serious symptoms or
visible emergency warning signs are difficulty in breathing
or shortness of breath, persistent chest pain or pressure in
the chest, new confusion, inability to wake or stay awake,
bluish marks on lips or face, and dyspnea. [2, 6, 8, 9].
ARDS of unknown origin, fever, and fatigue were the most
common symptoms seen in patients initially in December
2019 in Wuhan [9].
The SARS-CoV-2 has an effect on the respiratory sys-
tem leading to the rapid development of pneumonia
[2, 6, 8]. It also leads to acute respiratory distress syndrome
(ARDS) and multi-organ failure in case of severe infection
which might lead to death. It is seen that 10–15% of the
COVID-19 cases may lead to severe interstitial pneumonia
that may progress to ARDS [10]. The risk of severity and
mortality has been observed to be much higher in older
people and in patients with underlying comorbidities, such
as hypertension, diabetes, cardiac disease, chronic lung
disease, cancer, and immune-compromised individuals
[2, 11–13].
Unlike the previous coronavirus diseases, i.e. Middle
East respiratory syndrome (MERS) and Severe acute res-
piratory syndrome (SARS), COVID-19 has relatively low
pathogenicity and longer incubation. However, this SARS
CoV-2 virus is highly contagious [1].
In case of children, very few showed severe symptoms.
It was observed that children were mostly asymptomatic
COVID-19 positive [14]. However, there have been few
reports involving children and adolescents in intensive care
units having Kawasaki disease-like symptoms, with case
reports of hyper-inflammatory syndrome, multi-organ
failure, and shock [15–17]. This syndrome is named
Pediatric Inflammatory Multisystem Syndrome temporally
associated with SARS-COV-2 (PIMS-TS). PIMS-TS
appear to affect older children, gastrointestinal symptoms
(particularly abdominal pain) predominate and there
appears to be a greater chance of damage to the heart and
kidneys [15–17].
The critical role of laboratory medicine in this pandemic
extends far more than the etiological diagnosis of COVID-
19. In spite of the broadly defined clinical characteristics of
COVID-19, we still lack the understanding of the abnor-
malities in the laboratory findings in COVID-19 patients.
Since laboratory medicine plays an important role in the
early detection, diagnosis, prognosis as well as manage-
ment of the disease we can use this tool for a better
understanding of this novel coronavirus disease [18]. Also,
the lack of specific treatment towards this disease [6], early
diagnosis becomes a very important factor. Biochemical
monitoring of COVID-19 patients through testing is critical
for assessing disease severity and progression, as well as
monitoring of therapeutic intervention [1]. In addition to
more common laboratory tests like Liver Function Test
(LFT), Kidney Function Test (KFT), Blood Gas, etc.,
evidence suggests that patients with severe COVID-19
could be at risk of cytokine storm syndrome
[1–3, 5–8, 10–12]. Cytokine tests, particularly IL-6, should
be used to assess patients exhibiting severe illness and
those suspected of hyper-inflammation [10, 18, 19]. Such
patients with features of systemic hyper-inflammation are
categorized display macrophage activation syndrome
(MAS) or cytokine storm [18].
Few studies have been published globally to investigate
the role of biochemical markers & immunoassay markers
in COVID 19 patients [1–3, 5–7, 10].
The essential role of Biochemistry, Immunology, and
routine pathology laboratory is well known in the modern
healthcare system.
These Laboratory biomarkers play an essential role in
the patient admission protocol, assessment of staging of
disease according to severity, prognostication, patient
monitoring, and therapeutic guide [18–21].
In this study, we have investigated the routine bio-
chemistry and immunology laboratory findings of the
patients infected with SARS-CoV-2. The laboratory bio-
chemical parameters considered include Creatinine, Albu-
min, Interleukin-6, Ferritin, Aspartate aminotransferase
(AST), Alanine aminotransferase (ALT), Lactate dehy-
drogenase (LDH), C-reactive protein (CRP), hs Troponin I,
Total Bilirubin, Blood Urea Nitrogen (BUN), NT-proBNP,
Procalcitonin (PCT) and Blood gas levels. We have anal-
ysed the above biomarkers with an aim to determine the
significant trend analysis shown by COVID-19 positive
patients in their blood reports hoping for better identifica-
tion and monitoring of the disease.
474 Ind J Clin Biochem (Oct-Dec 2021) 36(4):473–484
123

Materials and Methods
We have carried out a retrospective study involving
COVID-19 patients admitted to Kokilaben Dhirubhai
Ambani Hospital & Medical Research Center, Mumbai. A
total of 100 patients with confirmed COVID-19 disease
(case group) belonging to the age group of 12–83 years
(median age 62 years) within the period of 1st March 2020
to 10th July 2020 was considered for the study. 40 healthy
adults without any history and clinical evidence suggestive
of COVID-19 and without any comorbidities, like diabetes,
hypertension chronic lung disease, cardiac disease, cancer,
and immuno-compromised individuals were considered as
a control group for the study. The case group consists of 72
males with an age range of 29–85 years (median age
63 years) and 28 females with an age range of 12–85 years
(median age of 56 years). There are two adolescent girls
included in the case group. These patients belonging to the
case group were confirmed positive for SARS CoV-2 by
collecting nasopharyngeal swab specimens and subjecting
them to real-time reverse transcriptase polymerase chain
reaction (rRT-PCR) for SARS-CoV2 virus. Among the 100
patients that belong to the case group, 20 patients (median
age 57 years) were found to have mild COVID-19 infec-
tion. This mild COVID-19 patient group consisted of 10
males with an age range of 38–81 years (median age
57 years) and 10 females with an age range of 42–85 years
(median age 57 years).
We have performed a trend analysis of 100 patients
(case group) for disease monitoring purpose, from which
we’ll here refer severe cases of 2 adult males, 2 adult
females, and 1 adolescent girl as representative example to
show the laboratory biomarker trend analysis in COVID-19
patients admitted in the Intensive Care Unit with a probable
diagnosis of COVID-19 with ARDS and cytokine storm.
One mild case (adult male) was also selected in the case
study.
Laboratory parameters tested during the course of
admission and treatment for COVID-19 were displayed
individually to determine the change in their levels (day-
wise).
The data for laboratory biomarkers considered here were
collected from the routine blood test carried out from the
COVID-19 patients sample on admission. IL-6, PCT, NT
Pro BNP was analysed on Roche COBAS e411 (Roche
Diagnostics, Basel, Switzerland). CRP, AST, ALT, GGT,
Total Bilirubin, Albumin, LDH, Creatinine, BUN were
measured using Roche COBAS 6000 (Roche Diagnostics,
Basel, Switzerland). Ferritin and hsTroponin I was mea-
sured using either ARCHITECT i1000sr or ARCHITECT
i2000sr (Abbott Diagnostics, Abbott Park, IL, USA). Blood
gas levels were estimated using RAPID LAB 1265 System
(Siemens Healthcare Private Limited, India).
Statistical Analysis
The data were analyzed using Minitab (Minitab Inc, PA)
and Prism (Graph pad Software, San Diego, CA) statistical
software package. Before carrying out the statistical anal-
ysis, the normal and log-normal distribution of the data was
confirmed. To determine the normal distribution of the
data, a histogram with a fit curve was used and a proba-
bility plot was also used for the confirmation of the same.
The significance of the data to differentiate case from
control group having normal / log-normal distribution was
determined by performing a t-test. For the data to be sig-
nificant the p-value has to be\ 0.05. Receiver Operating
Curve (ROC) analysis was carried out for all the parame-
ters considered in the study to discriminate case population
more precisely than the control population. The patient
data was then used to calculate the percentage of patients
showing an increase or decrease in the parameters. The
study of the trend analysis shown by the individual
parameter during the course of the hospital stay was carried
out by plotting a smooth curve scatter plot for routine
laboratory parameters in the patients of COVID-19 disease
considered in the case group.
Results
The data obtained from the laboratory findings were
checked for its distribution by plotting a histogram with a
fit curve. For example, Fig. 1 shows Ferritin values do not
follow a normal distribution in the histogram. Therefore, to
confirm, we plotted the probability plot to confirm. The
probability plot indicates that the data considered for the
study lies within 95% confidence interval of log-normal fit.
Fig. 1 Histogram of Ferritin
Ind J Clin Biochem (Oct-Dec 2021) 36(4):473–484 475
123

All the parameters were checked for the probability dis-
tribution. The histogram with a fit curve (Fig. 1) and
probability plot (Fig. 2) of Ferritin is shown below as
representative.
T-test was carried out and p-value was calculated to
know if the data is significant to differentiate between the
case and control for further statistical analysis.
After calculating the p-value, the abnormalities shown
in the blood reports of COVID-19 positive patients were
studied by calculating the percentage of patients showing
an increase or decrease in a particular analyte.
Receiver Operating Curve (ROC) analysis was carried
out for all the parameters. The area under the curve for
Ferritin was found to be 0.9121 with 95% confidence
interval (CI) and a p-value\ 0.0001. The area under the
curve for IL-6 was found to be 1.0 with 95% confidence
interval (CI) and a p-value\ 0.0001. The area under the
curve for PO2 was found to be 0.7866 with 95% confidence
interval (CI) and a p-value\ 0.0001. The area under the
curve for SO2 was found to be 0.7170 with 95% confidence
interval (CI) and a p-value\ 0.0001. The area under the
curve for CRP was found to be 0.9639 with 95% confi-
dence interval (CI) and a p-value\ 0.0001. The area under
the curve for PCT was found to be 0.7911 with 95%
confidence interval (CI) and a p-value\ 0.0001. The area
under the curve for hs Troponin I was found to be 0.8543
with 95% confidence interval (CI) and a p-value\ 0.0001.
The area under the curve for NT proBNP was found to be
0.9815 with 95% confidence interval (CI) and a p-
value\ 0.0001. The area under the curve for LDH was
found to be 0.9813 with 95% confidence interval (CI) and a
p-value\ 0.0001. The area under the curve for Creatinine
was found to be 0.8536 with 95% confidence interval (CI)
and a p-value\ 0.0001. The area under the curve for BUN
was found to be 0.7170 with 95% confidence interval (CI)
and a p-value\ 0.0001. The area under the curve for AST
was found to be 0.8845 with 95% confidence interval (CI)
and a p-value\ 0.0001. The area under the curve for ALT
was found to be 0.8112 with 95% confidence interval (CI)
and a p-value\ 0.0001. The ROC curve of Ferritin is
represented here as a reference (Fig. 3a).
Additionally ROC analysis was also carried out on the
mild positive group (20 patients). The area under the curve
for Ferritin was found to 0.7125 with 95% confidence
interval (CI) and a p-value\ 0.0001. The area under the
curve for IL-6 was found to be 1.0 with 95% confidence
interval (CI) and a p-value\ 0.0001. The area under the
curve for PO2 was found to be 0.687 with 95% confidence
interval (CI) and a p-value\ 0.0001. The area under the
curve for SO2 was found to be 0.6625 with 95% confidence
interval (CI) and a p-value\ 0.0001. The area under the
curve for CRP was found to be 0.9683 with 95% confi-
dence interval (CI) and a p-value\ 0.0001. The area under
the curve for PCT was found to be 0.7156 with 95%
confidence interval (CI) and a p-value\ 0.0001. The area
under the curve for hs Troponin I was found to be 0.7063
with 95% confidence interval (CI) and a p-value\ 0.0001.
The area under the curve for NT proBNP was found to be
1.0 with 95% confidence interval (CI) and a p-value\0.0001. The area under the curve for LDH was found to be
1.0 with 95% confidence interval (CI) and a p-value\
Fig. 2 Probability plot of Ferritin showing fit to Log-Normal
distribution
0 50 100
150
0
50
100
150Sensitivity%Identity%
100% - Specificity%
Sens
itivi
ty%
0 20 40 60 80 100
0
50
100
150Sensitivity%Identity%
100% - Specificity%
Sens
itivi
ty%
(a)
(b)
Fig. 3 a Receiver Operating Curve (ROC) curve for Ferritin.
b Receiver Operating Curve (ROC) curve for IL-6. The Area under
curve (AUC) depicts the following: AUC 0.90–1: excellent accuracy,
0.80–0.90: good accuracy, 0.70–0.80: fairly accurate, 0.60–0.70: poor
accuracy; 0.50–0.60: failure
476 Ind J Clin Biochem (Oct-Dec 2021) 36(4):473–484
123

0.0001. The area under the curve for Creatinine was found
to be 0.7195 with 95% confidence interval (CI) and a p-
value\ 0.0001. The area under the curve for BUN was
found to be 0.5204 with 95% confidence interval (CI) and a
p-value\ 0.0001. The area under the curve for AST was
found to be 0.8250 with 95% confidence interval (CI) and a
p-value\ 0.0001. The area under the curve for ALT was
found to be 0.7616 with 95% confidence interval (CI) and a
p-value\ 0.0001. The ROC curve of IL-6 in the mild
COVID-19 positive patient group is represented here as a
reference (Fig. 3b).
We analyzed the retrospective routine laboratory data
from 1st March 2020 to 10th July 2020 of the COVID 19
cases admitted in Kokilaben Dhirubhai Ambani Hospital &
Medical Research Institute.
Amongst the patients belonging to the case group, 73%
of the patients showed elevated IL-6 levels, 56% of
patients show an increase in Ferritin levels, 79% of the
patients show an elevation in CRP levels, 80% of the
patients show elevated levels of D-dimer, 30% show ele-
vation in PCT levels, 25% of the patients show an elevation
in hs Troponin I and 26% of the patients show an elevation
in NT proBNP levels, 42% of patients show elevated LDH
levels, 31% of patients show elevated creatinine levels,
36% of the patients show elevated BUN levels, 40% of
patients show elevated AST levels and 23% of patients
show elevated ALT levels. On the other hand, 58% show a
decrease in PO2 levels, 52% show a decrease in SO2 levels
and 56% of patients show decreased levels of Albumin.
Table 1 summarizes the percentage of patients show-
ing abnormal results of the parameters considered in the
study population.
When biomarkers were compared with hematological
markers, lymphopenia was observed in 70% of the patients,
and neutrophilia was observed in 61% of the patients. Also,
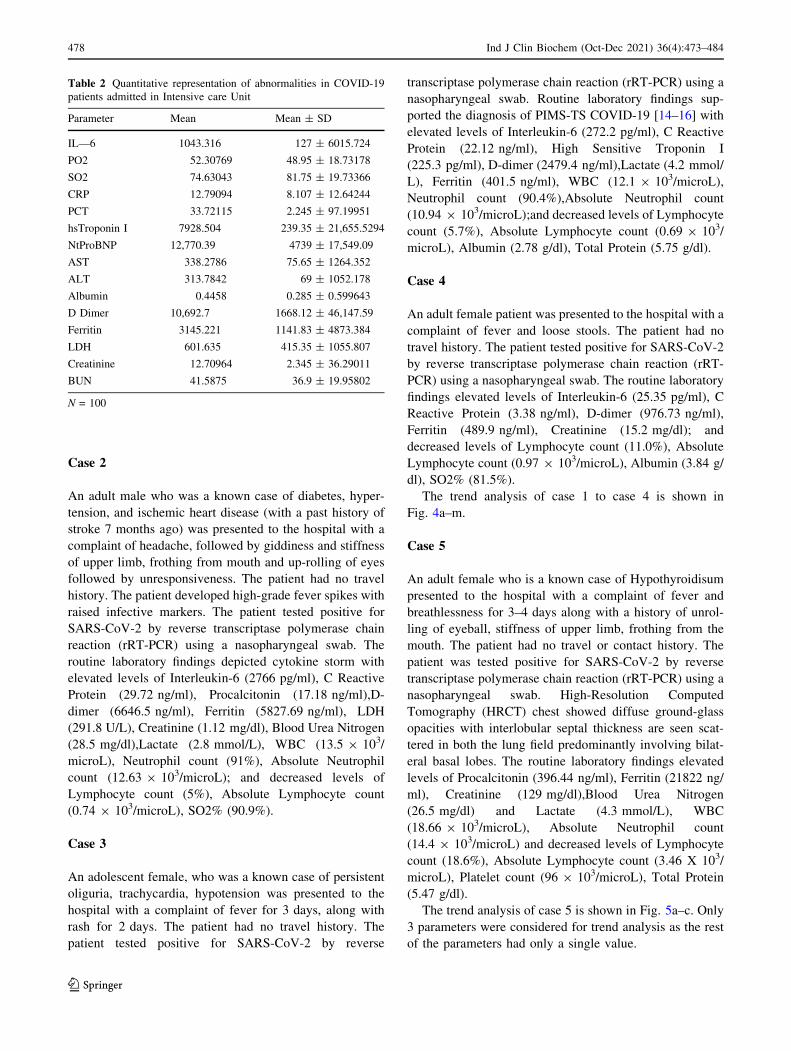
a quantitative estimation of the abnormalities seen in
COVID-19 case group was calculated. Table 2 shows the
abnormalities in the parameters considered in COVID-19
case group.
To explain the role of routine laboratory parameters in
disease monitoring, we have performed a trend analysis of
100 patients amongst which we have selected two adult
males, two adult females, and one adolescent girl as rep-
resentative examples to show the laboratory biomarker
trend analysis for monitoring in COVID 19 patients (severe
infection). This selection is to demonstrate the represen-
tation of COVID-19 infection in adult male and female and
pediatric multisystem inflammatory syndrome associated
with COVID-19 in the younger age group. Additionally, a
mild COVID-19 positive case (adult male) was also
selected.
In this assessment, the daily laboratory finding of the
patients was used to plot a smooth curve scatter plot and
see the fluctuation in the parameters during the course of
COVID-19 treatment. We are showing the figures of trend
analysis of the following selected biomarkers as represen-
tative parameters: CRP, Ferritin, LDH, IL6, PCT, hs Tro-
ponin I, NT Pro BNP, SO%, Lactate, Creatinine, BUN,
ALT and AST.
Case 1
An adult male, who was a known case of diabetes was
presented to the hospital with a complaint of fever for
2 days, along with breathing difficulty and generalized
weakness for 5 days. The patient had a12 days travel his-
tory. The patient tested positive for SARS-CoV-2 by
reverse transcriptase polymerase chain reaction (rRT-PCR)
using a nasopharyngeal swab. Chest X-ray showed bilateral
lung infiltrates. Routine laboratory findings supported the
cytokine storm with elevated levels of Interleukin-6
(204 pg/ml), C Reactive Protein (20.77 ng/ml), Procalci-
tonin (1.808 ng/ml), High Sensitive Troponin I (49.29 pg/
ml), NT proBNP (232.2 pg/ml), D-dimer (1364.47 ng/ml),
Ferritin (718.7 ng/ml), LDH (921.3 U/L), Blood Urea
Nitrogen (31.2 mg/dl), AST (223.3 U/L), ALT (194.5
U/L), Lactate (3.5 mmol/L), WBC (15.5 X 10³/microL),
Neutrophil count (94.2%), Absolute Neutrophil count
(14.7 9 103/microL);and decreased levels of Albumin
(2.6 g/dl), Total Protein (5.8 g/dl),Lymphocyte count
(3.9%), and Absolute Lymphocyte count (0.6 X 10³/mi-
croL), SO2% (78.4%).
Table 1 Percentage of patients showing Increase (:) /Decrease (;) in
the biomarkers:
Parameters Percentage of abnormal results in
total no. of patients (case group)
IL—6 73 :
PO2 58 ;
SO2 52 ;
CRP 79 :
PCT 30 :
hsTroponin I 25 :
NtProBNP 26 :
AST 40 :
ALT 23 :
Albumin 56 ;
D-dimer 80:
Ferritin 56 :
LDH 42 :
Creatinine 31 :
BUN 36 :
N = 100
Ind J Clin Biochem (Oct-Dec 2021) 36(4):473–484 477
123
Case 2
An adult male who was a known case of diabetes, hyper-
tension, and ischemic heart disease (with a past history of
stroke 7 months ago) was presented to the hospital with a
complaint of headache, followed by giddiness and stiffness
of upper limb, frothing from mouth and up-rolling of eyes
followed by unresponsiveness. The patient had no travel
history. The patient developed high-grade fever spikes with
raised infective markers. The patient tested positive for
SARS-CoV-2 by reverse transcriptase polymerase chain
reaction (rRT-PCR) using a nasopharyngeal swab. The
routine laboratory findings depicted cytokine storm with
elevated levels of Interleukin-6 (2766 pg/ml), C Reactive
Protein (29.72 ng/ml), Procalcitonin (17.18 ng/ml),D-
dimer (6646.5 ng/ml), Ferritin (5827.69 ng/ml), LDH
(291.8 U/L), Creatinine (1.12 mg/dl), Blood Urea Nitrogen
(28.5 mg/dl),Lactate (2.8 mmol/L), WBC (13.5 9 103/
microL), Neutrophil count (91%), Absolute Neutrophil
count (12.63 9 103/microL); and decreased levels of
Lymphocyte count (5%), Absolute Lymphocyte count
(0.74 9 103/microL), SO2% (90.9%).
Case 3
An adolescent female, who was a known case of persistent
oliguria, trachycardia, hypotension was presented to the
hospital with a complaint of fever for 3 days, along with
rash for 2 days. The patient had no travel history. The
patient tested positive for SARS-CoV-2 by reverse
transcriptase polymerase chain reaction (rRT-PCR) using a
nasopharyngeal swab. Routine laboratory findings sup-
ported the diagnosis of PIMS-TS COVID-19 [14–16] with
elevated levels of Interleukin-6 (272.2 pg/ml), C Reactive
Protein (22.12 ng/ml), High Sensitive Troponin I
(225.3 pg/ml), D-dimer (2479.4 ng/ml),Lactate (4.2 mmol/
L), Ferritin (401.5 ng/ml), WBC (12.1 9 103/microL),
Neutrophil count (90.4%),Absolute Neutrophil count
(10.94 9 103/microL);and decreased levels of Lymphocyte
count (5.7%), Absolute Lymphocyte count (0.69 9 103/
microL), Albumin (2.78 g/dl), Total Protein (5.75 g/dl).
Case 4
An adult female patient was presented to the hospital with a
complaint of fever and loose stools. The patient had no
travel history. The patient tested positive for SARS-CoV-2
by reverse transcriptase polymerase chain reaction (rRT-
PCR) using a nasopharyngeal swab. The routine laboratory
findings elevated levels of Interleukin-6 (25.35 pg/ml), C
Reactive Protein (3.38 ng/ml), D-dimer (976.73 ng/ml),
Ferritin (489.9 ng/ml), Creatinine (15.2 mg/dl); and
decreased levels of Lymphocyte count (11.0%), Absolute
Lymphocyte count (0.97 9 103/microL), Albumin (3.84 g/
dl), SO2% (81.5%).
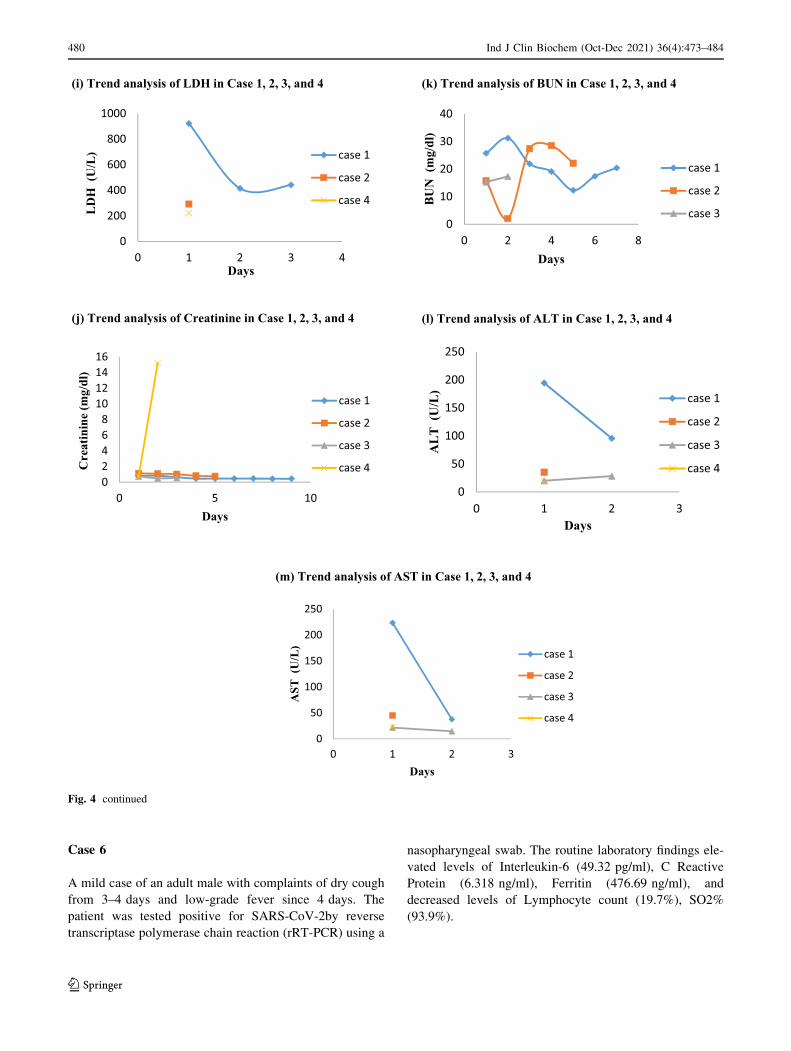
The trend analysis of case 1 to case 4 is shown in
Fig. 4a–m.
Case 5
An adult female who is a known case of Hypothyroidisum
presented to the hospital with a complaint of fever and
breathlessness for 3–4 days along with a history of unrol-
ling of eyeball, stiffness of upper limb, frothing from the
mouth. The patient had no travel or contact history. The
patient was tested positive for SARS-CoV-2 by reverse
transcriptase polymerase chain reaction (rRT-PCR) using a
nasopharyngeal swab. High-Resolution Computed
Tomography (HRCT) chest showed diffuse ground-glass
opacities with interlobular septal thickness are seen scat-
tered in both the lung field predominantly involving bilat-
eral basal lobes. The routine laboratory findings elevated
levels of Procalcitonin (396.44 ng/ml), Ferritin (21822 ng/
ml), Creatinine (129 mg/dl),Blood Urea Nitrogen
(26.5 mg/dl) and Lactate (4.3 mmol/L), WBC
(18.66 9 103/microL), Absolute Neutrophil count
(14.4 9 103/microL) and decreased levels of Lymphocyte
count (18.6%), Absolute Lymphocyte count (3.46 X 10³/
microL), Platelet count (96 9 103/microL), Total Protein
(5.47 g/dl).
The trend analysis of case 5 is shown in Fig. 5a–c. Only
3 parameters were considered for trend analysis as the rest
of the parameters had only a single value.
Table 2 Quantitative representation of abnormalities in COVID-19
patients admitted in Intensive care Unit
Parameter Mean Mean ± SD
IL—6 1043.316 127 ± 6015.724
PO2 52.30769 48.95 ± 18.73178
SO2 74.63043 81.75 ± 19.73366
CRP 12.79094 8.107 ± 12.64244
PCT 33.72115 2.245 ± 97.19951
hsTroponin I 7928.504 239.35 ± 21,655.5294
NtProBNP 12,770.39 4739 ± 17,549.09
AST 338.2786 75.65 ± 1264.352
ALT 313.7842 69 ± 1052.178
Albumin 0.4458 0.285 ± 0.599643
D Dimer 10,692.7 1668.12 ± 46,147.59
Ferritin 3145.221 1141.83 ± 4873.384
LDH 601.635 415.35 ± 1055.807
Creatinine 12.70964 2.345 ± 36.29011
BUN 41.5875 36.9 ± 19.95802
N = 100
478 Ind J Clin Biochem (Oct-Dec 2021) 36(4):473–484
123

(a) Trend analysis of IL-6 in Case 1, 2, 3, and 4
0500
10001500200025003000
0 5 10
IL –
6 (p
g/m
l)
Days
case 1
case 2
case 3
case 4
(b) Trend analysis of SO2 in Case 1, 2, 3, and 4
(c) Trend analysis of Lactate in Case 1, 2, 3, and 4
(d) Trend analysis of CRP in Case 1, 2, 3, and 4
0
20
40
60
80
100
120
0 10 20 30
SO2
( %)
Days
case 1
case 2
case 3
case 4
00.5
11.5
22.5
33.5
44.5
0 10 20 30
Lac
tate
(mm
ol/L
)
Days
case 1
case 2
case 3
case 4
05
101520253035
0 5 10
CR
P (n
g/m
l)
Days
case 1
case 2
case 3
case 4
(e) Trend analysis of PCT in Case 1, 2, 3, and 4
0
5
10
15
20
-1 1 3 5 7
PCT
(ng/
ml)
Days
case 1
case 2
case 3
(f) Trend analysis of hs Troponin I in Case 1, 2, 3, and 4
0
50
100
150
200
250
0 1 2 3 4hs
Trop
onin
I (p
g/m
l)
Days
case 1
case 3
(g) Trend analysis of NT proBNP in Case 1, 2, 3, and 4
0
50
100
150
200
250
0 1 2 3 4
NT
pro
BN
P (p
g/m
l)
Days
c…
(h) Trend analysis of Ferritin in Case 1, 2, 3, and 4
0
2000
4000
6000
8000
0 2 4 6
Ferr
itin
(ng/
ml)
Days
case 1
case 2
case 3
case 4
Fig. 4 Trend analysis of representative biomarkers in Case 1, 2, 3,
and a Trend analysis of IL-6, b Trend analysis of SO2, c Trend
analysis of Lactate, d Trend analysis of CRP, e Trend analysis of
PCT, f Trend analysis of hs Troponin I, g Trend analysis of NT
proBNP, h Trend analysis of Ferritin, i Trend analysis of LDH,
j Trend analysis of Creatinine, k Trend analysis of BUN, l Trend
analysis of ALT, m Trend analysis of AST
Ind J Clin Biochem (Oct-Dec 2021) 36(4):473–484 479
123
Case 6
A mild case of an adult male with complaints of dry cough
from 3–4 days and low-grade fever since 4 days. The
patient was tested positive for SARS-CoV-2by reverse
transcriptase polymerase chain reaction (rRT-PCR) using a
nasopharyngeal swab. The routine laboratory findings ele-
vated levels of Interleukin-6 (49.32 pg/ml), C Reactive
Protein (6.318 ng/ml), Ferritin (476.69 ng/ml), and
decreased levels of Lymphocyte count (19.7%), SO2%
(93.9%).
(i) Trend analysis of LDH in Case 1, 2, 3, and 4
0
200
400
600
800
1000
0 1 2 3 4
LD
H (
U/L
)
Days
case 1
case 2
case 4
(j) Trend analysis of Creatinine in Case 1, 2, 3, and 4
02468
10121416
0 5 10
Cre
atin
ine
(mg/
dl)
Days
case 1
case 2
case 3
case 4
(k) Trend analysis of BUN in Case 1, 2, 3, and 4
0
10
20
30
40
0 2 4 6 8
BU
N (
mg/
dl)
Days
case 1
case 2
case 3
(l) Trend analysis of ALT in Case 1, 2, 3, and 4
0
50
100
150
200
250
0 1 2 3
AL
T (
U/L
)
Days
case 1
case 2
case 3
case 4
(m) Trend analysis of AST in Case 1, 2, 3, and 4
0
50
100
150
200
250
0 1 2 3
AST
(U
/L)
Days
case 1
case 2
case 3
case 4
Fig. 4 continued
480 Ind J Clin Biochem (Oct-Dec 2021) 36(4):473–484
123

Here, we are giving examples of the importance of
biomarker monitoring in admitted patients. For example, if
we consider observing the trend of Interleukin- 6, C
Reactive Protein, Procalcitonin, High Sensitive Troponin I,
NT proBNP, Ferritin, LDH, Blood Urea Nitrogen, AST,
ALT, Albumin, Total Protein, Lactate, SO2 and PO2 of
one critical patient admitted in ICU over the course of
hospital stay, we can see trend analysis of those biomarkers
to chase cytokine storm. Table 3 shows the laboratory
abnormalities observed in the COVID-19 progression.
Discussion
The ongoing pandemic of COVID-19 is characterized by
respiratory illness and diverse systemic clinical presenta-
tions, which in turn are reflected by routine laboratory
abnormalities, based on the severity of disease presentation
[22]. The main laboratory changes encompass an array of
increased inflammatory biomarkers, coagulation parame-
ters, tissue-specific tissue injury indicators (liver, kidney,
cardiac), and derangement of the complete blood count
[13, 22–25]. Based on the severity of the disease, the host
inflammatory response to the virus may lead to a cytokine
storm that can cause multi-organ damage [26]. Biomarkers
of inflammation, cardiac and muscle injury as well as liver
and kidney function and coagulation measures were also
significantly deranged in patients with the critical stage of
COVID-19 [27]. Interleukin 6 (IL-6), ferritin, CRP, PCT,
D-dimer, LDH, etc. are indicators for the severe stage of
disease [27].
In hospitalized patients, there should be close monitor-
ing of biochemistry and immunoassay parameters like
CRP, LFT, IL-6, and serum Ferritin, LDH, KFT, PCT, etc.
as markers for potential progression to the critical stage of
illness and fatality.
The entry of SARS CoV2 into the cell is mediated by
the spike protein through the cell receptors binding, fol-
lowed by the fusion of the membrane [28]. SARS-Cov-2
spike protein binds itself to angiotensin-converting enzyme
2 (ACE2) receptor. The host cell consists of type 2 trans-
membrane serine protease (TMPRSS2) that promotes viral
uptake by cleaving ACE2 and activates the SARS-CoV-2 S
protein. This process mediates the entry of coronavirus into
alveolar epithelial type II pneumocytes. Alveolar epithelial
type II cells show the expression of ACE2 and TMPRSS2.
Multiplication of viral copy occurs inside the host cells.
The infected cells and alveolar macrophage release
inflammatory signal. Pulmonary edema with hyaline
membrane formation leads to ARDS (acute respiratory
distress syndrome) [29]. The above mechanism is the
pathophysiology behind the laboratory biomarkers in
COVID-19 patients. Once the virus enters the human body
through droplets or direct contact, mild symptoms start
developing in most of the patients. There are few asymp-
tomatic patients. Few patients also show severe symptoms
that include ARDS, multiple organ failure, pneumonia, or
pulmonary edema. Due to the challenge of no specific
treatment being available, it has become even more
important to understand the disease and diagnose it at the
earliest [6].
(a) Trend analysis of BUN in Case 5
(b) Trend analysis of ALT in Case 5
0
5
10
15
20
25
30
0 1 2 3
BU
N (m
g/dl
)
Days
case 5
(c) Trend analysis of AST in Case 5
0100200300400500600700
0 1 2 3
ALT
(U
/L)
Days
case 5
0200400600800
10001200140016001800
0 1 2 3
AST
(U
/L)
Days
case 5
Fig. 5 Trend analysis of Biomarkers in Case 5. a Trend analysis of
BUN in Case 5, b Trend analysis of ALT in Case 5, c Trend analysis
of AST in Case 5
Ind J Clin Biochem (Oct-Dec 2021) 36(4):473–484 481
123

In this study, we have focused on the laboratory finding
in COVID-19 patients with an aim, for a better under-
standing of the novel coronavirus disease. We have eval-
uated various biomarkers that include inflammatory
markers, pulmonary, kidney, liver, cardiac, and tissue
injury markers in this study. The biomarkers are correlated
with hematological derangement of markers. One of the
important biomarker considered in this study is Interleukin-
6 (IL-6). IL-6 is a pleotropic marker that plays an important
role to integrate defense against infection [30], which is
seen to elevate in COVID-19 patients. Studies have shown
that IL-6 which is a pro-inflammatory marker plays an
important role in patients with lung damage that is caused
by SARS CoV-2 [31]. In response to an infection or tissue
injury, IL-6 has a prompt and transient production. This
production of IL-6 leads to the stimulation of an acute
phase response that contributes to the host defense mech-
anism [32].
Another marker that shows elevation in COVID-19
patients includes D-dimer, which is the primary enzymatic
degradation product of cross-linked fibrin by plasmin
[33, 34]. Studies have shown that the risk of the patient
having a septic shock and sepsis increases with increasing
levels of D-dimer [34].
Cardiac biomarkers like hs Troponin I and NT pro BNP
which play a role in cardiac injury and myocardial
infarction [34–37]. Also tend to show an increase. Studies
have shown that in patients with COVID-19 disease, the
prognostic effect of cardiac biomarkers (NT pro BNP and
hs troponin I) could be directly or indirectly related to
cardiac injury. Binding of SARS CoV2 with ACE2 leads to
restricted synthesis of angiotensin 1–7 and also leads to
elevated levels of angiotensin 2. Angiotensin 2 aids the
secretion of NT pro BNP and cardiac Troponin whereas the
anti-inflammatory effect is exerted by the elevated levels of
angiotensin 1–7 [21].
Kidney injury marker and Liver injury markers like
Creatinine, BUN, and AST, ALT is also seen to increase in
COVID-19 [34]. Procalcitonin, a precursor of calcitonin,
used as a biomarker in sepsis, viral pneumonia, and
obstructive pulmonary disease [19] also tends to rise in
COVID-19 patients.
An elevated level of ferritin plays a role in pro-inflam-
mation [38]. The production of ferritin under inflammatory
conditions of the body is an important acute phase reactant.
These inflammatory conditions include infections as well
as, hematologic, malignant, and rheumatologic conditions.
Ferritin tends to reduce the iron supply as a part of a
defense mechanism, hence incase of high pathogenic load
elevated levels of ferritin are observed [39]. Along with the
reduction in iron supply, ferritin also tends to regulate
Table 3 Laboratory Abnormalities in COVID-19 progression [42]
Parameter Abnormalities Clinical significance
LDH Elevated Tissue damage, onset of sepsis
ALT Elevated Liver damage
AST Elevated Liver damage
T. Billirubin Elevated Liver injury
Creatinine Elevated Kidney injury
D-Dimer Elevated Septic shock, coagulation activation
PCT Elevated Pulmonary disease, sepsis, viral pneumonia, bacterial infection
CRP Elevated Inflammation, infection, sepsis, viremia
Ferritin Elevated Pro-inflammation,
IL-6 Elevated Inflammation, cytokine strom
Albumin Decreased Liver function
Blood gas Deranged Critical care management
High sensitive cardiac troponin I Elevated Cardiac injury
NT proBNP/ BNP Elevated Cardiac injury
Lactate Elevated Sepsis, tissue damage
BUN Elevated Kidney injury
Neutrophils Elevated Acute inflammation, bacterial infection
Lymphocytes Decrease Viral, bacterial, fungal and parasitic infection
Leucocytes Elevated Systemic inflammation and chronic disorder
Platelet Decrease Viral infection
482 Ind J Clin Biochem (Oct-Dec 2021) 36(4):473–484
123

cytokine (responsible for cytokine proinflammatory storm)
synthesis and release [40]
Another acute phase reactant synthesized in response to
infection or inflammation is C-reactive protein (CRP). CRP
is synthesized by the liver. A dramatic increase in serum
concentration is seen in acute inflammation hence making
CRP a more important marker for viremia and sepsis. CRP
also plays a role in inflammatory cytokine activation hence
contributing to the proinflammatory cycle [39].
Patients with severe sepsis also show an association with
elevated levels of lactate dehydrogenase (LDH). LDH is
known to depict the extent of tissue damage. Studies show
when LDH levels do not normalize within 48 h of sepsis
onset is related to the prediction of patient mortality [41].
Therefore, routine blood tests in the laboratory medicine
department serve as a potential diagnostic tool for COVID-
19 [43]. Elevated biomarkers include CRP, ALT, AST,
LDH, BUN, Creatinine, PCT, Lactate, Ferritin, IL6, etc.
Biomarkers that tend to decrease with COVID-19 patients
observed from our study include, PO2, SO2, Albumin, total
protein. Along with the above markers, hematological
markers also play an important role in the COVID-19
prognosis. Neutrophil and WBC Count show an increase in
coronavirus infection and lymphocytes and eosinophils
tend to show a decrease. The trend analysis of the various
biomarkers in COVID-19 patients carried out in the study
will help in understanding the course of COVID-19 treat-
ment while chasing the cytokine storm in ARDS. Since the
pathogenecity of the Novel Coronavirus is yet not clearly
understood in spite of several ongoing studies [44], Routine
laboratory testing might aid in symptom-dependent treat-
ment regime till the complete understanding of the same.
We believe that the data considered for the study shows
the importance of routine laboratory biomarkers in the
coronavirus disease 2019 (COVID-19) and it will aid in a
better understanding of the disease.
The study has a few limitations. The first being a smaller
sample size and since it’s retrospective data, not all the
patients carried out all blood tests.
Conclusions
In summary, we can conclude from the study that COVID-
19 patients show significant abnormalities in the routine
laboratory biomarkers characterized by an abnormality in
AST, ALT, T Billirubin, Creatinine, CRP, PCT, LDH, IL6,
Ferritin, Blood Gases and Albumin in COVID 19 patients.
A number of biomarkers that include IL-6, NT Pro BNP,
hs Troponin I, PCT, CRP, Ferritin, LDH, Creatinine, BUN,
AST, ALT, tend to increase in COVID-19 patients.
Biomarkers like PO2, SO2, Total protein, Albumin, tend to
decrease in such patients.
Declarations
Conflict of interest The author declares no conflict of interest.
Ethical Approval Institutional Ethics Committee Approval was
taken.
References
1. Lippi G, Plebani M. Laboratory abnormalities in patients with
COVID-2019 infection. Clin Chem Lab Med (CCLM).
2020;58(7):1131–4. https://doi.org/10.1515/cclm-2020-0198.
2. Zhou F, Ting Y, Ronghui D, Fan G, Liu Y, Liu Z, et al. Clinical
course and risk factors for mortality of adult inpatients with
COVID-19 in Wuhan, China: a retrospective cohort study. The
Lancet. 2020;395(10229):1054–62. https://doi.org/10.1016/
S0140-6736(20)30566-3.
3. Guan WJ, Zheng-yi Ni YH, Liang W-H, Chun-quan O, He J-X,
et al. Clinical characteristics of coronavirus disease 2019 in
China. N Engl J Med. 2020;382:1708–20. https://doi.org/10.
1056/NEJMoa2002032.
4. Mitra P, Misra S, Sharma P. COVID-19 pandemic in India: what
lies ahead. Ind J ClinBiochem. 2020;35:257–9. https://doi.org/10.
1007/s12291-020-00886-6.
5. World Health Organization Coronavirus (COVID-19) Dashboad,
as of 2:35 PM CEST, 18th April, 2021. https://covid19.who.int.
6. Gao Y, Li T, Han M, Li X, Dong W, Yuanhong X, et al. Diag-
nostic utility of clinical laboratory data determinations for
patients with the severe COVID-19. J Med Virol.
2020;92(7):791–6. https://doi.org/10.1002/jmv.25770.
7. Yong-JianGeng Z-YW, Qian H-Y, Ji Huang C, Lodato R, Cas-
triotta RJ. Pathophysiological characteristics and therapeutic
approaches for pulmonary injury and cardiovascular complica-
tions of coronavirus disease. Cardiovasc Pathol.
2019;2020(47):107228.
8. TanuSinghal A. Review of coronavirus disease-2019 (COVID-
19). Indian J Pediatr. 2020;87(4):281–6.
9. Lingeswaran M, Goyal T, Ghosh R, Suri S, Mitra P, Misra S,
Sharma P. Inflammation, immunity and immunogenetics in
COVID-19: a narrative review. Indian J Clin Biochem.
2020;35(3):260–73. https://doi.org/10.1007/s12291-020-00897-3.
10. Lippi G, Simundic A-M, Plebani M. Potential preanalytical and
analytical vulnerabilities in the laboratory diagnosis of coron-
avirus disease 2019 (COVID-19). Clin Chem Lab Med.
2020;58(7):1070–6.
11. AlqahtaniID JS, Oyelade T, Aldhahir AM, Alghamdi SM,
Almehmadi M, Alqahtani AS, et al. Prevalence, severity and
mortality associated with COPD and smoking in patients with
COVID-19: a rapid systematic review and meta-analysis. PLoS
One. 2020;15(5):e0233147. https://doi.org/10.1371/journal.pone.
0233147.
12. Tobacco use and COVID-19. 11 May 2020 Statement. Geneva:
World Health Organization. https://www.who.int/news-room/
detail/11-05-2020-who-statement-tobacco-use-and-covid-19.
Accessed: 14 May 2020
13. Huang C, Wang Y, Li X, LiliRen JZ, Yi H, et al. Clinical features
of patients infected with 2019 novel coronavirus in Wuhan,
China. Lancet. 2020. https://doi.org/10.1016/S0140-
6736(20)30183-5.
14. Gotzinger F, Santiago-Garcıa B, AntoniNoguera-Julian ML,
Lancella L, Calo FI, Carducci, , et al. COVID-19 in children and
adolescents in Europe: a multinational, multicentre cohort study.
Lancet Child Adolesc Health. 2020. https://doi.org/10.1016/
S2352-4642(20)30177-2.
Ind J Clin Biochem (Oct-Dec 2021) 36(4):473–484 483
123

15. Riphagen S, Gomez X, Gonzalez-Martinez C, Wilkinson N.
ParaskeviTheocharis. Hyperinflammatory shock in children dur-
ing COVID-19 pandemic. Lancet. 2020;395(10237):1607–8.
16. DeBiasi RL, Song X, Delaney M, Bell M, Smith K, Pershad J,
et al. Severe coronavirus disease-2019 in children and young
adults in the Washington, DC metropolitan region. J Pediatr.
2020. https://doi.org/10.1016/j.jpeds.2020.05.007.
17. Jones VG, Mills M, Suarez D, Hogan CA, Debra Yeh J, Segal B,
et al. COVID-19 and Kawasaki disease: novel virus and novel
case. Hosp Pediatr. 2020. https://doi.org/10.1542/hpeds.2020-
0123.
18. Plebani M, Laposata M, Lippi G. A manifesto for the future of
laboratory medicine professionals. Clin Chim Acta.
2019;489:49–52.
19. Samsudin I, Vasikaran SD. Clinical utility and measurement of
procalcitonin. Clin Biochem Rev. 2017;38(2):59–68.
20. Abbaspour N, Hurrell R, Kelishadi R. Review on iron and its
importance for human health. J Res Med Sci. 2014;9:164–74.
21. COVID-19 Coronavirus Real-Time PCR Kit. https://www.who.
int/diagnostics_laboratory/eual/eul_0515_202_00_covid19_cor
onavirus_real_time_pcr_kit_ifu.pdf?ua=1. Assessed 15th August
2020
22. Hoffmann M, Kleine-Weber H, Kruger N, Muller M, Drosten C,
Pohlmann S. The novel coronavirus 2019 (2019-nCoV) uses the
SARS-coronavirus receptor ACE2 and the cellular protease
TMPRSS2 for entry into target cells. bioRxiv. 2020. https://doi.
org/10.1101/2020.01.31.929042.
23. Letko M, Marzi A, Munster Vincent. Functional assessment of
cell entry and receptor usage for SARS-CoV-2 and other lineage
B betacoronaviruses. Nat Microbiol. 2020. https://doi.org/10.
1038/s41564-020-0688-y.
24. Zhang H, Kang Z, Gong H, Da X, Wang J, Li Z, Cui X, Xiao J,
et al. The digestive system is a potential route of 2019-nCov
infection: a bioinformatics analysis based on single-cell tran-
scriptomes. bioRxiv. 2020. https://doi.org/10.1101/2020.01.30.
927806.
25. Zhu N, Zhang D, Wang W, Li X, Yang Bo, Song J, et al. A Novel
Coronavirus from Patients with Pneumonia in China, 2019.
N Engl J Med. 2020;382(8):727–33.
26. Liu Z, Bing X, Zhi XZ. An update on the epidemiological
characteristics of novel coronavirus pneumonia (COVID-19).
Chin J Epidemiol. 2020. https://doi.org/10.3760/cma.j.issn.0254-
6450.2020.02.003.
27. Henry BM, Santos MH, de Oliveira S, Benoit MP, Lippi G.
Hematologic biochemical and immune biomarker abnormalities
associated with severe illness and mortality in coronavirus dis-
ease 2019 (COVID-19): a meta-analysis. Clin Chem Lab Med.
2020. https://doi.org/10.1515/cclm-2020-0369.
28. Lippi G, Plebani M. The critical role of laboratory medicine
during coronavirus disease 2019 (COVID-19) and other viral
outbreaks. Clin Chem Lab Med. 2020. https://doi.org/10.1515/
cclm-2020-0240.
29. Joost Wiersinga W, Rhode A, Cheng AC, Peacock SJ, Prescott
HC. Pathophysiology transmission diagnosis and treatment of
coronavirus disease 2019 (COVID-19). JAMA. 2020. https://doi.
org/10.1001/jama.2020.12839.
30. Rose-John S, Winthrop K, Calabrese L. The role of IL-6 in host
defence against infections: immunobiology and clinical implica-
tions. Nat Rev Rheumatol. 2017. https://doi.org/10.1038/
nrrheum.2017.83.
31. Grifoni E, Valoriani A, Cei F, Lamanna R, Gelli AMG, Ciambotti
B, Vannucchi V, Moroni F, et al. Interleukin-6 as prognosticator
in patients with COVID-19. J Infect. 2020;81(3):452–82.
32. Tanaka T, Narazaki M, Kishimoto T. IL-6 in inflammation,
immunity, and disease. Cold Spring Harb Perspect Biol.
2014;6(10):a016295.
33. Sathe PM, Patwa UD. D Dimer in acute care. Int J Crit Illn Inj
Sci. 2014;2014:229–32.
34. Kavsak PA, de Wit K, Worster A. Emerging key laboratory tests
for patients with COVID-19. Clin Biochem. 2020. https://doi.org/
10.1016/j.clinbiochem.2020.04.009.
35. Bhutta ZA, Basnyat B, Saha S, Laxminarayan R. COVID-19 risks
and response in South Asia. BMJ. 2020. https://doi.org/10.1136/
bmj.m1190.
36. Bularga A, Lee KK, Stewart S, Ferry AV, Chapman AR, Mar-
shall L, et al. High-sensitivity troponin and the application of risk
stratification thresholds in patients with suspected acute coronary
syndrome. Circulation. 2019. https://doi.org/10.1161/CIRCULA
TIONAHA.119.042866.
37. Gao L, Jiang D, Wen X-S, Cheng X-C, Sun M, He B, You L-N,
et al. Prognostic value of NT-proBNP in patients with severe
COVID-19. Resp Res. 2020. https://doi.org/10.1186/s12931-020-
01352-w.
38. Abbaspour N, Hurrell R, Kelishadi R. Review on iron and its
importance for human health. J Res Med Sci. 2014;19:164–74.
39. Asghar MS, HaiderKazmi SJ, Khan NA, Akram M, Hassan M,
Rasheed U, Ahmed Khan S. Poor prognostic biochemical mark-
ers predicting fatalities caused by COVID-19: a retrospective
observational study from a developing country. Cureus.
2020;12(8):e9575. https://doi.org/10.7759/cureus.957527a5.
40. Giemza-Stokłosa J, Islam MA, Kotyla PJ. Hyperferritinaemia: an
iron sword of autoimmunity. Curr Pharm Des. 2019;25:2909–18.
https://doi.org/10.2174/1381612825666190709202804.
41. Zein JG, Lee GL, Tawk M, Dabaja M, Kinasewitz GT. Prog-
nostic significance of elevated serum lactate dehydrogenase
(LDH) in patients with severe sepsis. Chest. 2004;126:873.
https://doi.org/10.1378/chest.126.4_MeetingAbstracts.873S.
42. IFCC Information Guide on COVID-19 (2020). https://www.ifcc.
org/ifcc-news/2020-03-26-ifcc-information-guide-on-covid-19.
Accessed on 30th November 2020
43. Ferrari D, Motta A, Strollo M, Banfi G, Locatelli M. Routine
blood tests as a potential diagnostic tool for COVID-19. Clin
Chem Lab Med. 2020. https://doi.org/10.1515/cclm-2020-0398.
44. Pal A, Squitti R, Picozza M, Pawar A, Rongioletti M, Dutta AK,
Sahoo S, Goswami K, Sharma P, Prasad R. Zinc and COVID-19:
basis of current clinical trials. Biol Trace Elem Res.
2020;22:1–11. https://doi.org/10.1007/s12011-020-02437-9.
Publisher’s Note Springer Nature remains neutral with regard to
jurisdictional claims in published maps and institutional affiliations.
484 Ind J Clin Biochem (Oct-Dec 2021) 36(4):473–484
123