Evaluation of the Installation and Initial Condition of … CENTER FOR TRANSPORTATION INNOVATION AND...
55
VIRGINIA CENTER FOR TRANSPORTATION INNOVATION AND RESEARCH 530 Edgemont Road, Charlottesville, VA 22903-2454 www. VTRC.net Evaluation of the Installation and Initial Condition of Overlays on Bridge Decks Rosphalt http://www.virginiadot.org/vtrc/main/online_reports/pdf/13-r5.pdf MICHAEL M. SPRINKEL, P.E. ALEX K. APEAGYEI, Ph.D., P.E. Associate Director Research Scientist Final Report VCTIR 13-R5
Transcript of Evaluation of the Installation and Initial Condition of … CENTER FOR TRANSPORTATION INNOVATION AND...
VIRGINIA CENTER FOR TRANSPORTATION INNOVATION AND RESEARCH
530 Edgemont Road, Charlottesville, VA 22903-2454
www. VTRC.net
Evaluation of the Installationand Initial Condition ofOverlays on Bridge Decks
Rosphalt
http://www.virginiadot.org/vtrc/main/online_reports/pdf/13-r5.pdf
MICHAEL M. SPRINKEL, P.E.
ALEX K. APEAGYEI, Ph.D., P.E.
Associate Director
Research Scientist
Final Report VCTIR 13-R5
Standard Title Page - Report on Federally Funded Project 1. Report No.: 2. Government Accession No.: 3. Recipient’s Catalog No.: FHWA/VCTIR 13-R5
4. Title and Subtitle: 5. Report Date: Evaluation of the Installation and Initial Condition of Rosphalt Overlays on Bridge Decks
June 2013 6. Performing Organization Code:
7. Author(s): Michael M. Sprinkel, P.E., and Alex K. Apeagyei, Ph.D., P.E.
8. Performing Organization Report No.: VCTIR13-R5
9. Performing Organization and Address: Virginia Center for Transportation Innovation and Research 530 Edgemont Road Charlottesville, VA 22903
10. Work Unit No. (TRAIS): 11. Contract or Grant No.: 93240
12. Sponsoring Agencies’ Name and Address: 13. Type of Report and Period Covered: Virginia Department of Transportation 1401 E. Broad Street Richmond, VA 23219
Federal Highway Administration 400 North 8th Street, Room 750 Richmond, VA 23219-4825
Final, April 2009–August 2012 14. Sponsoring Agency Code:
15. Supplementary Notes: 16. Abstract: Protection systems are placed on bridge decks to retard the intrusion of chlorides and moisture that can eventually cause corrosion deterioration. The Virginia Department of Transportation typically uses hydraulic cement concrete (HCC) overlays of latex-modified concrete (LMC); LMC with very early hardening cement (LMC-VE); and silica fume concrete (SFC) and epoxy overlays for deck protection. Occasionally, a conventional asphalt overlay and waterproof membrane system is used. Rosphalt is an asphalt that is considered to be impermeable and has been used on decks without placement of a membrane. The purpose of this research was to evaluate the construction, initial condition, and cost of the Rosphalt overlays placed on two bridges in Virginia: (1) the northbound lanes of I-85 over Route 629 and the eastbound and westbound lanes of Span 22 of the Norris Bridge on State Route 3 over the Rappahannock River. As a comparison to Rosphalt, a conventional asphalt overlay and waterproof membrane system was placed on the adjacent bridge on the southbound lanes of I-85 over Route 629. Emphasis was placed on comparing the wearing and protection systems with respect to speed and ease of construction (including lane closure time), initial condition as indicated by physical properties, protection and skid resistance, and cost. An objective was also to compare these asphalt protection systems to HCC overlays of LMC-VE, LMC, and SFC and epoxy overlays. Costs varied greatly depending on the estimates used and the bid prices. Although estimates for the Norris Bridge indicated Rosphalt as the lowest cost option, bid prices showed it was likely the most expensive option. Three overlay options, Rosphalt, SM-9.5 mixture and membrane, and LMC-VE, are rapid and can provide major reductions in traffic control and user costs. Based on laboratory tests, Rosphalt is more fatigue and rut resistant than the SM-9.5 mixture and should last longer, but based on the cost of the first two installations in Virginia, Rosphalt is too expensive to be considered as a competitive overlay system. 17 Key Words: 18. Distribution Statement: Bridge deck overlay, asphalt, Rosphalt, permeability No restrictions. This document is available to the public
through NTIS, Springfield, VA 22161. 19. Security Classif. (of this report): 20. Security Classif. (of this page): 21. No. of Pages:
53 22. Price:
Unclassified Unclassified Form DOT F 1700.7 (8-72) Reproduction of completed page authorized
FINAL REPORT
EVALUATION OF THE INSTALLATION AND INITIAL CONDITION OF ROSPHALT OVERLAYS ON BRIDGE DECKS
Michael M. Sprinkel, P.E. Associate Director
Alex K. Apeagyei, Ph.D., P.E.
Research Scientist
In Cooperation with the U.S. Department of Transportation Federal Highway Administration
Virginia Center for Transportation Innovation and Research (A partnership of the Virginia Department of Transportation
and the University of Virginia since 1948)
Charlottesville, Virginia
June 2013 VCTIR 13-R5

ii
DISCLAIMER
The contents of this report reflect the views of the authors, who are responsible for the facts and the accuracy of the data presented herein. The contents do not necessarily reflect the official views or policies of the Virginia Department of Transportation, the Commonwealth Transportation Board, or the Federal Highway Administration. This report does not constitute a standard, specification, or regulation. Any inclusion of manufacturer names, trade names, or trademarks is for identification purposes only and is not to be considered an endorsement.
Copyright 2013 by the Commonwealth of Virginia. All rights reserved.

iii
ABSTRACT Protection systems are placed on bridge decks to retard the intrusion of chlorides and moisture that can eventually cause corrosion deterioration. The Virginia Department of Transportation typically uses hydraulic cement concrete (HCC) overlays of latex-modified concrete (LMC); LMC with very early hardening cement (LMC-VE); and silica fume concrete (SFC) and epoxy overlays for deck protection. Occasionally, a conventional asphalt overlay and waterproof membrane system is used. Rosphalt is an asphalt that is considered to be impermeable and has been used on decks without placement of a membrane. The purpose of this research was to evaluate the construction, initial condition, and cost of the Rosphalt overlays placed on two bridges in Virginia: (1) the northbound lanes of I-85 over Route 629 and the eastbound and westbound lanes of Span 22 of the Norris Bridge on State Route 3 over the Rappahannock River. As a comparison to Rosphalt, a conventional asphalt overlay and waterproof membrane system was placed on the adjacent bridge on the southbound lanes of I-85 over Route 629. Emphasis was placed on comparing the wearing and protection systems with respect to speed and ease of construction (including lane closure time), initial condition as indicated by physical properties, protection and skid resistance, and cost. An objective was also to compare these asphalt protection systems to HCC overlays of LMC-VE, LMC, and SFC and epoxy overlays. Costs varied greatly depending on the estimates used and the bid prices. Although estimates for the Norris Bridge indicated Rosphalt as the lowest cost option, bid prices showed it was likely the most expensive option. Three overlay options, Rosphalt, SM-9.5 mixture and membrane, and LMC-VE, are rapid and can provide major reductions in traffic control and user costs. Based on laboratory tests, Rosphalt is more fatigue and rut resistant than the SM-9.5 mixture and should last longer, but based on the cost of the first two installations in Virginia, Rosphalt is too expensive to be considered as a competitive overlay system.
.

1
FINAL REPORT
EVALUATION OF THE INSTALLATION AND INITIAL CONDITION OF ROSPHALT OVERLAYS ON BRIDGE DECKS
Michael M. Sprinkel, P.E.
Associate Director
Alex K. Apeagyei, Ph.D., P.E. Research Scientist
INTRODUCTION
Overlays are usually placed on bridge decks to reduce the infiltration of water and chloride ions and to improve skid resistance, ride quality, and surface appearance. Concrete rather than asphalt overlays are typically used by the Virginia Department of Transportation (VDOT). Concrete overlays that have an established history of use and acceptance in Virginia include latex-modified concrete (LMC), first used in 1969 (Sprinkel, 1999), and 7% silica fume concrete (SFC), first used in 1987 (Sprinkel and Ozyildirim, 1999). LMC overlays are typically opened to traffic after 2 days of moist curing and another 1 or 2 days of air curing (Sprinkel, 2000; Sprinkel and Moen, 1999). SFC overlays have been opened to traffic after as little as 24 hours of curing but curing of 3 days or more is typically recommended and specified to minimize cracking in the overlay. Over time, the construction of overlays has become increasingly difficult because lanes, particularly on the interstate system, cannot be closed for extended periods to allow for the construction and curing of these overlays because of the resulting traffic congestion. Contractors are often forced to work at night and on weekends and during cooler weather to accommodate traffic. Most of the conventional overlay materials cannot be used under these conditions.
Overlays that cure rapidly can be completed with reduced user costs compared to standard overlays because traffic delays caused by lane closures are reduced. Rapid-curing overlays are typically done during off-peak traffic periods such as at night and on weekends. LMC prepared with very early hardening cement (LMC-VE) has been used as a rapid overlay for bridge decks in Virginia since 1997 (Sprinkel, 1999, 2005, 2006, 2011). An LMC-VE overlay can be driven on after only 3 hours of curing (Sprinkel, 1999, 2011). An SFC overlay cures more rapidly than an LMC overlay. Asphalt overlays can also be installed on bridge decks with a short lane closure time. However, asphalt overlays are rarely used by VDOT because conventional asphalt is permeable when placed on bridge decks since vibratory compaction is not allowed. To protect the deck, a membrane must be installed before the overlay is placed. Unfortunately, departments of transportation (DOTs) have reported that membranes often leak (Russell, 2004). An epoxy overlay is a rapid option as it is typically placed at night or on weekends with minimal disruption to traffic because it can be driven on after only 3 hours of curing (Sprinkel, 2003).

2
Rosphalt is a polymer-modified asphalt formulated to be suitable for use as a wearing surface and protection system on bridge decks without the use of a waterproof membrane between the overlay and the concrete deck and without the need for vibratory compaction. Appendix A provides the specification for Rosphalt used by VDOT. The polymer modifier and asphalt content that is higher than that in typical asphalt mixtures used by VDOT can result in an asphalt with a permeability low enough to negate the need for a membrane. Appendix B provides a list of agencies, and their contacts, that have used Rosphalt overlays over the past 20 years. To prepare for the use of Rosphalt, VDOT staff contacted staff of the Wisconsin DOT, Kentucky Transportation Cabinet, Massachusetts Turnpike Authority, and the Port Authority of New York and New Jersey. These agencies had used Rosphalt on a number of projects and were generally satisfied with the installations. Some agencies had tested the mixture in the laboratory but had little to no test data with respect to cores or the in-place mixture. The Port Authority of New York and New Jersey had used a “percent within limits” specification for acceptance and based payment on the density of cores. Since Rosphalt had never been used in Virginia, its suitability as a wearing surface and protection system was evaluated in the two experimental features projects described in this report. For this research project, a Rosphalt overlay was placed on the deck of a bridge on the I-85 northbound lanes (NBL) over County Route 629 in Virginia. In this report, this bridge will be referred to as “I-85 Bridge NBL.” The parallel bridge on the southbound lanes (SBL) received a conventional epoxy waterproof membrane and asphalt overlay. In this report, this bridge is referred to as “I-85 Bridge SBL.” The structures were built in 1964 and repaired in 1979. They are 124.5 ft long with three simple concrete T-beam spans with a 27 degree skew. The average daily traffic for these bridges was approximately 12,388 vehicles per day in 2005 with 13% truck traffic (per VDOT’s Highway Traffic Records Information System [HTRIS], VDOT’s historical records database) and is projected to be 14,402 vehicles per day in 2022 (per HTRIS). Prior to placement of the overlays, the two three-span bridges were patched and the two joints separating the spans were removed and the spans were made continuous. A very rapid hardening concrete prepared with calcium sulfoaluminate cement called Rapid Set was used for the patching and joint replacements. One lane was closed in each direction to allow for the repairs and the installation of the asphalt overlays.
A second Rosphalt overlay was placed on Span 22 of the Norris Bridge. The Norris
Bridge is a two-lane structure approximately 9,985 ft long and 23 ft wide that carries State Route 3 over the Rappahannock River between Middlesex and Lancaster counties in Virginia. The deck includes a steel grid that is filled with a lightweight concrete and an LMC overlay that was placed on the shotblasted grid surface in the early 1990s as part of a re-decking project. The LMC overlay is delaminating from the top of the grid in many areas. The researchers believed the overlay was delaminating over the grid areas where the lightweight concrete fill was cupped during the shotblast cleaning. Further, they believed that the cups provided a place for water, latex slurry, and contaminants to collect, causing a low bond strength between the grid and the overlay. In addition, the cups were believed to cause concentrated stresses on the bond interface when the overlay was subjected to drying shrinkage, temperature change, and traffic.
Rather than continue to close lanes to patch the overlay, VDOT staff considered a plan to
remove the overlay and replace it with an alternative wearing and protection system. A number

3
of options were considered. It was necessary to replace the overlay with a minimum of lane closure time because there was no nearby river crossing and a detour would be approximately 80 miles long. An epoxy overlay was not practical because the overlay would vary in thickness because the concrete fill was cupped (thinner in the center of the grids than along the grid) and the overlay would be too thick over the center of the grids. A sheet membrane was not practical because the grid would likely puncture the membrane. Conventional concrete overlays were not practical because of the long cure time. An LMC-VE overlay was an option because it could be installed during off-peak traffic periods and opened to traffic with only 3 hours of curing. An asphalt overlay on a liquid membrane was not considered a practical option because the liquid would conform to the contours of the surface; it would be difficult to get the required membrane thickness at the high points; and the membrane would be too thick at the low points. Both the membrane and the asphalt overlay could be placed with a minimum of lane closure time. A polymer-modified asphalt overlay such as a Rosphalt overlay was considered to be the optimum wearing and protection system for the Norris Bridge because the asphalt overlay could be placed with the least amount of lane closure time and the polymer and increased asphalt content would reduce the permeability of the overlay so that a membrane would not be necessary. VDOT staff in the Fredericksburg District Bridge Office prepared a life cycle cost analysis (LCCA) that indicated a Rosphalt overlay was more economical than an LMC-VE overlay or an asphalt overlay on a liquid membrane (Whitman, Requardt & Associates, 2008). To gain more experience with Rosphalt and the preparation of contract documents for placing an overlay on the rest of the bridge, VDOT awarded a contract to replace the overlay on Span 22, the span considered to be in the worst condition with 46.4% delaminated and 27.8% spalled or ready to spall (Whitman, Requardt & Associates, 2007).
This report describes the construction, cost, and initial condition of the Rosphalt used on the two bridges and the epoxy membrane and asphalt overlay placed on the deck of I-85 Bridge SBL. To allow for the various deck protection systems used by VDOT to be compared, the report also includes information on alternative systems. Alternative systems include epoxy, LMC-VE, and SFC overlays.
PURPOSE AND SCOPE
The purpose of this study was to evaluate the construction, initial condition, and cost of the Rosphalt overlays placed on two bridges, I-85 Bridge NBL over Route 629 and Span 22 of the Norris Bridge on Route 3 over the Rappahannock River, and to compare the Rosphalt installations with the conventional asphalt overlay and membrane system placed on I-85 Bridge SBL over Route 629. Emphasis was placed on comparing the wearing and protection systems with respect to speed and ease of construction (including lane closure time); initial condition as indicated by physical properties, protection, and skid resistance; and cost. An objective was also to compare these protection systems to hydraulic cement concrete (HCC) overlays of LMC-VE, LMC, and SFC and epoxy overlays. Information on the HCC and epoxy overlays was to be taken from published reports and data available from project files.

4
Comparisons included:
• construction • asphalt mixture properties • HCC mixture properties • epoxy mixture properties • skid resistance • construction costs • road user costs.
METHODS
Two tasks were conducted to achieve the study objectives:
1. Review the literature; collect information on the materials used in the overlays; and refine specifications for the three overlays.
2. Monitor the construction of the three overlays; sample and conduct tests on the
materials; determine the initial condition of the overlays; and compare the physical properties, protection, skid resistance, and cost of the protection systems.
Construction Construction information for the asphalt overlay installations was taken from construction records and field notes. Information for the HCC and epoxy overlays was taken from published reference material.
Asphalt Mixture Properties Laboratory and field tests were conducted to determine the initial condition and predicted performance of the three asphalt overlay surfaces. Laboratory testing was performed on the Rosphalt overlay mixtures and the conventional asphalt mixture that was placed on the membrane on I-85 Bridge SBL. Gyratory Volumetric Properties, Gradation, and Binder Content Gyratory-compacted specimens were made in the laboratory in accordance with AASHTO T 312 (American Association of State Transportation and Highway Officials [AASHTO], 2012) using asphalt samples collected during field placement. The number of gyrations (Ndes) used during compaction was 50, which was the specified design compactive effort for a polymer-modified waterproofing wearing course (PMWWC), as indicated in Appendix A. For the purpose of this study, Rosphalt was considered a PMWWC.

5
Conventional volumetric properties of gyratory-compacted samples were determined. In addition, gradation properties and binder content of the mixtures were determined. These tests were performed to ascertain adherence to the design mixture. All samples were taken during the placement of the asphalt mixtures at the construction site. An ignition oven test (AASHTO T 308) (AASHTO, 2010a) was used to recover aggregate samples from the loose samples. A gradation test (AASHTO T 27) (AASHTO, 2006) was used to determine the gradation of the recovered aggregates, and the results were compared with the requirements of the job-mix formula (JMF) for a PMWWC, shown in Appendix A. The results of the ignition oven test were also used to estimate the binder content of the mixtures and were compared with specification criteria for a PMWWC. Core Density To ascertain the level of compaction achieved in the field, density tests were conducted on cores in accordance with AASHTO T 166 (AASHTO, 2010b) to determine the in-place air voids content of the finished overlay. All air void data reported in this report were taken directly from the quality control / quality assurance testing results for each project. Rut Tests Rut tests were performed on beams with the Asphalt Pavement Analyzer (APA) in accordance with Virginia Test Method (VTM) 110 (VDOT, 2009). The method tests three beams simultaneously through 8,000 cycles at a load of 120 lb, a hose pressure of 120 psi, and a test temperature of 120 °F. Rut test results determine the long-term susceptibility to rutting under traffic. Rut depth after 8,000 cycles was measured with a digital caliper to the nearest 0.01 mm at three locations along the longitudinal axis of the beam. For conventional SM-9.5 mixtures, a limiting maximum rut depth of 3.5 mm is specified in VTM 110 for high-volume roads where a performance-graded binder PG 76-22 is used. Beams were prepared from samples taken during the production of the asphalts. Only Rosphalt mixtures from the Norris Bridge were tested because of a lack of materials. Flow Number Tests The flow number (FN) test is a repeated load permanent deformation test for evaluating rutting of asphalt mixtures. FN tests were performed on specimens 6 in tall by 4 in in diameter in accordance with AASHTO TP 79 (AASHTO, 2009). The FN tests were conducted at 130 °F using a deviator stress of 30 psi for 10,000 cycles or until a permanent strain of 5%, whichever came first. Asphalt mixtures that can sustain more than 10,000 load cycles without reaching the terminal strain of 5% are considered to be rut resistant. FN was determined mathematically as the cycle number at which the strain rate is at a minimum. Only Rosphalt mixtures from the Norris Bridge were tested because of a lack of materials.

6
Fatigue Tests Beam fatigue tests were performed in accordance with AASHTO T 321 (AASHTO, 2011). At least three fatigue tests were performed at both 400 and 800 µε, and the endurance strain limit was determined from the regression. Endurance limit is defined as the strain level, at a given temperature, below which no fatigue damage occurs in an asphalt concrete (Prowell et al., 2010). Because of high strain levels that result from flexing of the decks under traffic, good fatigue resistance properties are important. Beams were prepared from samples taken during the production of the asphalts. Flexural beam fatigue tests were performed in accordance with AASHTO T 321 to evaluate the fatigue resistance of the Rosphalt mixtures. The tests were conducted in the strain-controlled mode with strain levels ranging from 300 to 800 µε at a single temperature of 20 °C. At least 3 fatigue beam test specimens were tested at each strain level. Overall, 21 fatigue beam specimens were tested, including 18 beams from the Norris Bridge project and 3 beams from the I-85 Bridge. During the test, repeated application of the specified strain was continued until failure occurred in the test specimen. Failure was defined as the number of cycles (Nf) at which beam stiffness degraded to 50% of the initial flexural stiffness. One important reason for conducting the fatigue test at multiple strain levels is that that fatigue curves of strain (ε) versus the number of cycles to failure (Nf) can be developed for each mixture type. Fatigue curves are important in ranking mixtures in terms of their resistance to fatigue cracking. Equation 1 is the most commonly used model to relate fatigue life to applied strain and was used in this study. Fatigue models were developed based on the strain versus Nf data obtained using regression analysis for mixtures from each bridge.
Nf = kε-n [Eq. 1] where Nf = cycles to failure k = constant n = constant ε = applied strain. Permeability A major objective for using the Rosphalt mixtures on the I-85 Bridge and the Norris Bridge was to provide waterproofing to the bridge decks as indicated previously. Therefore, permeability of the mixtures was considered to be very important. Permeability tests were conducted on laboratory-compacted mixtures and field cores. Permeability was determined in accordance with VTM 120 (VDOT, 2005). The test was conducted on field cores and specimens made in the laboratory from field samples with the field
7
air void content. For regular asphalt concrete, the specification requires that the permeability at 7.5% or greater air voids should not exceed 150 x 10-5 cm/s (Maupin, 2010). Observation of moisture on the underside of the decks would provide an indication that the asphalt and membrane are permeable. A preliminary inspection for leaks was done on the I-85 Bridge on June, 18, 2009, at approximately 9:30 A.M. Density Prior to placement of the Rosphalt overlay on I-85 Bridge NBL, a test section was constructed in the parking lot at the VDOT South Hill Residency to establish that the required density could be achieved. Cores removed from the test section were tested for density, and results were correlated to nuclear density test results for use during construction. A nuclear device was used to test the density of the overlay. The Rosphalt overlay placed on the Norris Bridge eastbound lane (EBL) was used as the test section for the Norris Bridge project. Cores removed from the decks were also used to verify in-place density and volumetrics. Bond Test A bond test similar in methodology to ASTM C1583 (ASTM International [ASTM[, 2004) was used to determine the strength of the bond between the asphalt overlay and the existing deck material. Cores removed from the deck for bond testing in the laboratory were also used to verify in-place density and volumetrics.
Hydraulic Cement Concrete Mixture Properties Property data were taken from a recent publication (Sprinkel, 2011) and included mixture proportions, compressive strength, permeability, shrinkage, and bond strength.
Epoxy Mixture Properties Property data were taken from recent publications (Sprinkel, 2003; VDOT, 2011) and included mixture proportions, compressive strength, permeability, shrinkage, and bond strength.
Skid Resistance The three asphalt overlays were tested for skid resistance in accordance with ASTM E524 (ASTM, 2008a). Other frictional measurements were made by staff from Virginia Tech. Data for concrete overlays were taken from a recent publication (Sprinkel, 2011).
8
Construction Costs Construction costs for the three asphalt overlays were taken from the project contracts. Cost estimates for the Norris Bridge project were taken from the LCCA done by a consultant (Whitman, Requardt & Associates, 2008). Data for concrete overlays were taken from a recent publication (Sprinkel, 2011), and cost estimates for epoxy overlays were taken from VDOT bid tabulations from 2006 to 2009.
Road User Costs
Cost estimates for the Norris Bridge project were taken from the LCCA done by a consultant (Whitman, Requardt & Associates, 2008). Data for concrete overlays were taken from a recent publication (Sprinkel, 2011). Road user costs for epoxy overlays were considered to be the same as for Rosphalt because lane closure times would be similar.
RESULTS AND DISCUSSION
Overlay Construction Asphalt Overlays According to VDOT inspection records, the conventional SM-9.5 mixture was placed on I-85 Bridge SBL in April 2009 (see Figure 1). The EP5 modified epoxy overlay waterproof membrane was placed on the travel and passing lanes on March 18 and 31, 2009, respectively. Two Rosphalt control strips were constructed in the parking lot at the VDOT South Hill Residency on June 2 and 3, 2009. The automatic equipment that added the Rosphalt powdered rubber additive was not calibrated properly and insufficient Rosphalt was added to the mixture on June 2, requiring a second placement. Rosphalt was placed on the passing and travel lanes of I-85 Bridge NBL on June 3 and 6, 2009, respectively (see Figure 2). The EBL and westbound lane (WBL) of the Norris Bridge were overlaid with Rosphalt on June 23 and 24, 2010, respectively. Laboratory tests were conducted on samples of the SM-9.5 mixture and Rosphalt taken during the construction of the overlays on I-85 and on the two samples (Mixtures 10-1014 and 10-1015) taken during the construction of the Rosphalt overlay on the Norris Bridge. Each of the three bridges was overlaid in 2 days. The epoxy membrane placed on I-85 Bridge SBL required an additional 2 days. The installations indicated that both the SM-9.5 mixture and membrane (SM-9.5 + membrane) system and Rosphalt are rapid options for placing a wearing and protection system on a bridge deck. A detailed description of the removal of the latex overlay and placement of the Rosphalt is provided in Appendix C. The latex overlay was milled within 0.5 in of the top of the grid in 2 days. Small impact hammers were used to remove the 0.5 in of overlay that was bonded. Areas with delaminated overlay typically had low areas (cups) in the grid. The cups in the grid were filled with a rapid hardening mortar. Approximately 6 weeks was required to remove the bottom 0.5 in of the well-bonded areas of overlay. The delaminated sections were easily removed.

9
Figure 1. SM-9.5 Asphalt Overlay on I-85 Bridge SBL (looking north). Lanes have sealed joints between
concrete headers located above abutment and approach slab.
Figure 2. Rosphalt Overlay on I-85 Bridge NBL (looking south). Lanes have saw-cut and sealed joints in
Rosphalt between abutment and approach slab.

10
Asphalt Mixture Properties
Gyratory Volumetric Properties and Binder Content Table 1 provides a summary of volumetric properties for Rosphalt mixtures sampled from the Norris Bridge (Mixtures 10-1014 and 10-1015) and the I-85 Bridge. Mixtures 10-1014 and 10-1015 were designed using the same JMF but were placed on two separate paving days. As previously noted, the volumetric, gradation, and binder content tests were conducted to ascertain whether the mixtures complied with recommended design specifications. In this study, VDOT’s special specifications for a PMWWC were used (see Appendix A). As may be seen in Table 1, it appears that all the key volumetric properties met the required criteria for a PMWWC. Volumetric data for the SM-9.5 conventional asphalt mixture used on the I-85 Bridge were not available to report.
As may be seen, Mixture 10-1014 appears to have slightly more binder (9.56%) than Mixture 10-1015 (8.21%). Compared to the Norris Bridge mixtures, the I-85 mixtures had a lower asphalt binder content (6.77%). The minimum percent asphalt for PMWWCs for this study was 7.0% (see Appendix A).
Table 1. Volumetric Properties of Rosphalt Mixture Samples
Volumetric Property Norris Bridgea
I-85b Mixture 10-1014 Mixture 10-1015 % Asphalt content (AC) 9.56 8.21 6.77 Maximum specific gravity (Gmm) 2.379 2.423 2.431 Binder gravity (Gb) 1.018 1.018 1.020 % Air voids (Va) 0.99 0.99 0.98 % Voids in mineral aggregate (VMA) 21.5 19.1 16.8 % Voids filled with asphalt (VFA) 95.9 92.7 86.1 Dust/AC ratio 0.84 0.95 1.03 Bulk specific gravity (Gmb) 2.358 2.389 2.375 Aggregate effective specific gravity (Gse) 2.770 2.764 2.702 Aggregate specific gravity (Gsb) 2.716 2.710 2.660 % Binder absorbed (Pba) 0.73 0.73 0.60 Effective % binder content (Pbe) 8.894 7.536 6.209 Effective film thickness (Fbe) 14.08 11.96 9.94 % Density at Nini 93.3 90.5 90.5 Nini = Superpave N-initial, equivalent to 6 gyrations for this study. a Mixtures 10-1014 and 10-1015 were prepared from samples taken from the asphalt placed on Day 1 and Day 2, respectively, on the Norris Bridge. b Each data point represents the average of 3 mixtures (Mixtures 09-1030, 09-1031, 09-1032).
. Aggregate Gradation Figure 3 shows the aggregate gradation for the Norris Bridge mixtures (Mixtures 10-1014 and 10-1015) compared with that for the I-85 Bridge mixtures. The two unlabeled thin lines in Figure 3 represent the gradation requirements specified in the JMF. Figure 3 suggests that the gradation of the mixtures from the Norris Bridge was finer than that of the mixtures from the I-85 Bridge. Both mixtures, however, had a similar nominal maximum aggregate size (NMAS) of 9.5 mm. All things being equal, a mixture with finer gradations would be expected to be less permeable than a coarser mixture.

11
Figure 3. Gradation for Rosphalt Mixtures. Mixtures from the Norris Bridge appear finer than those from
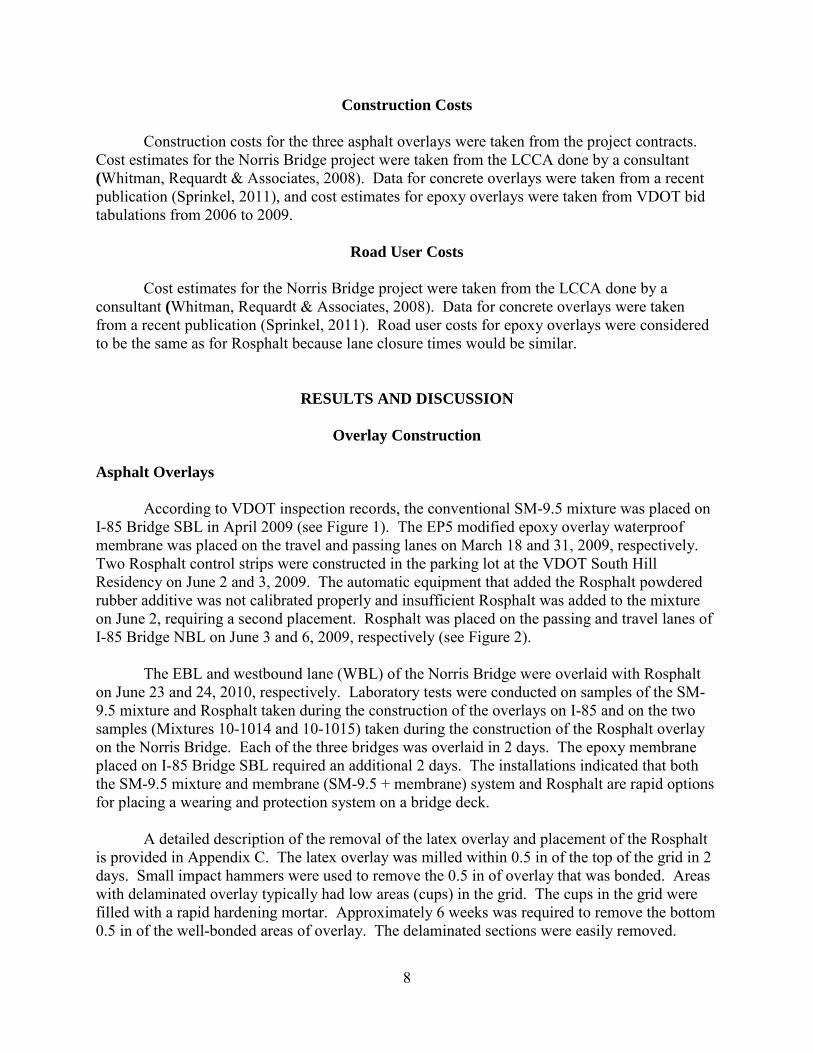
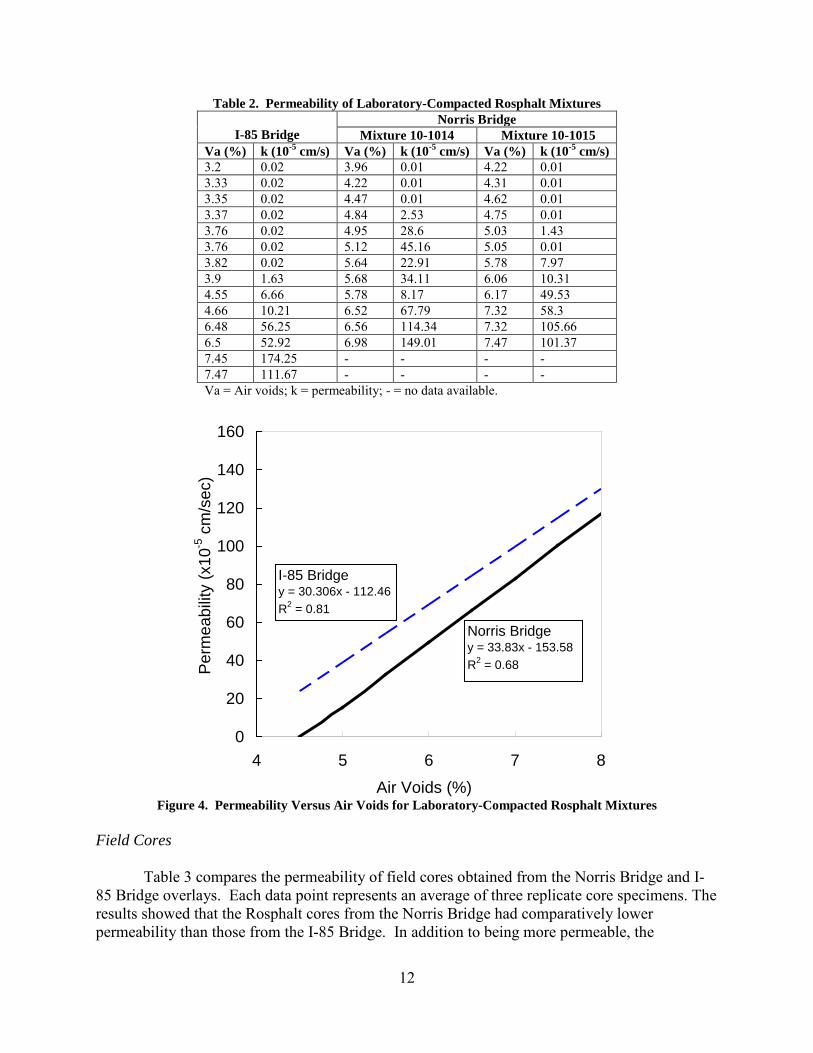
the I-85 Bridge. The job-mix formula gradation requirement limits are shown with the 2 unlabeled thin lines. Core Density The in-place air voids results reported here were obtained from the quality control / quality assurance data for the respective projects. The number of cores used to estimate density varied depending on the project: five cores were used on the Norris Bridge Rosphalt sections, and two cores were used on the I-85 Rosphalt sections. Based on data from these cores, the average in-place density was 97.6% for the Norris Bridge sections and 95.4% for the I-85 Bridge sections. The specified minimum in-place density was 97% (equivalent to 3% air voids), as indicated in Appendix A. Permeability Laboratory-Compacted Mixtures Table 2 shows permeability results obtained by testing laboratory-compacted Rosphalt mixtures from the I-85 Bridge and Norris Bridge. As can be seen in Table 2, the permeability of the Norris Bridge mixtures obtained on the two separate days was not significantly different; therefore, test results were combined for statistical analysis purposes. The results were plotted and fitted with regression models to determine the permeability of the specimens at 7.5% air voids (Figure 4). The results showed that the permeability of the Rosphalt mixtures was 115 and 100 x 10-5 cm/s for the I-85 Bridge and Norris Bridge, respectively. The results showed the Rosphalt mixtures appeared to comply with the 150 x 10-5 cm/s specification for regular asphalt concrete mixtures.
12
Table 2. Permeability of Laboratory-Compacted Rosphalt Mixtures
I-85 Bridge Norris Bridge
Mixture 10-1014 Mixture 10-1015 Va (%) k (10-5 cm/s) Va (%) k (10-5 cm/s) Va (%) k (10-5 cm/s) 3.2 0.02 3.96 0.01 4.22 0.01 3.33 0.02 4.22 0.01 4.31 0.01 3.35 0.02 4.47 0.01 4.62 0.01 3.37 0.02 4.84 2.53 4.75 0.01 3.76 0.02 4.95 28.6 5.03 1.43 3.76 0.02 5.12 45.16 5.05 0.01 3.82 0.02 5.64 22.91 5.78 7.97 3.9 1.63 5.68 34.11 6.06 10.31 4.55 6.66 5.78 8.17 6.17 49.53 4.66 10.21 6.52 67.79 7.32 58.3 6.48 56.25 6.56 114.34 7.32 105.66 6.5 52.92 6.98 149.01 7.47 101.37 7.45 174.25 - - - - 7.47 111.67 - - - - Va = Air voids; k = permeability; - = no data available.
0
20
40
60
80
100
120
140
160
4 5 6 7 8Air Voids (%)
Per
mea
bilit
y (x
10-5
cm
/sec
)
Norris Bridgey = 33.83x - 153.58R2 = 0.68
I-85 Bridgey = 30.306x - 112.46R2 = 0.81
Figure 4. Permeability Versus Air Voids for Laboratory-Compacted Rosphalt Mixtures
Field Cores
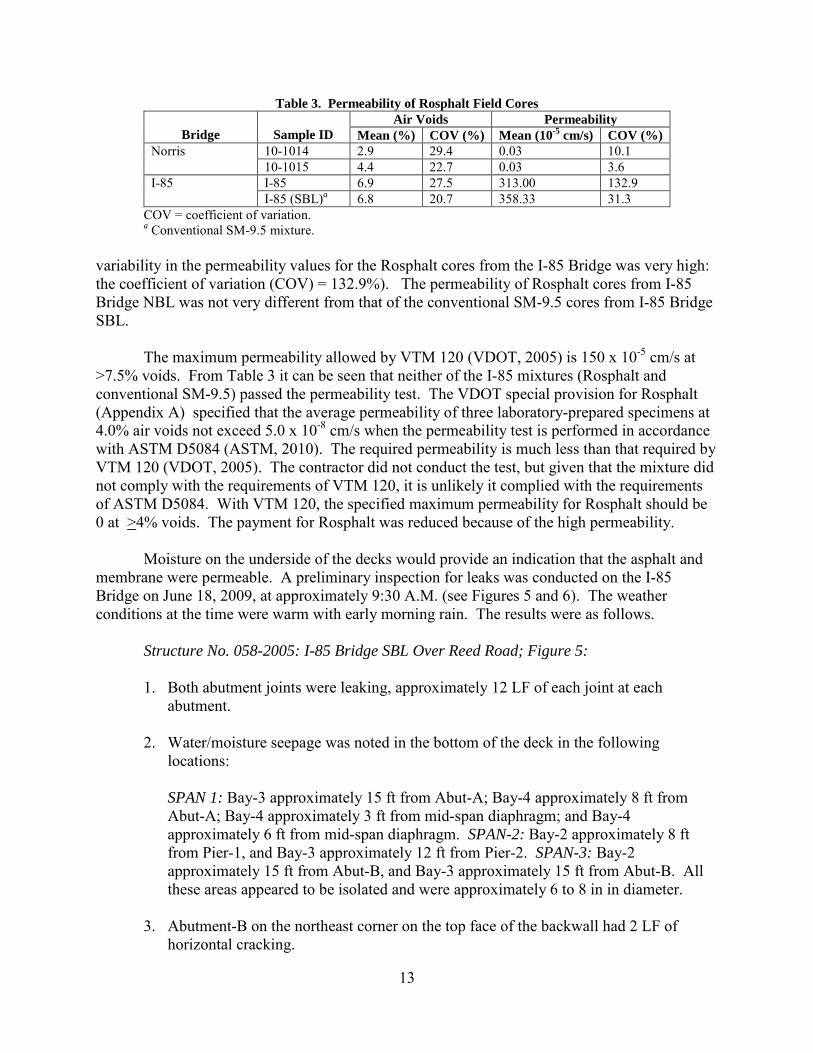
Table 3 compares the permeability of field cores obtained from the Norris Bridge and I-85 Bridge overlays. Each data point represents an average of three replicate core specimens. The results showed that the Rosphalt cores from the Norris Bridge had comparatively lower permeability than those from the I-85 Bridge. In addition to being more permeable, the
13
Table 3. Permeability of Rosphalt Field Cores
Bridge
Sample ID Air Voids Permeability
Mean (%) COV (%) Mean (10-5 cm/s) COV (%) Norris 10-1014 2.9 29.4 0.03 10.1
10-1015 4.4 22.7 0.03 3.6 I-85 I-85 6.9 27.5 313.00 132.9
I-85 (SBL)a 6.8 20.7 358.33 31.3 COV = coefficient of variation.
a Conventional SM-9.5 mixture. variability in the permeability values for the Rosphalt cores from the I-85 Bridge was very high: the coefficient of variation (COV) = 132.9%). The permeability of Rosphalt cores from I-85 Bridge NBL was not very different from that of the conventional SM-9.5 cores from I-85 Bridge SBL.
The maximum permeability allowed by VTM 120 (VDOT, 2005) is 150 x 10-5 cm/s at
>7.5% voids. From Table 3 it can be seen that neither of the I-85 mixtures (Rosphalt and conventional SM-9.5) passed the permeability test. The VDOT special provision for Rosphalt (Appendix A) specified that the average permeability of three laboratory-prepared specimens at 4.0% air voids not exceed 5.0 x 10⁻⁸ cm/s when the permeability test is performed in accordance with ASTM D5084 (ASTM, 2010). The required permeability is much less than that required by VTM 120 (VDOT, 2005). The contractor did not conduct the test, but given that the mixture did not comply with the requirements of VTM 120, it is unlikely it complied with the requirements of ASTM D5084. With VTM 120, the specified maximum permeability for Rosphalt should be 0 at >4% voids. The payment for Rosphalt was reduced because of the high permeability. Moisture on the underside of the decks would provide an indication that the asphalt and membrane were permeable. A preliminary inspection for leaks was conducted on the I-85 Bridge on June 18, 2009, at approximately 9:30 A.M. (see Figures 5 and 6). The weather conditions at the time were warm with early morning rain. The results were as follows.
Structure No. 058-2005: I-85 Bridge SBL Over Reed Road; Figure 5:
1. Both abutment joints were leaking, approximately 12 LF of each joint at each abutment.
2. Water/moisture seepage was noted in the bottom of the deck in the following
locations: SPAN 1: Bay-3 approximately 15 ft from Abut-A; Bay-4 approximately 8 ft from Abut-A; Bay-4 approximately 3 ft from mid-span diaphragm; and Bay-4 approximately 6 ft from mid-span diaphragm. SPAN-2: Bay-2 approximately 8 ft from Pier-1, and Bay-3 approximately 12 ft from Pier-2. SPAN-3: Bay-2 approximately 15 ft from Abut-B, and Bay-3 approximately 15 ft from Abut-B. All these areas appeared to be isolated and were approximately 6 to 8 in in diameter.
3. Abutment-B on the northeast corner on the top face of the backwall had 2 LF of
horizontal cracking.
14
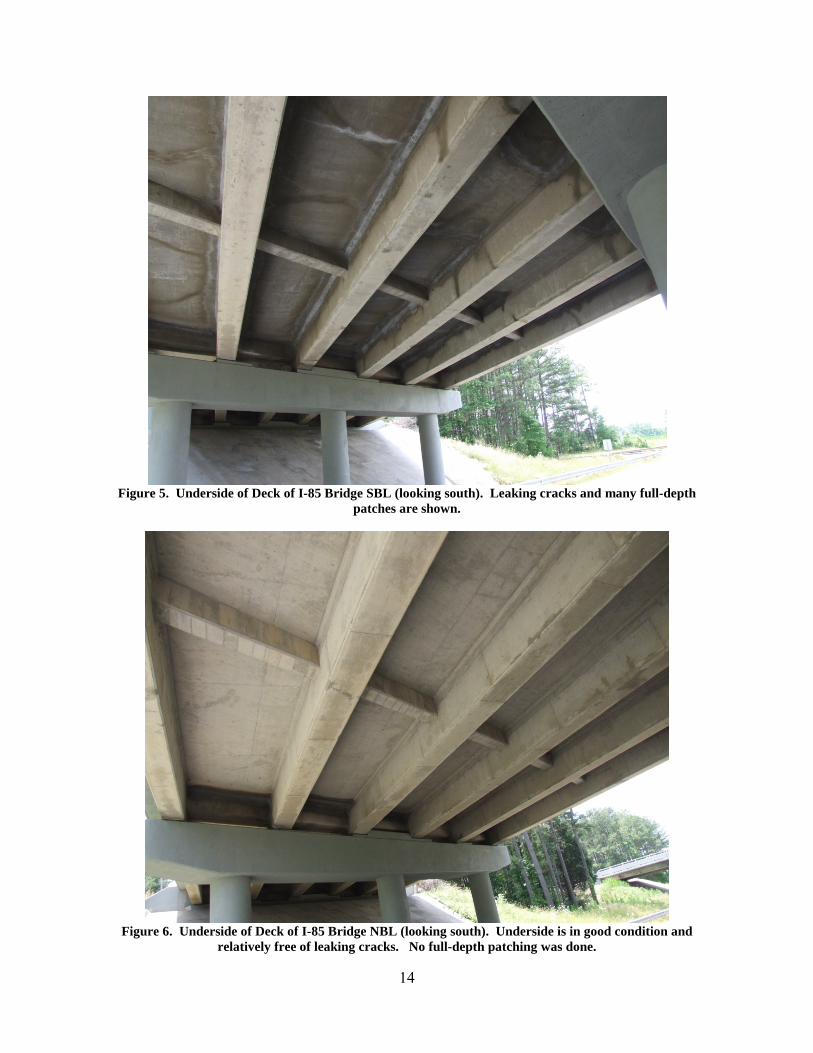
Figure 5. Underside of Deck of I-85 Bridge SBL (looking south). Leaking cracks and many full-depth
patches are shown.
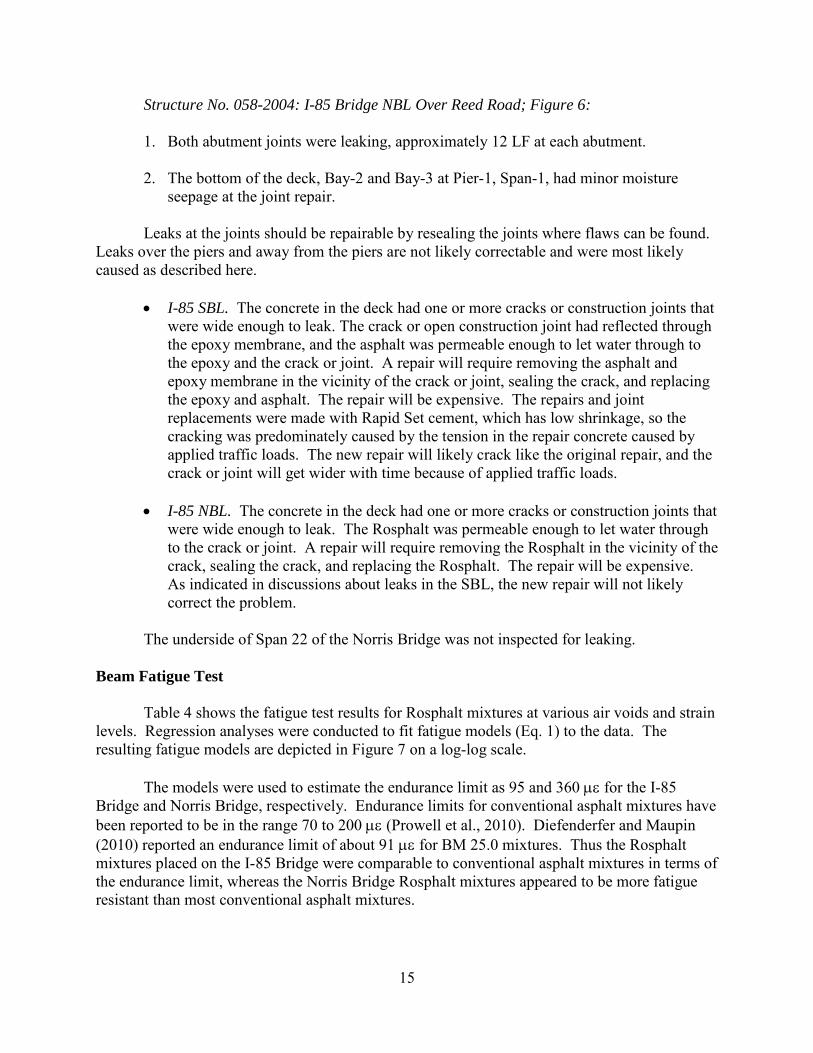
Figure 6. Underside of Deck of I-85 Bridge NBL (looking south). Underside is in good condition and
relatively free of leaking cracks. No full-depth patching was done.
15
Structure No. 058-2004: I-85 Bridge NBL Over Reed Road; Figure 6:
1. Both abutment joints were leaking, approximately 12 LF at each abutment. 2. The bottom of the deck, Bay-2 and Bay-3 at Pier-1, Span-1, had minor moisture
seepage at the joint repair. Leaks at the joints should be repairable by resealing the joints where flaws can be found. Leaks over the piers and away from the piers are not likely correctable and were most likely caused as described here.
• I-85 SBL. The concrete in the deck had one or more cracks or construction joints that were wide enough to leak. The crack or open construction joint had reflected through the epoxy membrane, and the asphalt was permeable enough to let water through to the epoxy and the crack or joint. A repair will require removing the asphalt and epoxy membrane in the vicinity of the crack or joint, sealing the crack, and replacing the epoxy and asphalt. The repair will be expensive. The repairs and joint replacements were made with Rapid Set cement, which has low shrinkage, so the cracking was predominately caused by the tension in the repair concrete caused by applied traffic loads. The new repair will likely crack like the original repair, and the crack or joint will get wider with time because of applied traffic loads.
• I-85 NBL. The concrete in the deck had one or more cracks or construction joints that
were wide enough to leak. The Rosphalt was permeable enough to let water through to the crack or joint. A repair will require removing the Rosphalt in the vicinity of the crack, sealing the crack, and replacing the Rosphalt. The repair will be expensive. As indicated in discussions about leaks in the SBL, the new repair will not likely correct the problem.
The underside of Span 22 of the Norris Bridge was not inspected for leaking.
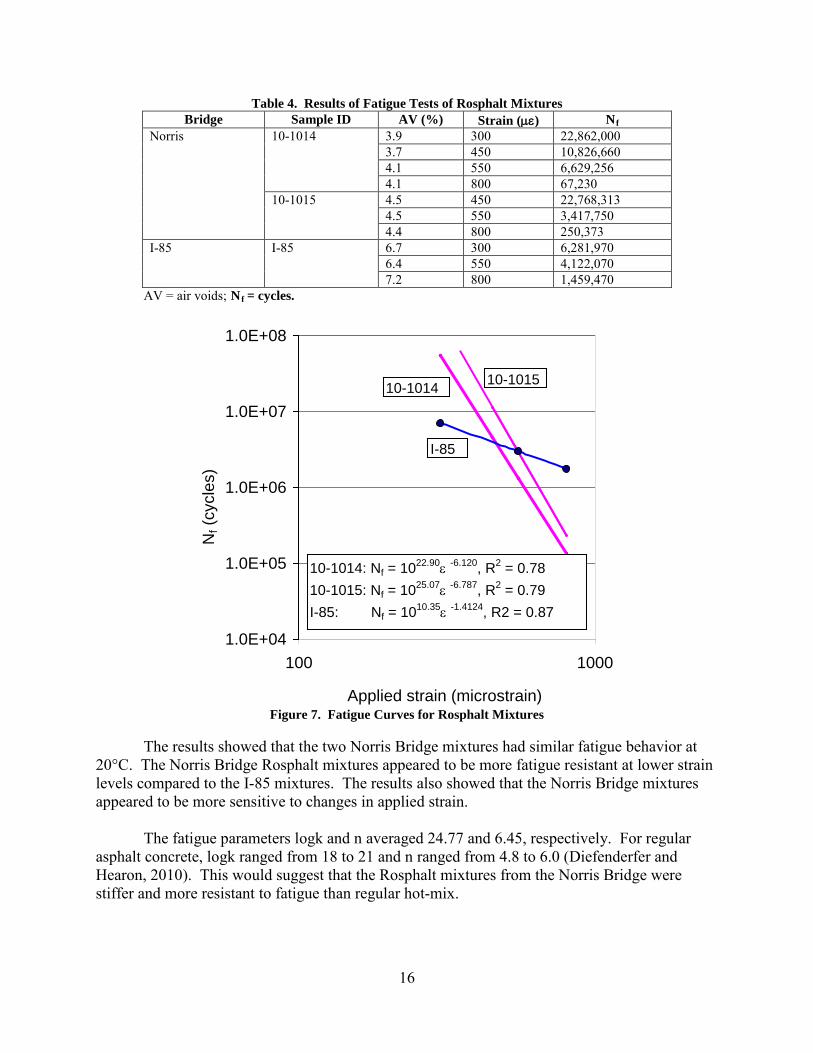
Beam Fatigue Test Table 4 shows the fatigue test results for Rosphalt mixtures at various air voids and strain levels. Regression analyses were conducted to fit fatigue models (Eq. 1) to the data. The resulting fatigue models are depicted in Figure 7 on a log-log scale. The models were used to estimate the endurance limit as 95 and 360 µε for the I-85 Bridge and Norris Bridge, respectively. Endurance limits for conventional asphalt mixtures have been reported to be in the range 70 to 200 µε (Prowell et al., 2010). Diefenderfer and Maupin (2010) reported an endurance limit of about 91 µε for BM 25.0 mixtures. Thus the Rosphalt mixtures placed on the I-85 Bridge were comparable to conventional asphalt mixtures in terms of the endurance limit, whereas the Norris Bridge Rosphalt mixtures appeared to be more fatigue resistant than most conventional asphalt mixtures.
16
Table 4. Results of Fatigue Tests of Rosphalt Mixtures Bridge Sample ID AV (%) Strain (µε) Nf
Norris 10-1014 3.9 300 22,862,000 3.7 450 10,826,660 4.1 550 6,629,256 4.1 800 67,230
10-1015 4.5 450 22,768,313 4.5 550 3,417,750 4.4 800 250,373
I-85 I-85 6.7 300 6,281,970 6.4 550 4,122,070 7.2 800 1,459,470
AV = air voids; Nf = cycles.
1.0E+04
1.0E+05
1.0E+06
1.0E+07
1.0E+08
100 1000
Applied strain (microstrain)
Nf (
cycl
es)
10-1014: Nf = 1022.90ε -6.120, R2 = 0.7810-1015: Nf = 1025.07ε -6.787, R2 = 0.79I-85: Nf = 1010.35ε -1.4124, R2 = 0.87
I-85
10-101510-1014
Figure 7. Fatigue Curves for Rosphalt Mixtures
The results showed that the two Norris Bridge mixtures had similar fatigue behavior at 20°C. The Norris Bridge Rosphalt mixtures appeared to be more fatigue resistant at lower strain levels compared to the I-85 mixtures. The results also showed that the Norris Bridge mixtures appeared to be more sensitive to changes in applied strain. The fatigue parameters logk and n averaged 24.77 and 6.45, respectively. For regular asphalt concrete, logk ranged from 18 to 21 and n ranged from 4.8 to 6.0 (Diefenderfer and Hearon, 2010). This would suggest that the Rosphalt mixtures from the Norris Bridge were stiffer and more resistant to fatigue than regular hot-mix.

17
The results for the I-85 Bridge suggest the mixture is relatively softer and has significantly different fatigue characteristics than for the Norris Bridge mixtures. The I-85 mixtures do not, however, appear to be as sensitive to applied strain. APA Rut Test The measured rut depth after 8,000 cycles averaged about 0.54 mm with a COV of about 22.6%. The results indicated Rosphalt mixtures from the Norris Bridge could be considered to have high resistance to rutting compared to conventional SM-9.5 mixtures. Flow Number Test Figure 8 shows sample plots of permanent strain versus number of load cycles obtained for the Norris Bridge Rosphalt mixtures (bottom curve) during the FN test. The results showed that with a computed FN for Rosphalt greater than 10,000 cycles and an accumulated strain of less than 1%, the Norris Bridge mixtures should be expected to be rut resistant. The plot for permanent strain versus number of load cycles for a sample of surface mixture is also shown for comparison. As can be seen, the FN for this SM-9.5 mixture is only 3,257 cycles. The FN results suggested the Rosphalt mixtures used on the Norris Bridge could be considered rut resistant compared to the SM-9.5 mixtures, which agrees with the APA test results previously shown.
0
5000
10000
15000
20000
25000
0 5000 10000 15000
No. of cycles
Stra
in (m
icro
stra
in)
10-1014: FN >10,000
SM 9.5D: FN = 3257
Figure 8. Rutting Resistance of Rosphalt Mixtures Using Flow Number (FN) Test
Bond Tests Three 2.25-in-diameter cores were taken from the shoulder of each I-85 bridge on June 23, 2009, to be tested for bond strength within several days. Tests could not be done because the
18
asphalt debonded from the concrete on I-85 Bridge NBL and from the membrane on I-85 Bridge SBL during coring. Debonding during coring is typically associated with bond strengths of less than 50 psi.
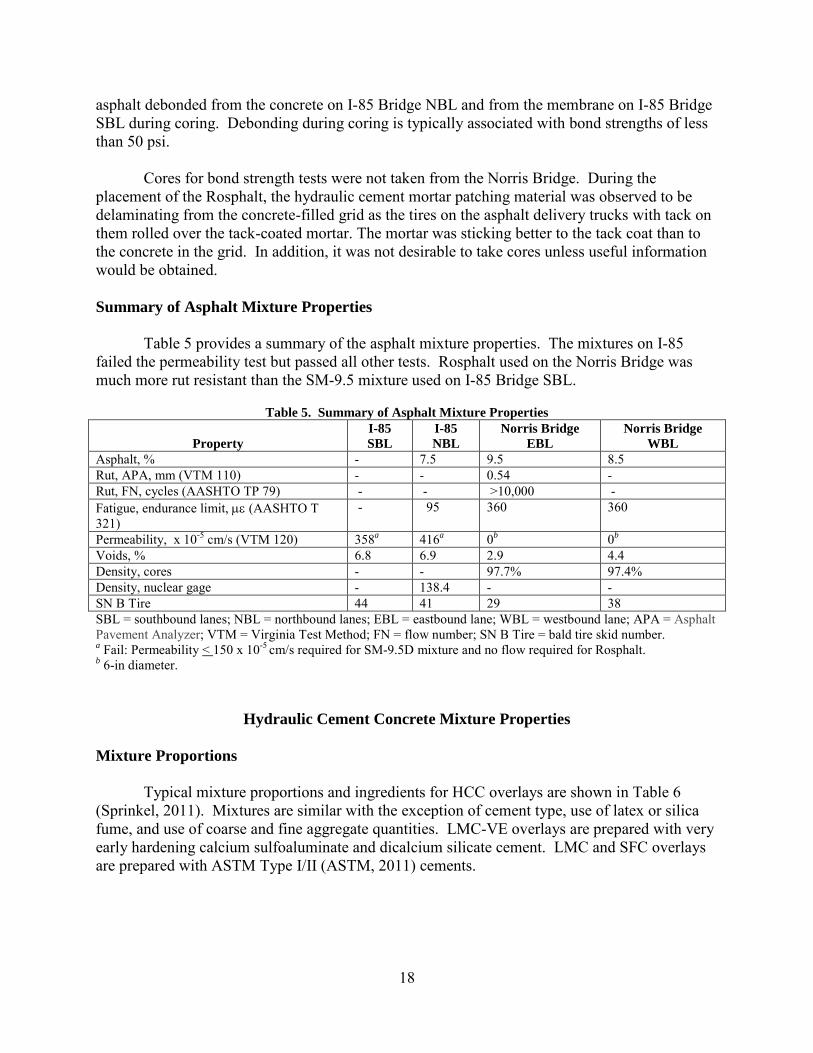
Cores for bond strength tests were not taken from the Norris Bridge. During the placement of the Rosphalt, the hydraulic cement mortar patching material was observed to be delaminating from the concrete-filled grid as the tires on the asphalt delivery trucks with tack on them rolled over the tack-coated mortar. The mortar was sticking better to the tack coat than to the concrete in the grid. In addition, it was not desirable to take cores unless useful information would be obtained. Summary of Asphalt Mixture Properties Table 5 provides a summary of the asphalt mixture properties. The mixtures on I-85 failed the permeability test but passed all other tests. Rosphalt used on the Norris Bridge was much more rut resistant than the SM-9.5 mixture used on I-85 Bridge SBL.
Table 5. Summary of Asphalt Mixture Properties
Property
I-85 SBL
I-85 NBL
Norris Bridge EBL
Norris Bridge WBL
Asphalt, % - 7.5 9.5 8.5 Rut, APA, mm (VTM 110) - - 0.54 - Rut, FN, cycles (AASHTO TP 79) - - >10,000 - Fatigue, endurance limit, µε (AASHTO T 321)
- 95 360 360
Permeability, x 10-5 cm/s (VTM 120) 358a 416a 0b 0b Voids, % 6.8 6.9 2.9 4.4 Density, cores - - 97.7% 97.4% Density, nuclear gage - 138.4 - - SN B Tire 44 41 29 38 SBL = southbound lanes; NBL = northbound lanes; EBL = eastbound lane; WBL = westbound lane; APA = Asphalt Pavement Analyzer; VTM = Virginia Test Method; FN = flow number; SN B Tire = bald tire skid number. a Fail: Permeability < 150 x 10-5 cm/s required for SM-9.5D mixture and no flow required for Rosphalt. b 6-in diameter.
Hydraulic Cement Concrete Mixture Properties
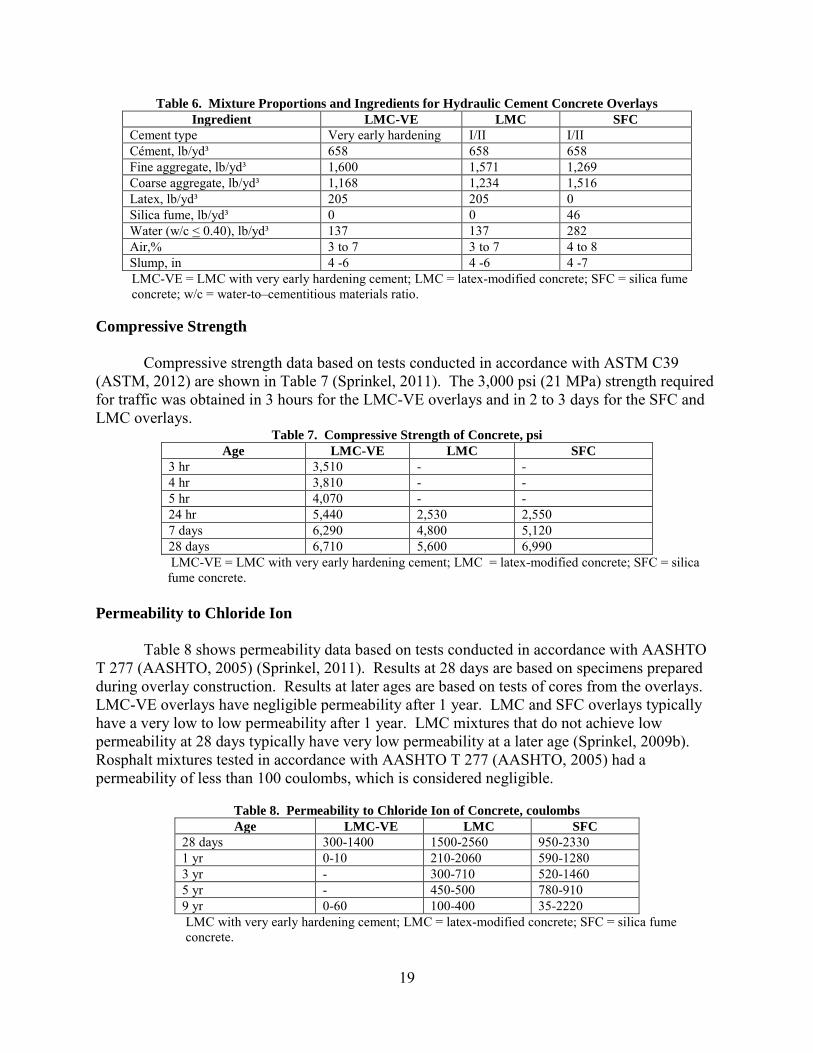
Mixture Proportions Typical mixture proportions and ingredients for HCC overlays are shown in Table 6 (Sprinkel, 2011). Mixtures are similar with the exception of cement type, use of latex or silica fume, and use of coarse and fine aggregate quantities. LMC-VE overlays are prepared with very early hardening calcium sulfoaluminate and dicalcium silicate cement. LMC and SFC overlays are prepared with ASTM Type I/II (ASTM, 2011) cements.
19
Table 6. Mixture Proportions and Ingredients for Hydraulic Cement Concrete Overlays Ingredient LMC-VE LMC SFC
Cement type Very early hardening I/II I/II Cément, lb/yd³ 658 658 658 Fine aggregate, lb/yd³ 1,600 1,571 1,269 Coarse aggregate, lb/yd³ 1,168 1,234 1,516 Latex, lb/yd³ 205 205 0 Silica fume, lb/yd³ 0 0 46 Water (w/c < 0.40), lb/yd³ 137 137 282 Air,% 3 to 7 3 to 7 4 to 8 Slump, in 4 -6 4 -6 4 -7 LMC-VE = LMC with very early hardening cement; LMC = latex-modified concrete; SFC = silica fume concrete; w/c = water-to–cementitious materials ratio.
Compressive Strength Compressive strength data based on tests conducted in accordance with ASTM C39 (ASTM, 2012) are shown in Table 7 (Sprinkel, 2011). The 3,000 psi (21 MPa) strength required for traffic was obtained in 3 hours for the LMC-VE overlays and in 2 to 3 days for the SFC and LMC overlays.
Table 7. Compressive Strength of Concrete, psi Age LMC-VE LMC SFC
3 hr 3,510 - - 4 hr 3,810 - - 5 hr 4,070 - - 24 hr 5,440 2,530 2,550 7 days 6,290 4,800 5,120 28 days 6,710 5,600 6,990 LMC-VE = LMC with very early hardening cement; LMC = latex-modified concrete; SFC = silica fume concrete.
Permeability to Chloride Ion Table 8 shows permeability data based on tests conducted in accordance with AASHTO T 277 (AASHTO, 2005) (Sprinkel, 2011). Results at 28 days are based on specimens prepared during overlay construction. Results at later ages are based on tests of cores from the overlays. LMC-VE overlays have negligible permeability after 1 year. LMC and SFC overlays typically have a very low to low permeability after 1 year. LMC mixtures that do not achieve low permeability at 28 days typically have very low permeability at a later age (Sprinkel, 2009b). Rosphalt mixtures tested in accordance with AASHTO T 277 (AASHTO, 2005) had a permeability of less than 100 coulombs, which is considered negligible.
Table 8. Permeability to Chloride Ion of Concrete, coulombs Age LMC-VE LMC SFC
28 days 300-1400 1500-2560 950-2330 1 yr 0-10 210-2060 590-1280 3 yr - 300-710 520-1460 5 yr - 450-500 780-910 9 yr 0-60 100-400 35-2220 LMC with very early hardening cement; LMC = latex-modified concrete; SFC = silica fume concrete.
20
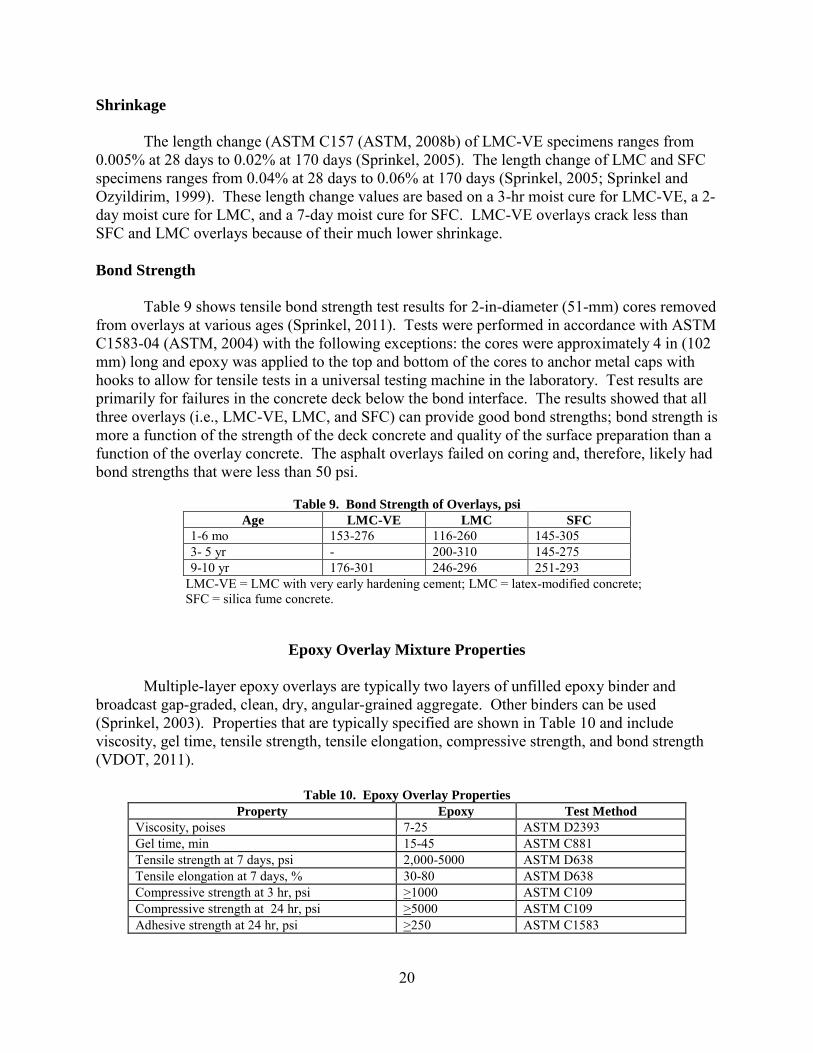
Shrinkage The length change (ASTM C157 (ASTM, 2008b) of LMC-VE specimens ranges from 0.005% at 28 days to 0.02% at 170 days (Sprinkel, 2005). The length change of LMC and SFC specimens ranges from 0.04% at 28 days to 0.06% at 170 days (Sprinkel, 2005; Sprinkel and Ozyildirim, 1999). These length change values are based on a 3-hr moist cure for LMC-VE, a 2-day moist cure for LMC, and a 7-day moist cure for SFC. LMC-VE overlays crack less than SFC and LMC overlays because of their much lower shrinkage. Bond Strength
Table 9 shows tensile bond strength test results for 2-in-diameter (51-mm) cores removed from overlays at various ages (Sprinkel, 2011). Tests were performed in accordance with ASTM C1583-04 (ASTM, 2004) with the following exceptions: the cores were approximately 4 in (102 mm) long and epoxy was applied to the top and bottom of the cores to anchor metal caps with hooks to allow for tensile tests in a universal testing machine in the laboratory. Test results are primarily for failures in the concrete deck below the bond interface. The results showed that all three overlays (i.e., LMC-VE, LMC, and SFC) can provide good bond strengths; bond strength is more a function of the strength of the deck concrete and quality of the surface preparation than a function of the overlay concrete. The asphalt overlays failed on coring and, therefore, likely had bond strengths that were less than 50 psi.
Table 9. Bond Strength of Overlays, psi
Age LMC-VE LMC SFC 1-6 mo 153-276 116-260 145-305 3- 5 yr - 200-310 145-275 9-10 yr 176-301 246-296 251-293
LMC-VE = LMC with very early hardening cement; LMC = latex-modified concrete; SFC = silica fume concrete.
Epoxy Overlay Mixture Properties Multiple-layer epoxy overlays are typically two layers of unfilled epoxy binder and broadcast gap-graded, clean, dry, angular-grained aggregate. Other binders can be used (Sprinkel, 2003). Properties that are typically specified are shown in Table 10 and include viscosity, gel time, tensile strength, tensile elongation, compressive strength, and bond strength (VDOT, 2011).
Table 10. Epoxy Overlay Properties Property Epoxy Test Method
Viscosity, poises 7-25 ASTM D2393 Gel time, min 15-45 ASTM C881 Tensile strength at 7 days, psi 2,000-5000 ASTM D638 Tensile elongation at 7 days, % 30-80 ASTM D638 Compressive strength at 3 hr, psi >1000 ASTM C109 Compressive strength at 24 hr, psi >5000 ASTM C109 Adhesive strength at 24 hr, psi >250 ASTM C1583

21
Skid Resistance Table 11 shows indicators of skid resistance (ASTM E524) (ASTM, 2008a). Bald tire tests (ASTM E524) (ASTM, 2008a) done at an early age on overlay surfaces with the VDOT skid trailer indicated similar numbers for the I-85 overlays (tested on July 19, 2010) and the Rosphalt overlay on the Norris Bridge (tested July 20, 2010)—with two exceptions, i.e., the I-85 southbound passing lane (SBPL) and the Norris Bridge EBL. The Rosphalt overlay on the Norris Bridge EBL had a much higher binder content than on I-85, causing the lower number. The I-85 SBPL had the highest number. The GripTester indicated that the LMC overlay on the Norris Bridge had a 33% higher friction number than the Rosphalt. Details of the GripTester testing are provided in Appendix D. HCC overlays typically have a bald tire skid number of 45 to 53 (Sprinkel, 2009a). By correlation, the LMC overlay on the Norris Bridge would have a skid number of about 43, which is close to the lower end of the range for HCC overlays. New polymer concrete overlays typically have a bald tire skid number of 50 to 60 (ASTM E524). The skid number of polymer concrete is usually in the 30s or 40s after 15 to 20 years in service (Sprinkel, 2003). Acceptable numbers are typically maintained throughout the life of the overlay. Although epoxy overlays have the highest skid numbers at an early age, the numbers are similar to those for asphalt at a later age. HCC overlays have the highest skid numbers, of which the tined texture is the most significant factor. The gap-graded aggregate is the significant factor for epoxy overlays.
Table 11. Skid and Friction Numbers of Asphalt Overlays
Test I-85 SBL I-85 NBL Norris Bridge EBL Norris Bridge WBL VDOT, Bald Tire (TL, PL) 39, 49 40, 42 29 38 VT GripTester, Rosphalt - - 0.63 0.62 VT GripTester, LMC - - 0.82 0.78 SBL = southbound lanes; NBL = northbound lanes; EBL = eastbound lane; WBL = westbound lane; LMC = latex-modified concrete.
Construction Costs Asphalt Overlays Based on the low bid, the costs of the Rosphalt and the SM-9.5 + membrane were as follows:
• I-85 Bridge SBL: SM-9.5 at $265/ton = $28/yd2 (2-in thick) + $30/yd2 (membrane) = $58/yd2
• I-85 Bridge NBL: Rosphalt at $1,125/ton = $121/yd2 (2-in thick) (reduced payment for high permeability at $843.75/ton = $90.75/yd2)
• Norris Bridge: Rosphalt at $2,000/ton = $218/yd2 (2-in thick) (total project cost = $490/yd2).
22
Based on these costs, Rosphalt is a very expensive method for placing a wearing and protection system on a bridge deck. Prior to advertising the Norris Bridge project, the staff of VDOT’s Fredericksburg District did an LCCA using RealCost Ver. 2.2 that compared the three options of Rosphalt, SM-9.5 + membrane, and LMC-VE for replacing the entire LMC overlay. They used quantity data provided in a consultant report (Whitman, Requardt & Associates, 2008). They assumed an average service life of 16, 10, and 25 years for Rosphalt, SM-9.5 + membrane, and LMC-VE, respectively. Costs were calculated for a 40-year life. The results for total cost (overlay + miscellaneous + traffic control) using the indicated unit costs for the overlay systems were as follows:
• Rosphalt at $490/ton = $6,335,260. • SM-9.5E at $180/ton + membrane at $50/yd2 = $7,251,230. • LMC-VE at $111/yd2 (2 to 2.5 in) and $126/yd2 (3 to 3.5 in) = $9,541,950.
The analysis indicated Rosphalt as the lowest cost option. If the Rosphalt could be procured for the cost used in the analysis, it would be the lowest cost option. If the I-85 bid amounts are used for the Norris Bridge, the Rosphalt option would cost an additional $3,149,965, or approximately $9,485,225, which is similar to the cost of LMC-VE. If the I-85 bid amounts are used for the Norris Bridge, the SM-9.5E option would cost an additional $420,325, or approximately $7,671,555, which would be the lowest cost option. As mentioned previously with regard to overlay construction, the latex overlay was milled within 0.5 in of the top of the grid in 2 days. Small impact hammers were used to remove the 0.5 in of overlay that was bonded. Areas with delaminated overlay typically had low areas (cups) in the grid. The cups in the grid were filled with a rapid-hardening mortar. Approximately 6 weeks was required to remove the bottom 0.5 in of the well-bonded areas of overlay. The delaminated sections were easily removed. As indicated in Appendix A, the cost to remove the well-bonded bottom 0.5 in of the overlay and to patch the cups in the grid was $207,937, which is 76% of the cost of the Rosphalt. Major savings in construction and road user costs can be achieved by leaving the well-bonded lower 0.5 in of the LMC overlay in place and not patching the cups. Eliminating the patching is recommended because during the placement of the Rosphalt, the hydraulic cement mortar patching material was observed to be delaminating from the concrete-filled grid as the tires on the asphalt delivery trucks with tack on them rolled over the tack-coated mortar. The mortar was sticking better to the tack coat than to the concrete in the grid. It is not easy to cure a thin mortar, and without a good cure, the quality of the mortar is poor and likely provides for lower bond strength than the grit-blasted concrete in the grid. HCC and Epoxy Overlays
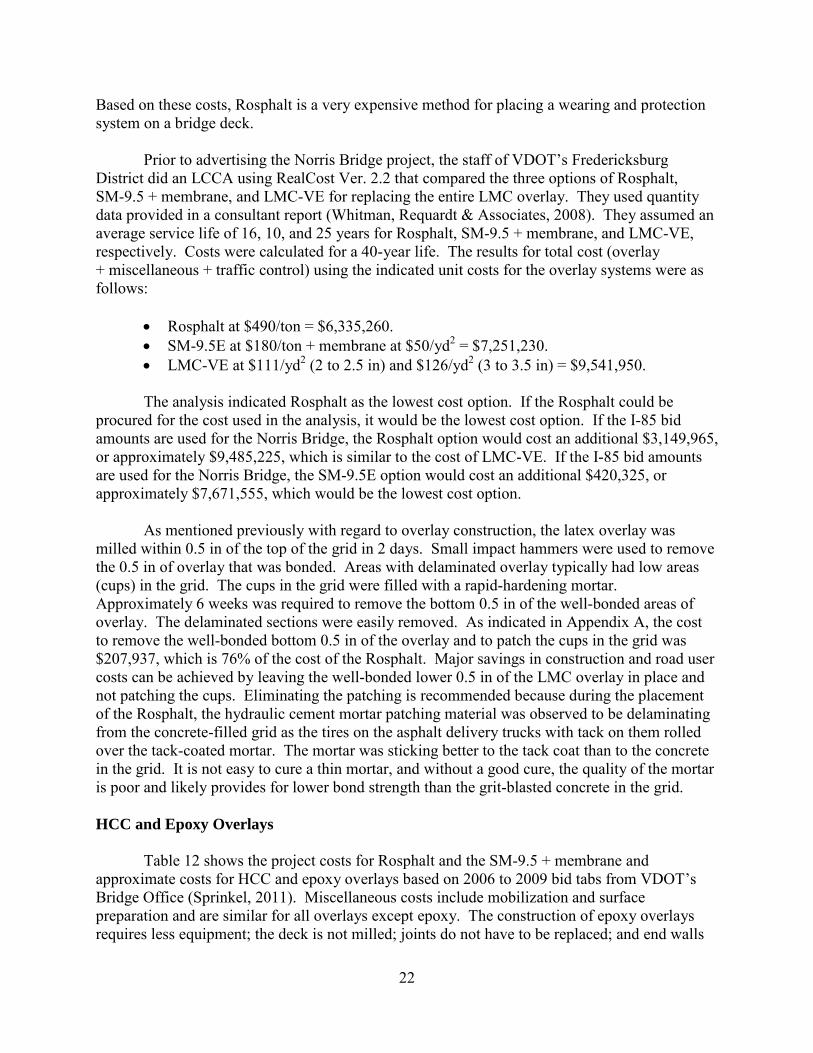
Table 12 shows the project costs for Rosphalt and the SM-9.5 + membrane and approximate costs for HCC and epoxy overlays based on 2006 to 2009 bid tabs from VDOT’s Bridge Office (Sprinkel, 2011). Miscellaneous costs include mobilization and surface preparation and are similar for all overlays except epoxy. The construction of epoxy overlays requires less equipment; the deck is not milled; joints do not have to be replaced; and end walls
23
Table 12. Comparative Costs of Different Overlays, $/yd²
Cost Item
Rosphalt SM-9.5 +
Membrane
LMC-VE
LMC
SFC
Epoxy Overlay 121- 218 58 90 83 75 30 Miscellaneous 32 32 32 32 32 16 Traffic 13 19 28 44 44 13 Total 166-263 109 150 159 151 59 Life, yr 15 10 30 30 30 15 Life cycle costs 332-526 255 150 159 151 118
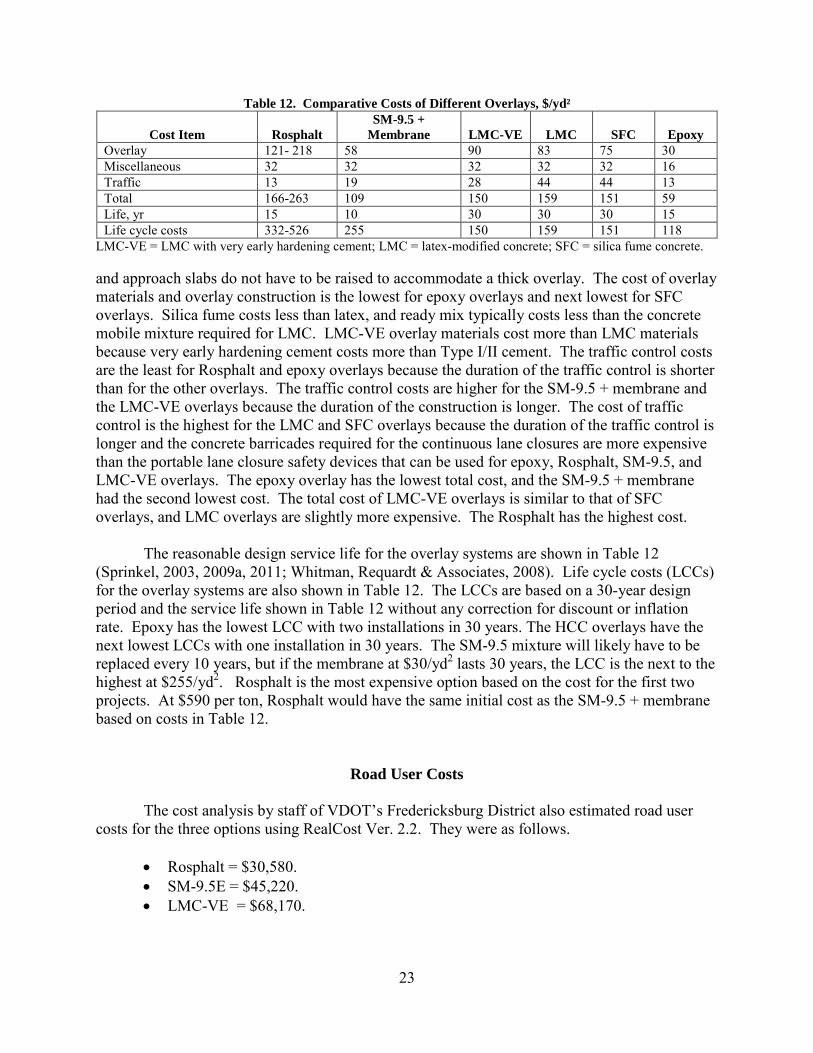
LMC-VE = LMC with very early hardening cement; LMC = latex-modified concrete; SFC = silica fume concrete. and approach slabs do not have to be raised to accommodate a thick overlay. The cost of overlay materials and overlay construction is the lowest for epoxy overlays and next lowest for SFC overlays. Silica fume costs less than latex, and ready mix typically costs less than the concrete mobile mixture required for LMC. LMC-VE overlay materials cost more than LMC materials because very early hardening cement costs more than Type I/II cement. The traffic control costs are the least for Rosphalt and epoxy overlays because the duration of the traffic control is shorter than for the other overlays. The traffic control costs are higher for the SM-9.5 + membrane and the LMC-VE overlays because the duration of the construction is longer. The cost of traffic control is the highest for the LMC and SFC overlays because the duration of the traffic control is longer and the concrete barricades required for the continuous lane closures are more expensive than the portable lane closure safety devices that can be used for epoxy, Rosphalt, SM-9.5, and LMC-VE overlays. The epoxy overlay has the lowest total cost, and the SM-9.5 + membrane had the second lowest cost. The total cost of LMC-VE overlays is similar to that of SFC overlays, and LMC overlays are slightly more expensive. The Rosphalt has the highest cost. The reasonable design service life for the overlay systems are shown in Table 12 (Sprinkel, 2003, 2009a, 2011; Whitman, Requardt & Associates, 2008). Life cycle costs (LCCs) for the overlay systems are also shown in Table 12. The LCCs are based on a 30-year design period and the service life shown in Table 12 without any correction for discount or inflation rate. Epoxy has the lowest LCC with two installations in 30 years. The HCC overlays have the next lowest LCCs with one installation in 30 years. The SM-9.5 mixture will likely have to be replaced every 10 years, but if the membrane at $30/yd2 lasts 30 years, the LCC is the next to the highest at $255/yd2. Rosphalt is the most expensive option based on the cost for the first two projects. At $590 per ton, Rosphalt would have the same initial cost as the SM-9.5 + membrane based on costs in Table 12.
Road User Costs The cost analysis by staff of VDOT’s Fredericksburg District also estimated road user costs for the three options using RealCost Ver. 2.2. They were as follows.
• Rosphalt = $30,580. • SM-9.5E = $45,220. • LMC-VE = $68,170.
24
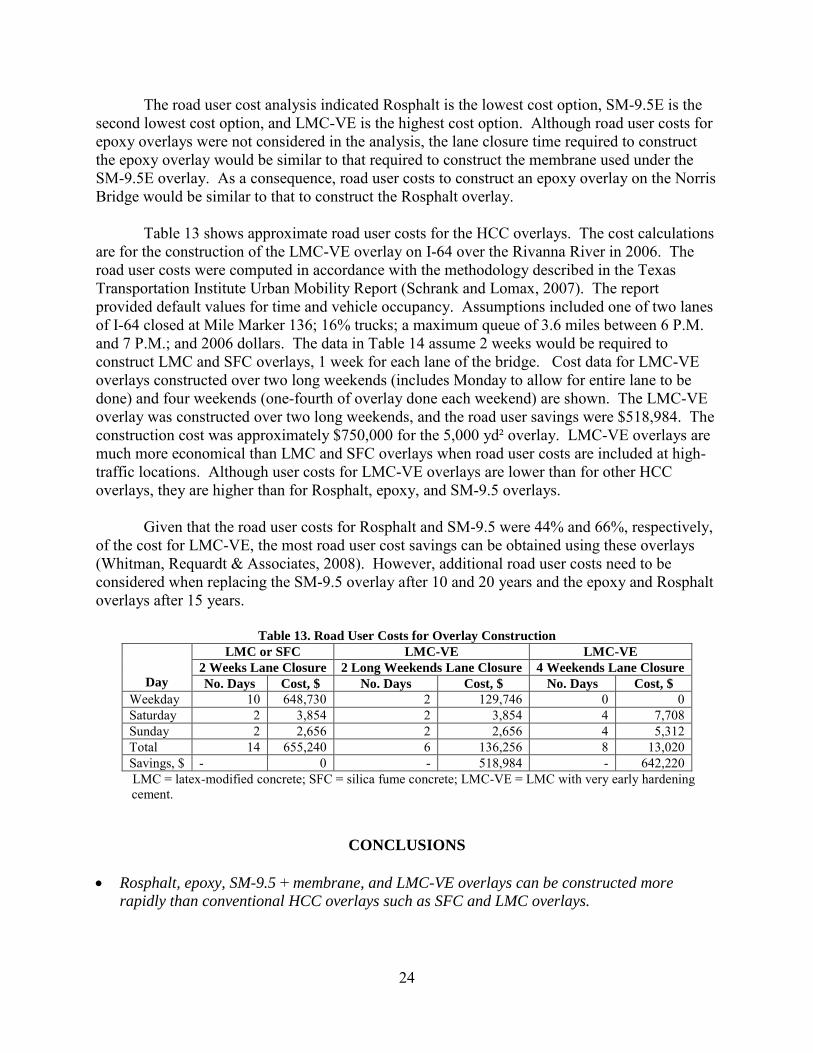
The road user cost analysis indicated Rosphalt is the lowest cost option, SM-9.5E is the second lowest cost option, and LMC-VE is the highest cost option. Although road user costs for epoxy overlays were not considered in the analysis, the lane closure time required to construct the epoxy overlay would be similar to that required to construct the membrane used under the SM-9.5E overlay. As a consequence, road user costs to construct an epoxy overlay on the Norris Bridge would be similar to that to construct the Rosphalt overlay. Table 13 shows approximate road user costs for the HCC overlays. The cost calculations are for the construction of the LMC-VE overlay on I-64 over the Rivanna River in 2006. The road user costs were computed in accordance with the methodology described in the Texas Transportation Institute Urban Mobility Report (Schrank and Lomax, 2007). The report provided default values for time and vehicle occupancy. Assumptions included one of two lanes of I-64 closed at Mile Marker 136; 16% trucks; a maximum queue of 3.6 miles between 6 P.M. and 7 P.M.; and 2006 dollars. The data in Table 14 assume 2 weeks would be required to construct LMC and SFC overlays, 1 week for each lane of the bridge. Cost data for LMC-VE overlays constructed over two long weekends (includes Monday to allow for entire lane to be done) and four weekends (one-fourth of overlay done each weekend) are shown. The LMC-VE overlay was constructed over two long weekends, and the road user savings were $518,984. The construction cost was approximately $750,000 for the 5,000 yd² overlay. LMC-VE overlays are much more economical than LMC and SFC overlays when road user costs are included at high-traffic locations. Although user costs for LMC-VE overlays are lower than for other HCC overlays, they are higher than for Rosphalt, epoxy, and SM-9.5 overlays. Given that the road user costs for Rosphalt and SM-9.5 were 44% and 66%, respectively, of the cost for LMC-VE, the most road user cost savings can be obtained using these overlays (Whitman, Requardt & Associates, 2008). However, additional road user costs need to be considered when replacing the SM-9.5 overlay after 10 and 20 years and the epoxy and Rosphalt overlays after 15 years.
Table 13. Road User Costs for Overlay Construction
Day
LMC or SFC LMC-VE LMC-VE 2 Weeks Lane Closure 2 Long Weekends Lane Closure 4 Weekends Lane Closure No. Days Cost, $ No. Days Cost, $ No. Days Cost, $
Weekday 10 648,730 2 129,746 0 0 Saturday 2 3,854 2 3,854 4 7,708 Sunday 2 2,656 2 2,656 4 5,312 Total 14 655,240 6 136,256 8 13,020 Savings, $ - 0 - 518,984 - 642,220
LMC = latex-modified concrete; SFC = silica fume concrete; LMC-VE = LMC with very early hardening cement.
CONCLUSIONS
• Rosphalt, epoxy, SM-9.5 + membrane, and LMC-VE overlays can be constructed more rapidly than conventional HCC overlays such as SFC and LMC overlays.

25
• The Rosphalt on the Norris Bridge is less permeable and more fatigue and rut resistant than the SM-9.5 mixture on I-85 and should last longer.
• Major savings in construction and road user costs can be achieved on future Norris Bridge
overlay and patching projects by leaving the well-bonded lower 0.5 in of the LMC overlay in place and not patching the cups.
• Based on the first two projects in Virginia, Rosphalt is too expensive compared to the other
overlays discussed in this report to be considered a competitive overlay system.
RECOMMENDATIONS
1. VDOT should not use Rosphalt at the prices reflected by the first two projects. 2. VDOT should seal leaking cracks prior to installing an SM-9.5 + membrane overlay. 3. On future Norris Bridge overlay and patching projects VDOT should not remove the well-
bonded lower 0.5 in of the LMC overlay and should not patch the cups in the grid.
COSTS AND BENEFITS ASSESSMENT
The benefit of this research was the experience gained using Rosphalt as a new alternative wearing and protection system for bridges that can be used with a minimal lane closure time. The Norris Bridge project also provided experience with removing the well-bonded areas of the LMC overlay. Finally, the project provided the opportunity to compare bridge deck wearing and protective systems. The costs of the systems were compared earlier in the report. There would be no cost savings to VDOT by implementing the use of Rosphalt or SM-9.5 + membrane overlays because the systems are more expensive than the epoxy and HCC overlays currently being used.
ACKNOWLEDGMENTS
The authors acknowledge the technical advisory panel members Gary Shelor, Fredericksburg; Gary Martin, Richmond; Bill Bailey, VDOT Materials; and Claude Napier, VDOT Bridge. Thomas Miller, Fredericksburg, oversaw the Norris Bridge project and provided significant input to the project. Richmond District bridge and inspection staff oversaw the I-85 project and provided input to the project. Elko staff and Troy Deeds and Donnie Dodds of VCTIR sampled and tested the asphalt. The road user costs in Table 13 for the HCC overlays were computed by Michael Fontaine of VCTIR. Todd Rorier, VDOT Materials, assisted with the specification development and asphalt testing. George W. Maupin, VCTIR, assisted with the evaluation until his retirement. B. P. Short placed the Rosphalt and SM-9.5 mixture on I-85.

26
Lanford Brothers, Inc., placed an epoxy aggregate waterproof membrane on I-85 Bridge SBL. Lee Hy Paving placed Rosphalt on the Norris Bridge. Review comments from the members of the technical advisory panel and from Trenton Clark of the Virginia Asphalt Association were valuable. The report was edited by Linda Evans.
REFERENCES American Association of State Highway and Transportation Officials. AASHTO T 321:
Standard Method of Test for Determining the Fatigue Life of Compacted Hot-Mix Asphalt (HMA) Subjected to Repeated Flexural Bending. Washington, DC, 2003.
American Association of State Highway and Transportation Officials. AASHTO T 277:
Standard Method of Test for Electrical Indication of Concrete's Ability to Resist Chloride Ion Penetration. Washington, DC, 2005.
American Association of State Highway and Transportation Officials. AASHTO T 27: Standard Method of Test for Sieve Analysis of Fine and Coarse Aggregates. Washington, DC, 2006.
American Association of State Highway and Transportation Officials. AASHTO TP 79:
Standard Method of Test for Determining the Dynamic Modulus and Flow Number for Hot Mix Asphalt (HMA) Using the Asphalt Mixture Performance Tester (AMPT). Washington, DC, 2009.
American Association of State Highway and Transportation Officials. AASHTO T 308:
Standard Method of Test for Determining the Asphalt Binder Content of Hot-Mix Asphalt (HMA) by the Ignition Method. Washington, DC, 2010a.
American Association of State Highway and Transportation Officials. AASHTO T 166:
Standard Method of Test for Bulk Specific Gravity (Gmb) of Compacted Hot Mix Asphalt (HMA) Using Saturated Surface-Dry Specimens. Washington, DC, 2010b.
American Association of State Highway and Transportation Officials. AASHTO T312:
Specification for Preparing and Determining Density of Hot Mix Asphalt (HMA) Specimens by Means of the Superpave Gyratory Compactor. Washington, DC, 2012.
ASTM International. ASTM C1583-04: Standard Test Method for Tensile Strength of Concrete
Surfaces and the Bond Strength or Tensile Strength of Concrete Repair and Overlay Materials by Direct Tension. Philadelphia, 2004.
ASTM International. ASTM E524-08: Specification for Standard Smooth Tire for Pavement
Skid-Resistance Tests. Philadelphia, 2008a.

27
ASTM International. ASTM C157-08: Standard Test Method for Length Change of Hardened Hydraulic-Cement Mortar and Concrete. Philadelphia, 2008b.
ASTM International. ASTM D5084-10: Standard Test Methods for Measurement of Hydraulic
Conductivity of Saturated Porous Materials Using a Flexible Wall Permeameter. Philadelphia, 2010.
ASTM International. ASTM C150-11: Standard Specification for Portland Cement.
Philadelphia, 2011. ASTM International. ASTM C39-12: Standard Test Method for Compressive Strength of
Cylindrical Concrete Specimens. Philadelphia, 2012. Diefenderfer, B.K., and Maupin, G.W. Field Trials of High-Modulus High-Binder-Content Base
Layer Hot-Mix Asphalt Mixtures. VTRC 11-R2. Virginia Transportation Research Council, Charlottesville, 2010.
Diefenderfer, S.D., and Hearon, A.J. Performance of Virginia’s Warm-Mix Asphalt Trial
Sections. VTRC 10-R17. Virginia Transportation Research Council, Charlottesville, 2010.
Maupin, G. W. Examination of an Implemented Asphalt Permeability Specification. VTRC 11-
R7. Virginia Transportation Research Council, Charlottesville, 2010. Prowell, B.D., Brown, E.R., Anderson, R.M., Daniel, J.S., Swamy, A.K., Von Quintus, H., Shen,
S., Carpenter, S.H., Bhattacharjee, S., and Maghsoodloo, S. Validating the Fatigue Endurance Limit for Hot Mix Asphalt. NCHRP Report 646. Transportation Research Board of the National Academies, Washington, DC, 2010.
Russell, H.G. Concrete Bridge Deck Performance. NCHRP Synthesis 333. Transportation
Research Board of the National Academies, Washington, DC, 2004. Schrank, D., and Lomax, T. The 2007 Urban Mobility Report. Texas Transportation Institute,
College Station, 2007. Sprinkel, M.M. Very-Early-Strength Latex-Modified Concrete Overlay. In Transportation
Research Record: Journal of the Transportation Research Board, No. 1668. Transportation Research Board of the National Academies, Washington, DC, 1999, pp. 18-23.
Sprinkel, M.M. Evaluation of Latex-Modified and Silica Fume Concrete Overlays Placed on Six
Bridges in Virginia. VTRC 01-R3. Virginia Transportation Research Council, Charlottesville, 2000.
28
Sprinkel, M.M. Twenty-Five Year Experience with Polymer Concrete Bridge Deck Overlays. In Polymers in Concrete: The First Thirty Years. SP-214. American Concrete Institute, Farmington Hills, MI, 2003, pp. 51-62.
Sprinkel, M.M. Latex-Modified Concrete Overlay Containing Type K Cement. VTRC 05-R26.
Virginia Transportation Research Council, Charlottesville, 2005. Sprinkel, M.M. Research Pays Off: Very Early Strength Latex-Modified Concrete Bridge
Overlays: Virginia’s Quick Cure for Roadway Maintenance Delays. In TRNews, No. 247. Transportation Research Board of the National Academies, Washington, DC, 2006, pp. 34-35.
Sprinkel, M.M. Condition of Concrete Overlays on Route 60 Over Lynnhaven Inlet After 10
Years. VTRC 09-R13. Virginia Transportation Research Council, Charlottesville, 2009a.
Sprinkel, M.M. Sampling and Testing Latex-Modified Concrete for Permeability to Chloride
Ion. In Transportation Research Record: Journal of the Transportation Research Board, No. 2113. Washington, DC, 2009b, pp. 47-52.
Sprinkel, M.M. Rapid Concrete Bridge Deck Overlays. In Frontiers in the Use of Polymers in
Concrete. SP-278. American Concrete Institute, Farmington Hills, MI, 2011. Sprinkel, M.M., and Moen, C. Interim Report: Evaluation of the Installation and Initial
Condition of Latex-Modified and Silica Fume Concrete Overlays Placed on Six Bridges in Virginia. VTRC 99-IR2. Virginia Transportation Research Council, Charlottesville, 1999.
Sprinkel, M.M., and Ozyildirim, H.C. Evaluation of the Installation and Initial Condition of
High Performance Concrete Overlays Placed on Route 60 Over Lynnhaven Inlet in Virginia. VTRC 99-IR4. Virginia Transportation Research Council, Charlottesville, 1999.
Virginia Department of Transportation. Virginia Test Method 120: Method of Test for
Measurement of Permeability of Bituminous Paving Mixtures Using a Flexible Wall Permeameter. Richmond, 2005.
Virginia Department of Transportation. Virginia Test Method 110: Virginia Test Method for
Determining Rutting Susceptibility Using the Asphalt Pavement Analyzer. Richmond, 2009.
Virginia Department of Transportation. Special Provision for Epoxy Concrete Overlay.
Richmond, 2011.
29
Whitman, Requardt & Associates, LLP. Route 3 Over Rappahannock River Supplement to Phase 1 Preliminary Deck Assessment Chain Drag Evaluation. Unpublished report. Richmond, 2007.
Whitman, Requardt & Associates, LLP. Life Cycle Cost Evaluation, Route 3 Over
Rappahannock River. Unpublished report. Richmond, 2008.

30

31
APPENDIX A
VIRGINIA DEPARTMENT OF TRANSPORTATION SPECIAL PROVISION FOR
ASPHALT WATERPROOFING MIX Project: PM06-059-205, N501
November 4, 2009
I. DESCRIPTION
This work shall consist of the production and placement of an Asphalt Waterproofing Mix consisting of hot mix asphalt modified with Rosphalt 50 manufactured by Royston Laboratories, Inc. The mix shall be applied as an overlay on concrete roadway approaches and concrete filled grid bridge decks in accordance with Section 211 and Section 315 of the Specifications except as modified by this special provision, other contract requirements, and as directed by the Engineer. The Contractor shall ensure that a Manufacturer’s Technical Representative is present during all phases of material mixing, placement, and compaction. The Manufacturer’s Technical Representative shall be a q ualified technician authorized or certified by the manufacturer to represent the Manufacturer of the Polymer Modified Additive to provide technical assistance and oversight of all phases of material mixing, placement, and compaction. The representative shall furnish his credentials to the Engineer for review and compliance with these requirements prior to beginning any of these operations. The term Manufacturer as used herein is the manufacturer of the Polymer Modified Additive.
II. MATERIALS
A. Asphalt: The asphalt cement shall be a p erformance graded asphalt (PG) 64-22 conforming to the requirements of AASHTO M320 and the requirements of Section 210 of the Specifications or as designated by the Engineer.
B. Coarse aggregate shall conform to the requirements of Section 211 of the
Specifications or Mix Type SM-9.5 or as directed by the Engineer. In addition, the following requirements shall be met:
Water Absorption when tested according to AASHTO T85 shall be no greater than 2 percent. Mineral aggregates which are inherently porous, such as blast furnace slag, expanded shale, porous limestone, and lightweight aggregates shall not be used.
C. Fine aggregate shall conform to the requirements of Section 211 of the
Specifications for Mix Type SM-9.5 or as directed by the Engineer.

32
D. Mineral Filler shall conform to the requirements of Section 201 of the Specifications.
E. Hydrated lime shall conform to the requirements of Section 211 of the Specifications
F. Reclaimed Asphalt Pavement (RAP) material will not be permitted.
G. Polymer Modified Additive shall be a concentrated, thermoplastic, virgin
polymeric material with a minimum of 45 pou nds of polymer modifier additive added to every ton of asphalt produced. The final blend will be in accordance with the Manufacturer’s requirements under the job mix design formula and approved by the Engineer. Polymer Modified Additive shall be Royston Rosphalt 50 a s manufactured by Royston Laboratories, Inc., 128 First Street, Pittsburgh, PA 15238, (412) 828-1500.
H. Tack Coat shall be Royston 754 A dhesive Tack Coat as produced by Royston
Laboratories, Inc., 128 First Street, Pittsburgh, PA 15238, (412) 828-1500. I. Edge Sealer shall be Royston Edge Sealer 120-29 as produced by Royston
Laboratories, Inc., 128 First Street, Pittsburgh, PA 15238, (412) 828-1500. This material is a highly thixotropic edge sealant.
J. Construction Joint Sealer for construction joints shall be Royston Edge Sealer
120-29 as produced by Royston Laboratories, Inc., 128 First Street, Pittsburgh, PA 15238, (412) 828-1500.
III. JOB MIX FORMULA
The Contractor shall submit for the Engineer’s approval, a job-mix formula in accordance with the requirements and recommendations of Section 211.03 of the Specifications. This design will be submitted to the Manufacturer for further design modification with the Royston Rosphalt 50 a nd shall then meet the gradation requirements and recommendations of Section 211.03 of the Specifications for Mix Type SM-9.5A and mixture requirements listed in Table 1. The final job mix formula will be according to the Manufacturer’s requirements and must be approved by the Engineer. T he permeability of each of 5 laboratory-prepared specimens at air voids of 5.5 percent ± 0.5 percent shall not exceed zero permeability (no flow at 20 minutes) when using Virginia Test Method 120.

33
Table 1 – Asphalt Mix Requirements
VMA (MIN
%)
VFA (MIN
%)
DESIGN GYRATIONS
%GMM
14.5 90.0 NINI = 6
NDES = 50
NMAX = 75
>87
>98.5
>98.5
Two 50 gyration volumetric density tests on production samples per day shall be greater than 98 %Gmm. If this requirement is not met and pavement density is not achieved (See Section X), the Engineer may halt production until the cause is determined and acceptable pavement density is achieved.
IV. ASPHALT CONCRETE MIXTURE
Asphalt Waterproofing Mix shall consist of crushed stone or crushed gravel and fine aggregate, or stone screenings, or a combination thereof combined with asphalt cement and Royston Rosphalt 50. The Royston Rosphalt 50 is a concentrated thermoplastic virgin polymeric material that is added to the asphalt mix design for the bituminous concrete surface course material at the rate of 45 lb per ton of mix. The finished product is placed at a minimum of 1.5 inches thick. T he asphalt must also meet all of the other parameters set forth in this specification. Except where otherwise noted, no more than 5 percent of the aggregate retained on the No. 4 sieve and no more than 20 percent of the total aggregate may be polish susceptible.
V. EQUIPMENT
Hauling Equipment: Trucks transporting the asphalt mix shall conform to the requirements of Section 315.03(a) except as noted herein and shall be inspected prior to hauling the asphalt. Tarps shall be in excellent condition with no holes and shall blanket the entire top. A ll exposed puckers in the tarp shall be tied down to eliminate free flowing air over the hot asphalt mix. Trucks shall remain tarped during hauling and while in queue for the paving train. Asphalt Pavers: The asphalt paver shall conform to the requirements of Section 315.03(b) of the Specifications except as noted herein. Burners shall be used on the

34
paving screed and the vibratory screed shall be in excellent working condition, (including all extensions). T he asphalt storage hoppers shall be inspected frequently during the paving process insuring that no cold asphalt is building up on the walls. Rollers: Rollers shall conform to the requirements of Section 315.03(c) of the Specifications except as noted herein. The breakdown roller shall initialize compaction at surface temperatures ranging from 350ºF - 450ºF. The finish roller shall begin compaction at surface temperatures ranging from 250ºF - 325ºF. C ompaction temperatures and compaction process shall be controlled by the Manufacturer’s Representative and may vary depending upon t hickness to be paved, tenderness of the mix, and equipment used. The Manufacturer’s recommendation is that a breakdown roller is used directly behind the paver and that finish work be done right after breakdown rolling. A tandem steel roller, in the 8 to 10 ton weight range, operating in the static mode is appropriate for use as a breakdown roller. A tandem steel roller, in the 5 to 8 ton weight range, operating in the static mode is appropriate for use as a finish roller. A 2 ton roller shall be used for small areas of work. The rollers’ water systems shall be in good working order and apply even water coverage to the roller surface. The modified asphalt mixture is extremely hot and the water usage during the paving process is approximately double that of standard paving. Please note: Because the rollers will require more frequent filling, a third roller shall be ready to replace one of the rollers during the filling process. When paving areas are larger than 6000 square ft, there shall be at least three rollers operating with an additional roller on stand-by to fill in during the refill process. Handwork: The Manufacturer recommends that handwork be kept to a minimum when possible. When handwork has to be done it is important to work the material and compact the material quickly since handwork tends to cool the material faster. A small amount of solvent can be used to keep tools clean. It is advisable to have a small roller to compact hard to access areas. Compaction efforts must be accomplished immediately while the material is still very hot and before it cools below 250°F. It is very important to get proper compaction throughout the entire area of the deck to achieve waterproofing. Hot asphalt irons or rosebud torches may be used for finishing any open graded surfaces. The modified asphalt mixture shall not be broadcast as it will cool too quickly when passing through the air and will leave the surface with a popcorn characteristic. Rotary Saw: A gasoline-powered rotary saw conforming to the requirements of Section 315.03(d) of the Specifications shall be furnished for cutting test samples from the pavement. Asphalt Concrete Mixing Plant: Asphalt Waterproofing Mix is produced at temperatures considerably higher than unmodified asphalt concrete. The plant shall work
35
with the Manufacturer’s Representative to obtain an acceptable mix temperature. For batch plants, after adding the Royston Rosphalt 50, dr y-mix for approximately ten seconds to ensure proper blending of the dry components next, add the asphalt binder, and wet-mix for 80 s econds to ensure a homogenous blend. Do not use parallel-flow drum plants for production. For other types of drum plants, refer to the Manufacturer for mixing times.
VI. PLACEMENT LIMITATIONS
Prior to paving, the ambient temperature shall be 50ºF and rising. Paving shall not be done under wet conditions. In the event of rainfall the Contractor shall halt the paving process. T he deck must be dry to start or to continue paving. S ee requirements for determining dryness as listed hereinafter.
VII. SURFACE PREPARATION
The Contractor shall perform Type A Milling in accordance with the requirements of Section 412 of the Specifications to a minimum of 1.25 i nches to remove the existing wearing course whether epoxy, hydraulic cement concrete, latex or silica fume overlay, asphalt or asphalt waterproofing mix. A ny sound concrete damaged as a r esult of the milling operations shall be repaired at the Contractor’s expense. Any existing overlay or waterproofing membrane shall be removed to within 1/2 inch of the metal grid deck. Additional removal shall be accomplished using Supplemental Surface Preparation as described elsewhere in the Contract at the direction of the Engineer. After milling and Supplemental Surface Preparation it shall be the Contractor’s responsibility to ensure sound substrate prior to application of the Tack Coat, Royston Edge Sealer 120-129, and Asphalt Waterproofing Mix as specified herein. Prior to the installation of Tack Coat, Royston Edge Sealer 120-129, and Asphalt Waterproofing Mix, the Contractor shall ensure that the existing deck is free of any deleterious materials which may impair installation and bonding, including completely removing any temporary wedge tie-in. The area to be paved shall be swept clean and then blown clean with oil free air removing all latent material and debris. The area must be inspected by the Engineer and Manufacturer’s Technical Representative before any material is placed. Any deck area that still has deteriorated concrete as determined by the Engineer shall be repaired or replaced in accordance with the requirements of Section 412.03 of the Specifications. A ny reinforcing steel damaged as a result of the Contractor’s operations shall be repaired or replaced in accordance with the requirements of Section 412.03 of the Specifications. Pavement irregularities greater than 1 inch in depth shall be filled with a hydraulic cement concrete or product of similarly durable material approved by the Engineer. No earlier than 24 hours before the Asphalt Waterproofing Mix is applied to the surface, a 4 inch to 6 inch application of Royston Edge Sealer 120-129 shall be applied at a rate of 54 square ft per gallon (approximately 0.03 i nch thick) to seal all edges of the day’s placement of the Asphalt Waterproofing Mix. Particular attention shall be given to

36
vertical edges of headers, drains, scuppers, expansion joints or wherever compaction of the waterproofing mix may be difficult to achieve. W here vertical edges exist, apply Royston Edge Sealer 120-129, 4 inch to 6 inch out from curbs, scuppers, joints, etc., on the horizontal plane and up to the top of the finished surface grade. During placement, all longitudinal and transverse joints, hot or cold, shall have Royston Edge Sealer 120-129 applied to the butt surface before the adjoining asphalt lift. T he Manufacturer’s Technical Representative shall oversee all the applications of Royston Edge Sealer 120-129 wherever it is used. Saw cutting may be required when the edge of the joint becomes contaminated, damaged, or is poorly compacted. Construction joints, perimeter areas, utility openings, and transverse joints shall be sealed on the top surface with (Royston Edge Sealer 120-129). A 2 inch wide band of Royston Edge Sealer 120-129 shall be centered on the joint and cover the entire length of the joint. The placement rate shall be just enough to fill the porous surface at the joint and is approximately 100 ft of joint per gallon. Seal all open graded areas with Royston Edge Sealer 120-129 in accordance with the Manufacturer’s recommendations.
VIII. TACK COAT
Before the tack coat is applied, the surface area must be dry to allow for proper adhesion of the tack coat. Visual inspection is the usual method of approving surface dryness, but visual inspection does not guarantee acceptable moisture content. If surface dryness is questionable, tape an 18 i nch by 18 i nch square piece of waterproofing membrane, roofing paper, or plastic on the deck in accordance with ASTM D4263. If after a period of time (2 hours in the warm sun), moisture comes to the surface, then the deck is not dry enough. This method may not indicate excess surface moisture in overcast or nighttime conditions. In the event of such conditions, drying may be accomplished through exposure to sunlight or air circulation, or using artificial means, such as torches and radiant heaters. This work shall be performed in accordance with section 108.04 of the Specifications. Tack Coat shall be applied after application of the Royston Edge Sealer 120-129 and a minimum of one half hour before the placement of the Asphalt Waterproofing Mix to allow the Tack Coat to penetrate and set to a tack free surface. The Tack Coat shall be applied in a uniform coating at the rate of 0.07 to 0.15 g allon per square yard. T he Contractor shall ensure the entire surface to be paved achieves no less than 98 percent coverage. A rough milled surface may require a higher rate of application. This material shall be applied using a distributor truck. If puddling occurs, then the Tack Coat shall be spread using a broom or squeegee. The cure time for the Tack Coat may be extended, due to weather conditions, for an additional hour. The cure time is determined by the Manufacturer’s Representative. T he Manufacturer’s Representative shall oversee the Tack Coat application. The Tack Coat can only be placed on the day of paving, and must be completely cured or broken prior to Asphalt Waterproofing Mix application.
37
IX. PLACEMENT OF ASPHALT WATERPROOFING MIX
The hot mix asphalt is highly thermoplastic and must be mixed and placed at higher temperatures than conventional mixtures. T his material must be placed at high temperature because it tends to set-up when the material cools to below 350ºF. Produce and place Asphalt Waterproofing Mix at the following temperatures:
Activity Temperature (°F)
Mixing 410-450 Laydown at paver 350-450
Compaction 200-450
All materials leaving the asphalt producer’s facility shall be logged by delivery slip and temperature tested for minimum and maximum temperature. Random sampling shall be done by the asphalt producer and the Contractor for quality assurance. The paving process for multiple pass paving shall begin on t he low side of the cross section and progress toward the high side of the cross section. Water or excess moisture may cause the mat to blister. T he screeds on the paver shall be heated to keep from scarring the pavement surface. Butt joints, if allowed to cool, shall be heated with a torch to assure bonding prior to the beginning of additional adjacent paving.
X. COMPACTION
The breakdown roller must follow the paver very closely and all handwork areas shall be compacted as specified herein. The rolling shall begin on the low side of the lane and progress toward the high side of the lane in a forward and reverse half-drum-lap pattern until the entire lane is covered. T he number of complete passes for optimum density determined by the demonstration placement control strip will be used. The finish roller shall remove imperfections and complete the compaction process. The average density of two cores (not sawed plugs) per day’s production taken in a random manner shall be greater than 96.0% Gmm with no s ingle core less than 94.0% Gmm. F ailure to meet this requirement will result in a payment factor of 95% for the day’s production. The cores may be dried immediately in order to determine density by using a vacuum drying device (ASTM D7227). The core holes shall be repaired by the Contractor as recommended by the Manufacturer Open lanes to traffic when the Asphalt Waterproofing Mix pavement reaches 140 °F or a minimum of one hour after compaction is completed.

38
XI. DEMONSTRATION PLACEMENT
The Contractor shall construct a control strip within a demonstration placement area on the project site at the location and extent indicated in the plans or as directed by the Engineer. The demonstration placement shall include all items and work operations necessary to remove the specified portion of the existing deck overlay and to prepare and install the Asphalt Waterproofing Mix. The Contractor shall establish a 150 ft to 200 ft long roller pattern and control strip at a location to be determined by the Engineer. The roller pattern control strip will be used to determine the target nuclear density for the project (to use for quality control, not acceptance) and to verify that the mix can be compacted to the required density. The average density of three cores or sawed plugs taken from the control strip shall be at least 96.0% Gmm. The Contractor shall be responsible for taking all samples for testing. Testing of the core samples will be done by the Contractor in the presence of the Engineer. Sample holes shall be repaired by the Contractor in accordance with the Manufacturer’s recommendation at no c ost to the Department.
XII. CORRECTION OF DEFICIENCIES
In the event any portions of the approach pavement or deck waterproofing fails to comply with specified quality requirements, the Contractor shall replace or repair deficient pavement or deck waterproofing as directed by the Engineer. If permitted by the Engineer to repair the deficient pavement or deck waterproofing the Contractor shall consult with the Manufacturer’s representative and present a plan to the Engineer for repair in accordance with the following requirements for review and approval. Such a plan shall be developed in accordance with the Contract Drawings and Specifications with suggested sequencing and timing depicted so as not to unnecessarily interfere with the traveling public and the operations of the Department or others using the area. Corrections shall be made as work progresses and not reserved for a separate operation at some later date. For minus thickness deficiencies, the only acceptable repair methods are removal and replacement, or placement of an overlay layer. Corrective work shall begin and end at the limits of the deficiency; feather edging will not be permitted. Where pavement or deck thickness is more than 1/4 inch above the required grade, the Contractor shall correct deficiency by removal as necessary to comply with the specifications, except where an approved contour pattern satisfying riding quality and drainage as shown on the Contract Drawings has been established. Variations required to accommodate field conditions will require approval by the Engineer. For deficiency in pavement or deck smoothness tolerance (More than ¼ inch between any two contacts using a 10 foot testing straightedge), correct any deficiency by means approved by the Engineer and subject to all other provisions hereof. T he area for correction of deficiencies in surface smoothness and surface grade tolerance shall be those areas which fail to satisfy quality requirements for grade and smoothness as

39
discussed in this section. Existing pavement shall be removed as necessary to provide square joints for the full depth of the course. For deficiency of in-place voids, remove and replace deficient pavement or deck in accordance with all requirements specified herein for mix design and placement. The area replaced for deficiency of in-place voids shall be the total area paved with the deficient lot. Existing pavement shall be removed as necessary to provide square joints for the full depth of the course. For deficiency involving a porous surface in the mat at longitudinal joints, or at construction joints, the surface shall be sealed with an asphalt filler/sealer material submitted to and approved by the Engineer. Should visual examination by the Engineer reveal that the material in any load, or portion of the paved roadway is contaminated, segregated, or flushed with asphalt cement, that load, or portion of the roadway paved with such material may be rejected without additional sampling of the material.
XIII. WARRANTY
The Contractor shall provide a one-year warranty from the date of final acceptance for all Asphalt Waterproofing Paving Mix overlay surfaces. The Department will periodically monitor the overlay surface installed throughout the warranty period for compliance and acceptability. T he Contractor shall repair any area that fails before the end of the warranty period and shall do s o within 14 da ys after Department notification unless otherwise directed by the Department. Repair materials and methods shall comply with the manufacturer’s recommendations and shall be approved by the Engineer. Failure of the Asphalt Waterproofing Paving Mix overlay surface is defined as the loss of adhesion of the material to the underlying layer resulting in a pothole greater than 1 square foot of area (delamination) or surface texture of less than 0.5- mm as measured in terms of mean profile depth (MPD – ASTM E1845). T he MPD will be determined using a Circular Track Texture Meter (CT Meter – ASTM E2157)]. T he Engineer shall notify the Contractor of the date for the warranty inspection at the end of the warranty period and the Contractor shall be present at the inspection.
XIV. MEASUREMENT AND PAYMENT
Asphalt Waterproofing Mix will be measured in tons and paid for at the contract unit price per ton. Net weight information shall be furnished with each load of material delivered in accordance with the requirements of Section 211 of the Specifications. The demonstration placement will be paid for at the contract unit price per ton. With the approval of the Engineer, up to one additional demonstration placement will be paid for at the contract unit price. T he Department will only pay for a maximum of two demonstration placements at the contract unit price. If more than two demonstration placements are needed, the Department and Contractor shall negotiate the price based

40
upon a reduced percentage of the contract unit price and the additional demonstration placements shall be constructed at sites approved by the Engineer.” This price shall include surface preparation not covered by other specific pay items, furnishing and installing all materials including asphalt cement, aggregate, mineral filler, polymer modified additive, edge sealer, tack coat, and construction joint sealer, labor, tools, equipment, and incidentals necessary to complete the work as specified. Payment under this Item shall also include the furnishing and fulfillment of the warranty, installing control strip(s) as specified, the presence and services of the manufacturer’s representative as specified, repair of defects\deficiencies, cutting, testing and repairing acceptance samples, and cleaning and preparation, which shall be considered incidental to this item. Payment will be made under:
Pay Item Pay Unit Asphalt Waterproofing Mix Ton
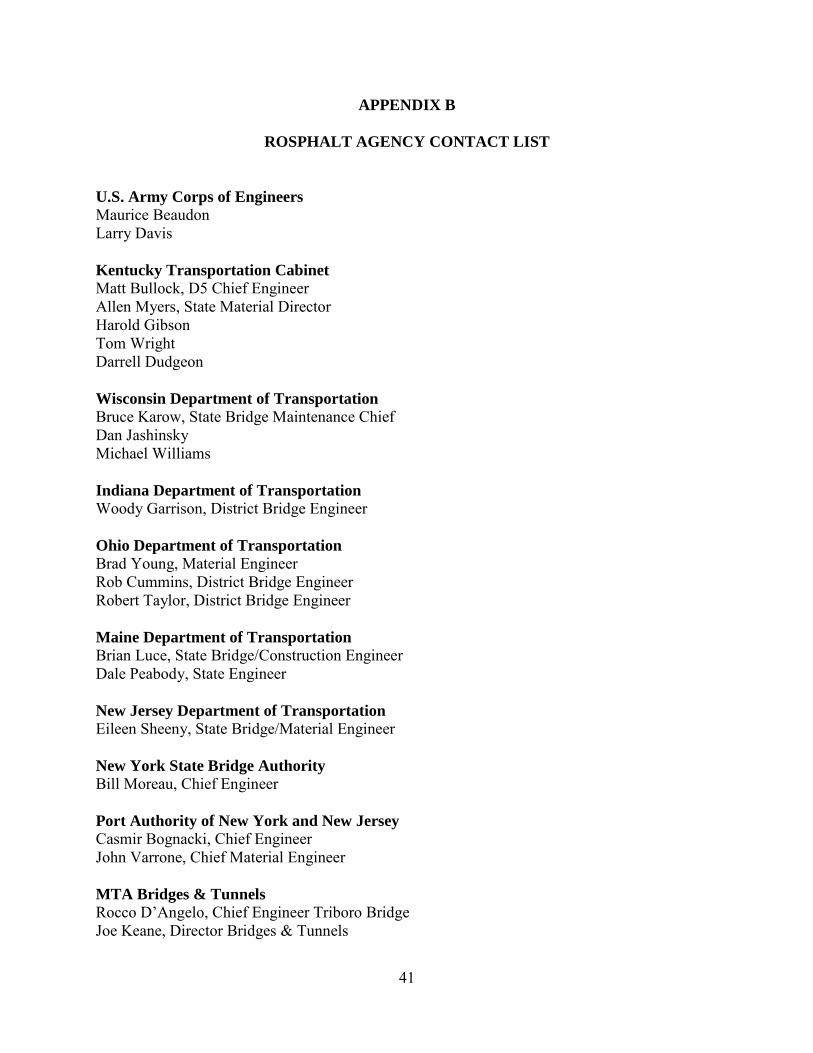
41
APPENDIX B
ROSPHALT AGENCY CONTACT LIST
U.S. Army Corps of Engineers Maurice Beaudon Larry Davis Kentucky Transportation Cabinet Matt Bullock, D5 Chief Engineer Allen Myers, State Material Director Harold Gibson Tom Wright Darrell Dudgeon Wisconsin Department of Transportation Bruce Karow, State Bridge Maintenance Chief Dan Jashinsky Michael Williams Indiana Department of Transportation Woody Garrison, District Bridge Engineer Ohio Department of Transportation Brad Young, Material Engineer Rob Cummins, District Bridge Engineer Robert Taylor, District Bridge Engineer Maine Department of Transportation Brian Luce, State Bridge/Construction Engineer Dale Peabody, State Engineer New Jersey Department of Transportation Eileen Sheeny, State Bridge/Material Engineer New York State Bridge Authority Bill Moreau, Chief Engineer Port Authority of New York and New Jersey Casmir Bognacki, Chief Engineer John Varrone, Chief Material Engineer MTA Bridges & Tunnels Rocco D’Angelo, Chief Engineer Triboro Bridge Joe Keane, Director Bridges & Tunnels

42
Virginia Department of Transportation Thomas Miller, Fredericksburg Structure & Bridge Virginia Transportation Research Council [now the Virginia Center for Transportation Innovation and Research] Michael Sprinkel Ontario Ministry of Transportation (Canada) David Lai
Date: March 25, 2011
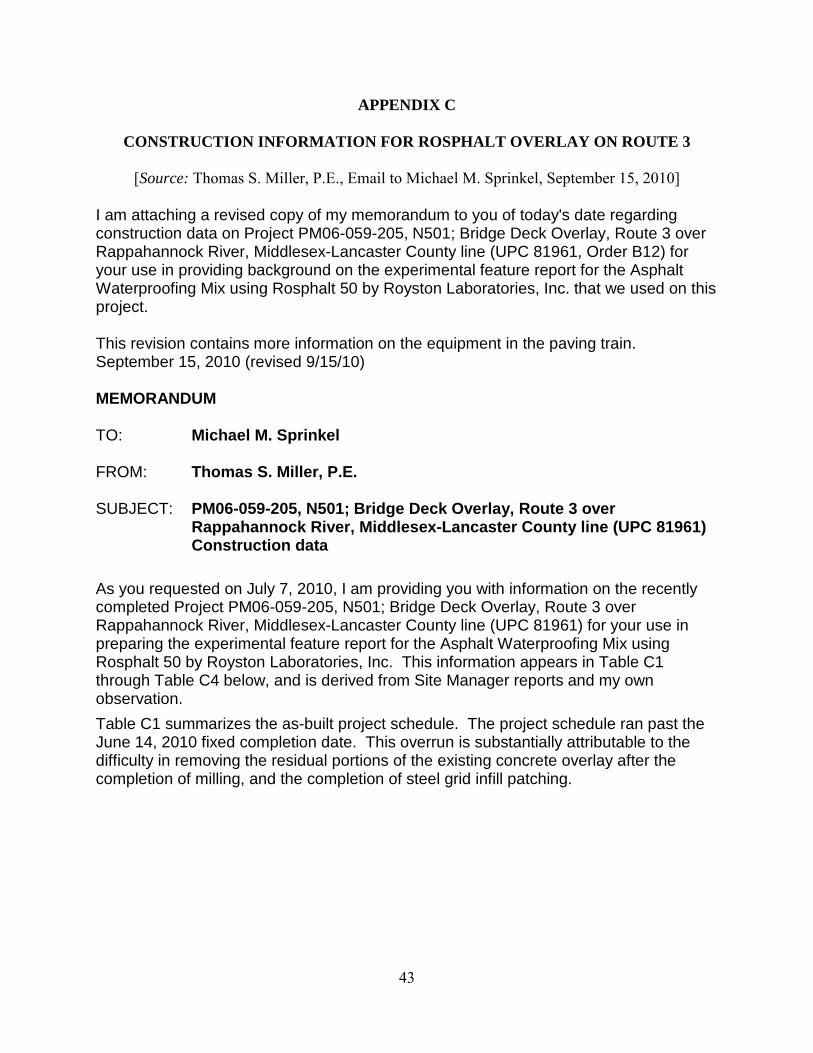
43
APPENDIX C
CONSTRUCTION INFORMATION FOR ROSPHALT OVERLAY ON ROUTE 3
[Source: Thomas S. Miller, P.E., Email to Michael M. Sprinkel, September 15, 2010]
I am attaching a revised copy of my memorandum to you of today's date regarding construction data on Project PM06-059-205, N501; Bridge Deck Overlay, Route 3 over Rappahannock River, Middlesex-Lancaster County line (UPC 81961, Order B12) for your use in providing background on the experimental feature report for the Asphalt Waterproofing Mix using Rosphalt 50 by Royston Laboratories, Inc. that we used on this project. This revision contains more information on the equipment in the paving train. September 15, 2010 (revised 9/15/10) MEMORANDUM TO: Michael M. Sprinkel FROM: Thomas S. Miller, P.E. SUBJECT: PM06-059-205, N501; Bridge Deck Overlay, Route 3 over
Rappahannock River, Middlesex-Lancaster County line (UPC 81961) Construction data
As you requested on July 7, 2010, I am providing you with information on the recently completed Project PM06-059-205, N501; Bridge Deck Overlay, Route 3 over Rappahannock River, Middlesex-Lancaster County line (UPC 81961) for your use in preparing the experimental feature report for the Asphalt Waterproofing Mix using Rosphalt 50 by Royston Laboratories, Inc. This information appears in Table C1 through Table C4 below, and is derived from Site Manager reports and my own observation. Table C1 summarizes the as-built project schedule. The project schedule ran past the June 14, 2010 fixed completion date. This overrun is substantially attributable to the difficulty in removing the residual portions of the existing concrete overlay after the completion of milling, and the completion of steel grid infill patching.
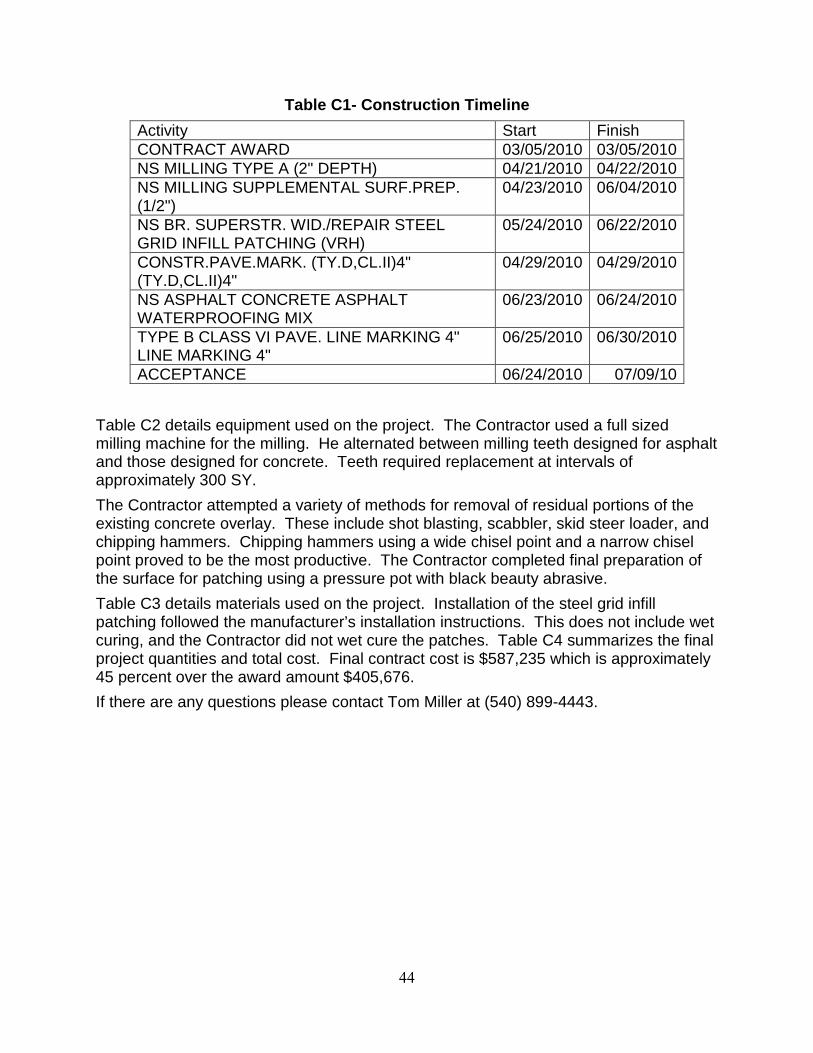
44
Table C1- Construction Timeline Activity Start Finish CONTRACT AWARD 03/05/2010 03/05/2010 NS MILLING TYPE A (2" DEPTH) 04/21/2010 04/22/2010 NS MILLING SUPPLEMENTAL SURF.PREP. (1/2")
04/23/2010 06/04/2010
NS BR. SUPERSTR. WID./REPAIR STEEL GRID INFILL PATCHING (VRH)
05/24/2010 06/22/2010
CONSTR.PAVE.MARK. (TY.D,CL.II)4" (TY.D,CL.II)4"
04/29/2010 04/29/2010
NS ASPHALT CONCRETE ASPHALT WATERPROOFING MIX
06/23/2010 06/24/2010
TYPE B CLASS VI PAVE. LINE MARKING 4" LINE MARKING 4"
06/25/2010 06/30/2010
ACCEPTANCE 06/24/2010 07/09/10 Table C2 details equipment used on the project. The Contractor used a full sized milling machine for the milling. He alternated between milling teeth designed for asphalt and those designed for concrete. Teeth required replacement at intervals of approximately 300 SY. The Contractor attempted a variety of methods for removal of residual portions of the existing concrete overlay. These include shot blasting, scabbler, skid steer loader, and chipping hammers. Chipping hammers using a wide chisel point and a narrow chisel point proved to be the most productive. The Contractor completed final preparation of the surface for patching using a pressure pot with black beauty abrasive. Table C3 details materials used on the project. Installation of the steel grid infill patching followed the manufacturer’s installation instructions. This does not include wet curing, and the Contractor did not wet cure the patches. Table C4 summarizes the final project quantities and total cost. Final contract cost is $587,235 which is approximately 45 percent over the award amount $405,676. If there are any questions please contact Tom Miller at (540) 899-4443.

45
Table C2 - Equipment Description ID/VIN 1993 GMC Topkick #71 (white) 1GDJ6H1J7P 1993 International Flat Dump truck (white) #72 1HTSCPLMOP Air Compressor HD4 Concrete Mixer 1 Crash Cushion, 1978 Ford Crash F61DVCA171 F-350 #91 91 Lamp Plant 001 Shot Blaster Machine #xxx #XX1V Tool Storage Trailer #F901 Truck, 2003 Ford F350 Crewcab4x2 1FTSW30F88 2000 Cat 248 Uniloader 15.08 Equip Lowboy Trailer 8.14 Kenworth Road Tractor 5.11 Water Truck-Peterbilt 4.99 Wirtgen Milling Machine 6 perform. milling drum 17.06 2001 Chevy Pickup 4 T-11 Pickup Truck ( Dodge ) 1 T- 8 Primer Cart E-000 Tamper Cart E-00 Tape Machine E-0000 Blaw Knox PF-5510 asphalt paver Caterpillar C-534B 10-13 ton roller Hypac (?) 3-5 ton roller International tandem dump trucks plate tamper

46
Table C3 - Materials Item Description Manufacturer and/or
Supplier 68910
Reed Minerals Black Beauty Virginia Road & Bridge Supply
68910
Quickcrete Comm. Grade Fastset DOT Mix
Virginia Road & Bridge Supply
10598
Royston Rosphalt 50 LT Royston Laboratories, Inc
10598
Royston Edge Sealer 120-29 Royston Laboratories, Inc
10598
Asphalt Waterproofing Mix Lee Hy Paving Corp, Mt. Castle
10598
Trackless Tack Asphalt Emulsions
54075
Preformed Traffic Marking Tape 3M
54512
Temporary Preformed Traffic Marking Tape
3M
Table C4 - Final Quantities And Costs
Item Description Unit Quantity Unit Price Total 00100 MOBILIZATION LS 1.00 37,000.00 37,000.00 10598 NS ASPHALT CONCRETE
ASPHALT WATERPROOFING MIX TON 136.5 2000.00 273,000.00
24160 CONSTRUCTION SIGNS SF 0.00 20.00 0.00 24272 TRUCK MOUNTED ATTENUATOR
ATTENUATOR HR 291.50 30.00 8,745.00
24282 FLAGGER SERVICE HR 802.50 30.00 24,075.00 54075 TYPE B CLASS VI PAVE. LINE
MARKING 4" LINE MARKING 4" LF 1042.00 6.00 6,252.00
54512 CONSTR.PAVE.MARK. (TY.D,CL.II)4" (TY.D,CL.II)4"
LF 1164.00 3.00 3,492.00
68317 NS MILLING SUPPLEMENTAL SURF.PREP. (1/2")
SY 887.20 18.00 15,969.60
68317 NS MILLING TYPE A (2" DEPTH) SY 1,196.00 9.00 10,764.00 68910 NS BR. SUPERSTR. WID./REPAIR
STEEL GRID INFILL PATCHING (VRH)
SY 120.00 500.00 60,000.00
85021 NS ADDITIONAL STEEL GRID INFILL PATCHING wo #1
SY 591.75 250.00 147,937.50

47
APPENDIX D
SKID RESISTANCE
[Source: Gerardo Flintsch, Edgar de León Izeppi, Email to Michael M. Sprinkel, February 11, 2011]
Friction Measurements Report on Norris Bridge, Rosphalt Overlay
A Rosphalt Overlay was placed on span 22 of the Norris Bridge over the Rappahannock River on June 23 and 24, 2010. The span is 468-ft long and the total length of the bridge is about 10,000 feet. This report contains the results of friction tests performed with a GripTester on the bridge on January 20, 2011 as requested by Michael Sprinkel from VTRC. The GripTester used is a Continuous Friction Measurement Equipment (CFME) from the CFME Loan Equipment Program managed by the Center for Sustainable Transportation Infrastructure at the Virginia Tech Transportation Institute. The Norris Bridge has two travel lanes as can be seen in Figure D1 below. In this picture, span 22 can be seen ahead in the path of the vehicle towing the GripTester while traveling eastbound performing one of the passes. The overlay is very visible because it contrasts its black color against the paler Portland cement concrete bridge deck spans.
FIGURE D1. Rosphalt Overlay on the Norris Bridge going eastbound toward White
Stone

48
A total of three measurements were performed in each direction over the bridge at a constant speed of 40 mph. The average results for both directions are plotted in Figure D2 for the whole bridge. This plot shows the bridge measurements every three feet. The results of three 468-ft sections, corresponding to the Rosphalt overlay and two adjacent sections before and after span 22 without any overlay are marked with dotted lines and labeled as sections 1 and 2 just to compare the friction results for span 22. The plot also shows both ends of the bridge, with a starting point on the side of Greys Point in Middlesex County and ending in the side of the bridge where the roads follows to White Stone in Lancaster County.
FIGURE D2. GripTester results for friction measurements on the Norris Bridge
Table D1 shows the results of the average friction results for the three sections mentioned above. These results show slight differences for the passes made in the east and west direction but, in general, the Rosphalt overlay evidences a lower friction on span 22, by about 0.20 Grip Number (Mu) points, in a scale from 0 to 1.
TABLE D1. GripTester friction results over the Norris Bridge (average of three passes)
Section Eastbound results Westbound results Section 1 0.83 0.78 Rosphalt (span22) 0.63 0.62 Section 2 0.81 0.79

49
In the friction plot it can be observed a series of points along the bridge where there appears to be drastic changes in the Mu numbers. These correspond to different places in the bridge where the unit passes on top of bridge joints such as the one shown on Figure D3. Finally, Figure D4 shows different pictures taken on the bridge and of the GripTester unit as assembled on that day for these measurements.
Figure D3. Expansion joints on the Norris Bridge
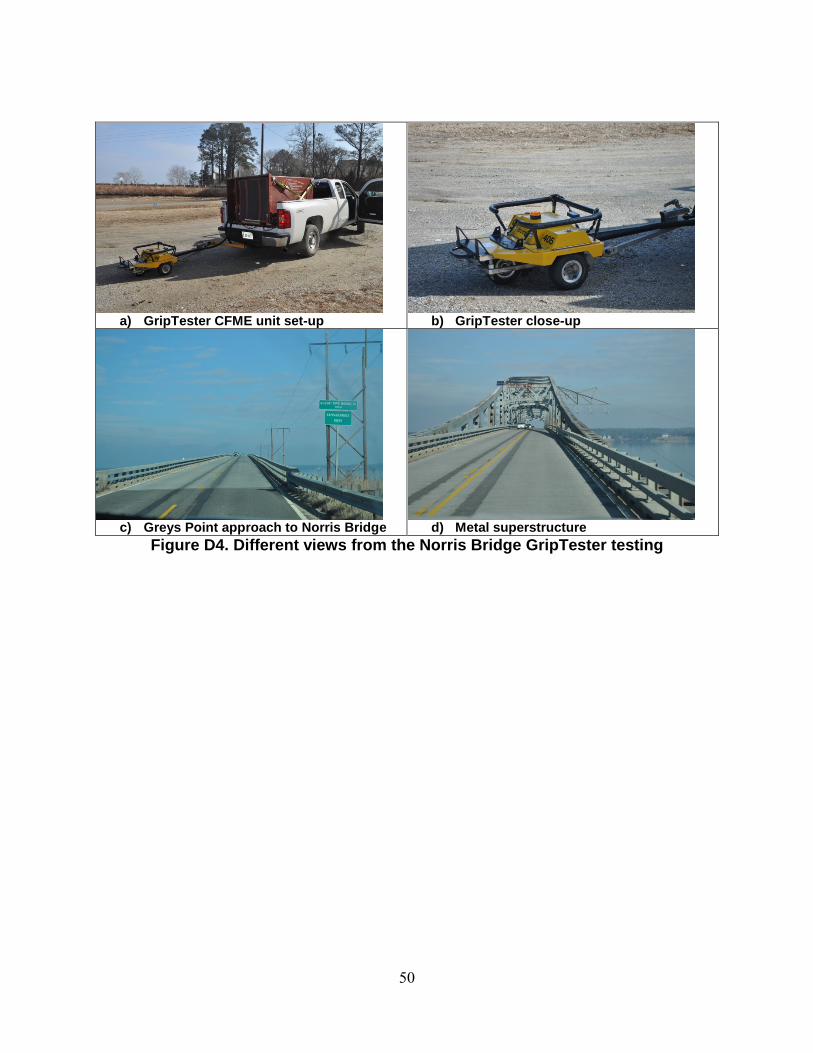
50
a) GripTester CFME unit set-up
b) GripTester close-up
c) Greys Point approach to Norris Bridge
d) Metal superstructure
Figure D4. Different views from the Norris Bridge GripTester testing