Evaluation of the impact of the current CAP on the ... · 3.4 CAP subsidies do not impact chicken...
100
Commission for Natural Resources Evaluation of the impact of the current CAP on the agriculture of developing countries NAT
Transcript of Evaluation of the impact of the current CAP on the ... · 3.4 CAP subsidies do not impact chicken...

Commission for Natural Resources
Evaluation of the impactof the current CAP on the agriculture
of developing countries
NAT

© European Union, 2019 Partial reproduction is permitted, provided that the source is explicitly mentioned. More information on the European Union and the Committee of the Regions is available online at http://www.europa.eu and http://www.cor.europa.eu respectively. Catalogue number: QG-03-19-654-EN-N; ISBN: 978-92-895-1025-7; doi:10.2863/81237

This report was written by Alan Matthews
and Rossella Soldi (Progress Consulting S.r.l., Italy).
It does not represent the official views of the
European Committee of the Regions.


Table of contents
Executive Summary ................................................................................................................. 1
Part 1 Review of the previous studies on the impact of current CAP subsidies on the
price of the EU food produced and exported to developing countries ............. 5
1.1 Introduction ............................................................................................... 5
1.2 Scope of the study ..................................................................................... 7
1.3 Examining the impact of CAP subsidies on EU exports to developing
countries through literature review ......................................................... 10
1.3.1 Do CAP domestic subsidies stimulate production? ............................ 11
1.3.2 Do CAP domestic subsidies permit dumping? ................................... 20
1.3.3 The magnitude of the effect of CAP subsidies ................................... 22
Part 2 Product case studies of EU exports .................................................................... 27
2.1 EU agri-food exports to developing countries ........................................ 27
2.2 EU agri-food exports to vulnerable developing countries ...................... 30
2.3 Literature review of previous studies ...................................................... 32
2.4 Selected case studies of EU exports ........................................................ 38
2.4.1 Milk powders case study ..................................................................... 39
2.4.2 Chicken meat case study ..................................................................... 50
2.4.3 Processed tomato products case study ................................................ 58
Part 3 Main findings on the impact of current CAP subsidies on the price of EU
food produced and exported to developing countries ...................................... 65
3.1 CAP subsidies contribute to a greater volume of EU milk powders
exports but price effects are limited ........................................................ 65
3.2 CAP subsidies are not a significant determinant of milk powder exports
to VDCs ................................................................................................... 68
3.3 CAP subsidies do not influence the price and volume of EU chicken
meat exports ............................................................................................ 70
3.4 CAP subsidies do not impact chicken meat exports to VDCs ................ 71
3.5 CAP subsidies have the potential to influence the price of exports of
tomato products ....................................................................................... 75
3.6 CAP subsidies are not a significant determinant of tomato products
exported to VDCs .................................................................................... 79
Part 4 Conclusions: implications for the current debate on CAP reform ................. 81
Annex I: List of vulnerable developing countries ................................................................ i Annex II: References ............................................................................................................. iii


List of acronyms
ACP African, Caribbean and Pacific
AD Anti-Dumping
BPS Basic Payment Scheme
CAP Common Agricultural Policy
CIS Commonwealth of Independent States
CMO Common Market Organisation
CN Combined Nomenclature
CoR European Committee of the Regions
EC European Commission
EP European Parliament
EU European Union
EUR Euro
FADN Farm Accountancy Data Network
FAO Food and Agriculture Organization of the United Nations
FFMP Full-fat milk powder
FTA Free trade agreement
HS Harmonised System
LDCs Least Developed Countries
MFN Most Favoured Nation
MSs Member States
NGOs Non-governmental organisations
OECD Organisation for Economic Co-operation and Development
PCD Policy Coherence for Development
SCM Subsidies and Countervailing Measures
SFP Single Farm Payment
SITC Standard International Trade Classification
SMP Skimmed milk powder
SPS Single Payment Scheme
SSA Sub-Saharan Africa
TRQ Tariff Rate Quota
UAA Utilised agricultural area
USD United States dollar
USITC United States International Trade Commission
VCS Voluntary Coupled Support
VDCs Vulnerable Developing Countries
WAEMU West African Economic and Monetary Union
WMP Whole milk powder
WTO World Trade Organization


1
Executive Summary
The terms of reference for this study ask for an evaluation of the impact of
current CAP subsidies on the price of EU food produced and exported to
developing countries. This research is meant to contribute to the current debate
on how the proposed reform of the Common Agricultural Policy (CAP) may
minimise its impact on developing countries coherently with EU development
cooperation’s objectives. As developing countries are increasingly
heterogeneous, the focus of this study is on developing countries facing
particular problems of food insecurity. In this study, these ‘vulnerable’
developing countries (VDCs) comprise the Least Developed Countries, the
countries of Sub-Saharan Africa, and the African, Caribbean and Pacific
countries that are signatories to the Cotonou Agreement with the EU.
The first aspect investigated is whether CAP subsidies lead to countervailable
subsidies or dumping where the former refers to price suppression and lost sales
by other countries, and the latter to export sales below the cost of production in
the EU. Literature review provides the evidence that CAP subsidies continue to
have a production-stimulating effect despite the reform path of the CAP in
recent decades. Decoupled direct payments, but also coupled direct payments
and productivity-enhancing investments under Pillar 2, are mainly responsible
for this effect. EU agricultural production is greater and so are net exports as a
result. The best recent estimates suggest that the magnitude of this effect at the
aggregate level is relatively small and that EU production is around 5%-6%
higher than it might be in the absence of CAP subsidies. However, there are
several factors influencing the degree of this increase and the fact that other EU
non-agricultural policies may offset any potential CAP effects that increase
agricultural production cannot be ignored.
Then, to better understand the role of the EU in the global agri-food trade and
exports to VDCs, three case study products related to milk powders, chicken
meat, and processed tomato products, are examined. The EU is one of a number
of exporters supplying imports of the case study products to the VDCs, where
the most important importers are countries in West Africa and, in the case of
chicken meat, also South Africa. The EU supplies around 35% of whole milk
powder (WMP) imports by VDCs and nearly all of their full-fat milk powder
(FFMP) imports, though its share in skimmed milk powder (SMP) imports is
lower at 15%, with New Zealand and the US being other major suppliers. The
importance of the EU as a supplier of chicken meat exports to VDCs varies by
country but has been growing, and the EU now accounts for almost half (46%)
of total imports in the main VDC import markets, with the remainder supplied
by Brazil and the US. In the case of tomato paste, the EU (and particularly Italy)

2
has been squeezed out of these markets by Chinese competition, and the EU
now accounts for around 12% of their total imports. Most EU exports of these
products are sold to non-VDCs although VDC markets have been growing in
importance in the case of chicken meat (now accounting for almost half of total
EU exports of that product) and FFMPs.
This report assesses the extent to which CAP subsidies have influenced the price
of EU exports to these markets and encouraged growth in these exports. The
conclusions vary by product. In the case of milk powders, recent export growth
has been mainly affected by the elimination of milk quotas in 2015 which has
allowed an expansion in EU dairy product exports despite a fall in world market
prices. This was a once-off change and in itself does not reflect any change in
CAP subsidy policy. However, coupled and decoupled payments to farmers
result in higher EU milk production than would otherwise be the case in the
absence of these payments, both through the direct stimulus to production and
the possible indirect support where farmers use even decoupled payments to
subsidise their production costs. Higher EU milk production allows higher
production of dairy products (M’Barek et al., 2017) which has the effect of
lowering world market prices. Because the EU competes on the world market
with other exporters of these products, this negative price impact will be limited
but not negligible. The report finds that, despite direct payments to milk
producers, the EU is losing market share in WMP and SMP exports, and that the
main growth in milk powder exports to VDCs has been FFMPs. FFMPs exploit
a technological innovation that allows more expensive butter fat to be replaced
by cheaper vegetable fat, resulting in a milk powder that can be sold at a
considerably lower price than competitive conventional milk powders. The
availability of FFMPs intensifies the competitive pressure on local milk
production from imported milk powder. This innovation evolved independently
of CAP subsidies and would not be reversed if CAP subsidies were to disappear.
In the case of chicken meat exports, there is no evidence that CAP subsidies
have depressed the price of chicken meat from the EU to VDCs. If anything, the
price of broiler meat in the EU is higher than that of other exporting countries, in
part due to higher feed costs and higher environmental, animal welfare and food
safety standards. High import tariffs are necessary to prevent a substantial
increase in imports from these exporters into the EU. These import barriers
reduce EU consumption of chicken meat and reduce the global supply of dark
meat which is exported to VDCs. Despite these cost disadvantages, the EU is a
significant and increasing exporter of chicken meat, and especially frozen
chicken parts. Half of these exports now go to markets in the VDCs. This trade
is based on distinct differences in consumer preferences for different types of
chicken meat in the EU and export markets. Even if these exports are not the
result of CAP subsidies, local poultry producers find it difficult to compete with

3
these cheap imports and stronger measures to develop the local industry are
required.
In the case of EU exports of tomato paste there is a potential effect of CAP
subsidies on the price of exports of this product but in practice this appears not
to be significant. Many EU countries maintain coupled support for processing
tomatoes under the Voluntary Coupled Support (VCS) scheme. Furthermore, the
fact that the decoupled payment is paid to growers on the basis of the Single
Farm Payment (SFP) historic model means that it could still be interpreted as a
coupled payment. Farmers may assume that their future payment will depend on
maintaining their current level of output and behave accordingly. Both these
effects can stimulate the production of tomatoes and lower the cost of raw
material to the processors of tomato paste. However, the economic evidence,
taking account of the various factors that influence the pass-through rate to the
price of tomato paste, suggests that in practice the impact on the price of tomato
paste is insignificant (Barker, 2015). Offsetting factors include the power of
Producer Organisations to influence contract prices through collective
bargaining as well as the limitations in importing tomatoes for the production of
tomato paste. The report notes that a legal analysis can arrive at a different
conclusion, as shown by the imposition of anti-dumping duties on certain Italian
exporters of processed and preserved tomato products by Australia.
Based on the above findings a number of suggestions for future CAP support
policy are proposed. They range from the need for greater disciplines on coupled
support payments, to market management measures that do not destabilise prices
for VDC producers, to the need of completion of the full convergence process of
direct payments, the phasing out of decoupled payments for income support, and
the creation of a platform allowing stakeholders from VDCs to be involved in a
dialogue on Policy Coherence for Development (PCD) and agri-food trade
issues.
This report consists of four parts in addition to this summary. Part 1 is a
literature review of previous studies on the impact of CAP subsidies on the price
of EU food produced and exported to developing countries. It frames the study’s
objectives within a policy and international trade context, discussing the various
effects CAP subsidies have on production and competition. Part 2 analyses EU
exports of agri-food products to developing countries, and VDCs in particular,
also through the lens of three case studies for milk powder, chicken meat and
processed tomato products. Part 3 reports on the main findings drawn from the
previous literature review and statistical analyses and Part 4 concludes by
considering possible EU policy responses to adverse competitive impacts caused
by EU exports to VDCs.


5
Part 1 Review of the previous studies on the
impact of current CAP subsidies on the
price of the EU food produced and exported
to developing countries
1.1 Introduction
The Commission’s 2019 Policy Coherence for Development (PCD) report
includes the following passage (EC, 2019a): “The EU is a major importer of
commodities and exporter of valuable agriculture and food products. Its
practices therefore have a noticeable impact on food systems outside the EU,
including in developing countries. The proposals for a reformed CAP for 2021-
2027 therefore build on previous policy reforms in that it confirms market
orientation as a fundamental CAP principle to minimise the risk of creating
distortions in global agricultural markets. The proposals remove export
subsidies, continue with direct support to farmers which is largely decoupled
from production decisions and restrict market measures to times of crisis (and
even then, price support for farmers is set at levels that are generally well below
normal market conditions, reducing EU surpluses and bringing EU prices more
into line with global prices). In line with this, the proposals for a reformed CAP
include an explicit reference to the EU commitment to PCD in the explanatory
memorandum thereby, indicating that a reformed CAP will take into account the
EU development cooperation’s objectives of poverty eradication and sustainable
development in developing countries. Particular attention will be given to
ensure that EU support to its farmers has minimal or no trade distorting
effects.” (bolding in original)
The impact of the CAP on developing countries has long drawn the attention of
activist campaigners, international organisations and academic researchers.
These groups pointed out the lack of policy coherence between the
implementation of the CAP and its frequent adverse impacts on food security
and agricultural development in developing countries (Matthews, 1985; Oxfam,
2002; Fritz, 2011; De Schutter, 2011; Meijerink and Achterbosch, 2013;
Matthews, 2017; Blanco, 2018). The concerns raised by critics of the policy
incoherence of the CAP have changed over time. The classical criticisms of the
CAP were that the high level of protection afforded to EU farmers particularly
for sensitive products damaged the interests of some developing country
exporters of products such as sugar, cotton and rice (while recognising that some
privileged exporters benefited from preferential access to the EU market at low
or zero rates of duty, such as certain banana and sugar exporters), while the use

6
of export subsidies to clear surpluses from the EU market damaged local
producers in import markets because they then faced subsidised competition. In
both cases, the main complaint was that CAP subsidies depressed world market
prices to the detriment of both developing country exporters and producers in
importing countries. EU tariff protection on sensitive products remains
extraordinarily high, despite the changes implemented at the end of the Uruguay
Round. However, the EU no longer uses explicit export subsidies and the largest
share of the CAP budget is now spent on decoupled income support.
A significant change in critical perspectives on the CAP occurred following the
2008 food price crisis. International organisations reported that the sharp and
sudden peaking of food prices in 2008-09 and later in 2011 led to a significant
rise in the numbers of undernourished. While it is now clear that several factors
coincided to contribute to the spike in food prices, activist groups and some
international organisations pointed specifically to biofuel mandates which were
blamed for diverting food crops to fuel uses and driving up the price of food.
Many groups called (and still call) for the rescinding of biofuel mandates on the
grounds that they put upward pressure on global food prices and cause increased
hunger and undernutrition in low-income countries. While biofuel mandates are
not the responsibility of agricultural policy, the concern voiced that developed
country policies were driving food prices up was the opposite to the traditional
criticism that developed country agricultural policies drove food prices down
(Swinnen, 2011). It was an important reminder that consumer as well as
producer interests should be considered in the food security debate.
The biofuel issue has had longer-term consequences for the debate on the CAP
and developing countries. Even if biofuels help the EU meet its greenhouse gas
reduction targets (a contested issue) biofuel production in the EU typically takes
place on cropland which was previously used for other agriculture such as
growing food or feed. Since this agricultural production is still demanded, it may
be partly displaced to previous non-cropland such as grasslands and forests in
non-EU countries (this process is known as indirect land use change). More
generally, there is now greater awareness of the external footprint of EU demand
for agri-food imports and the possible negative impacts in exporting countries of
supplying these imports (De Schutter, 2011). Much of this concern has focused
on the consequences of palm oil imports for biodiesel and soybean imports for
animal feed which have contributed to deforestation in exporting countries (DG
ENV, 2013). A recent Swedish study calculated that one-sixth of all emissions
resulting from the typical diet of an EU citizen can be directly linked to
deforestation of tropical forests (Pendrill et al., 2019). Another concern is that
access to the EU market both for biofuel and food imports may lead to land
grabbing and human rights abuses (Borras Jr et al., 2016). Compared to classical
criticisms of the CAP, these concerns focus on the consequences of EU

7
consumption and associated animal feed requirements rather than the production
of agri-food products. They also focus on the potential negative impacts of EU
imports from developing countries rather than on the more traditional concern
with the impact of EU exports on developing countries.
1.2 Scope of the study
The terms of reference for this study ask for an evaluation of the impact of
current CAP subsidies on the price of EU food produced and exported to
developing countries.
Current CAP refers to the CAP regulations for the 2014-2020 programming
period. The way in which farmers in the EU are supported under the CAP has
evolved significantly under successive CAP reforms, from support provided to
market prices in the period 1968-1994, to support provided to products through
partially-coupled direct payments in the period 1994-2005, and since 2005 to
support provided to producers mainly through decoupled hectare-based direct
payments. Direct payments now account for 72% of the CAP budget. This
transition is not complete; elements of the instruments introduced in the earlier
CAP periods continue to co-exist with decoupled direct payments. Market prices
can be supported by safety-net intervention, and Member States (MSs) have the
possibility to use a proportion of their direct payments envelopes to make
coupled payments to products under specified conditions. Farmers are also
supported under the CAP rural development pillar. Total rural development
spending, including non-farm spending, accounts for 22% of CAP spending.
The remaining 6% relates to market support measures spending and other
spending.
CAP subsidies are payments to farmers from the CAP budget. EU farmers also
benefit from border protection for some sensitive commodities through high
tariffs. For some commodities where this protection is effective, EU domestic
prices are higher than world market prices. This study does not seek to evaluate
the impact of agricultural trade policy on developing countries but instead is
confined to the impacts of support paid through the CAP budget. Still, the role
played by import protection cannot be ignored. Export subsidies are an
intermediate policy instrument, in that they are a border measure but funded in
the past from the CAP budget. Export subsidies were used to support EU market
prices and farm incomes by compensating exporters for the difference between
the price of agricultural commodities on the EU market and world market prices.
The EU ceased paying export subsidies in 2015 and has implemented the
prohibition on the use of export subsidies agreed at the WTO Nairobi Ministerial
Council in the same year. Therefore, the use of export subsidies and their

8
possible impact on the price of EU food exported to developing countries,
although a hugely important issue in the past, is no longer relevant for this study.
Another issue not addressed is any implicit subsidy to EU agricultural
production due to the incomplete or absence of efforts to fully internalise the
costs of damage to the environment, to natural resources and to human health,
what economists call negative externalities. The focus of this report is on CAP
domestic subsidies. Because of their importance in the overall CAP budget, the
principal focus will be on the impact of decoupled direct payments.
The study is required to evaluate the impact of CAP subsidies on the price of
food produced in and exported by the EU. Here there are two issues to be
considered within an international trade context (Box 1). One is whether CAP
subsidies stimulate EU production resulting in adverse effects on other
countries, for example, because of fewer import opportunities or greater exports
by the EU. Greater EU supply is likely to lower both the EU and the world
market price of food and thus affect the price of EU food exported to developing
countries. A second potential mechanism is that CAP subsidies allow EU
products and exports to be sold at below their cost of production, a form of
dumping. This would mean that EU products are exported at prices below what
they would otherwise be in the absence of these subsidies. It has been alleged
that CAP subsidies do encourage dumping resulting in unfair competition with
producers in developing countries. Whether these mechanisms exist and, if so,
how important they might be is evaluated in section 1.3 below.
Box 1. WTO rules on unfair trade
The legitimacy of international competition depends on competition being ‘fair’.
International trade rules recognise two cases of unfair trade where governments are
entitled to protect local producers from unfair competition. One is where an exported
product benefits from a specific subsidy that gives it an unfair advantage over domestic
producers. The other situation is where a company exports a product at a price lower than
the price it normally charges on its own home market and is said to be ‘dumping’ the
product. The WTO’s Subsidies and Countervailing Measures (SCM) Agreement and Anti-
Dumping (AD) Agreement govern how countries determine if countervailable subsidies or
dumping exist and the measures they can take against them.
Subsidies are widely used by governments to achieve desired objectives. The SCM
Agreement applies to specific subsidies. A specific subsidy is defined as one available
only to an enterprise, industry, group of enterprises, or group of industries in the country
that gives the subsidy. Non-specific subsidies are those granted according to certain
objective criteria or conditions that are strictly adhered to, and eligibility is automatic, and
are deemed to be non-actionable. Article 8 of the Agreement envisaged a set of ‘non-
actionable’ subsidies that could not be challenged, such as certain R&D support,
assistance to disadvantaged regions or payment for environmental upgrading, but this
Article has now lapsed and is no longer relevant. Specific subsidies are either prohibited

9
(e.g. export subsidies) or are deemed actionable if they cause adverse effects to the
interests of another WTO member. Adverse effects include injury to the domestic industry
producing the like product, nullification or impairment of benefits accruing to another
member, or serious prejudice to the interests of another member. Where a country claims
it suffers adverse effects, it can ask the subsidising member to take appropriate steps to
remove the adverse effects or to withdraw the subsidy. Serious prejudice can arise where a
subsidy displaces or impedes the imports of a like product into the market of the
subsidising country, where it displaces the exports of another member from a third country
market, or where it leads to significant price suppression or lost sales. A country can either
use the WTO’s dispute settlement procedure to seek the withdrawal of the subsidy or the
removal of its adverse effects, or it can launch its own investigation based on procedures
set out in the SCM Agreement to decide whether subsidised imports hurting domestic
producers exist and the appropriate level of countervailing duties that should be applied.
Under the WTO Agreement on Agriculture, domestic agricultural subsidies that were
within a country’s level of commitments (in the case of ‘amber box’ and ‘blue box’
subsidies) or that were notified in the ‘green box’ benefited from a ‘due restraint’ or
‘peace’ clause for a period of time. Under the peace clause, compliant agricultural
subsidies could not be challenged and ‘green box’ subsidies could not be subject to
countervailing duties. Since the end of the implementation period in 2004, the peace
clause no longer applies. The consistency of any agricultural subsidy with the SCM
Agreement can be challenged and countervailing duties can be imposed on any
agricultural subsidies including ‘green box’ subsidies.
The other recognised case of unfair competition is dumping. Dumping exists when the
export price of a product falls below its ‘normal value’. The AD Agreement provides for
various ways to calculate a product’s ‘normal value’. The main one is based on the price
in the exporter’s domestic market. When this cannot be used, two alternatives are
available: the price charged by the exporter in another country, or a constructed value
calculation based on the combination of the exporter’s production costs, other expenses
and normal profit margins. The agreement also specifies how a fair comparison can be
made between the export price and what would be a normal price (adjusting for
differences in transport costs, selling costs etc.). Under WTO rules, anti-dumping
measures can only be applied if the dumping is hurting the industry in the importing
country. Typically, an anti-dumping action means charging extra import duty on the
particular product from the particular exporting country in order to bring its price closer to
the ‘normal value’ or to remove the injury to domestic industry in the importing country.
The final aspect of the terms of reference is that the study should focus on EU
food produced and exported to developing countries. Developing countries are
increasingly heterogeneous. Several developing countries have emerged as
significant and competitive agricultural exporters in recent years (some South
American and Asian countries). Others have small populations and high export
earnings from commodities (e.g. oil-exporting countries). This study pays
particular attention to what might be called ‘vulnerable’ developing countries
facing particular problems of food insecurity. For practical purposes this group
is defined as consisting of the Least Developed Countries (as officially defined

10
by the United Nations), the countries of Sub-Saharan Africa, and the African,
Caribbean and Pacific countries that are signatories to the Cotonou Agreement
with the EU. This makes a total of 83 countries. Reference is to Annex I for the
list of these vulnerable developing countries (VDCs).
1.3 Examining the impact of CAP subsidies on EU
exports to developing countries through literature
review
Previous literature has assessed the impact of CAP subsidies on developing
countries using a variety of different approaches and methodologies. Three
broad approaches can be identified: macro-level modelling studies, micro-level
case studies and studies examining the effects of specific CAP policy
instruments. These are discussed in Box 2.
Box 2. Classification of studies examining the impact of CAP subsidies on
developing countries
Macro-level modelling studies are popular among international organisations and
academic researchers. Examples include M’Barek et al. (2017) and Boysen et al. (2016).
They make use of complex economic models to assess the impact of CAP policies on
production, trade, domestic and world market prices, and economic welfare in developing
countries. CAP impacts are usually measured relative to ‘no policy’ or a free market
counterfactual scenario. The results of these models are very sensitive to the values used
for key parameters, for example, supply and demand elasticities that measure the response
of farmers and consumers in both developed and developing countries to changes in
prices, or trade elasticities that measure how easy it is to substitute imports from one
country for another in response to relative price changes, or the size of the impact of a
particular policy instrument (e.g. decoupled payments or rural development investment
aids) on production. Because the outputs of these models depend on the assumptions the
modeller makes regarding these input parameters, the results of macro-models do not
provide proof of the impact of the CAP but they can provide a useful consistency
framework to discuss these potential effects.
Micro-level case studies of the impact of exports of a specific EU product on livelihoods
of producers in one or more developing countries have often been conducted by
development NGOs as part of their efforts to campaign for CAP reform to mitigate or
eliminate its adverse effects on developing countries. Examples include studies of the
impact of EU milk exports to West Africa (Choplin, 2016, 2019), EU chicken exports to
Africa (Goodison, 2015) and tomato paste exports to Ghana (Paasch, 2008). Often using
personal testimonies by affected farmers, these studies seem often more realistic than the
results of modelling studies. The weakness of the case study approach is that it can be
difficult to demonstrate the causality between CAP policies and the competition faced by
local producers because the method, of its nature, does not allow the construction of a
counterfactual. Another possible criticism is that the focus of these studies on producer

11
livelihoods sometimes ignores the potential benefits to low-income consumers of low-
priced imports and thus fails to account for potential trade-offs arising from policy reform.
Analysis of the potential effects on production and prices of specific CAP policy
instruments is a third approach popular among academic and activist researchers.
Examples include the evaluation of the impact of eliminating decoupled payments by
Mittenzwei et al. (2012) and the production impact of coupled payments in the sugar beet
sector by Smit et al. (2017). This discussion often takes place in the context of the WTO
Agreement on Agriculture’s well-known classification of agricultural policies into red
(prohibited), amber, blue and green boxes with different disciplines applying to each.
Whether the CAP policies notified in the green box are as production-neutral as required
to fit this classification has been a particular focus of analysis.
Our literature review is structured around the two main concepts related to
‘unfair’ trade introduced in Box 1: whether CAP subsidies lead to price
suppression and lost sales by other countries (countervailable subsidy), and/or
whether they lead to export sales below the cost of production in the EU
(dumping).
1.3.1 Do CAP domestic subsidies stimulate production?
In the case of price suppression, the question refers to whether CAP subsidies
result in larger EU production (and thus potentially exports) than might exist in
the absence of these subsidies. Where subsidies stimulate EU production and
possibly exports, world market prices will be reduced to below the level they
otherwise would reach, with potentially adverse impacts on developing country
producers as a result. Most attention is focused in what follows on decoupled
direct payments because these are the dominant subsidy paid to farmers in the
EU. However, the potential impacts of coupled payments, rural development
payments, market management instruments, risk management instruments and
export promotion policy are also reviewed.
► Decoupled direct payments
EU agricultural income is heavily dependent on the direct payments received
under the CAP. On average across the EU, Pillar 1 direct payments in 2011-
2015 accounted for 27% of agricultural factor income; when Pillar 2 payments
such as agri-environment payments and compensatory payments for farming in
areas facing natural constraints are added, the total rises to 38%.1 For the period
1 Figures are from DG AGRI ‘Share of direct payments and total subsidies in agricultural factor income’,
accessed 24 March 2019. Agricultural factor income represents the income generated by farming which is used
to remunerate borrowed/rented factors of production (capital, wages and land rents), and own production factors

12
2014-2018, total support including national payments as a share of agricultural
factor income amounted to 35%, while expressed as a share of family farm
income, the share amounted to 57%.2 For individual countries the percentages
can be higher, and for individual enterprises within countries (e.g. beef farming)
the percentages can be higher still (DG AGRI, 2018d). Direct payments make
up the majority of this support and it may seem to be evident that support of this
magnitude must influence the capacity of the EU agricultural sector to produce.
However, evidence on the size of any stimulus effect is not easy to come by.
Truly decoupled payments do not affect the marginal incentive to produce. But
there are a number of mechanisms whereby even decoupled payments might be
expected to encourage additional production compared to the absence of such
payments, although the literature generally suggests that the magnitude of these
effects is small (Rude, 2008; Moro and Sckokai, 2013). Payments that are
decoupled in a static and riskless world are no longer production neutral in a
dynamic and risky world. The mechanisms include: maintaining and improving
farmer wealth, leading to higher investment and changing attitudes to risk
(insurance and wealth effects); increased access to credit where imperfect credit
markets exist; farmer expectations about future programme eligibility and
payment basis affecting current production decisions; slowing or accelerating
farm consolidation; conditional requirements on the receipt of direct payments
such as cross-compliance which impinge on farmers’ production decisions; and
the cumulative impact of payments when they are given on top of other
mechanisms of producer support such as border protection through tariffs
(Gasperin and Doporto Miguez, 2009).
Critics also point out that the EU’s decoupled payments may not fulfil the
criteria necessary to satisfy the conditions of the WTO green box. These criteria
require, inter alia, that the amount of such payments in any given year shall not
be related to, or based on, the type or volume of production (including livestock
units) undertaken by the producer in any year after the base period; the amount
of such payments in any given year shall not be related to, or based on, the
factors of production employed in any year after the base period; and no
production shall be required in order to receive such payments. Decoupled
payments in the EU arguably remain coupled to agricultural area as farmers
must show they have eligible hectares to get their payments, while eligibility
also depends on farmers showing that they carry out “a minimum activity,
defined by Member States, on agricultural areas naturally kept in a state
suitable for grazing or cultivation” which suggests there is a continued link to
(own labour, capital and land). Agricultural entrepreneurial income (also called family farm income) in the EU
agricultural accounts deducts the costs of paid labour, paid interest and paid rent. 2 Matthews, A., ‘The dependence of EU farm income on public support, 20 April 2016, accessed 24 March 2019.

13
production (Bertholot, 2018; Swinbank and Tranter, 2005). A possible EU
challenge at the WTO to the recent decision by the US Department of
Commerce to impose countervailing and anti-dumping duties on imports of
Spanish ripe olives in large part because of the decoupled payments received by
Spanish olive growers may clarify some of these issues (Box 3).
Box 3. The US Spanish olives case on subsidies
Question marks have been raised over the EU’s notification of its decoupled direct
payments in the WTO green box and its coupled payments in the blue box. However, there
has been no legal determination of these issues because no other WTO member has
challenged the EU’s notifications and no member has attempted to show that they have
suffered an adverse effect due to these subsidies. This may change as a result of the
decision of the US Department of Commerce to impose countervailing and anti-dumping
duties in 2018 on the import of Spanish ripe olives (US Department of Commerce, 2018).
The EU has initiated a dispute on this issue at the WTO, and a panel was formed in June
2019 to hear the dispute (WTO, 2019a).
The US action is in response to a complaint by domestic producers of ripe olives that
Spanish ripe olives were unfairly subsidised because olive growers received CAP
subsidies in the form of direct payments as well as through several other measures. The
exporters, supported by the European Commission, argued that direct payments were not a
subsidy to olive production as they were not linked to the production of olives. They also
argued that there was no evidence of ‘pass-through’ of any benefit that olive growers
might have received to the processors of ripe olives and therefore no subsidy to the
exporters. To the contrary, the US Department of Commerce found that the subsidies olive
growers received were crop specific and were passed on to the processors and exporters.
Recalling that green box subsidies are actionable under the SCM agreement and give rise
to a countervailing duty if there is a finding of adverse effect, in this case, it was found
that there was material injury to the domestic industry (USITC, 2018).
Some commentators have warned that this finding represents a direct attack by the US on
the principle of decoupled subsidies. The European Parliament (EP) claimed that “the
decision calls into question, in an unfair and arbitrary manner, all the EU’s farming
support programmes and could potentially affect all recipients of payments under the
CAP” (EP, 2018). However, the reasoning used in the case was quite specific. The US
Department of Commerce accepted evidence that the Basic Payment received by olive
growers in the 2014-2020 period was linked to the Single Payment Scheme (SPS)
payment they received in the 2005-2013 period. In turn, the grant amount provided to
olive farmers under the SPS was based on the average grant amount olive farmers received
in 1999 through 2002 under the Common Organization of Markets in Oil programme. This
grant amount provided in 1999 through 2002 was based on the type of crop grown and the
production value created from the crop. Therefore, the Department of Commerce
concluded that the annual grant amount received by olive growers under the Basic
Payment Scheme in 2016 was based on annual grant amounts that were crop specific, as
they were directly related to the grant amount only olive growers received under Common
Organization of Markets in Oil program. What attracted the Department’s criticism was
not direct payments per se, but rather that Spain has continued to use the historical basis
for determining the value of the Basic Payment to farmers. It is this link with the past,

14
rather than the nature of decoupled payments in themselves, which was the foundation for
the US finding that Spanish ripe olives were subsidised.
The EU complaint has several strands (WTO, 2019b). It first claims that the Basic
Payment is not a specific subsidy within the meaning of the SCM Agreement, thus
reiterating its view that decoupled payments by their nature are not specific within the
meaning of the SCM Agreement and thus cannot be the basis for countervailing action. It
also claims that the Commerce Department did not perform a pass-through analysis to
confirm that any subsidy to growers did benefit exporters (which the Commerce
Department defends on the basis that this is not necessary under US law). Finally, it
claims that the injury determination undertaken by the USITC was flawed in several
respects. The findings of this dispute could help to clarify some of the legal issues around
the trade-distorting effects of decoupled direct payments. In the absence of legal
clarification whether the EU’s decoupled direct payments are trade-distorting or not, the
focus in this study is on economic assessments to see what insights they provide.
Where they exist, the production effects of decoupled payments will be smaller
than those of coupled payments and much smaller than market price support.
Because of the difficulties in imagining a fully decoupled policy, the OECD
suggests it makes more sense to discuss the production impacts of direct
payments in terms of the ‘degree of decoupling’, compared to the production
effects of a fully coupled policy usually taken to be market price support
(OECD, 2001).
Potential production effects also depend on the obligations farmers must follow
for eligibility for these payments. In the EU, eligibility for direct payments
depends on farmers observing cross-compliance conditions. While many of
these are statutory obligations which farmers must follow in any case, others go
beyond legal requirements in restricting what farmers may do or oblige them to
implement specific farming practices. Thus cross-compliance raises farmers’
costs and offsets some of any production stimulus from decoupled payments.
The greening payment introduced in the 2013 CAP reform can be viewed in this
context as ‘enhanced’ cross-compliance as it requires farmers to observe
additional requirements to be eligible for 30% of the CAP Pillar 1 payments. It
is worth underlining how little growth in agricultural output has occurred in the
EU since the introduction of decoupled direct payments after 2005. In 2018, EU
agricultural output was less than 10% higher than in 2005, and some of this was
catch up in the new MSs – in the EU15 output was just 8% higher 13 years
later.3
3 For a more complete evaluation of the production effects of EU decoupled direct payments, also taking into
account the potential impacts on technical efficiency, production growth and farm structures, see Matthews,
Salvatici, and Scoppola (2016).

15
► Coupled direct payments
Most, but not all, CAP Pillar 1 payments are decoupled. The 2013 CAP reform
altered the framework for coupled direct payments. The list of sectors eligible
for coupled support payments is greatly expanded to cover nearly all agricultural
production. Total coupled support is limited to 8% of each Member State’s
direct payments ceiling, or exceptionally to 13% in some countries. These
percentages can be increased by up to 2 percentage points if this support is used
for protein crops. In the original Direct Payments Regulation (Regulation (EU)
No 1307/2013), all voluntary coupled payments within these ceilings should
comply with a number of conditions, as follows: i) coupled support should only
be granted to those sectors or to those regions of a Member State where specific
types of farming or specific agricultural sectors that are particularly important
for economic, social or environmental reasons undergo certain difficulties; ii)
coupled support should only be granted to the extent necessary to create an
incentive to maintain current levels of production in the sectors or regions
concerned; iii) coupled support should take the form of an annual payment and
should be granted within defined quantitative limits and be based on fixed areas
and yields or on a fixed number of animals. Limits should reflect the production
levels in the targeted region or sector in at least one year in the period of 5 years
that precedes the year of the decision about coupled support.
The above conditions were intended to ensure that future coupled payments
would qualify as blue box payments under the WTO Agreement on Agriculture
disciplines on domestic support. The Omnibus (Agricultural Provisions)
Regulation (EU) 2017/2393 significantly relaxed these conditions by removing
the constraint that coupled support may only be granted to the extent necessary
to create an incentive to maintain current levels of production in the sectors or
regions concerned. Furthermore, the limitation that coupled payments should be
granted within defined quantitative limits (in turn, set at the maximum yields,
area or number of animals reached in one of the previous five years) was
removed. Instead, coupled support is now defined as a production-limiting
scheme that shall take the form of an annual payment based on fixed areas and
yields or on a fixed number of animals and shall respect financial ceilings to be
determined by MSs for each measure and notified to the Commission. The
consequence of these changes is that coupled support can now be given even
where it leads to an increase in production beyond historical levels.
The use of this voluntary instrument by MSs shows a very varied pattern (DG
AGRI, 2018a). Nine MSs opted to use less than the standard 8% ceiling while
eleven MSs have the maximum percentage of 13% with 9 of these also using all
or part of the additional 2% available in case of support to the protein crops
sector. Three older MSs (Belgium, Portugal and Finland) were given permission

16
to exceed the 13% limit. Germany is the only MS not to provide coupled
support. In total, around 10% of CAP Pillar 1 direct payments are now coupled
(excluding cotton payments) which is a small increase compared to the end of
the Health Check period in 2012. Beef and dairy are the most supported sectors,
with smaller amounts going to other sectors such as sheep and goats, protein
crops and fruit and vegetables.
Coupled support provides a direct incentive to farmers to maintain and even
increase production and is thus classified as trade-distorting support under the
WTO Agreement on Agriculture. However, if the support is linked to production
limitations, it can be notified as blue box support which is exempt from any
disciplines on the amount of support that may be granted. As discussed above,
the changes introduced in the Omnibus Regulation remove any limit on where
this production limitation can be set and allow coupled payments to be used to
support increases in production.
Literature estimating the production effects of current coupled payments in the
EU is relatively sparse. In its impact assessment of the CAP post 2020
proposals, the Commission examined the production and price effects of
coupled payments for dairy, beef and sugar beet producers. It found that coupled
payments increased beef production by 2.4% and lowered beef prices by 3.2%,
and increased sugar production by 2.8% and lowered sugar prices by 3.9%.
However, counter-intuitively, it found that coupled payments to dairy cows
lowered milk supply by 0.7% and slightly raised milk prices by 1.4% (EC,
2018). Smit et al. (2017) examined the production impact of coupled payments
to sugar beet, which account for around 9% of all coupled payments in the EU.
They estimated that these payments increased sugar beet production in the EU
by 1.3% and as a result sugar beet prices in the EU were lowered by around
4.5%.
► Market intervention measures
The CAP continues to make use of various instruments to support domestic
prices during low periods in the price cycle. These include intervention
arrangements at safety-net levels for some commodities, private storage aid,
market withdrawal of fruits and vegetables undertaken by producer
organisations, and temporary planning of supply during market crises.
Intervention expenditure was at relatively low levels by 2005 and had virtually
ceased by 2013. However, because of difficult market conditions for fruits and
vegetables, pigmeat and dairy products since the end of 2014 and because of the
Russian ban on imports of certain EU agricultural products and of global market
conditions, expenditure on intervention measures has increased again in recent
years.

17
The conventional view is that domestic policies to stabilise agricultural markets
destabilise international markets (Josling et al., 2010). For example, with respect
to the milk market, it has been argued that insulating EU milk producers from
the worst effects of price declines sustains EU milk production and subsequent
exports at levels which would not be the case in the absence of this range of
safety-net interventions (Curtis, 2011). This view was developed in the context
of the variable import levy and export subsidy system used by the EU to
stabilise domestic prices. Support provided through minimum support prices,
intervention prices and other forms of administered prices usually relies for
effectiveness on border measures, but the use of administered prices can by
itself distort production and trade. The WTO Agreement on Agriculture
therefore includes support through administered prices in the sum of certain
trade-distorting domestic support that is subject to a limit.
► Pillar 2 payments
Most criticism of the CAP for distorting global agricultural markets focuses on
its farm income support and market management measures financed by Pillar 1
(as well as the high import protection which is formally a part of EU trade
policy rather than the CAP). However, expenditure on Pillar 2 rural
development measures now makes up almost one-quarter of CAP expenditure so
it should not be overlooked. The measures supported by Pillar 2 include support
for knowledge transfer, investment aids, regional assistance programmes,
environmental programmes, forestry, risk management and locally-led job
creation initiatives in rural areas. Half of Pillar 2 spending goes on agri-
environment and climate actions, with the remainder divided between
competitiveness measures, general rural development and food chain actions.
All expenditure on these measures is notified as green box expenditure in the
EU’s WTO notifications but they may still have some production and thus trade
impacts.
In some cases (e.g. agri-environment measures) the impact is likely to reduce
EU production relative to a non-policy benchmark. In other cases (support for
knowledge transfer and innovation, measures to improve physical and human
capital) the measures are likely to strengthen the EU’s production capacity even
if they are exempted from being counted as part of WTO trade-distorting
domestic support. On balance, model estimates suggest that rural development
expenditure reduces agricultural productivity principally because the
significance of the agri-environment measures outweighs measures such as
investment aids and knowledge transfer which might be expected to increase
productivity (Schroeder, Gocht and Britz, 2015).

18
► Risk management measures
Risk management tools are designed to help farmers meet either production
and/or price risks. Farmers normally try to mitigate normal risks themselves
(weather fluctuations, pests and diseases, normal price volatility) through
diversification, the use of technology, or use of market-based instruments such
as forward selling or contracting. For well-known reasons, there is often
inadequate provision of market-based risk management insurance instruments
both for production and market risks. In other countries, such as the US, Canada
and Australia, significant government support is provided to subsidise either
production (yield) insurance or income/revenue stabilisation schemes. The EU
has begun to move cautiously in this direction.
Risk-related policies have the potential to distort production and trade. Where
risk is reduced, farmers will tend to expand risky production activities at the
expense of diversification and other risk management activities. Overall
resources employed in agriculture are also likely to expand when policy
measures make farming less susceptible to risk. Empirical evidence suggests
that the production impacts of risk reduction measures are likely to be small. For
example, the extensive farm safety-net in the US consisting of loan rates and
counter-cyclical payments was estimated to be equivalent to an increase in
average price support for US agriculture by mostly less than 0.5% (OECD,
2011).4 Production impacts are enhanced if, for political economy reasons, risk-
related policies are used as a politically convenient vehicle for farm income
support (Tangermann, 2011).
The 2013 CAP reform moved risk management into Pillar 2 of the CAP.5 The
risk management toolkit in Pillar 2 now contains three instruments: i) financial
contributions to premiums for crop, animal and plant insurance against
economic losses to farmers caused by adverse climatic events, animal or plant
diseases, pest infestation, or an environmental incident; ii) financial
contributions to mutual funds to pay financial compensations to farmers, for
economic losses caused by adverse climatic events or by the outbreak of an
animal or plant disease or pest infestation or an environmental incident; and iii)
an income stabilisation tool, in the form of financial contributions to mutual
funds, providing compensation to farmers for a severe drop in their income. In
each case, the Rural Development Regulation sets out conditions limiting the
extent of support that can be provided which are based on the policy criteria for
4 This is confirmed by the relatively few EU studies on the topic. For example, Garrido, Bielza, and Sumpsi
(2003) in an econometric study estimated that a 35% increase in subsidies to yield insurance in Spain had about
the same effect on cereal production as a 1% increase in cereal prices. 5 There are also risk management tools in the fruits and vegetables, and wine, sectors in the CMO Regulation.

19
notification as green box measures under the WTO Agreement on Agriculture.
These conditions were relaxed in the Omnibus (Agricultural Provisions)
Regulation in 2018 in order to make these schemes more attractive to farmers.
Although CAP support for agricultural risk management is increasing, the share
of CAP funds being spent on crisis and prevention measures continues to be
very low, less than 2% of the Pillar 2 funds and 0.4% of the total CAP budget in
the 2014-2020 period (Bardají and Garrido, 2016). In consequence, the
distortion implications are limited. Furthermore, with a given overall amount of
budgetary resources for rural development programmes, the farm income safety
nets at the Member State level under Pillar 2 displace other Pillar 2 policies
which may have even greater production-stimulating effects.
► Export promotion policy
The reduction in EU market price supports has slowly aligned EU market prices
with world market prices for a growing number of agricultural products, thus
improving the competitiveness of EU products on world markets. The EU is
now the largest global agri-food exporter. Promoting agri-food exports and
finding new markets has been an important objective of the Commissioner for
Agriculture and Rural Development Phil Hogan since he took up the position,
and he has led trade missions to a number of third countries, including in Asia
and Latin America.
The CAP also provides funding to support the promotion of agri-food exports. A
new promotion policy came into force in December 2015.6 This increased the
annual promotion budget from EUR 61 million in 2013 to EUR 200 million by
2019, introduced a greater focus on third countries as well as several measures
to simplify and make the scheme more attractive for exporters. Whereas one-
third of expenditure was earmarked for export markets under the previous
policy, this share has now been increased to two-thirds of a larger budget.
Annual work programmes set out the total budget with specific allocations for
different types of actions targeting different thematic priorities and geographical
areas. For example, in the 2016 work programme which disbursed EUR 111
million in promotion grants, EUR 4.69 million was reserved for information and
promotion campaigns targeting the Middle East and Africa. Four projects were
approved under this heading, including Greek olives to Saudi Arabia and the
United Arab Emirates, Croatian sheepmeat and cheese to Qatar and the United
Arab Emirates, Lithuanian beer to South Africa, and Polish fruit to Algeria and
6 Regulation (EU) No 1144/2014 of the European Parliament and of the Council of 22 October 2014 on
information provision and promotion measures concerning agricultural products implemented in the internal
market and in third countries.

20
Egypt. As the intention of this programme is to promote the export of high-
quality and thus high-priced rather than bulk EU agri-food products, LDCs/SSA
countries are unlikely to figure as target countries for this promotion budget. If
this were to change, the impact of this expenditure should be evaluated through
a PCD lens.
1.3.2 Do CAP domestic subsidies permit dumping?
A second mechanism whereby the prices of EU agri-food exports can be
affected by CAP subsidies is by the export of EU produce at prices below the
costs of production in the EU, analogous to dumping. To the extent that
dumping is shown to occur for this reason, a corollary is that EU production will
be higher than it otherwise would be in the absence of CAP subsidies. In this
situation, dumping would also be associated with price suppression.
Nonetheless, it is analytically useful to keep the two types of effect distinct.
Recall that, under WTO rules, dumping is defined as a situation in which the
export price of a product is lower than its selling price in the exporting country.
Where it is demonstrated that the dumped imports are causing injury to the
competing industry in the importing country, the importing country can impose
anti-dumping measures to provide relief to domestic industries injured by
imports. The country’s imposition of an anti-dumping duty is determined by the
dumping margin - the difference between the export price and the domestic
selling price in the exporting country. By adding the dumping margin to the
export price, the dumped price can be rendered a ‘fair’ trade price (see Box 1).
A number of authors have alleged that EU export prices are affected by dumping
(Bertholot, 2018; Oxfam Deutschland, 2009). Bertholot points out that the move
to greater market orientation in EU agricultural policy means that EU producer
prices are now close to world market levels. With export subsidies eliminated,
export prices are usually similar to domestic prices (adjusting for marketing
costs and quality differences) so that dumping in a narrow sense does not occur.
However, he argues that, in the absence of decoupled payments, producer prices
would be higher and that, at the lower prices, neither export prices nor ‘normal’
prices cover the costs of production of EU farmers. Therefore, in his view, all
products produced on land that benefits from direct payments are effectively
subsidised and if exported are effectively dumped. In this section, reference to
dumping refers to this wider notion where export sales take place at below the
costs of production.
Costs of production on EU farms are analysed in the Commission’s Farm
Accountancy Data Network (FADN). Costs of production per product cannot be
directly obtained from the farm accountancy data which are collected on a per

21
farm basis. However, the FADN Unit has built several models to estimate costs
and margins for different products: arable crops, milk and beef, and permanent
crops. These models allocate farm costs to a particular product using different
ratios. The net economic margin assesses the residual revenue (profit or loss)
obtained from production, after remuneration of all production factors including
imputed family factors (opportunity costs for family factors).7 FADN reports
show that the net economic margin for the production of various products in the
EU is consistently negative although the size of the negative margin varies over
time (for milk see DG AGRI, 2018b; for beef see DG AGRI, 2013; for cereals
see DG AGRI, 2016). The European Milk Board also publishes costs of
production data for milk production in several important milk-producing
countries using a similar methodology and reaches the same conclusion (EMB,
2018). The FADN data refer to average costs of production across all producers.
There are significant differences in costs of production across individual farms,
depending on their production scale, type of production, farm-specific factors
and management expertise. In 2016, the FADN report estimated that 9% of the
EU28 dairy farms achieved a positive net economic margin, representing 15% of
the milk production of EU dairy farms (DG AGRI, 2018b).
The fact that market prices do not cover the production costs of most farms in
the EU when full opportunity costs of family labour and land are included
implies that the farm-specific factors of production are unable to earn a
comparable return to similar factors of production in non-farm activities. In the
case of family labour on farms, it is a signal that the use of labour in farming
activities is less productive relative to its use in other economic sectors. The fact
that resources in agriculture, on average, are unable to earn the ‘going rate’ in
the rest of the economy is an indicator that further movement of labour out of
agriculture into the non-farm sector in Europe will continue for some time to
come and a signal that further structural adjustment of the agricultural sector is
required.
Where a charge of dumping might be justified is if government direct payments
are used by farmers to ‘subsidise’ their farming activity thus enabling them to
remain in farming despite low market returns. From an economic perspective
this is not a rational thing to do, but farmers may have personal reasons to want
to continue doing what they are used to do. Direct payments play an ambiguous
role. On the one hand, direct payments are capitalised into the value of land and
variable inputs, thus raising farmers’ costs of production and making it more
difficult to show a profit at market prices alone. If direct payments were
7 Since 2008, imputed costs for unpaid family factors have been estimated (family labour costs and own capital
costs). The methodology for estimating the opportunity costs of family labour, land and capital is explained in
DG AGRI, 2018b.

22
eliminated, land rents and the prices of variable inputs would fall, enhancing the
profitability of farms at market prices. On the other hand, this offsetting effect
will always only account for a proportion of the direct payments. There is still a
net gain to farm income from the payments, even if it is less than the full value
of the payments themselves.
Supporters of decoupled payments can argue that there is no requirement that
farmers use these payments to subsidise their farming activity. Farmers will
receive the payments even if they cease production because it is unprofitable at
market prices. Farmers may also choose to subsidise their production from other
income such as pension income or from off-farm employment. But even where
it is the farmer’s decision how to use the decoupled payment, the availability of
the payment increases the financial capacity of farmers to subsidise their
farming if they wish, not least because the beneficiary must remain an active
farmer to continue to be eligible for the payment. This likely contributes to the
fact that observed costs of production are higher than market prices on most
farms.
Does the evidence that producer prices do not cover the full opportunity costs of
the resources employed in EU agricultural production mean that agri-food
products exported from Europe are dumped as a result? If we take a strict
definition of dumping (see Box 1) to mean that export prices are lower than
domestic prices, now that export subsidies are abolished this is no longer the
case. However, taking a wider definition to mean that dumping occurs when
costs of production are greater than the export price, there is prima facie
evidence that this is the case. The adverse effect occurs because the CAP
subsidies help to maintain more resources in agricultural production in the EU
than would otherwise be the case, thus resulting in price suppression on world
markets.
1.3.3 The magnitude of the effect of CAP subsidies
This literature review has documented the potential impact of CAP subsidies on
domestic and export prices through mechanisms that may attract additional
resources into the EU agricultural sector. On the one hand, decoupled and
coupled payments as well as rural development support can support agricultural
production. On the other hand, the support to farm income provided by direct
payments means that many farms remain in production even though market
prices are insufficient to cover their production costs if the full opportunity costs
of their family labour input as well as land and capital are included. A third
mechanism affecting domestic prices, namely, high import protection for
sensitive products, is not explicitly considered in this study.

23
To assess the size of these potential impacts requires the use of model-based
analyses. Model studies have the advantage that they can compare the observed
situation of farm production in the EU with CAP subsidies in place with a
counterfactual situation where these subsidies are removed. However, model
studies also suffer from limitations that need to be kept in mind when
interpreting their results (Box 4).
Box 4. Modelling decoupled payments in empirical models
A basic problem facing any empirical attempt to model the impact of the CAP and
agricultural trade policy on production and trade is how to model decoupled direct
payments. Should they be modelled as a lump-sum transfer to farm households, as area
payments, or as something else? If treated as a lump-sum payment to households, then
CAP payments have no impact at all on farmers’ production decisions, either in terms of
input use (demand for land) or output supply (particularly yields). However, lump-sum
payments are not capitalised into land prices which is not consistent with the empirical
evidence.
CAP Pillar 1 direct payments can also be modelled as area payments, i.e. a subsidy to
land. In this case, if the land area is fixed, all of the payment will be capitalised into land
values, but there will still be no effect on overall agricultural output. If the land area under
cultivation can be increased in response to the extra demand for land created by the area-
based subsidy, then output will also increase, with the extent of the increase determined by
the extent to which non-land inputs can be substituted for land. For many analysts, this
assumption is also too extreme bearing in mind the various ways in which even decoupled
payments are expected to affect production incentives and the empirical evidence which
shows that capitalisation of direct payments into land values is only partial and
incomplete. Other analysts assume that some share of the decoupled payments accrues
also to labour and capital employed in agriculture and thus affects production levels in the
EU.
The problem is that choosing the appropriate degree of decoupling is largely an ad hoc
decision, given the lack of agreement in the literature as to what the correct value is. Most
modelling studies simply make an assumption about the degree of decoupling and the
empirical results reflect this assumption rather than providing evidence about it.
One careful study (Mittenzwei, Britz, and Wieck, 2012) concluded that the
elimination of EU direct payments would lead to a 5% reduction of land use of
agriculture, with a consequent drop in agricultural output and net exports. In
other words, there is a production response to decoupled direct payments, but it
is small. This finding is supported by more recent work undertaken for DG
AGRI as part of the impact assessment of its legal proposal for the CAP post
2020. DG AGRI commissioned a number of model simulations for different
designs of the CAP (EC, 2018). One of these simulations examined what might
happen to EU agricultural output, incomes and trade if the CAP were abolished
and no subsidies were paid to EU farmers. The results are reported in the Joint

24
Research Centre SCENAR 2030 study which fed into the impact assessment
(M’Barek et al., 2017). These results are also useful in providing an order of
magnitude of the production effects due to CAP subsidies.
Two specific scenarios modelled (the Liberalisation&Productivity - Lib&Prod -
scenario and the NoCAP scenario) illustrate what would be projected to happen
if the EU’s agriculture-specific support policies would be abolished by 2030. In
both scenarios, both decoupled and coupled direct payments are abolished.
While the EU’s tariff barriers are left in place, both scenarios assume ambitious
implementation of all free trade agreements (FTAs) currently under discussion.8
The main difference between the two scenarios relates to expenditure on Pillar 2
rural development measures. Pillar 2 spending is maintained in the Lib&Prod
scenario but redistributed away from agri-environment-climate measures
(payments to areas facing natural constraints and agri-environment payments) in
favour of investments in physical and human capital. The significance of these
changes is to reduce the importance of productivity-restraining measures (such
as agri-environment-climate measures) and to increase the importance of
measures with a positive productivity effect, such as support for investments and
human capital formation. In the NoCAP scenario, Pillar 2 expenditure is also
eliminated along with Pillar 1 subsidies.
The production impacts of CAP subsidies based on the SCENAR 2030 results
are shown in Table 1. The scenarios show the impact of removing CAP
subsidies. Reversing the sign of these effects shows the impact of maintaining
CAP subsidies relative a situation where the subsidies are removed.
Table 1. Production impacts of eliminating CAP subsidies under two scenarios
Impact Lib&Prod scenario NoCAP scenario
Agricultural production -4% -6%
Producer prices -1% +5%
Utilised agricultural area -7.3% -6.9%
Nitrogen surplus +2 kg N/ha +0.5 kg N/ha
Aggregate farm income -20% -18%
National GDP Positive overall
(++ EU15/- EU13)
Positive overall
(+ EU15/-- EU13)
Source: M’Barek et al. (2017).
8 The trade liberalisation scenario assumes full tariff liberalisation for 98.5% of HS six-digit lines, and a partial
tariff reduction of 50% for the other lines (sensitive products) for the ongoing and upcoming FTAs between the
EU and 12 trade partners (USA, Canada, Mercosur, Australia, New Zealand, Japan, Vietnam, Thailand, Turkey,
Mexico, Philippines and Indonesia).

25
In both scenarios, there is a small drop in total agricultural production when
subsidies are removed very similar to that found in the Mittenzwei, Britz, and
Wieck (2012) paper (it should be noted that the same CAPRI model is used in
both studies). The drop is somewhat greater when the Pillar 2 subsidies are also
removed in the NoCAP scenario. In the Lib&Prod scenario, EU producer prices
drop by almost 1%, as EU production decreases are compensated by cheaper
imports. With the elimination of all CAP payments, the stronger EU production
declines cannot be fully compensated by imports, leading to increased
aggregated EU producer prices of about 5% in the NoCAP scenario. The
removal of direct payments leads to a drop in the profitability of crop and
livestock production, and results in around 7% of the utilised agricultural area
(UAA) being taken out of production. As a result, the nitrogen surplus increases
in both scenarios reflecting both the decrease in UAA and the intensification of
crop and livestock production on the remaining UAA.
Imports increase in both scenarios, leading to a decrease in the EU trade
balance. Although exports in the Lib&Prod scenario grow substantially because
of the more favourable access obtained in third country markets because of the
ambitious trade agenda implemented in this scenario, they cannot compensate
for the higher level of imports. In the NoCAP scenario, the trade balance is
reduced by about EUR 25 billion. This is greater than the projected trade surplus
in 2030 under the reference scenario, bringing the EU back to net importer
status. However, the study does not report the impact on world market prices of
these trade balance changes. It should also be recalled that these trade effects are
due both to some trade liberalisation as well as the removal of CAP subsidies.
There are very few recent model-based studies that specifically examine the
impact of CAP subsidies on developing countries. One such study examines the
impact of CAP subsidies on Uganda (Boysen, Jensen, and Matthews, 2016).
Uganda is a least developed country with a high dependence on agriculture and
a high share of agri-food exports in total exports. It also benefits from
unrestricted access (subject to rules of origin) to the EU market for agri-food
products under the Everything but Arms agreement. Their empirical results
simulate the removal of remaining border protection as well as direct payments
to EU farmers. They find overall a marginal but positive impact on Uganda of
further CAP reform. Their results are driven largely by the assumption that EU
direct payments are only partially decoupled and encourage a higher level of
agricultural production than in the absence of the CAP. The removal of border
measures turns out to have a negative effect on Uganda because it is a
preference beneficiary, but this effect does not outweigh the positive effect of
eliminating direct payments.

26
Summarising this review of literature, we find there is evidence that CAP
subsidies continue to have a production-stimulating effect despite the reform
path of the CAP in recent decades. Decoupled direct payments, but also coupled
direct payments and productivity-enhancing investments under Pillar 2, are
mainly responsible for this effect. EU agricultural production is greater and so
are net exports as a result. We also find that the magnitude of this effect at the
aggregate level is relatively small, with the best recent estimates suggesting that
EU production is around 5%-6% higher than it might be in the absence of CAP
subsidies. Depending on the initial levels of profitability of different farm
products, and the way coupled payments are allocated to individual products,
production effects for specific products may well be greater. While these are the
effects due to agricultural policy, in assessing their importance it should be
recalled that several EU non-agricultural policies also lay claim to land use,
divert land out of the agricultural production and potentially raise agricultural
prices, thus offsetting any potential CAP effects that increase agricultural
production. These include renewable energy mandates supporting biofuel and
biomass production, climate policy encouraging afforestation, nature policy
prioritising habitat protection for biodiversity reasons, and bioeconomy policy
encouraging the use of biological raw materials for industrial uses.

27
Part 2 Product case studies of EU exports
This part first sets the scene by describing the EU’s role in global agri-food trade
and exports to VDCs. Then, three case study products are selected for detailed
analysis to identify the main importing countries among VDCs and the
importance of the EU as an exporter to these markets.
2.1 EU agri-food exports to developing countries
Global agricultural trade is experiencing rapid structural changes with the
emergence of new players and the shrinking role of traditional exporters. For the
analysis in this study data trends from 2005 have been used where possible.
2005 has been chosen because this was the year when the CAP in its current
incarnation (with income support provided largely through direct payments) was
introduced. It is also the first full calendar year when EU trade statistics reflect
the accession of the new MSs from Central and Eastern Europe.
Global agri-food trade (excluding intra-EU trade) increased from USD 374
billion in 2005 to USD 884 billion in 2017 (Figure 1).9 The EU’s share of this
trade has fallen slightly, from 17.7% on average in the three years at the
beginning of the period 2005-2007 (referred to as ‘2006’) to 15.6% on average
in the last three years 2015-2017 (referred to as ‘2016’) where three-year
averages are used to smooth out year-to-year fluctuations. Other developed
economy exporters also lost market share, with the big gainers being exporters
from developing Asia as well as Commonwealth of Independent States (CIS)
exporters. The export shares of Latin America and the Caribbean and African
exporters remained stable over this period.
Developing Asia, including China, is the largest market for food exporters
(Figure 2). It has also grown faster, with food imports more than quadrupling in
size over the period, though there is some evidence that the pace of growth has
slowed down in the second half of the period. The EU is a relatively small
exporter to this market, accounting for 10% of total food exports to the region,
behind other developing Asia exporters, other developed country exporters and
Latin American & Caribbean exporters. Its market share did not change since
2005. However, despite its relatively small share of the developing Asia market,
9 Based on food exports data (excluding agricultural raw materials and fish) drawn from the WTO’s International
Trade Statistics database for the period 2005-2017.The considered product/sector is ‘Other food products’
defined in the WTO international trade statistics using the Standard International Trade Classification as SITC
Sections 0, 1, 4 and division 22 minus division 03.

28
total EU agri-food exports in ‘2016’ were worth over USD 26 billion (up from
USD 8 billion in ‘2006’). The corresponding figures for EU agri-food exports to
Africa (including North Africa) were less than USD 18 billion in ‘2016’,
compared to over USD 9 billion in ‘2006’. Asia is now a more important and
more dynamic growth market than Africa for EU agri-food exporters.
Figure 1. Share of EU in global agri-food
trade, 2005-2017
Figure 2. Food exports to developing Asia
by major exporter, 2005-2017
Source: WTO’s International Trade Statistics database.
The sources of food exports to Africa (including North Africa) are shown in
Figure 3. Over the period the value of food imports into Africa more than
doubled, although the period can be partitioned into two halves. All the increase
took place in the first half of the period, and imports stabilised or even fell in
value terms in the second half of the period. The EU is the major food exporter
to Africa, but has lost market share slightly (a reduction from 28% of total
exports in ‘2006’ to 25% in the three-year period ‘2016’) at the expense of
increased market share for developing Asia and other African exporters.
Figure 4 shows the growth in the value of food imports by LDCs over the past
decade. Food import growth has been rapid, more than tripling in value over the
period, though this growth has stabilised in recent years. Developing Asia
exporters are the largest supplier to LDCs, followed by African exporters, with
EU exporters in third place. Over the period, EU exports have grown more
slowly than exports from other sources, so that the EU has lost market share. It
accounted for 21% of exports to LDCs in ‘2006’ but just 13% in ‘2016’.
For specific developing country regions, the EU plays a more important role.
For example, for the countries making up the West African Economic and
Monetary Union – WAEMU (Benin, Burkina Faso, Cote d’Ivoire, Guinea-

29
Bissau, Mali, Niger, Senegal and Togo), food imports almost tripled in value,
from USD 3.3 billion to USD 9.1 billion over this period. The EU is by far the
most important exporter although it has lost market share to developing Asia
exporters. It accounted for 50% of total food exports in ‘2006’ and 45% in
‘2016’ (Figure 5).
Figure 3. Food exports to Africa by
major exporter, 2005-2017
Figure 4. Food exports to LDCs by major
exporter, 2005-2017
Figure 5. Food exports to WAEMU countries by major exporter, 2005-2017
Source: WTO’s International Trade Statistics database.
In summary, markets in developing Asia countries are now the most important
markets for EU agri-food exporters, and also the most dynamic. However, the
relative importance of the EU in food exports to developing countries varies
across developing country regions. For some African regions (such as
WAEMU) it supplies up to half of all food exports, but for other regions its
significance is much less (such as for LDCs where developing Asia countries are

30
the most important suppliers and the EU share is now around 13%). In all
markets, EU food exports have grown more slowly than exports from competing
suppliers, and the EU has been losing market share.
2.2 EU agri-food exports to vulnerable developing
countries
The next step is to identify the most important product groups in EU agri-food
exports to VDCs based on Eurostat COMEXT data 2005-2018. VDCs are
defined as those countries where competition from EU agri-food exports is most
likely to affect their food security. These 83 countries belong either to Sub-
Saharan Africa (SSA), the Least Developed Countries (LDCs) group or the
African, Caribbean and Pacific (ACP) country group (see Annex I). Agri-food
exports are defined as products in the HS1-24 chapters, excluding Chapter HS03
Fish.10 Of the 23 HS chapters that cover agri-food exports, eight chapters
account for 75% of total EU agri-food exports to the selected VDCs in 2018.
These are shown in Figure 6 together with all other chapters aggregated into an
‘Other HS2’ category.
Figure 6. EU agri-food exports to VDCs, by HS2 code, 2005-2018
Source: based on Eurostat COMEXT data.
10 Trade data from the Eurostat COMEXT database are classified according to the Combined Nomenclature
(CN) system where the CN is an eight-digit subdivision of the Harmonised System (HS), comprising four two-
digit levels: HS2, HS4, HS6 and CN8.

31
HS22 Beverages and spirits make up the single largest chapter (15% of total
2018 exports), followed by HS19 Cereal and milk preparations (12%), HS04
Dairy produce (including eggs) (12%) and HS02 Meats (9%). Overall, the value
of EU agri-food exports to these selected developing countries grew by 132%
between 2005 and 2018, though exports have stagnated since 2015 and in 2018
were back at their 2013 level. Meat exports make up the fastest growing
component (287% increase over the period), followed by cereal and milk
preparations and cereals (increases of 198% and 196%, respectively). The
lowest rates of increase were recorded for HS11 Flour and other milling
products (42%) and HS04 Dairy produce (53%) excluding milk preparations
(infant formulae and fat-filled milk powders) included in HS19.
A more detailed picture is provided by examining products at the HS 4-digit
level of disaggregation (Table 2). EU agri-food exports to the selected
developing countries are dominated by two groups of products. One group we
can call ‘luxury products’ which are imported to meet the demand of relatively
well-off consumers in these countries – processed foods, spirits, wine, malt,
mineral waters, beer, cheese, bread and cakes and chocolate. The other group are
basic food products which may also compete with local food production:
examples include wheat, milk powders, poultry meat, sugar, onions, tobacco,
pigmeat, sauces (including tomato paste), meat offals, milk and cream, prepared
vegetables and vegetable oils. Animal feed has been left unclassified. For this
sub-group of HS 4-digit products (those with export sales over EUR 100
million), the share of luxury products was 38% in 2005 and 37% in 2018. The
share of basic products was 60% in 2005 and 58% in 2018, while the share of
animal feedstuffs was 2% in 2005 and 5% in 2018.
Table 2. Exports of EU agri-food products at HS4 level valued at more than EUR 100
million in 2018 to VDCs, EUR million
Product 2005 2018 Growth
2005-2018 (%)
1901 Cereal and milk preparations,
including full-fat milk powder
268.14 915.91 242
1001 Wheat and meslin 275.11 846.40 208
0402 Milk powder and condensed milk 575.36 653.72 14
2208 Spirits 258.36 604.74 134
0207 Poultry meat 171.24 589.52 244
2106 Food preparations n.e.s. 222.66 581.34 161
2204 Wine 174.32 402.25 131
2309 Animal feedstuffs 63.71 361.29 467
1107 Malt 130.36 349.75 168
1701 Sugar 136.86 238.10 74
2202 Mineral waters 71.00 230.98 225
2203 Beer 101.50 222.36 119

32
Product 2005 2018 Growth
2005-2018 (%)
0406 Cheese 58.61 185.05 216
0703 Onions and similar vegetables 42.38 181.53 328
1905 Bread and cakes 54.46 169.88 212
2401 Tobacco 67.75 156.10 130
1507 Soybean oil 41.79 153.75 268
1806 Chocolate 31.69 152.82 382
0203 Pigmeat 28.73 146.33 409
2103 Sauces and pastes 37.39 136.66 265
0206 Meat offals 25.48 125.85 394
0401 Milk and cream 30.87 122.60 297
2005 Prepared vegetables 49.36 113.72 130
1512 Other vegetables oils 5.15 102.50 1889
Note: basic food products are in bold; n.e.s. = not elsewhere specified.
The single largest item by value in 2018 which has also experienced rapid
growth is cereal and milk preparations which is driven largely by the growth in
full-fat milk powders. Vegetable oils (including both soybean oil and other
vegetable oils) have experienced rapid growth but from a relatively low base.
Exports of pigmeat and meat offals have also grown rapidly from a low base.
Conversely, exports of basic milk powders to these selected developing
countries, though still important, have grown little over the period, while sugar
exports have also grown relatively slowly. Exports of wheat remain the most
important basic product and have grown relatively rapidly. Other products that
have grown rapidly include onions, sauces including tomato paste, and poultry
meat.
2.3 Literature review of previous studies
Product case studies have mainly been undertaken on behalf of development
NGOs and have focused on a limited number of export products: milk powder,
poultry meat, and tomato paste (purée). The starting point for these studies is
often where local farmers experience a fall in price for their produce. Also, these
studies identify EU exports as one of the reasons for this and often attribute to
CAP subsidies the competitiveness of EU exports on the local markets.
► Milk products
Development NGOs have documented several cases where EU exports of milk
powder have undermined incomes of dairy farmers in developing countries,
including Bangladesh (Curtis, 2011), Cameroon (Brot für die Welt, 2010),
Zambia (Lanje et al., 2009) and West Africa (Choplin, 2016, 2019).

33
The Bangladesh report for ActionAid Denmark paid particular attention to the
role of the EU’s decoupled subsidies. Millions of poor people support their low
incomes through milk production in Bangladesh. The report discusses how milk
imports undermine poor farmers, competing on unfair terms with locally
produced milk and suppressing investment in the dairy industry. In Bangladesh,
whole milk powder is imported and marketed directly to consumers. Skimmed
milk powder is imported and used for production of dairy products. In 2007-
2008, 41,000 tonnes of milk powder were imported, accounting for around 27%
of the country’s milk consumption needs. Between 20% and 50% of imports of
skimmed milk powder have come from the EU in recent years. As the report
was commissioned by a Danish NGO, it focuses on the role of Arla Foods, the
Danish-Swedish dairy company, as a supplier of milk powder exports to that
market. Arla Foods manufactures the leading foreign milk powder brand in
Bangladesh – Dano, which accounted for over 20% of all milk sales in the
country. The report argues that Arla Foods was profiting from EU-subsidised
milk powder sales to Bangladesh which were harming Bangladeshi milk
farmers. Arla Foods had exported between 3,700 and 6,000 tonnes of milk
powder annually to Bangladesh in previous years. The report was written shortly
after the drop in world market prices for milk powder from more than EUR
3,400/t in 2008 to EUR 1,510/t in 2009. Because imported milk powder
competes with locally-produced fresh milk, this led to a drop in the retail price
of fresh milk from 32 cents per litre at the beginning of 2009 to around 25 cents
per litre by mid-year, leading to protests by local dairy farmers in the light of the
fall in their incomes. The argument that these imports are subsidised was based
on a claim that Arla Foods had received nearly one billion euro in subsidies
from the EU since 2000. The report pointed out that direct EU support to Arla
had reduced in recent years, but that the farmers supplying Arla continue to
receive substantial subsidies, including supplementary crisis aid during the milk
price slump in 2009. The report notes that, despite the decoupling of subsidies in
2005, the amount spent on subsidies remains the same. It highlights the fact that
many European farmers are selling below production costs and that some would
not even be able to maintain production without EU subsidies, and thus those
exports are only possible thanks to the continuation of subsidies. It referred to a
2010 report by the Danish Economic Council stating that the CAP “leads to a
higher level of production compared to a free market situation” and that Danish
agricultural production, for example, would fall if the EU subsidies were phased
out (Curtis, 2011).
The German development NGOs Brot für die Welt and Evangelischer
Entwicklungsdienst EED report discusses the impact of EU milk powder exports
to Cameroon during the period 1997-2009 with a particular emphasis on
developments in 2009 (Brot für die Welt, 2010). The organisations had been
supporting the development of milk production in Cameroon for over 10 years

34
to enable smallholders to supply the local market. Local milk markets were
being threatened by cheap milk powder from Europe and the US, and farmers’
livelihoods were being affected. Although milk consumption per capita is very
low, milk imports had grown to constitute 40% to 50% of the supply in
Cameroon. The report provides data on milk production costs in Cameroon and
compares this to the cost of milk (around EUR 0.68 per litre) and milk made
from reconstituted imported milk powder (around EUR 0.40 – 0.51 per litre).
There was a significant fall in the price of imported milk powder between the
summer of 2008 (when the price was equivalent to EUR 1.05 per litre of low-fat
pasteurised milk) and the summer of 2009 (when the price fell to the equivalent
of EUR 0.51 per litre). The report identifies the reintroduction of export
subsidies by the EU at the beginning of 2009 in response to the slump in milk
prices during the previous year as a main reason for this fall. Local farmers
campaigned for an increase in the tariff on imported milk products but were
unsuccessful. Their demand was for the cessation of EU export subsidies but
also that the EU should cut back on milk exports to allow the local dairy
industry to develop. The development agencies considered the subsidising of
milk powder exports to Cameroon to constitute unfair competition. They called
for the end of export subsidies to ensure that agricultural exports are not sold at
dumping prices in developing countries, i.e. below their real production costs,
and expressed support for the grassroots organisations fighting for the right of
countries such as Cameroon to be allowed to protect their local smallholding
production for the purpose of securing their food.
The Germanwatch report on the impact of EU milk powder exports to Zambia
was also written in 2009 following the reintroduction of export subsidies on EU
milk powder exports (Lanje et al., 2009). Direct exports of EU milk powder to
Zambia were a relatively small share of total Zambian milk powder imports,
with much larger volumes coming from Zimbabwe, South Africa and New
Zealand, although some exports from South Africa were believed to be EU
product that was re-exported. Over the period analysed (1997-2007) milk
powder imports to Zambia fluctuated but without any evidence of an upward
trend. The main concern highlighted in the report was the ongoing negotiations
on Economic Partnership Agreements which gave rise to the fear that tariffs
would be eliminated and cheap European agricultural products with which
smallholders cannot compete would be increasingly present on the African
markets. The report noted that both German and Zambian dairy farmers had
similar demands for guaranteed reasonable prices for sufficient quantities to
supply their domestic markets.
A recent report on EU exports to West Africa highlights the increasing volume
of milk powder exports and the growing presence of European milk processors
in the region (Choplin, 2019). The report emphasises the growing role of cheap

35
fat-filled milk powders where the fat is provided by palm oil. Milk reconstituted
from this imported powder is sold much more cheaply compared to locally-
produced milk. The low price of EU exports is attributed to the availability of
direct payments that permit EU dairy farmers to remain producing despite
higher costs of production. It also draws attention to the implementation of trade
policy in West African countries which has failed to give sufficient protection to
local producers. The study highlights the need to reconcile the dispersed supply
of milk from local herders and pastoralists with the growing demand for milk
products in the urban centres in West Africa. It notes that some foreign
processors have entered into local arrangements to also process local supplies,
but that these arrangements cover relatively few processors and very small
volumes of local milk.
► Chicken meat
In a series of reports in the mid-2000s a number of different development NGOs
drew attention to the difficulties caused by EU exports of chicken meat
specifically to West Africa (Dorémus-Mege et al., 2004; Aprodev, 2007;
Paasch, 2008). The development of this trade in frozen chicken was traced back
to the CAP reform in 1992 that began to lower cereal prices, the main input cost
for poultry production. The reduction in feed costs triggered a fall in export
costs to West Africa of 25%. EU exports consist of chicken parts. EU consumers
prefer chicken breasts and to a lesser degree, chicken legs. Other minor parts
(wings, necks, carcass, and rumps) are either processed into pet food, or deep
frozen and exported to West African markets (Dorémus-Mege et al., 2004).
Paasch (2008) emphasises that these chicken parts are not sub-standard meat.
They are simply chicken parts “that are disdained by the European palate”. He
points out that 60% of poultry consumption in Europe consists of chicken
breasts, but they only make up 20% of the chicken. Disposing of these parts
costs the slaughterhouses a lot of money. There had been a market for them in
the manufacture of pet food but European pet owners were turning increasingly
to demand red meat for their pets. Another outlet for these chicken parts was to
process them into meat meal but after the BSE crisis in 1999 this was forbidden.
By selling the frozen poultry parts in West Africa very cheaply, these costs turn
into a lucrative business for European companies (Paasch, 2008).
These chicken cuts are sold on West African markets at knockdown prices,
causing the overall price level to decline sharply. Poultry breeding is an activity
of poor family farms in these countries but faced with this competition the
majority of local producers can no longer sell their products with a profit. “Their
poverty ends up in malnutrition and hunger. Many abandon their farm, or
breeding facilities, and move into towns, where they increase the number of
those suffering from urban misery. Moreover, marketing conditions of frozen

36
chicken cuts do not allow for safe conservation: salmonellae and other bacteria
quickly invade products offered for consumption” (Dorémus-Mege et al., 2004).
The report identifies different kinds of local poultry farms, ranging from the
traditional hen house (usually looked after by women), improved small poultry
farms (often supported by international development agencies and NGOs) and,
in some countries, ‘semi-industrial’ poultry farming sometimes with links to
foreign companies. It acknowledges that these local farms often struggle to meet
growing local demand, due to lack of support from state authorities, lack of
access to credit, poor processing equipment and absence of marketing facilities.
It also points to the role of consumer preferences: “Imported meat, though less
tasty, which can be bought by weight according to the needs and purse, is an
opportunity. Local poultry, traditional chicken or improved varieties, is sold
alive, and is often out of reach, except for outstanding occasions. Slaughtering
and plucking comes on top. Easy cooking is an additional advantage;
snobbishness drives some customers to buy European chicken only. However,
the quality of this meat, which is often circulated in disregard of the
refrigeration chain, poses a serious problem” (Dorémus-Mege et al., 2004).
This is confirmed in the Aprodev (2007) report which notes that “European
chickens are cheap and can be bought by piece: legs, wings, necks and feet.
Local poultry has only ever been available whole and most consumers can only
afford whole birds for holidays and celebrations.” The drawback is that it is
difficult to maintain the sanitary standards needed for frozen product leaving
consumers open to the risk of eating contaminated meat, while on the other hand
the price of live chickens which is the most hygienic way of selling is out of the
reach of most people for regular purchase.
Dorémus-Mege et al. (2004) also discuss some of the trade policy constraints
which mean that the governments of importing countries have not used the
possibility to raise tariffs to protect the domestic industry. However, it notes that
several countries began to prohibit imports of European frozen chicken in the
early 2000’s. Particularly Economic Partnership Agreement negotiations with
the EU were seen as a threat because they could limit the ability of importing
countries to use tariffs as a development instrument (Paasch, 2008). The
Dorémus-Mege et al. (2004) report concludes that “Poultry meat is not
subsidized in Europe. Strictly speaking, there is no unfair competition. For the
EU, it rather is an escape market.” However, Paasch (2008) notes that, although
chicken exports to Africa do not receive export subsidies, exports to other
markets such as Russian and the Middle East were subsidised at that time. It
documents the ongoing concentration in the EU poultry sector and notes that the
biggest companies (for example, Doux in France) have expanded in emerging
developing countries such as Brazil and Thailand to take advantage of lower
production costs.

37
These reports frame the rapidly increasing exports of European frozen chicken
parts to countries which are known to lack the infrastructure needed for
competing as an ethical problem. They call for the right of importing countries
to protect national borders in order to lay the foundations for national
development. The Aprodev (2007) report documents the successful campaign by
a civil society group in Cameroon to mobilise public opinion against frozen
chicken imports because of their health risks which led to the prohibition of
frozen chicken imports in 2005.
The role of EU chicken exports in Africa is most recently documented in
Goodison (2015). This report highlights that consumption of poultry meat in
Sub-Saharan Africa (SSA) is increasingly met by imports even though local
production also increases albeit at a slower rate. He reports that by 2014 imports
of chicken meat accounted for 44% of SSA chicken meat consumption
compared to under 30% in 2004. The report shows the importance of the
domestic trade policies adopted in individual countries in influencing the
prospects for local production. He points out that low-cost imports make an
immediate contribution to meeting rising consumer demand for low-cost protein
especially in urban areas. “The challenge would appear to be structuring
current trade in ways which are complementary to and supportive of local
efforts to promote more competitive integrated and sustainable chicken
production, capable of meeting growing demand for low priced protein.”
(bolding in original).
Goodison notes that there is no direct support for poultry production in the EU,
though producers have benefited in terms of lower feed costs from reforms in
the EU’s arable crops regime. However, the EU domestic market is itself heavily
protected through high Most Favoured Nation (MFN) tariffs, limited quantities
imported under Tariff Rate Quotas, and the permanent use of the special
safeguard clause. This import protection has allowed the strong growth in EU
consumption to be met largely from domestic production. But because of the
imbalanced EU demand for the different types of chicken meat, larger EU
production has also led to higher exports of the less favoured chicken parts and
offals. Thus, the EU is now a net exporter of poultry meat largely because of its
managed import regime and despite very high levels of import protection.
► Tomato paste
The case of EU exports of tomato paste to Ghana is described in Paasch (2008).
Tomatoes are a key ingredient in West African meals, but in the mid-2000s local
tomato production was increasingly challenged by imports of tomato paste,
mainly from Europe but also from China. The report documents the rapid
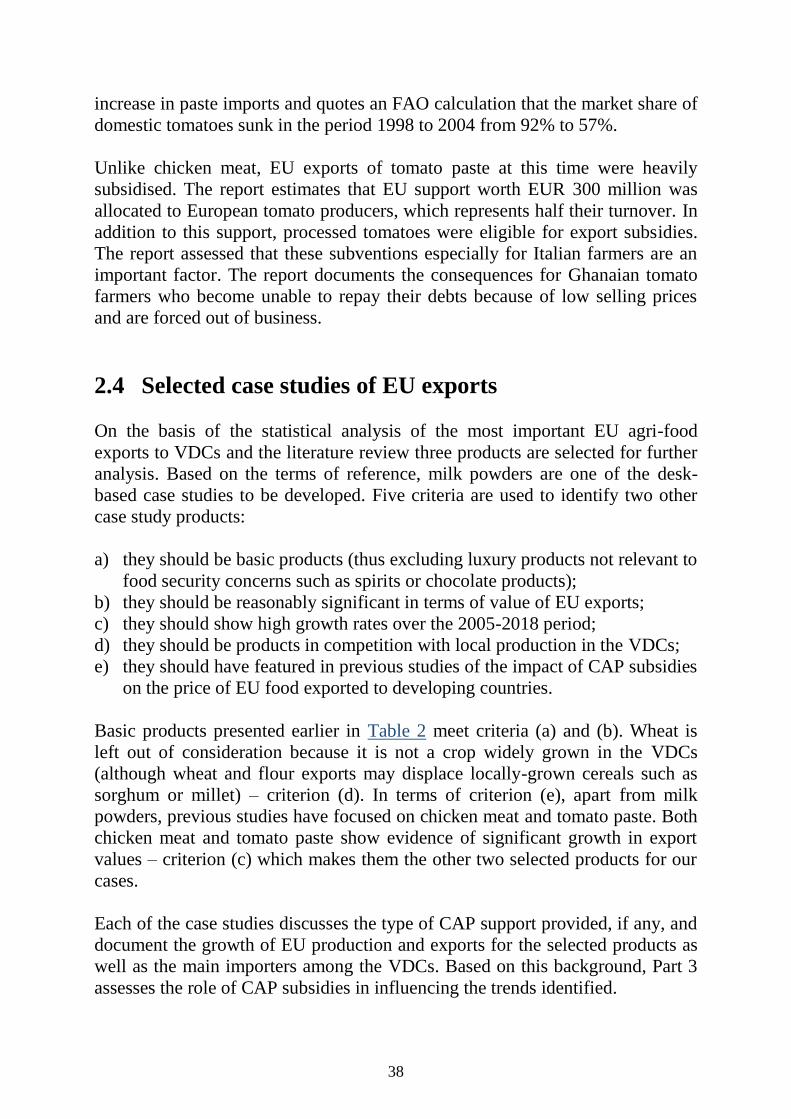
38
increase in paste imports and quotes an FAO calculation that the market share of
domestic tomatoes sunk in the period 1998 to 2004 from 92% to 57%.
Unlike chicken meat, EU exports of tomato paste at this time were heavily
subsidised. The report estimates that EU support worth EUR 300 million was
allocated to European tomato producers, which represents half their turnover. In
addition to this support, processed tomatoes were eligible for export subsidies.
The report assessed that these subventions especially for Italian farmers are an
important factor. The report documents the consequences for Ghanaian tomato
farmers who become unable to repay their debts because of low selling prices
and are forced out of business.
2.4 Selected case studies of EU exports
On the basis of the statistical analysis of the most important EU agri-food
exports to VDCs and the literature review three products are selected for further
analysis. Based on the terms of reference, milk powders are one of the desk-
based case studies to be developed. Five criteria are used to identify two other
case study products:
a) they should be basic products (thus excluding luxury products not relevant to
food security concerns such as spirits or chocolate products);
b) they should be reasonably significant in terms of value of EU exports;
c) they should show high growth rates over the 2005-2018 period;
d) they should be products in competition with local production in the VDCs;
e) they should have featured in previous studies of the impact of CAP subsidies
on the price of EU food exported to developing countries.
Basic products presented earlier in Table 2 meet criteria (a) and (b). Wheat is
left out of consideration because it is not a crop widely grown in the VDCs
(although wheat and flour exports may displace locally-grown cereals such as
sorghum or millet) – criterion (d). In terms of criterion (e), apart from milk
powders, previous studies have focused on chicken meat and tomato paste. Both
chicken meat and tomato paste show evidence of significant growth in export
values – criterion (c) which makes them the other two selected products for our
cases.
Each of the case studies discusses the type of CAP support provided, if any, and
document the growth of EU production and exports for the selected products as
well as the main importers among the VDCs. Based on this background, Part 3
assesses the role of CAP subsidies in influencing the trends identified.

39
2.4.1 Milk powders case study
CAP support for milk powders
Milk prices in the EU are determined by a variety of factors: supply and demand
on the internal EU market; world dairy product prices; currency exchange rate
fluctuations; the competition situation in the dairy supply chain; and support to
the dairy market, and to farmers, from the CAP. Apart from safety-net
intervention measures for butter and SMP, milk prices within the EU are left
free to respond to market conditions. Farmers are generally paid a formula price
that reflects the portfolio of products produced by the dairy company to which
they sell, though dairy processors also compete for the available supply of milk.
The CAP dairy support programme in the past has consisted of a production
quota for milk, import protection, an intervention program that supports the
price of skim milk powder and butter, and export refunds which were used to
market surplus dairy products. The dairy quota which had been in place since
1984 was eliminated in April 2015. Also export subsidies on dairy products as
for other products have been eliminated in line with the EU’s revised schedule
of commitments for goods submitted to the WTO in October 2017.11 Minimum
intervention prices for butter and SMP have been reduced as well as the
quantities that must be purchased at these minimum prices. If greater supply of
these products is offered to the intervention system then purchases take place on
a tender basis. This has lowered the internal market price for all dairy products
and allows exports to take place at world market price levels. Dairy farmers
were compensated for the reduction in intervention prices by granting direct
payments in the form of a dairy premium. This premium was gradually
integrated into the Single Farm Payment between 2005 and 2007. In 2009, a
year of low prices, direct payments accounted for more than half of the income
on specialised dairy farms (56%). Their share fell below 40% only in the
recovery years 2013 and 2014 and rose again in the crisis years of 2015 (46%)
and 2016 (49%) (DG AGRI, 2018b). Towards the end of that recent period of
low prices the Commission made use of a further crisis management tool by
introducing a voluntary supply management scheme that paid farmers who
reduced their level of production below that of a previous period.
MSs may also decide to use part of their direct payments national envelopes to
provide coupled payments to dairy farmers (Voluntary Coupled Support –
VCS). DG AGRI reported that in 2017 19 MSs granted coupled support to dairy
11 ‘EU leads the way by eliminating export subsidies ahead of WTO conference in Buenos Aires’, European
Commission News Archive 6 October 2017.

40
farmers amounting to 2% of the direct payments budget. Around half of the total
number of dairy cows in the EU receives a coupled support payment that on
average amounts to EUR 73 per head (DG AGRI, 2017). In 2007-2009 coupled
support was on average 2 EUR/tonne of milk, rose to 4 EUR/tonne until 2014
and from 2015 remained unchanged at 7 EUR/tonne (DG AGRI, 2018b). These
coupled payments can be compared to milk prices of around EUR 350/tonne at
the beginning of 2019.
Finally, import tariffs remain very high. The EU’s tariffs on skimmed milk
powder (SMP) are EUR 1,188/tonne or EUR 1,254/tonne (depending on
package size) and on whole milk powder (WMP) between EUR 1,304/tonne and
EUR 1,672/tonne depending on fat content and package weight. These specific
tariffs translate into different ad valorem rates depending on the unit import
price which varies over time. Assuming a unit import price of EUR 3,000/tonne
for WMP would yield an ad valorem tariff between 44% and 57%, while
assuming a unit import price of EUR 2,200/tonne for SMP would yield an ad
valorem tariff of between 51% and 57%. The EU has a tariff of 12.8% on full-
fat milk powders (FFMPs).
The last years of the quota system contained a good deal of slack, in that many
countries failed to produce their quota quantities. High milk prices in 2013 and
2014 reflecting strong global demand coincided with the end of quotas at the
beginning of 2015. This led to a significant surge in EU production (Figure 7).
Figure 7. EU milk production and price, 2005-2018
Source: based on DG AGRI, 2018a.

41
The cyclical nature of milk prices is apparent, with troughs in 2009 and again in
2015-2016. Despite the fall in prices in 2015-2016 production continued to
increase following the end of quotas as within the EU it was able to shift to
lower-cost producers in north-west Europe. Further expansion is foreseen in the
coming period but at a more modest pace (8% increase between 2018 and 2028
compared to 16% between 2008 and 2018) (DG AGRI, 2018a). Environmental
issues will limit milk production increases in a number of EU countries.
EU production, export and price of milk powders
There are three milk powders, skimmed milk powder (SMP < 1.5% fat), whole
milk powder (WMP >1.5% fat) and full-fat milk powders (FFMPs). The latter
are milk powders in which the dairy fat has been removed and replaced by a
cheaper vegetable fat, usually palm oil. They can be produced either directly in
dairies or by mixing SMP with vegetable fat. In the latter case, production is
recorded as part of domestic SMP production (DG AGRI, 2018c). FFMP
statistics on production and trade are more limited than for the other milk
powders.
EU production of WMP has fluctuated around 725,000 tonnes per annum over
the past decade without any obvious growth trend. On the contrary, WMP
exports show a clear declining trend. Exports as a share of EU WMP production
have fallen from 63% in 2005 to 49% in 2018 and are expected to fall further to
46% of EU production in 2030 (DG AGRI, 2018c). The level of production
varies with the relative values of butterfat and protein, and competition from
FFMPs has dampened export growth. In 2017, the EU’s share of the world
WMP market was 14% (compared to a 55% share for New Zealand) and this is
expected to decline further to 12% by 2030, according to latest market
projections (DG AGRI, 2018c).
There is a very close correlation between EU WMP prices and world market
WMP prices (Figure 8). Generally, EU prices have been a little above the world
market price quotation, but this may reflect differences in the underlying
quotation (for example, where prices are measured at different locations or for
different product specifications) rather than a real price differential.
EU SMP production has shown a steady increase over the period, with a
particularly sharp increase in 2014 and 2015 following the period of record-high
EU milk prices and the elimination of milk quotas. Production has stabilised
since then (Figure 9). EU SMP exports have increased steadily throughout the
period and production has become more dependent on exports. The export share
was 19% in 2005, increased to 52% in 2018 and is expected to be 50% in 2030.
The EU is a major player on the global SMP market accounting for around 30%

42
of global exports, just ahead of both Oceania and North America (OECD/FAO,
2018).
Figure 8. EU WMP prices compared to world WMP prices, EUR/tonne, 2005-2018
Source: based on DG AGRI, 2018c.
Figure 9. EU SMP production, exports, stocks and prices, 2005-2018
Source: based on DG AGRI, 2018c.

43
The volume of exports in particular years is influenced by the level of stocks.
Unlike WMP, the price of SMP is supported both by public intervention
purchases at a minimum price and aids for private storage when EU SMP prices
fall below safety-net levels. Stock levels rose in 2009 and again in 2015-2017 in
response to falling SMP prices on global markets in those years. At its peak, the
EU public intervention stock amounted to 378,000 tonnes at year-end 2017,
about 6.5% of world SMP production and about 20% of world SMP trade
(OECD/FAO, 2018).
By withholding stocks in periods of low world market prices the EU puts a floor
under these prices, although the existence of high stock levels will delay the rise
in prices in the subsequent recovery period. This is supported by the very close
correlation between EU and world market SMP prices including in years of very
low prices (Figure 10). During the most recent downturn in prices, EU SMP
prices have remained below world market prices despite the stock purchase
programme, but such price comparisons need to be interpreted bearing in mind
that the price quotations are not necessarily for the same product specification
(for example, they may reflect prices at different locations or for different
specifications).
Figure 10. EU SMP prices compared to world SMP prices, 2005-2018
Source: based on DG AGRI, 2018c.
World market trends for WMP and SMP are shown in Figure 11 and Figure 12,
respectively, according to OECD/FAO data. EU exports are compared to global

44
exports and to world market prices. These data cover a longer time period than
DG AGRI data and include projections for the next decade in order to give a
better idea of long-term trends.
Figure 11. World market WMP trends
Source: based on OECD/FAO, 2018.
Figure 12. World market SMP trends
Source: based on OECD/FAO, 2018.

45
Global exports of both WMP and SMP have substantially increased and are
expected to continue to increase, albeit at a slower rate, in the coming decade.
The EU has not been the main driver of export increases over the period. This is
especially obvious with respect to WMP where EU exports have stagnated but
also in the case of SMP the EU has lost market share to other global exporters. It
is also worth remarking on the trend in prices (in nominal terms). Prices show a
gently rising trend for both powders over time but with enormous volatility
during recent years, especially with peaks in 2007-8 (sometimes characterised as
the years of the ‘food crisis’) but also in 2011-12 and in 2014, in each case
followed by a sharp decline.
EU exports of milk powders to vulnerable developing countries
EU milk powders are exported under various tariff codes in the Harmonised
System (HS), as summarised in Table 3. Note that HS code 190190 covers
FFMPs and other preparations used in the baking industry.
Table 3. Harmonised System codes for milk powders
HS code Description of product
040210 Skim milk powder
040221 Whole milk powder, not containing sugar
040229 Whole milk powder, sweetened
190190 Milk powder preparations without milk fat (including full fat milk powders)
Table 4 provides an overview of EU milk powder exports focusing on the
relative importance of VDCs in total export markets. In line with the previous
data, total WMP exports have fallen with all of the fall occurring in exports to
VDCs. As a result the share of these markets in total EU WMP exports fell from
42% to 33% between ‘2006’ and ‘2017’. It is likely these markets are those
where the competition from FFMPs has been felt most keenly. Most EU WMP
exports to non-vulnerable countries go to Middle Eastern countries as well as
China, Singapore and Hong Kong.
Table 4. Importance of VDCs as export market for EU milk powders, tonnes, 2005-2018
Average
2005-2007
Average
2016-2018
Growth
2005-2018 (%)
WMP exports (HS codes 040221+040229)
Total EU exports 429,870 369,652 -14
Exports to non-vulnerable countries 248,500 246,129 -1
Exports to VDCs 181,369 123,524 -32
Share of VDCs (in %) 42% 33%
SMP exports (HS code 040210)
Total EU exports 156,751 726,901 363

46
Average
2005-2007
Average
2016-2018
Growth
2005-2018 (%)
Exports to non-vulnerable countries 131,316 608,322 363
Exports to VDCs 25,435 118,579 366
Share of VDCs 19% 19%
FFMP exports (HS code 190190)
Total EU exports 367,903 967,793 163
Exports to non-vulnerable countries 223,925 537,668 140
Exports to VDCs 143,979 430,126 199
Share of VDCs 39% 44%
Source: own calculations based on Eurostat COMEXT data.
EU exports of SMP have, as shown above, increased dramatically from around
188,000 tonnes in 2005 to 727,000 tonnes in 2018. VDCs are a much less
important market for this product, accounting for only 19% of the total in
‘2017’, but in absolute terms the increase in exports to these markets has been
substantial, from 31,000 tonnes in 2005 to 140,000 tonnes in 2018.
There has also been a dramatic growth in EU exports of FFMPs, from around
350,000 tonnes in 2005 to just over 1 million tonnes in 2018. However, as noted
previously, the corresponding HS code 190190 covers more than FFMPs, and
industry sources suggest that FFMP exports make up around half of this total. In
the absence of a specific tariff code for FFMPs, our assumption is that all
exports under this tariff code represent FFMPs but the reader should be
cautioned that this is an over-estimate. The rapid growth in FFMP exports has
mainly occurred since 2009. This development of FFMPs is likely to be a
response to the dramatic relative increase in the price of butter after 2008. Prior
to 2008 average indicative export prices for European and Oceania butter had
usually been below USD 2,000/tonne. In July 2007 the butter price reached USD
4,000/tonne. Since then the price has only fallen below this level during crisis
periods and it reached as high as USD 6,300/tonne in late 2017.12 The fact that
butterfat became more valuable stimulated dairy companies to find alternatives
for butterfat in milk powder and led to the major expansion in EU FFMPs.
The majority of the EU’s exports go to non-vulnerable countries, such as the oil-
importing countries of the Middle East, rapidly growing economies in Asia as
well as Russia and Belarus. However, an important share, around 44%, of these
exports is destined for VDCs. This share has not changed much over the past
decade. The most important importers of EU WMP among the VDCs are
indicated in Table 5. The table shows all importers importing more than 4,000
12 Butter price data are from the FAO global food price database.

47
tonnes WMP in the three-year period ‘2017’ (because volumes to individual
countries can fluctuate greatly from year to year, three-year averages are used to
smooth out these fluctuations). Six of these countries are importing less WMP
than they did in ‘2006’ and just two are importing more. West African countries
are predominant in the list, but Cuba, Dominican Republic and Bangladesh are
also important markets.
Table 5. Top importers of EU WMP among VDCs, tonnes, 2005-2018
Region Country Average
2005-2007
Average
2016-2018
Growth
2005-2018 (%)
Africa
Nigeria 40,780 19,137 -53
Senegal 14,031 5,760 -59
Angola 10,407 9,603 -8
Ivory Coast 6,496 6,475 0
Mali 5,378 4,240 -21
Cameroon 3,827 5,622 47
Developing Asia Bangladesh 8,445 4,859 -42
Latin America &
Caribbean
Dominican Republic 22,122 11,603 -48
Cuba 6,957 12,685 82
TOTAL Top 9 VDC importers 118,444 79,985 -32
TOTAL VDC imports 181,369 123,524 -32
Source: Eurostat COMEXT database.
The most important VDC importers (those importing more than 2,000 tonnes)
for EU SMP exports are shown in Table 6. EU SMP exports to VDCs are very
concentrated, with just nine countries accounting for over 80% of VDC imports
from the EU. West African countries are less prominent on this list than for the
other milk powders, with only three of the nine top importers from that region.
Apart from Nigeria which recorded relatively slower growth over the period, the
rate of growth in imports by many importers has been very high. All countries
are importing more SMP than they did in ‘2006’. However, for most importers,
imports in absolute terms are not very large.
Table 6. Top importers of EU SMP among VDCs, tonnes, 2005-2018
Region Country Average
2005-2007
Average
2016-2018
Growth
2005-2018 (%)
Africa
Nigeria 13,619 25,394 86
Ghana 2,024 8,561 323
South Africa 1,202 6,689 456
Ivory Coast 621 2,764 345
Kenya 29 2,300 7831
Developing Asia Yemen 1,210 14,883 1130
Bangladesh 485 20,705 4172
Latin America &
Caribbean
Cuba 2,576 10,034 290
Dominican Republic 729 7,016 862

48
Region Country Average
2005-2007
Average
2016-2018
Growth
2005-2018 (%)
TOTAL Top 9 VDC importers 22,496 98,346 337
TOTAL VDCs 25,435 118,579 366
Source: Eurostat COMEXT database.
Imports of FFMPs by VDCs now exceed their imports of WMP and SMP
combined. The top importers of EU FFMPs (those importing more than 10,000
tonnes) among them are shown in Table 7. This list is dominated by West
African countries such as Nigeria, Senegal, Mauritania, Mali, Ivory Coast,
Ghana and Guinea. South Africa and Ethiopia also make an appearance, as well
some countries outside of Africa such as Yemen and Haiti. Also in this case, all
countries are importing more FFMPs than they did in ‘2006’.
Table 7. Top importers of EU FFMPs among VDCs, tonnes, 2005-2018
Region Country Average
2005-2007
Average
2016-2018
Growth
2005-2018 (%)
Africa
Nigeria 34,594 79,116 129
Senegal 21,212 66,385 213
Mali 6,858 26,942 293
DR Congo 6,038 11,289 87
Mauritania 4,058 33,693 730
Ghana 3,874 12,381 220
Ivory Coast 3,302 16,431 398
South Africa 2,446 11,107 354
Guinea 1,136 10,890 859
Ethiopia 48 23,260 48359
Developing Asia Bangladesh 3,148 13,468 328
Yemen 1,770 12,686 617
Latin America & Caribbean Haiti 2,414 11,621 381
TOTAL Top 13 VDC importers 90,899 329,271 262
TOTAL VDC imports 143,979 430,126 199
Source: Eurostat COMEXT database.
Given the frequency with which West African countries appear in the lists of top
importers of milk powders, Table 8 summarises their total imports of milk
powders from the EU. For this purpose, West Africa is defined as making up the
countries of the Economic Community of West African States (ECOWAS) plus
Mauritania. While the volumes imported in part reflect differences in market
size, there is also a clear distinction between the predominantly agricultural
Sahelian countries (Burkina Faso, Mali, Niger, Chad, Mauritania) that do not
import much milk powder, and the coastal countries with the biggest milk
deficits, including Nigeria, Ghana, Senegal and Ivory Coast, which import 75%
of the total milk consumed (Oxfam International, 2018).

49
Table 8. EU milk powder exports to West African countries, tonnes, 2005-2018
WMP SMP FFMPs
Country Average 2005-
2007
2016-
2018
2005-
2007
2016-
2018
2005-
2007
2016-
2018
Benin 840 588 51 393 1,847 2,382
Burkina Faso 1,363 2,063 8 231 1,554 6,545
Cape Verde 3,250 2,563 1 169 1,230 1,753
Gambia 1,384 247 1 16 1,011 3,928
Ghana 1,831 1,618 2,024 8,561 3,874 12,381
Guinea 678 3,422 79 1,136 10,890
Guinea-Bissau 200 181 1,690 1,318
Ivory Coast 6,496 6,475 621 2,764 3,302 16,431
Liberia 407 226 1 2 1,249 1,824
Mali 5,378 4,240 101 231 6,858 26,942
Mauritania 4,273 3,804 139 1,009 4,058 33,693
Niger 1,861 891 120 1,266 8,274 7,131
Nigeria 40,780 19,137 13,619 25,394 34,594 79,116
Senegal 14,031 5,760 105 1,549 21,212 66,385
Sierra Leone 331 339 22 30 1,450 1,095
Togo 1,122 363 105 376 5,228 9,427
TOTAL West African Importers 84,226 51,917 16,919 42,071 98,567 281,241
TOTAL VDCs 181,369 123,524 25,435 118,579 12,686 430,126
TOTAL EU Exports 429,870 369,652 156,899 726,901 16,431 967,793
Source: own calculations based on Eurostat COMEXT database.
Table 9 places EU milk powder exports in the context of raw milk production in
West African countries. To make this comparison, milk powder exports are
expressed in milk equivalents assuming that 100 kg raw milk is used to produce
13 kg of WMP and FFMP and 9 kg of SMP. The milk equivalent of powder
imports from the EU is then expressed a ratio of domestic milk production. A
ratio of 100% implies that domestic production and imports supply equal shares
of the domestic market (this calculation takes no account of imports from
sources other than the EU and also assumes there are no exports of milk
products). A ratio less than 100% means that domestic production supplies a
greater share of the domestic market, while a ratio greater than 100% implies
that EU imports supply a greater share of the domestic market.
As noted earlier, there are important differences across West African countries
in their reliance on EU milk powder imports relative to domestic production.
Countries like Cape Verde, Ivory Coast, Senegal, Nigeria and Liberia are
heavily dependent on EU imports, whereas these imports play a much less
important role in Sierra Leone, Guinea-Bissau, Burkina Faso, Mauritania and
Mali. It is beyond the scope of this study to analyse the reasons for these
differences. For West Africa as a whole, dependence on EU milk imports has
increased over the period.

50
Table 9. EU exports in milk equivalent expressed as a share of domestic production in
West African countries, %
2005-2007 share, % 2015-2017 share, %
Benin 24 20
Burkina Faso 19 30
Cape Verde 730 798
Gambia 27 35
Ghana 177 497
Guinea 15 60
Guinea-Bissau 12 8
Ivory Coast 282 582
Liberia 162 163
Mali 21 57
Mauritania 14 49
Niger 21 10
Nigeria 160 201
Senegal 256 391
Sierra Leone 15 8
Togo 65 96
West Africa 61 86
Source: own calculations based on FAOSTAT data for cows’ milk production and Eurostat
COMEXT data for EU milk powder exports.
2.4.2 Chicken meat case study
CAP support for chicken production
The EU chicken industry does not benefit from CAP subsidies or guaranteed
intervention support. It is not an eligible product for coupled payments under the
CAP VCS scheme. Chicken farms may be located on farms with agricultural
land and may therefore be eligible for decoupled direct payments as a result. DG
AGRI figures show that operating subsidies made up 20% of the income of pig
and poultry farms in the EU over the period 2007-2015 (DG AGRI, 2018d).
Export subsidies were available under the CAP for exports of poultry meat but
are no longer used (export refunds for whole birds on exports to Africa were
eliminated in 1998, although were occasionally authorised for short seasonal
periods for chicken cuts).
The main cost of producing chicken is the cost of feed, which accounts for
around 60%-75% of total costs depending on the Member State. In the EU, the
main feed ingredients used are wheat and soya, with maize also used in the
southern MSs. It is sometimes argued that chicken producers are indirectly
supported through cereal subsidies on feed costs. There is a small amount of
coupled aid paid to cereal growers under the VCS scheme. For the 2017-2020

51
period, this amounts to EUR 396 million or approximately EUR 100 million per
annum (DG AGRI, 2017). In addition, cereal growers receive per hectare
decoupled payments although these are not conditional on the production of
cereals. Even if it is argued that these coupled and decoupled payments help to
reduce the variable costs of producing cereals, these are widely traded
commodities. There is no reason why cereal growers should sell more cheaply to
feed compounders (with the possibility that some of this subsidy might be
passed through to broiler producers) when they can also sell to traders who offer
the world market price. In these circumstances, we conclude that there would be
no pass-through of the CAP payments to cereal growers to the price of feed and
to the benefit of broiler producers.
In fact, the opposite situation where CAP protection on cereals penalises the EU
chicken industry is more likely to be the case. Applied tariff rates on cereal
imports differ between high quality wheat and other cereals, and low and
medium quality wheat. In the former case, the tariff system, which originated in
the Blair House agreement between the US and the EU as part of the Uruguay
Round trade negotiations, sets tariffs on the basis of world reference prices for
the different cereals. The duty is fixed on the basis of the difference between the
effective EU intervention price for cereals (EUR 101.31/tonne) multiplied by
1.55 (EUR 157.03/tonne) and a representative carriage, insurance and freight
(c.i.f.) import price for cereals at Rotterdam. The applied tariff has been zero
now for some years.
However, for the low and medium quality wheat which is used in the
manufacture of chicken feed, the bound rate of EUR 95/tonne applies apart from
imports under Tariff Rate Quotas (TRQs) where the tariff is limited to EUR
12/tonne. There is also a duty-free TRQ with Ukraine. The OECD estimated the
value of this market price support to EU producers of common wheat at EUR
2.3 billion in 2017 and EUR 1.5 billion in 2018.13 This market price support to
producers represents an additional cost to the purchasers of feed wheat including
the poultry sector.
Also relevant is that EU chicken production is subject to higher environmental,
animal welfare, hygiene, salmonella control and other food safety standards than
production in competitor countries which raises the costs of broiler production
in the EU. The additional costs directly related to EU regulations are estimated
to be 5 eurocents per kg live weight, equivalent to almost 6% of the total
production costs in 2015 (van Horne, 2017). In some MSs, national regulations
are even stricter. Partly due to these factors, the price of broilers in the EU tends
13 OECD Producer Support Estimate database for the EU28.

52
to be higher than in the two main exporting countries, Brazil and the US. Van
Horne estimated, based on 2015 data, that production costs after slaughter are
70% of the EU average in Brazil, 74% lower in the Ukraine, 81% lower in the
US, 81% lower in Argentina and 83% lower in Thailand.
EU imports of chicken meat are subject to high import duties, with various tariff
rate quotas allowing preferential access at lower rates of duty for limited
quantities. EU imports are mainly of high-value chicken cuts, including frozen
natural breast fillet, salted breast fillet and cooked breast fillet. The import duties
levied on these products range from EUR 1,024/tonne to EUR 1,300/tonne
depending on the product. In 2018 applied Most Favoured Nation (MFN) tariffs
were between 31.4% and 48.3% in ad valorem terms. The OECD estimated the
value of this support to poultry producers (not only chicken) at EUR 4.5 billion
in 2017 and EUR 4.3 billion in 2018. These tariffs are critical to reserving the
EU chicken market for domestic producers apart from quantities imported under
the preferential TRQ tariffs and free trade agreements. Van Horne (2017)
compared the production costs of breast fillet in the EU and exporting countries
by adding up the costs of cutting up the breast cap and deboning it and taking
account of the revenue from or cost of offal disposal and the sale of the rest of
the carcase. This gave the net production costs of a kg of breast meat at the
processing plant in the production country, to which he added transport costs
and import levies to compare the offer price of the selected non-EU countries to
the EU average. The author found that, even with import levies, product from
Brazil and Ukraine was competitive with EU production. Van Horne concludes
that “…the import levies protect the EU countries from large imports of breast
meat from third countries”. The recent strong negative political reactions from
EU policymakers to rising chicken imports from Ukraine support this
conclusion.14
EU production, export and price of poultry meat
Production and consumption of poultry meat (a term that includes meat from
chicken, ducks, geese, turkey and guinea fowl) have been steadily increasing in
the EU, with production growth averaging 2.5% per annum over the past decade
(DG AGRI, 2018c). Exports have almost doubled in volume terms, and the
share of exports in EU production has increased from 8% in 2005 to 11% in
2018 (Figure 13).
14 Livingstone, E., ‘Feathers fly in Europe’s battle with Ukrainian chicken boss’, Politico Europe, 3 May 2019.

53
Figure 13. EU poultry meat prices and exports, 2005-2018
Source: based on DG AGRI, 2018a. Export volumes are in carcase weight equivalent.
Both production and exports in 2016-2017 were adversely affected by avian flu
in several EU countries but recovered in 2018. EU producer prices are closely
correlated with movements in world market prices. The fact that EU market
prices are generally above world market prices may reflect the high protection of
the EU poultry market, but it may also reflect differences in the specification of
the product that is being measured.
EU poultry trade (meat and offal) is characterised by high-value imports and
low-value exports. The EU is a net exporter of poultry when measured by
volume, but a small net importer in value terms. A specific feature of the trade
in poultry meat is that the EU is exporting lower-quality and cheaper cuts less
appreciated by European consumers (such as legs and wings, sometimes referred
to as ‘brown’ meat, as well as meat from spent laying hens) and importing cuts
with higher added value (such as breasts, known as ‘white’ meat), and cooked
preparations.
This case focuses on chicken meat which accounts for around 80% of EU
production of poultry meat. Chicken is traded under eight separate tariff
headings, two representing live chicks and chickens, four representing chicken
meat in unprocessed form, and two representing chicken meat in prepared or
processed form (Table 10).

54
Table 10. Harmonised System codes for chicken
HS code Description of product
010511 Live chicks weighing <= 185 gm
01059400 Live chickens weighing > 185 gm
020711 Chickens, not cut in pieces, fresh or chilled
020712 Chickens, not cut in pieces, frozen
020713 Chicken cuts and offal, fresh or chilled
020714 Chicken cuts and offal, frozen
02109939 Poultry meat, salted or in brine
160232 Other prepared chicken meat and offal
Source: European Customs Portal https://www.tariffnumber.com/.
The trend in EU exports of chicken meat in the four tariff headings covering
unprocessed chicken meat which is considered most relevant to the VDC
markets is shown in value and volume terms in Table 11. Trade statistics
confirm that EU chicken meat exports have almost doubled in both value and
volume terms over the decade 2009-2018. Exports are largely a trade in frozen
chicken meat, either as whole chickens or as chicken cuts and offal. Indeed,
nearly all of the increase in both the value and volume in exports is due to the
exports of frozen chicken cuts and offal. The value and volume of exports of
frozen whole chickens dropped slightly.
Table 11. Value and volume of EU chicken meat exports, 2009-2018
Value of EU exports
(EUR million)
Volume of EU exports
('000 tonnes)
HS code
Average
2009-
2011
Average
2016-
2018
Growth
2009-2018
(%)
Average
2009-
2011
Average
2016-
2018
Growth
2009-2018
(%)
020711 - Chickens, not
cut in pieces, fresh or
chilled
11.4 17.2 51 6.0 8.6 43
020712 - Chickens, not
cut in pieces, frozen 353.5 288.4 -18 305.4 251.9 -18
020713 - Chicken cuts
and offal, fresh or
chilled
63.8 92.8 46 34.7 42.2 21
020714 - Chicken cuts
and offal, frozen 468.6 812.6 73 585.6 1052.0 80
Source: Eurostat COMEXT database via EU Market Access Database. Volumes are given in
product weight equivalent.
Exports of chicken cuts and offal are less valuable on a per tonne basis than
exports of whole chicken, indicating that they represent the less valuable and
less preferred cuts. Also, frozen meat is generally less valuable than fresh or
chilled exports. The role of the EU in global chicken meat exports is shown in
Table 12. Global chicken meat exports are growing rapidly, increasing by 30%

55
between ‘2008’ and ‘2015’. The EU accounts for a relatively modest 11% of the
global market, behind Brazil and the US that are the market leaders, although its
market share has expanded slightly over the decade.
Table 12. Global chicken meat (broiler) exports ('000 tonnes), 2007-2016
Average
2007-2009
Average
2014-2016
Growth
2007-2016 (%)
World 8,063 10,493 30
Brazil 3,129 3,763 20
US 2,976 2,071 -30
EU 705 1,196 70
Thailand 353 619 76
China 311 406 30
Turkey 51 332 546
Ukraine 8 187 2242
Argentina 156 208 33
Belarus 12 131 992
Canada 146 135 -8
Chile 63 97 54
Russia 5 75 1507
Others 148 281 90
Source: USDA, Production Supply & Distribution database.
EU exports of chicken meat to vulnerable developing countries
If we focus on the exports of frozen chicken cuts and offal where all of the
growth in EU exports has taken place, there has been a significant change in the
destination of these exports over the decade. At the beginning of the period,
most (72% by value in 2009) of these exports went to non-vulnerable countries
particularly in Asia (Hong Kong, Malaysia, China, Vietnam) and in Eastern
Europe (Ukraine, Belarus, Macedonia, Kosovo, Albania). By the end of the
period, African countries plus a few Caribbean countries (Haiti, St Lucia and
Barbados) had become more important destinations and just 54% by value of
EU exports in 2018 went to non-vulnerable countries. The nature of demand
also varies between markets, with frozen wings being mainly directed to Hong
Kong while halves and quarters are mainly shipped to Africa (DG AGRI,
2018c). The principal importers among VDCs of EU frozen chicken meat cuts
and offal valued at more than EUR 10 million in any recent year are shown in
Table 13. Top of the list are Ghana and South Africa, although EU exports to
South Africa have dropped significantly in the most recent two years because of
the imposition of restrictions on imports from EU countries due to anti-dumping
duties and avian flu outbreaks (Goodison, 2018). Benin is in third place although
it is believed that most of these imports are destined to be smuggled over the
border to Nigeria which has banned the import of chicken meat. Exports to

56
Angola, DR Congo and Haiti have risen sharply in the past two years in value
and also in volume terms.
Table 13. Principal importers of EU frozen chicken cuts and offal among VDCs
Value of EU exports
(EUR million)
Volume of EU exports
('000 tonnes)
Region Country
Average
2009-
2011
Average
2016-
2018
Growth
2009-2018
(%)
Average
2009-
2011
Average
2016-
2018
Growth
2009-2018
(%)
Africa
Ghana 24.1 87.5 263 36.2 126.8 250
South Africa 26.2 119.4 355 29.3 132.2 351
Benin 54.4 39.2 -28 49.4 47.3 -4
Gabon 12.2 26.5 118 13.7 32.5 137
Angola 0.7 8.9 1230 0.7 8.2 1071
DR Congo 5.0 11.1 124 6.0 18.5 211
Togo 5.9 9.3 58 6.1 12.4 104
Comoros 5.8 9.4 63 5.5 10.5 92
Latin
America &
Caribbean
Haiti - 8.1 - - 12.0 -
Source: Eurostat COMEXT database.
The importance of imports in domestic consumption, and the importance of
imports from the EU in total imports, in the above identified developing
countries are shown in Table 14. For these main import markets as a whole, the
share of the EU in total imports has steadily risen from 18% in 2005 to 46% in
2018, indicating their growing importance to EU exporters. Nonetheless, there
are clear differences across countries. In Angola, DR Congo, Gabon and Haiti,
domestic consumption is almost entirely met from imports and the EU provides
a small or even insignificant share of import demand relative to other exporters.
In Ghana, the market is also largely supplied by imports and dependence on
imports has been growing up to 2015, with a fall in imports in 2016. Imports are
primarily supplied from the US (40% market share) with Brazil and the EU each
having about 25% market share (USDA, 2017). However, EU exports have
continued to increase dramatically in the more recent years not shown in the
table, by a further 43% between 2016 and 2018 from 110,000 tonnes to 158,000
tonnes.
In South Africa, on the other hand, imports make up only a relatively small
share of the domestic market which is mainly supplied by domestic production.
However, import volumes have been growing more rapidly than domestic
production and dependence on imports is increasing. The EU share of imports,
moreover, has risen rapidly in recent years to account for around 50% of imports
in 2016 (though anti-dumping duties and avian flu restrictions in 2017 and 2018

57
led to a sharp fall in imports from the EU in these years). In Benin, the EU
provides virtually all imports though the statistics for domestic consumption are
distorted by the fact that the major share of these imports is subsequently
smuggled across the border to Nigeria.
Table 14. Imports and EU share of imports relative to domestic chicken consumption in
main VDC markets for EU chicken meat exports
Region
Country
Average imports
(‘000 tonnes)
Ratio of domestic consumption
(%)
2007-2009 2014-2016 2007-2009 2014-2016
Africa
Angola: imports 157 264 92 87
of which EU imports 9 10 5 3
Benin: imports 63 123 86 90
of which EU imports 55 101 74 74
DR Congo 46 77 81 88
of which EU imports 16 26 28 29
Gabon: imports 36 64 90 94
of which EU imports 10 26 26 38
Ghana: imports 75 107 76 76
of which EU imports 27 80 27 57
South Africa: imports 212 451 16 28 of which EU imports 4 221 0 13
Latin
America &
Caribbean
Haiti: imports 26 73 76 90
of which EU imports 0 1 0 2
Source: USDA, Production, Supply & Distribution database. Imports from the EU are
assumed equal to EU exports shown in the Eurostat COMEXT database.
Notes: Data for Togo and Comoros not available.
There are some African countries one might expect to see on the list of top
importers of EU chicken meat in Africa but that do not appear. Nigeria and
Cameroon do not appear on the list of major chicken importers as they banned
poultry imports since 2003 and 2006, respectively. Domestic chicken production
seems to have responded well in Cameroon which has developed a thriving local
chicken industry (GIZ, 2018). However, production difficulties caused by
outbreaks of avian influenza seem to have encouraged some smuggling of
frozen chicken cuts into the country in recent years. In Nigeria, by contrast, local
production has found it difficult to respond to the ban on imports and much of
Nigerian poultry consumption is smuggled into Nigeria across its overland
borders. One estimate is that local demand is around 1.5 million tonnes of which
domestic production only supplies 300,000 tonnes. Increasing local production
has been difficult because of the high cost of feed (mainly maize in West Africa
which is also used for food) and poor development infrastructure (lack of
electricity, unregulated importation of day old and hatchery chicks, non-

58
regulation of the use of antibiotics and other drugs and low standards of
biosecurity).15
2.4.3 Processed tomato products case study
CAP support for tomatoes
There is no direct EU support under the CAP for tomato processing, although
individual tomato processing firms may receive government support under other
headings. However, there is a potential subsidy in favour of tomato processing if
CAP subsidies for the production of raw tomatoes result in the greater
availability and thus lower price of the raw material for processing.
CAP support for raw tomato production has changed over time. The first
Common Market Organisation (CMO) rules on processed tomatoes date back to
1977 and the regime was first reformed in 1996. Under the support system for
processed tomatoes laid down in 199616 the CAP subsidy was: i) coupled to
output and limited to a quantity of processed products corresponding to a
specific volume of fresh tomatoes. The quantity of fresh tomatoes, divided into
three groups (tomato concentrate, canned whole peeled tomatoes and other
products), was distributed annually among MSs according to the average
quantities produced; ii) paid to processors approved by the MSs on the basis of a
contract with recognised Producer Organisations. The aid was only granted on
processed products meeting minimum quality requirements made from raw
materials harvested in the Community for which a price at least equivalent to the
minimum price had been paid. In 2000 the support regime was changed and the
minimum price was abolished.17 Aid was now paid directly to farmers via their
Producer Organisations provided a contract for sale had been concluded with an
approved processor. The aid was paid per tonne of tomatoes, originally set at
EUR 34.50 per tonne which was equivalent to an ad valorem subsidy of 43%
(Rickard and Sumner, 2011). The quota system was replaced by Community and
national processing thresholds. If these thresholds were exceeded, penalties were
applied.
The 2007 reform of the single CMO integrated support for tomatoes into the
Single Payment Scheme (SPS) of decoupled payments from 1 January 2008.18
For processing tomatoes, the EU’s largest producer Italy opted for a three year
transition period (2008-2010), maintaining coupled payments at 50% of the
15 ‘Nigeria’s Ban on Poultry Imports – Important Lessons for Ghana’, The Poultry Site, 7 June 2016. 16 Regulation (EC) No 2201/96 and Regulation (EC) No 2200/96. 17 Regulation (EC) No 2699/2000. 18 Regulation (EC) No. 1182/2007.

59
national ceiling until the end of 2010 with decoupled payments to be fully
implemented from 2011. However, because Italy retained the ‘historic basis’ for
decoupled payment, tomato growers that historically received very high
payments per hectare continued to receive these payments, albeit now decoupled
and no longer linked to the production of tomatoes. That is, after 2011 tomato
growers receive a Single Farm Payment at the full rate of support they received
during 2000 to 2002. The reform did not seem to have had any major impact on
production trends. Statistics on overall EU production of tomatoes for
processing show production has been broadly stable since 2005 though with
annual fluctuations (peaks of 10.2Mt in 2005, 10.5Mt in 2009, 10.5Mt in 2015,
10.9 Mt in 2016 but falling to 9.4Mt in 2018) (DG AGRI, 2018c).
Under the 2013 CAP reform, which entered into force in 2015, the SPS was
replaced by the Basic Payment Scheme under which new payment entitlements
were allocated based, as a general rule, on the number of eligible hectares at the
disposal of farmers in the first year of implementation of the scheme.19 MSs that
had used the historic basis were allowed to keep their existing payment
entitlements with some convergence in the values per hectare within a region or
country. Italy made use of this possibility and has moved towards only partial
convergence of payment entitlements per hectare by 2019. Thus, the historic
high payments to tomato growers continue, albeit in a less pronounced way,
under this model. In addition, MSs make use of the voluntary coupled payments
scheme to support the production of processing tomatoes (Table 15).
Table 15. Coupled support in the EU for tomatoes for processing
Country
Quantity limit
(ha)
Yields
(t/ha)
Unit payment
(EUR/ha, 2017)
Envelope 2017
(EUR million)
France 2,711 75 1,057 2.86
Greece (2015) 9,080 3.91
(2017) 5,800 70 430 3.00
Italy 96,768 63 114 10.99
Malta 139 6,504 0.90
Portugal 13,896 93.48 240 3.34
Poland (2015) 12,874 4.25
(2017) 5,150 30 330 2.84
Romania (2015) 2,000 2.84
(2017) 2,000 15 1,420 1.42
Spain 25,000 75 254 6.35
Source: DG AGRI, 2015; DG AGRI, 2017.
19 Regulation (EU) No 1307/2013.

60
MSs had to originally notify their intentions by 1 August 2014 to grant coupled
support in 2015 but had the possibility to revise their VCS decisions by 1
August 2016 with the changes (if any) effective from 2017. A few countries
appear to have notified changes for tomatoes in their VCS scheme. In addition,
other countries notified that they provided coupled support to generic fruit and
vegetable production, without indicating whether any of this support was
granted for tomato production.
Trends in EU processed tomato production
Processed tomato products include canned tomatoes, tomato paste (including
tomato purée) as well as a range of tomato sauces including ketchup.20 Two
kinds of tomato paste are distinguished: unconcentrated and concentrated.
Figure 14 shows the increasing trend of EU processed tomato production since
2008.
Figure 14. Value of processed tomato production in EU28, EUR million
Source: Eurostat PRODCOMM database.
20 The term ‘tomato paste’, which includes different degrees of concentration, is related to canned tomatoes
prepared by eliminating a part of the water from the pulpy juice obtained by homogenising fresh tomatoes and
sieving the resulting chopped product. The FAO CODEX standard for tomato concentrates (CODEX STAN 57-
1981) requires that the name of the product shall be ‘tomato purée’ if the food contains not less than 7% but less
than 24% natural total soluble solids, and ‘tomato paste’ if the food contains not less than 24% natural total
soluble solids.

61
Italy is by far the most important producer of processed tomato products. It
accounts for around 85% of the value of production of canned tomatoes and
unconcentrated tomato paste. For concentrated tomato paste, Spain and Portugal
as well as Greece are important producers, and the Italian share of EU28
production is around 50%. However, Italy is the most important exporter of
processed tomato products to countries outside the EU.
Processed tomato products are exported under different HS code classifications
(Table 16). The relevant codes for our purposes are canned tomatoes (200210)
and tomato paste (200290). Tomato sauces are a rapidly growing category but
the ‘other sauces and preparations containing tomato’ is a 10-digit HS class and
COMEXT trade statistics are only disaggregated to the 8-digit level. Because
export values and volumes in this class include sauces without any tomato
content, it is not possible to determine how much of the exports in this class are
processed tomato exports.
Table 16. HS codes relevant to processed tomatoes
HS code Description of product
200210 Tomatoes whole or in pieces prepared or preserved otherwise than
by vinegar or acetic acid (canned tomatoes)
200290 Tomato paste
210320 Tomato ketchup and other tomato sauces
2103 90 90 10 Other sauces and preparations containing tomato
The growth in exports of canned tomatoes and tomato pastes and the division of
export markets between vulnerable and non-vulnerable countries is shown in
Table 17. Exports of both canned tomatoes and tomato paste have grown over
the period. Although in 2005 exports of tomato paste were more important in
value terms, more rapid growth of canned tomato exports has meant that by
2018 these roles were reversed.
The VDCs have never been important markets for canned tomatoes – their share
has grown from 5-6% at the beginning of the period to 6-7% by the end. On the
contrary, VDCs took more than half of all EU exports of tomato paste at the
beginning of the period. However, since 2005 both the value and share of
exports to these markets has decreased. In 2018, EU exports of tomato paste to
Japan alone (EUR 58 million) nearly equalled total EU exports to VDC markets.
Other important export markets are high-income countries such as Libya,
Switzerland, Russia, Australia, United States, Saudi Arabia, Canada and Norway
in that order.

62
Table 17. Market shares of EU exports of selected processed tomato products, 2005-
2018, EUR million
2005 2006 2007 2008 2009 2010 2011 2012 2013 2014 2015 2016 2017 2018
200210 Prepared or preserved tomatoes, whole or in pieces (canned tomatoes)
Total non-vulnerable countries
153 158 181 210 226 252 268 296 311 330 342 336 343 355
Total VDCs
8 10 13 13 15 17 18 19 23 24 25 22 23 24
Total extra-EU28
162 168 193 223 241 269 286 315 334 355 368 357 366 379
Share VDCs in tot exports (in %)
5 6 7 6 7 7 7 7 7 7 7 6 7 7
200290 Tomato paste
Total non-vulnerable countries
100 130 148 165 163 157 193 158 220 226 259 305 262 268
Total VDCs
137 130 128 140 164 117 105 127 107 72 77 57 64 60
Total extra-EU28
237 260 276 306 327 274 298 285 327 298 337 361 326 329
Share VDCs in tot exports (in %)
58 50 46 46 50 43 35 45 33 24 23 16 20 18
Source: Eurostat COMEXT database.
Despite the fall in the value of tomato paste exports to VDCs, this value in 2018
was still significantly higher than exports of canned tomatoes to these markets,
even if the latter are on a rising trend. Also, criticisms of the impact of EU
exports on producers in VDCs, especially in Africa, have focused on tomato
paste. Our focus is therefore on the main markets for EU tomato paste among
VDCs.
EU exports of tomato paste to vulnerable developing countries
The top ten principal VDC importers of EU tomato paste are shown in Table 18,
to which has been added Nigeria which was the major importer in the past.
Divergent trends are apparent.
Both the value and volume of imports has steadily increased for those importers
at the top of the list in 2018. However, for large importers at the start of the
period (Nigeria, Ghana, Ivory Coast and Angola) imports from the EU show a
sharp decline both in value and volume. The case of Ghana is particularly
noteworthy as it has been the country highlighted in the NGO literature
reviewed earlier. The main reason for the fall in EU exports to Ghana has been a

63
loss of market share to China due to uncompetitive prices although total imports
by Ghana have also fallen back from the unusually high levels in 2013.21
Table 18. Principal importers of EU tomato paste among VDCs
2009 2010 2011 2012 2013 2014 2015 2016 2017 2018
Value of EU exports (EUR million)
Burkina Faso 2.3 2.4 1.9 2.7 2.5 4.5 5.6 5.5 7.8 8.3
South Africa 3.3 3.6 3.5 3.3 4.2 5.5 4.2 5.4 6.5 7.4
Sudan 4.2 5.9 8.4 11.0 6.3 8.0 16.3 8.8 7.2 7.3
Tanzania 3.2 3.9 4.1 4.9 4.1 5.7 7.7 4.8 4.4 5.3
Gabon 3.7 4.2 3.1 3.9 4.0 4.0 5.0 4.5 4.7 4.3
Congo 5.0 2.0 1.8 3.0 1.8 1.8 1.7 3.0 1.7 2.9
Senegal 0.9 0.2 0.9 0.4 2.5 1.6 2.0 1.6 1.7 2.6
Ghana 26.8 23.7 12.6 28.3 19.9 6.8 4.3 4.2 3.4 2.6
Ivory Coast 10.5 9.9 6.7 6.2 3.5 3.2 2.5 2.8 2.4 2.6
Angola 18.1 12.5 13.4 16.2 13.6 6.7 6.6 3.8 9.2 2.4
Nigeria 43.1 23.1 27.7 27.1 27.1 10.8 6.2 1.0 0.3 0.3
Volume of EU exports (‘000 tonnes)
Burkina Faso 2.0 2.3 2.2 2.7 2.3 4.1 4.9 5.0 7.3 8.2
South Africa 3.3 4.0 3.8 3.7 4.2 6.1 4.5 6.0 7.5 8.8
Sudan 4.1 6.5 9.7 11.8 6.5 7.4 14.5 9.3 7.6 9.4
Tanzania 2.2 3.1 3.3 3.9 3.2 4.4 5.4 3.5 3.3 4.0
Gabon 2.8 4.0 3.0 3.7 3.5 3.2 4.0 3.7 3.8 3.7
Congo 3.6 1.7 1.5 2.4 1.3 1.3 1.2 2.3 1.3 2.3
Senegal 1.2 0.2 1.2 0.5 4.1 2.2 2.3 2.1 2.2 3.6
Ghana 23.0 23.7 13.2 28.9 18.9 6.3 3.7 3.5 2.9 2.7
Ivory Coast 10.6 11.3 8.4 7.3 3.6 3.1 2.3 2.5 2.2 2.7
Angola 13.3 11.0 12.3 14.2 11.4 5.5 5.1 3.3 7.8 2.2
Nigeria 35.0 21.0 28.1 25.9 25.0 10.0 5.0 1.0 0.3 0.3
Source: Eurostat COMEXT database.
Information on the relative importance of the major import suppliers to these
markets is patchy, but Table 19 provides some data taken from FAOSTAT.
There are essentially only two exporters in these markets, China and Italy. The
table shows the relative share of Italian exports of tomato paste in the selected
markets. What emerges clearly is that, even in those markets where Italian
exports played a significant role in the past (Burkina Faso, Ghana, Ivory Coast)
its market share has fallen dramatically, while in other countries it was never the
major supplier. In all countries for which recent data are available, Chinese
imports are now the main source of competition for local producers.
21 For the prospects and challenges facing tomato paste production in Ghana, see ‘Ghana’s Tomato Processing
Industry: An Attractive Investment Option in 2016’, 8 December 2015, Goodman AMC Blog.

64
Table 19. Imports of tomato paste and Italian share to selected VDCs, EUR million
2007 2008 2009 2010 2011 2012 2013 2014 2015 2016
Burkina
Faso
World 5.1 3.9 3.5 4.6 4.7 3.9 2. 4 3.1
Italy share 37% 33% 31% 31% 36% 26% 26% 25%
DR
Congo
World 12.4 11.8
Italy share 46% 35%
Ghana World 49.2 38.9 38.0 46.2 78.8 90.3 108.6 57.3
Italy share 40% 32% 21% 31% 13% 20% 16% 1%
Ivory
Coast
World 11.1 22. 15.7 16.1 12.9 15.3 15.9 13.4 10.6
Italy share 63% 59% 58% 60% 39% 27% 14% 12% 5%
Nigeria World 86.4 39.3
Italy share 33% 25%
Senegal World 5.1 8.2 7.2 7.8 7.8 8.1 10.0 7.7 15.6 11.7
Italy share 19% 2% 3% 0% 0% 0% 4% 0% 4% 0%
South
Africa
World 5.9 10.4 12.2 10.6 11.8 16.3 15.6 31.7 25.9 18.9
Italy share 18% 14% 13% 19% 12% 11% 15% 8% 14% 10%
Tanzania World 0.7 0.5 0.6 0.8 0.9 0.9 0.5 1.0 0.7 1.0
Italy share 9% 8% 5% 3% 0% 0% 0% 1% 0% 2%
Source: FAOSTAT, Detailed Trade Matrix.
Notes: empty cells denote missing data. Data for Gabon, Libya and Sudan not available.

65
Part 3 Main findings on the impact of
current CAP subsidies on the price of EU
food produced and exported to developing
countries
In this part the influence of CAP subsidies on export prices of case study
products and on VDCs importing these products is discussed.
3.1 CAP subsidies contribute to a greater volume of EU
milk powders exports but price effects are limited
The CAP subsidy policies under review include coupled payments, decoupled
payments and price management policies. Exports of EU dairy products are
made at world market prices so there is no longer any direct impact of CAP
subsidies on export prices. However, following the discussion in Part 2, CAP
subsidies may have an indirect impact on export prices to the extent that (a) they
encourage increased production within the EU, and (b) increased EU production
leads to increased EU exports which, given the importance of the EU as an
exporter on world dairy markets, is likely to depress the world price for these
products and thus, indirectly, the EU export price.
The discussion in Part 2 identified two mechanisms whereby CAP subsidies
might influence the volume of EU dairy products produced. One is the direct
incentive effect where coupled subsidies raise the return to producing milk in the
EU and decoupled subsidies increase production through a combination of risk,
wealth, credit and insurance effects. The other is an indirect incentive effect
where farmers use their direct payments to subsidise their production activity,
essentially producing below cost, thus enabling higher production and higher
exports to take place, and which has been described as a form of dumping.
It may seem obvious that coupled payments to dairy cows should raise total milk
production in the EU. However, simulations using the CAPRI model for DG
AGRI in the impact assessment of its legal proposal for the CAP post 2020
found this was not the case. The removal of coupled support (in isolation from
other changes) would indeed reduce dairy cow numbers (by 0.7%) but this
would be more than offset by an increase in productivity (yields would go up
1.5%) in part due to higher prices (1.4%), yielding an overall increase in
production of 0.7% (EC, 2018). Still, even if coupled payments appear to reduce

66
milk production in the EU because of their impact on average yields, they also
reduce the cost of raw milk to dairy processors.
The impact of decoupled payments is less obvious. The impact of decoupled
payments on production and prices is measured by the degree of decoupling.
There is controversy about the magnitude of this parameter though most
observers judge it to be relatively low (see Box 4). This is confirmed by
simulation results in the SCENAR 2030 study for the scenarios Lib&Prod (the
removal of Pillar 1 supports, the redirection of a smaller Pillar 2 to productivity-
enhancing measures, and extensive trade liberalisation through bilateral free
trade agreements) and NoCAP (which in addition eliminated Pillar 2 as well as
Pillar 1 expenditure) (M’Barek et al., 2017). General results for agricultural
production as a whole were earlier reported from this study. Dairy is a sector
that is projected to gain from the improved market access obtained under the
various FTAs included in these scenarios. Without this improved market access,
the impact of removing CAP subsidies alone would be greater than what is
reported below.
In the Lib&Prod scenario, dairy cow numbers fall (by 0.7%) but this is again
compensated by an increase in yields resulting in almost no change in total milk
production (-0.1%). In the NoCAP scenario, EU milk supply decreases by -
2.1%, mainly because of a decrease in average milk yield as cow numbers
increase by 0.7%. In both scenarios, the decrease in EU milk production leads to
a reduction in the supply of EU dairy products and a reduction in the net trade
surplus for dairy products in volume terms. Nonetheless, the EU would remain a
substantial net exporter in dairy products in both scenarios.
The models used in the SCENAR 2030 simulations assume rational behaviour
by farmers, so by definition they do not take account of the possibility that
farmers may use their direct payments to subsidise their farming activity. To the
extent that this happens, there is likely to be considerable pass-through of this
subsidy to the dairy processors in the form of lower raw milk material costs.
This is because raw milk is not an internationally traded product, so farmers do
not have an alternative outlet other than to sell their milk to an EU dairy
processor. This implicit subsidy will not be reflected in the selling price of milk
powder products as these products are relatively standardised and sold at a
competitive market price. However, the availability of a larger supply of milk at
a lower market price than would prevail in the absence of CAP subsidies allows
the EU dairy industry to export larger volumes of dairy products than might
otherwise be the case. Because of the important role of the EU as an exporter in
these markets, this means that the world market price (and thus the EU export
price) is lower than it would be in the absence of CAP subsidies. However, there

67
are no published estimates of the potential size of this effect in the case of the
current CAP.
The final CAP subsidy instrument to be examined is price management policy
where the measures include safety-net intervention when market prices for
specific dairy products (butter and SMP) fall below a certain level, and
voluntary supply management where producers are compensated to reduce
production faced with a market situation of lower prices.
EU intervention policy in the past destabilised world markets for milk powders
because it helped to maintain production in the EU and the accumulated
surpluses could later be disposed of on the world market with the aid of export
subsidies. With the elimination of export subsidies, EU safety-net intervention
has a different market impact. The EU, when acting as a buyer of last resort,
supports the world market price for dairy products in the same way as an
international buffer stock manager would do. The intent and effect of the EU’s
safety-net intervention is to maintain EU production capacity during a market
crisis that might otherwise disappear, but third country producers also benefit.
The impact on world market and import prices in 2015-2016 if the EU had
allowed the SMP it diverted to storage to be sold on world markets would have
been even more severe than what actually occurred.
When the accumulated stocks are subsequently released on to the market again,
this dampens the price recovery. And while stocks exist and overhang the
market, this price recovery may be delayed. This is the main advantage of a
voluntary supply management scheme over intervention purchases. Both
measures remove surplus from the market, in the former case by paying farmers
not to produce. Therefore, the issue of the disposal of the surplus stocks does not
arise. However, provided that CAP subsidies do no more than compensate for
the cost of storage, the EU is effectively acting as an international buffer stock
manager smoothing out price fluctuations but not increasing the average level of
EU prices. Because of the impact of EU producer prices on world market prices
its actions will also smooth the path of world market dairy product prices.
However, it has been reported that the European Commission in disposing of the
SMP stocks that had built up during the 2015-16 price depression has accepted
tenders at EUR 1,050/tonne, well below the European floor price of EUR
1,698/tonne.22 Where this occurred, it is clearly an additional subsidy to the
dairy sector which directly benefits traders who purchase at this price.
22 ‘Milk powder stocks: the Commission’s strategy has cost European milk producers € 2.3 billion’, Agriculture
Stratégies, 20 April 2019.

68
In conclusion, the ending of milk quotas in 2015 allowed an expansion in EU
milk production as production shifted to lower-cost production regions in north-
west Europe that had previously been constrained by the quota limits. This
increase in production at a time when world market prices were falling (in part
due to the Russian ban on imports of various EU agri-food exports including
dairy products) put further downward pressure on world market prices at this
time. Looking forward, the issue is whether CAP subsidies have an impact on
the volume of EU dairy product exports such that there is a systemic lowering of
world market prices and not just a once-off adjustment.
The evidence for coupled payments is ambiguous. Coupled payments result in
more cows but lower raw milk prices for producers. Because this effect, in turn,
lowers the average yield per cow, the overall impact of coupled payments on
milk production is to lower the level of production (EC, 2018). EU dairy
processors get access to cheaper raw milk, but paradoxically there is less of it.
Lower availability of milk supplies means there is less production of milk
powders than would otherwise be the case.
Decoupled payments make up 40-50% of dairy farmer incomes. Despite no
longer being linked to milk production, the modelling evidence suggests that
these payments have stimulated milk production to some small extent (by up to
2%) and that milk powder exports are also greater as a result. If the possibility
that farmers use some of their direct payments to subsidise their farming activity
is also taken into account, then the stimulus to production and milk powder
exports would be greater. There exists no published evidence on the potential
size of this price effect, but as the EU competes with other exporters on these
markets, it will be limited.
3.2 CAP subsidies are not a significant determinant of
milk powder exports to VDCs
Section 2.4.1 showed that the majority of EU exports of milk powders are
exported to oil-exporting and middle-income developing countries where issues
of agricultural development and food security are less important than in the
VDCs. West African markets in particular take an important share of exports of
WMP and, in particular, FFMPs, and this section focuses on these markets.
Highlighting the growth of dairy imports into Africa is not new. Already in the
1980s, Valentin von Massow, a researcher at the International Livestock Centre
for Africa, had drawn attention to this phenomenon (von Massow, 1984, 1989).
What are the drivers of this growth in imports and how important are CAP
subsidies as an explanatory factor?

69
Milk production in West Africa is not stagnant. According to FAOSTAT (and
bearing in mind that the quality of these statistics is likely to be very low),
production in the region as a whole grew by 43% between 2005 and 2017, or a
growth rate of 2.4% per annum, though with considerable variability from year
to year within countries. However, this rate of growth is barely able to keep up
with population growth and is much lower than the growth of milk powder
imports.
The growth in dairy imports, and milk powder imports in particular, in West
Africa reflects a number of factors including rapid population growth, growth in
per capita income, and a rapid rate of urbanisation. It also reflects weaknesses
in the ability of local dairy supply chains to meet this consumer demand. Milk
yields are low in traditional breeds, and there is a lack of adequate infrastructure
(milk collection facilities, refrigerated trucks, and processing units) (Salla,
2017). There is a strong preference among dairy processors in these countries
producing pasteurised milk, butter, ice cream and yoghurt for milk powder
which is easy to store and which can last for long periods in a hot climate
without refrigeration, as compared to the purchase of liquid milk from local
suppliers where there may be quality problems due to the absence of cold chain
infrastructure in milk assembly and transport. Also, households welcome the
convenience of being able to purchase milk powder in small sachets which allow
easier storage.
Imported powdered milk from Europe is sold at much lower prices in West
Africa than locally produced milk. For example, in Senegal, the price of a litre
of local milk is about USD 1-1.2, while the imported and reconstituted milk
powder costs about 0.5 USD/litre (Salla, 2017). Oxfam International claims that
imported milk powder costs only one-third the price of local fresh milk (Oxfam
International, 2018).23 Not only can local producers not compete on price, but
the availability of cheap imported milk powder reduces the incentive for
governments to invest in local milk production, perpetuating the imbalance.
To what extent are CAP subsidies responsible for the low cost of imported milk
powder in West Africa? The previous analysis concluded there was evidence
that CAP subsidies have contributed to a greater volume of EU dairy product
exports, including milk powders, which in turn will have lowered the world
market price. There are no estimates of what this price effect might be, but as
23 These price comparisons are made using the official exchange rate. Where the official exchange rate is
overvalued, either because a country has significant non-agricultural commodity exports (oil or minerals) or
because inflation has been higher than in its trading partners, domestic production will always find it more
difficult to compete with imports.

70
the EU competes with other exporters on these markets, this price effect will not
be large. The EU is now a relatively minor player on the world WMP market
(Figure 11) and only accounts for around one-third of global SMP exports, a
share that is likely to decline (Figure 12). Even if the price effect were as high as
5-10% this would make little difference to the attractiveness of imported milk
powder if the price differential with local milk is of the order of 3 to 1.
Most EU milk powder exports to VDCs such as those in West Africa now take
the form of FFMPs where the EU is the major player (see Table 8). In the period
2015-2018, FFMPs accounted for 257,000 tonnes (72%) of total EU milk
powder exports of 355,000 tonnes to these markets.
The growth in FFMPs is primarily due to the technological innovation that
allows butterfat in milk to be replaced by a cheaper vegetable fat, usually palm
oil. This allows these products to be sold at a price up to 30% lower than full-fat
powdered milk (Oxfam International, 2018). This technological innovation has
further increased competition for local milk production in West Africa but has
occurred in isolation from CAP policies. Over the longer term, the issue is how
to help West African producers (and those in other VDCs competing with milk
powder imports) to improve their productivity and the performance of local
supply chains to enable them to compete at these prices.
3.3 CAP subsidies do not influence the price and volume
of EU chicken meat exports
The main reason why the EU can export chicken meat despite higher production
costs than its competitors is due to the nature of consumer preferences in the
EU. Due to the preference for breast meat, the value of the whole carcase is split
approximately 75% for the breast meat, and 25% for the rest of the carcase.
Because EU consumers favour white meat (breasts), EU chicken processors are
faced with a large surplus of dark meat (wings, legs and offal) that cannot be
disposed of on the EU market. While there was a market for these chicken parts
in pet food in the past, EU pet owners are trading up to other meats for their
pets. In the absence of overseas outlets, chicken processors would be required to
dispose of these chicken parts at a cost. So, even a relatively small return from
export sales makes these attractive to processors. Thus, the low price of EU
chicken exports documented in Part 2.4.2 cannot be attributed to the role of
subsidies but is instead explained by the role of consumer preferences.
Goodison (2015, 2018) notes that high import protection has allowed EU
chicken production to expand in line with the growth of EU consumption despite

71
significantly higher EU production costs. This is not the end of the story, and he
notes the EU’s import regime carries important implications for EU exports of
chicken meat. “This has created a situation where the expansion of EU poultry
production promoted by the tightly controlled import regime has generated a
rapid expansion of EU production of poultry parts, which are surplus to
domestic EU requirements. It is these frozen poultry parts which have
increasingly been exported to sub-Saharan African markets…” (bolding in
original). Thus, his argument is that the volume of EU chicken exports has been
supported by the extensive import protection provided to the EU chicken
industry, exacerbating the import competition faced by producers in VDCs.
The counter-argument to this assertion is that what determines the volume of
dark meat available on world markets is EU consumption, not production.
Suppose tariff protection for the EU chicken industry was reduced or eliminated
and EU consumption was met instead by imports. EU consumers would still
demand white meat, leaving the new exporters to the EU market (for example,
Brazil, Ukraine or Thailand) with an equivalent quantity of dark meat to be
disposed of. Indeed, EU consumption of chicken will increase because of
reduced protection and lower prices on the EU market. While this will be partly
offset by reduced consumption outside the EU due to higher world market prices
for broiler meat, overall global consumption and thus production would be
higher if the EU removed its protection. As the EU with its preference for white
meat would now account for a larger share of global consumption, the
availability of dark meat for sale outside the EU would increase even further.
The trade statistics quoted in Part 2.4.2 show how easy it is for frozen chicken
parts from one exporter to be replaced by another exporter (as happened in the
South African market in 2017 following restrictions on EU exports due to anti-
dumping duties and avian flu). Import competition faced by local producers
would not be lessened if the EU reduced its import protection and thus domestic
production of chicken meat; in fact, the opposite would be more likely to occur.
3.4 CAP subsidies do not impact chicken meat exports to
VDCs
We observed in the chicken meat case study in Part 2.4.2 that the demand for
EU chicken meat exports in the mid-2000s was mainly in non-vulnerable
country markets in Asia and in Eastern Europe, but by 2018 African plus some
Caribbean countries had come to account for around half of total EU exports of
frozen chicken meat. What is behind the growth of EU exports to these markets
and are CAP subsidies an explanatory factor?

72
Demand for livestock products in these markets, including poultry, is expanding
as a result of population growth and increased urbanisation. Traditionally,
chickens were eaten on festive occasions, but with the greater availability of
cheaper imported chicken cuts, consumption of chicken is becoming a more
everyday occurrence in both urban and rural areas (Sumberg, Awo, and
Kwadzo, 2017). Consumers in urban areas prefer imported frozen chicken
products because they are cheaper than domestic chicken products and are
already processed with pre-cut parts of leg-quarters and wings. Local poultry
processors often lack the infrastructure and equipment to produce the chicken
cuts that are preferred by most consumers. Frozen poultry is widely distributed
through a network of privately-owned cold stores located in major cities.
However, often the cold chain is broken when the product is driven long
distances in tropical temperatures and is sold unrefrigerated from market stalls
or in antiquated freezer cabinets that have to contend with daily power failures.
Consumers may be exposed to salmonella and other bacteria as a result, and
there are also concerns around contamination with formaldehyde, a solution of
which is used as a disinfectant and preservative, and with antibiotics. Similar
hygiene and food safety issues apply to domestically-produced chicken meat
processed and sold in the same way (Sumberg, Awo, and Kwadzo, 2017;
Rudloff and Schmieg, 2016).
All analyses of the growing dependence of African economies on imported
chicken meat point out the price advantage enjoyed by imports. For example, in
Ghana, market prices of local broiler meat tend to be higher than imported meat
by a 30%-40% margin, making local broiler meat uncompetitive (USDA, 2017).
In Nigeria, smuggled chicken costs about ₦500- ₦700 ($2.50-$3.50) per kg
while locally produced frozen chicken costs between ₦1,000- ₦1,300 ($5 -
$6.50) at retail locations, and approximately ₦650 ($3.25) at the farm gate.24
Another fundamental problem is the low productivity of the domestic industry.25
Feed costs represent over 60%-70% of overall production costs and feed is often
relatively expensive. Slower growth rates mean that producers must feed their
birds over a longer period, which further increases feed and medication costs.26
Improving productivity can also be held back by other factors. Diseases such as
Newcastle disease cause high mortality. Farmers lack reliable access to inputs,
24 Ibidem. 25 For discussion of the challenges facing the broiler industry in Ghana, see Kusi et al., 2015; Netherlands
Embassy, 2014; Ayisi and Adu, 2016. 26 One study in Ghana compared production efficiency and costs of a modern commercial broiler unit with
efficiency and costs in a sample of five selected farmers in the Accra area (Banson, Muthusamy, and Kondo
2015). Results emphasised the importance of the feed conversion rate as a major factor in reducing production
cost and improving the broiler growth efficiency. The feed conversion rate for the commercial broiler unit was
1.56 kg of feed needed to produce 1 kg live weight compared to 2.12 kg of feed to produce 1 kg live weight by
other poultry farmers in the study.

73
including chicks and feed, and face high costs for veterinary services.
Production has also been adversely affected in recent years by avian influenza
outbreaks, which sometimes mean the destruction of day-old chicks and thus
shortages of production.
African governments have often failed to address the constraints that hold back
productivity. The case of Ghana is an example. In 2014, the Ghanaian
government announced the Ghana Broiler Revitalization Project (GHABROP), a
ten year collaboration project with the Ghana National Association of Poultry
Farmers. However, it appears very little has been achieved with this project and
local poultry producers are unclear how the money was disbursed.27 One study
of government policy towards the poultry industry in the country concluded that:
“This review has shown that despite a rhetorical commitment to the development
of the domestic poultry industry, there is little evidence of sustained follow
through on the part of the Government of Ghana. Instead, poultry has
languished in the nether reaches of the domestic agricultural policy system”
(Sumberg, Awo, and Kwadzo, 2017).
In some cases local associations have reacted to alleged dumping behaviour of
EU exporters. South Africa has been the largest market for EU frozen chicken
exports in Africa up to 2016 (when EU exports amounted to 250,000 tonnes)
after which exports fell sharply due to the imposition of anti-dumping duties on
exports from specific EU countries (Box 5) as well as restrictions imposed as a
result of the outbreak of avian flu in some EU countries. This is an example of
EU exports that had increased on the back of duty-free access under FTAs with
South Africa and the imposition of higher MFN duties on imports from its
competitors.
Box 5. Imposition of anti-dumping duties on EU exports of frozen chicken parts to
South Africa
The South African Poultry Association (SAPA) complained in 2013 that imports of frozen
chicken parts in the calendar year 2012 were being imported at below their normal value
from processors in three EU countries, Germany, the Netherlands and the UK. To
establish whether there was merit in the case, the South African International Trade
Administration Commission (ITAC) – the organisation tasked with customs tariff
investigations, trade remedies, and import and export control – compared the export
prices of EU frozen chicken to Benin (a market of comparable size to South Africa) with
export prices of EU frozen chicken in South Africa. For each of the three countries, the
27 ‘US$56m USDA funding goes waste …As GPP, AMPLIFIES projects fail to impact on local poultry
industry’, The Chronicle, 11 March 2019; ‘No ban on poultry imports – Govt says’, Graphic Online, 2 March
2017.

74
export prices to Benin were higher than the export prices to South Africa. To determine
whether dumping had occurred, the Commission compared the export price of different
chicken parts to their ‘normal value’. It based the normal value on the domestic price of
comparable (frozen) cuts sold by each of the cited companies and compared these values
with the prices of the same cuts exported to South Africa during the investigation period.
Where there were no domestic sales of the exported cut, the export price to Benin was
used as the normal value. Where this was not available, the Commission based the normal
value on constructed costs of production. The dumping margins found were based on these
calculated differences between the normal value and the export price to South Africa.
There was no inference that the differences found were related in any way to the operation
of CAP subsidies. In 2015, ITAC recommended that anti-dumping duties of between
31.30% and 73.33%; 3.86% and 22.81% (with some company exceptions); and 12.07%
and 30.99% be imposed on frozen bone-in chicken portions originating in or imported
from Germany, the Netherlands and the United Kingdom, respectively (ITAC, 2015;
‘Anti-dumping duties imposed on frozen chicken portions imports’; USDA, 2018).
After an investigation following a further complaint in February 2016 from SAPA, South
Africa imposed a provisional safeguard duty of 13.9% on imports of EU bone-in chicken
under the agricultural safeguards clause of the Trade, Development and Co-operation
Agreement with the EU. This allows the imposition of safeguard duties where imports
threaten to cause a serious disruption of the domestic market. Following completion of the
investigation, this duty was increased to 35.3% in September 2018 on imports from
selected EU countries, which will depreciate over four years to 15% (USDA, 2018). In
June 2019 the EU sought consultations under the dispute mechanism provisions of the
EU-Southern African Development Community (SADC) Economic Partnership
Agreement arguing that the measure appears to be inconsistent with the provisions of that
Agreement.
In conclusion, there is no evidence that CAP subsidies have depressed the export
price of chicken meat from the EU to VDCs. As discussed in Section 2.4.2, the
EU chicken industry does not benefit from CAP subsidies or guaranteed
intervention support. Tariff protection on feed wheat raises the cost of feed
which accounts for 60%-75% of the cost of producing chicken meat and thus
penalises rather than subsidises chicken production in the EU. This means that
the price of broiler meat in the EU is higher than that of other exporting
countries, in part due to higher feed costs but also due to higher environmental,
animal welfare and food safety standards. High import tariffs are necessary to
prevent a substantial increase in imports into the EU from these exporters. These
import barriers reduce EU consumption of chicken meat and reduce the global
supply of dark meat which is exported to VDCs. Despite these cost
disadvantages, the EU is a significant and increasing exporter of chicken meat,
and especially frozen chicken parts. Half of these exports now go to markets in
the VDCs. This trade is based on distinct differences in consumer preferences
for different types of chicken meat in the EU and export markets. Even if these
exports are not the result of CAP subsidies, local poultry producers find it

75
difficult to compete with these cheap imports and stronger measures to develop
the local industry are required.
3.5 CAP subsidies have the potential to influence the price
of exports of tomato products
Various academic studies have examined whether CAP subsidies influence the
price of processing tomatoes (Rickard and Sumner, 2008, 2011; Solazzo et al.,
2014). Rickard and Sumner (2011) estimate that the regime of coupled support
between 2001 and 2007 increased EU tomato production by 9.1% and the
regime of decoupled payments after 2007 increased EU tomato production by
3.8%, relative to a situation with no support. Their study supports the view that
decoupled payments have a smaller but still non-zero impact as compared to
coupled payments. However, the regime they model in 2008 is the transitional
regime where half of the payment to tomato growers is still made as a coupled
payment. The coupled support regime led to an increase in the price paid for
processing tomatoes of 18.4% (including the payment) and an unspecified fall in
the cost of processing tomatoes to the processors. It also led to a fall in world
market prices of between 1.6% (US) and 3.2% (Rest of World). In the partially-
decoupled situation in 2008, the price of processing tomatoes is increased by
8.3% (including that part of the payment that is still coupled) and the world
price reductions are between 0.8% (US) and 1.4% (Rest of World). However, in
their model, a fully-decoupled payment would have no production or price
effects by assumption (see Box 4 for discussion of the limitations of modelling
studies in providing evidence of the production and price impacts of decoupled
payments).
The Solazzo et al. (2014) paper assesses the impact of the Commission’s legal
proposal for the 2013 CAP reform (not the final outcome) which, in addition to
replacing the Single Farm Payment (SFP) with the Basic Payment, also
introduced a greening payment with associated mandatory farm practices. The
two issues analysed are the impact on farms growing processing tomatoes of the
greening conditions (specifically, the obligation to observe crop diversification
and to set aside ecological focus areas) and the convergence of payments to a
regional flat rate uniform payment (while this was the original Commission
proposal, the option of only partial convergence was included in the final
legislation and as noted previously, Italy made use of this option). They
conclude that the greening requirements will have no major impact (most farms
in the region that they consider growing processing tomatoes already grow other
cereal crops) but the convergence of payments would have a serious impact on
their profitability. The value of payments to farms growing processing tomatoes

76
would fall by 60% and they would lose a quarter of their income. Nonetheless,
they project that there would be hardly any reduction in the area under
processing tomatoes (a fall of -1.8%, including the impact of the greening
requirements) because of the decoupled nature of these payments.
In a case against two Italian tomato companies decided by the Australian Anti-
Dumping Commission in 2016 (Box 6) covering the year 2014 when the SFP
was in effect, the fact that payments to Italian tomato growers continued at their
previous levels under the historic basis in the SPS, in addition to a separate
payment made specifically to growers of processing tomatoes, was sufficient to
persuade the Anti-Dumping Commission that the price of raw tomatoes for
Italian processing firms was a distorted one and no longer represented a
competitive market price. The fact that these payments were now decoupled,
and that in principle tomato growers would continue to get the payment even if
they stopped to grow tomatoes, did not persuade the Anti-Dumping Commission
that the support no longer had an effect on tomato prices. It therefore accepted
that the imposition of an anti-dumping duty on exports from these two firms was
warranted.
Box 6. Australia anti-dumping duties on Italian tomatoes
An Australian company, SPC Ardmona Operations Limited (SPCA), which is the sole
Australian producer of prepared or preserved tomatoes, initiated an anti-dumping
complaint with the Australian Anti-Dumping Commission on two occasions, in July 2013
and in November 2014, alleging that prepared or preserved tomatoes (canned tomatoes for
short) exported to Australia from Italy at dumped prices had caused it material injury.
The Anti-Dumping Commission following the first complaint found that during the
investigation period July 2012 to June 2013 canned tomatoes were dumped by Italian
exporters and recommended anti-dumping duties of between 3.25% and 26.35% should be
applied (with the exception of two Italian firms Feger di Gerardo Ferraioli S.p.A. (Feger)
and La Doria S.p.A. (La Doria) for which it determined that the dumping margins were
negligible). The second dumping case brought by the complainant re-opened the case
against the two remaining firms. On the second occasion, based on the investigation
period of the calendar year 2014, the Anti-Dumping Commission calculated dumping
margins on imports of canned tomatoes of 8.4% for Feger and 4.5% for La Doria (Anti-
Dumping Commission, 2016).
These cases continued a long history of Australian countervailing and dumping duties on
imports of Italian canned tomatoes which were first imposed in 1992, confirmed for a
further five years in 1997 and again in 2002. The measures lapsed in April 2007 until the
case brought in 2013.
Whether dumping by an exporter is occurring is normally established by comparing the
price of export sales with the price of similar goods sold by the exporter on its domestic
market (see Box 1). However, there may exist a market situation such that the domestic
market price may not be a true reflection of the good’s ‘normal value’, including because

77
of government policies. Based on the claimant’s application, the Anti-Dumping
Commission set out to investigate whether payments made to Italian tomato growers under
the CAP distorted the prevailing market prices in Italy for prepared or preserved tomatoes.
The Commission accepted that the mere fact of government payments did not in itself
create a market situation where prices were distorted, and that it needed to examine
whether these payments led to a distortion of competitive market conditions such that
domestic sale prices are unsuitable for the purposes of determining normal value.
The prices paid for raw tomatoes for processing in Italy are determined by negotiations
between the processors and farmers. In reviewing the claimant’s first case, the Anti-
Dumping Commission had found that the price negotiations for the canned tomato
products were not influenced by CAP payments to farmers. It compared the weighted
average price of tomatoes purchased by the Australian industry from local suppliers (taken
to represent a notional price of fresh tomatoes paid by processors in a market unaffected
by any support programmes), with the raw material purchase price paid by selected
exporters from tomato suppliers in Italy. It wanted to assess whether there was any
indication that payments paid to tomato growers have flowed through to distorted selling
prices paid by the tomato processors in the form of lower prices. In all instances, the Anti-
Dumping Commission found that the price of fresh tomatoes paid by Italian processors
was either similar or higher than the benchmark price of fresh tomatoes available in
Australia. On this basis, the Commission concluded that any payments provided directly to
tomato growers in Italy are benefitting the growers in isolation and are not transferred to
processors in the form of lower prices.
While the Commission calculated a dumping margin for many exporters, this was mostly
in the context of receiving insufficient information from the exporting firms which meant
the Commission had to substitute its own estimates for specific costs. Where sufficient
information was provided, as in the case of the two firms Feger and La Doria, no dumping
margin was found.
Following the second complaint by SPCA in November 2014, the Commission asked a
consultancy firm LECA to prepare a report on the Italian market situation (Barker, 2015)
and reviewed additional evidence on CAP payments to Italian tomato growers. While the
previous partially-coupled payments to tomato growers had been gradually assimilated
into the fully-decoupled SFP, it concluded that under its national ceiling for SFP payments
the Italian government in 2014 had allocated a specific amount (EUR 184 million) to be
paid as direct income support to growers of raw tomatoes.
In working out the potential impact of these payments on the price of raw tomatoes for
processing, the report assumed that they effectively reduce the variable costs of production
(Barker, 2015).28 Based on FADN data, it calculated that if the subsidy were removed the
28 “Despite attempts at reform overall it appears that reform of CAP payments to raw tomatoes has not been
fully implemented in Italy, and that total farm assistance for tomatoes has not been fully decoupled and has
moreover not fallen significantly. Thus EU CAP payments with respect to tomatoes used in processed and
preserved tomatoes in Italy have thus remained coupled in two ways. First explicitly - with an additional
payment of 160 Euros per hectare introduced recently, which is coupled to production of tomatoes. Second they
are implicitly coupled, in that EU CAP payments are largely based on subsidy levels received by farmers in
previous years, which were based on the past system of coupled payments, and are thus implicitly tied to
output.” (Barker, 2015).

78
variable costs of production for the farmer would increase by 32%. The question then is
what effect the removal of the subsidy would have on the price of raw tomatoes for the
processing firms. This depends on two variables: (a) the degree of ‘pass-through’ of the
subsidy to raw tomatoes to the price of raw tomatoes; and (b) the degree of ‘pass-through’
of any change in the price of raw tomatoes to prepared and preserved tomatoes.29
In turn, the size of the pass-through depends on the relevant supply and demand
elasticities and the importance of the raw material cost of tomatoes in the overall costs for
prepared and preserved tomatoes. The report also took account of two other CAP
instruments that can potentially raise the price of tomatoes and thus offset some of the
subsidy effect of direct payments. One is the potential for Producer Organisations to
engage in cartel-like behaviour when bargaining over the price with processors. The other
is import regulations which limit the purchase of raw tomatoes from other countries.
Taking all these factors into consideration, the Barker report assessed that the impact of
the CAP subsidy on the price of prepared and preserved tomatoes was relatively small.
While the exact figure is redacted in the final report on confidentiality grounds, the Anti-
Dumping Commission notes that it considers the amount to be ‘insignificant’.
However, the Commission also took account of other ways of estimating the impact of
CAP subsidies on the final price of prepared or preserved tomatoes, including the model
used in the academic articles previously cited, and concluded there was a market situation
where the costs of raw tomatoes for the two Italian firms did not reflect a competitive
market price. “The Commission is satisfied that the totality of direct income support
payments made to growers of raw tomatoes in Italy have significantly affected the
prevailing market prices in Italy for raw tomatoes” (Anti-Dumping Commission, 2016).
As a result, when calculating the normal value of exports, it adjusted the cost price of raw
tomatoes to include the estimated value of the subsidy expressed on a per kg basis.30
Based on this procedure, it calculated the dumping margins noted at the outset and
recommended that anti-dumping duties at this level should be implemented to avoid injury
to the domestic industry.
Our conclusion is that CAP subsidies influenced the price of processing
tomatoes and the price of tomato products during the period of coupled
payments (Rickard and Sumner, 2008, 2011; Solazzo et al., 2014). These
coupled payments are now replaced by decoupled direct payments, though many
EU countries still maintain coupled support for processing tomatoes under the
VCS scheme. The Barker (2015) report highlighted that paying the decoupled
payment on the historic basis also meant that it could still be interpreted as a
coupled payment. Farmers will assume that their future payment will depend on
maintaining their current level of output and they will behave accordingly.
29 The Australian documents use the term ‘flow on’ but we prefer to use the term ‘pass-through’ for consistency
with the discussion of the Spanish ripe olives case in Part 1. 30 When this procedure was challenged by the exporting firms on the grounds that it did not allow for a less than
100% pass-through between the subsidy to tomato growers and the selling price of tomatoes, the Anti-Dumping
Commission argued that this was not relevant when calculating costs for the purposes of establishing a dumping
margin.

79
Italy continues to use the partial convergence model where payment entitlements
reflect historic levels of support. Coupled support, based on the evidence in
Rickard and Sumner (2011) stimulates production of tomatoes and lowers the
cost of raw material to the processors of tomato paste. However, Barker found
that on the economic evidence, taking account of the various factors that
influence the pass-through rate to the price of tomato paste, the impact on the
price of tomato paste was insignificant. These offsetting factors included the
power of Producer Organisations to influence contract prices through collective
bargaining as well as the limitations in importing tomatoes for the production of
tomato paste. Despite this economic evidence that CAP subsidies do not in
practice influence the price of exported canned tomatoes, the Australian Anti-
Dumping Commission using a different legal standard came to a different
conclusion. Thus the impact of CAP subsidies on the export price of tomato
products including tomato paste remains a matter of contention.
3.6 CAP subsidies are not a significant determinant of
tomato products exported to VDCs
The case study focused particularly on exports of tomato paste as these are of
most relevance to VDCs. Section 2.4.3 showed that these countries accounted
for half of all EU exports of tomato paste in the mid-2000s but that by 2018 this
share had fallen to 18%. Even in major markets in the past in West Africa, the
EU has been losing market share, mainly to China, and in none of these
countries for which data exists is the EU any longer the dominant supplier. This
could be due to the fact that, due to the reform of CAP subsidies to tomato
growers, the EU is no longer a low-cost producer of tomato paste. For example,
the Australian Anti-Dumping Commission accepted evidence that the contract
price agreed between the representative branches of Producer Organisations and
the processing industry in Italy is higher than what is paid in Australia to
growers of tomatoes for processing (Anti-Dumping Commission, 2016).
Tomatoes are a traditional crop in many regions in West Africa and are an
essential part of West African cuisine. There is evidence that local production
has suffered in competition with the cheaper imported tomato paste. Even if
CAP subsidies have encouraged EU exports, EU exports have been losing
market share to China which does not subsidise exports of tomato paste. What
then is driving these imports?
A significant factor is the difficulty of producing tomato paste economically and
efficiently in countries like those of West Africa. Despite an apparent abundance
of tomatoes at particular times of the year, local processing factories fail to be

80
profitable. While it is easy to point to imported competition as the cause of this,
local plants suffer from severe production inefficiencies which lead to high
costs. The process of creating tomato paste is capital and energy intensive.31
Factories need to run continuously to be efficient. This is difficult to achieve
when electricity supplies are unreliable and supplies are often scarce for much of
the year. The difficulties facing Ghana’s tomato processing industry in West
Africa may not be untypical (Robinson and Kolavalli, 2010b). Foreign
investment in local processing capacity could be attracted if these basic
infrastructural deficiencies were addressed (Robinson and Kolavalli, 2010a).32
In conclusion, CAP subsidies may still influence the price of exports of tomato
paste because of the existence of coupled support and the influence of the
historic model in influencing the level of payments to producers of processing
tomatoes in Italy, the main source of tomato paste exports. However, the EU is
no longer setting the import price in importing countries as it loses ground to
China. Cheap imports of tomato paste, increasingly from China, do create
competition for local producers. The solution lies in overcoming the
infrastructural deficiencies as well as the lack of policy support that make local
production unprofitable.
31 ‘Tomato paste processing’, Tomato Jos, 3 Sept 2014. 32 ‘Ghana’s Tomato Processing Industry: An Attractive Investment Option in 2016’, Wathi: Le Think Tank
Citoyen de L’Afrique de l’Ouest 22 August 2017.

81
Part 4 Conclusions: implications for the
current debate on CAP reform
There is no question that the VDCs need to foster and encourage their domestic
agricultural production and reduce their dependence on food imports, including
from the EU. Our case studies of milk powder, chicken meat and tomato paste
underscored the damage that lower-priced imports have caused to local
production of these products (milk, broiler production) or their raw material
inputs (tomatoes). The inability to compete with imported agricultural products
retards domestic agricultural growth and rural poverty reduction.
Still, the EU is one of a number of countries supplying imports of the case study
products to the VDCs. Furthermore, this report finds that the extent to which
CAP subsidies have influenced the price of selected EU exports to these markets
and have encouraged growth in these exports is limited but not negligible for
milk powders, non-existent for chicken meat, and not significant for tomato
paste.
Based on the findings of this study a number of suggestions for future CAP
support policy are proposed.
Greater disciplines on coupled support payments are needed.
Coupled support payments directly incentivise greater production of the
supported commodities (even if in the case of payments coupled to dairy cow
numbers the impact on total milk production may be in the opposite direction
because of an offsetting effect on milk yields per cow). Coupled payments may
be justified where it is necessary to support specific forms of production in
particular regions because of their special environmental or social contribution.
In the original legislative basis for these payments in 2013, there was a
quantitative restriction that the number of animals or hectares supported should
not exceed the highest level achieved in the previous five years. Although doubt
has been expressed about how effectively this limitation was policed, the
limitation was removed with retrospective effect by the co-legislature in an
amendment to the legislation in 2018. From the point of view of importing
VDCs, this support to EU producers is clearly an unfair subsidy. To reduce its
adverse effects, the quantitative limit in the 2013 legislation should be re-
introduced and the overall financial ceiling allowed to MSs to finance coupled
support payments should be reduced.

82
Ensure market management measures do not destabilise prices for
VDC producers.
Price and yield volatility is difficult for EU producers to manage but is even
more difficult for low-income producers in the VDCs who lack the reserves and
the capacity to withstand even short periods of relatively low prices. Price
instability has been particularly a feature of the dairy market where small
changes in export quantities up or down can lead to much larger price swings.
For this reason, the dairy market is one of the few EU markets where explicit
market intervention instruments have been retained (although crisis management
measures can be initiated by the European Commission for all commodities).
The principal instruments include buying-in policies to remove surplus product
from the market during periods of low prices (either public intervention or aids
for private storage) or supply management schemes, either voluntary or
mandatory, that seek to limit production below a previous period. In its legal
proposal suggesting amendments to the single CMO Regulation for the period
post 2020, the Commission did not propose major changes to the EU safety-net
system for farm commodities.
Storage schemes carry the risk that product in store is sold out of intervention at
prices lower than buying-in prices, which effectively turns the scheme from a
price stabilisation scheme into an income support scheme. It has been reported
that this has occurred with the disposal of stocks that built up in the 2015-2017
milk price crisis which would effectively be a breach of the EU’s commitment
not to resort to export subsidies. Intervention stocks held in store overhang the
market and also have a price-depressing effect, and when they are eventually
sold out of storage they also slow the recovery in prices. Therefore, from the
perspective of producers in VDCs, reducing EU milk production during periods
of low global prices rather than simply storing it would be a preferable outcome.
The AGRI Committee of the European Parliament in its report adopted just prior
to EP elections in May 2019 calls for additional tools to prevent and manage
market crises. While the proposed tools would be available to all commodities,
the suggestions are clearly aimed at the milk sector and build on proposals put
forward by the European Milk Board for a number of years. The intent of the
COMAGRI amendments is to break the production cycle through pre-emptive
action, rather than dealing with the consequences of over-production afterwards
through intervention storage or crisis payments to producers. It is an attractive
idea even if there would be significant technical challenges to its successful
implementation (European Committee of the Regions, 2016).

83
Internal convergence of direct payments should be completed.
The report highlights how the continued use of the partial convergence model of
decoupled direct payments has allowed anti-dumping authorities in importing
countries to claim that the EU’s decoupled payments continue to support
producers of specific products (e.g. ripe olives and processing tomatoes). This is
because, under this model, there is still a link between the per hectare payments
producers receive and the product-specific support they received in the early
2000s before decoupled payments were introduced. The EC in its 2013 CAP
reform proposals proposed that the historic model for direct payments should be
phased out in favour of the regional model whereby all farms in a particular
region receive an uniform payment (a proposal known as internal convergence
of payments, to distinguish it from proposals to equalise payments per hectare
across MSs, known as external convergence). However, the co-legislature
rejected this proposal and permitted the partial convergence model to continue
albeit with constraints. In its 2018 CAP reform proposal, the Commission has
proposed that MSs still using the partial convergence model should set a
maximum basic payment per hectare by 2026 and ensure that no payment is less
than 75% of the regional average by that date, but it has given up the idea of
requiring convergence to a uniform regional value per hectare. From the point of
view of importing VDCs, decoupled payments whose value is still determined
by the value of historic coupled payments in the past may be seen as unfair
competition. To reduce its adverse effects, the 2018 CAP reform should insist on
full convergence to uniform payments within a region by 2026 at the latest.
The use of decoupled payments for income support should be phased
out and replaced by payments explicitly linked to paying for public
goods.
Even after full internal convergence of decoupled payments they will remain a
very important component of EU farm incomes. This study finds that even
decoupled income support payments may have a direct production stimulus,
although its magnitude is likely to be small. Some farmers may also use these
payments to subsidise their farm enterprises which allows higher-cost farms to
remain in production. From the point of view of importing VDCs, these
payments can be seen as giving rise to unfair competition. In its budget proposal
for the coming Multi-annual Financial Framework, the Commission has
proposed to maintain the value of direct payments in nominal terms. However,
in addition to moves to better target these payments on small and medium-sized
farms through capping and degressivity and the mandatory use of a
redistributive payment, the Commission proposes that MSs must use a
proportion of their direct payments envelope to finance eco-schemes. These will
be voluntary schemes for farmers who wish to enrol to receive payments for

84
undertaking management commitments to improve environmental and climate
outcomes that go beyond the minimum mandatory standards. Importantly, eco-
scheme payments are not limited to reimbursing farmers for the costs incurred
and income foregone due to these management commitments. They can be paid
as a top-up on the per hectare basic payment and open the possibility of paying
farmers the value of ecosystem services that they provide. A criticism of the
Commission proposal is that it does not specify any minimum share of direct
payments spending to be allocated to eco-schemes, but neither does it specify a
maximum share. The more that decoupled payments for income support can be
converted into decoupled payments for the provision of ecosystem services and
public goods, the lower their potential trade-distorting effect for VDCs.
Create a platform for PCD dialogue on agri-food trade.
These changes in the basis for CAP payments to farmers would help to remove
the basis for suspicion that they contribute to unfair competition with producers
in VDCs. But in themselves they are unlikely to have more than a marginal
effect on the volume of EU exports to these countries. This is because CAP
subsidies are no longer the basis for the competitive position of EU exports in
these markets and removing them does not directly help to improve conditions
for domestic production in these countries. The recent Task Force Rural Africa
(TFRA) report (EC, 2019b) prepared for the EC saw value in both Africa and
the EU engaging in a continuous policy dialogue about different aspects of the
food industry. It specifically recommended to “set up multi-stakeholder dialogue
to scale up existing guidelines on responsible business conduct and investment;
and to tackle issues relating to food imports and foreign direct investment going
into African countries. Involve African stakeholders in PCD assessments and
make use of joint platforms where PCD issues can be raised”. It particularly
identified African food import problems as an issue for discussion and suggested
two fora to pursue this dialogue: the African Union-EU Agriculture Ministerial
Conferences and an EU agri-food industry dialogue on responsible trade and
investment with Africa. It also recommended that EU-Africa trade developments
in the agri-food sector be reviewed regularly, for instance by scientific analysis,
the EU market observatories, outlook conferences and stakeholder dialogue.
Concrete progress towards this dialogue should be part of the follow-up to the
TFRA report. The basis for this dialogue would be strengthened by making
explicit reference to Policy Coherence for Sustainable Development in the basic
CAP regulations as proposed by the European Parliament’s Committee for
Development in its Opinion on the Commission’s draft legislative proposals
(COMDEVE, 2019).

i
Annex I: List of vulnerable developing
countries
Country Sub-Saharan
Country
African, Caribbean
and Pacific Country
Least Developed
Country
1 Afghanistan
2 Angola
3 Antigua and Barbuda
4 Bahamas
5 Bangladesh
6 Barbados
7 Belize
8 Benin
9 Bhutan
10 Botswana
11 Burkina Faso
12 Burundi
13 Cabo Verde
14 Cameroon
15 Cambodia
16 Central African Republic
17 Chad
18 Comoros
19 Congo
20 Cook Islands
21 Côte d'Ivoire
22 Cuba
23 Democratic Republic of the Congo
24 Djibouti
25 Dominica
26 Dominican Republic
27 Equatorial Guinea
28 Eritrea
29 Ethiopia
30 Fiji
31 Gabon
32 Gambia
33 Ghana
34 Guinea
35 Guinea-Bissau
36 Guyana
37 Haiti
38 Jamaica
39 Kenya
40 Kiribati
41 Lao People's Democratic Republic
42 Lesotho
43 Liberia
44 Madagascar
45 Malawi
46 Mali

ii
47 Mauritania
48 Mauritius
49 Mayotte
50 Mozambique
51 Myanmar
52 Namibia
53 Nauru
54 Nepal
55 Niger
56 Nigeria
57 Niue
58 Palau
59 Papua New Guinea
60 Reunion
61 Rwanda
62 Saint Kitts and Nevis
63 Saint Lucia
64 São Tomé e Príncipe
65 Seychelles
66 Senegal
67 Sierra Leone
68 Solomon Islands
69 Somalia
70 South Africa
71 South Sudan
72 Sudan
73 Suriname
74 Swaziland
75 Tanzania
76 Timor-Leste
77 Togo
78 Tuvalu
79 Uganda
80 Vanuatu
81 Yemen
82 Zambia
83 Zimbabwe

iii
Annex II: References Anti-Dumping Commission. 2016. ‘Dumping of Prepared or Preserved Tomatoes Exported
from Italy by Feger Di Gerardo Ferraioli S.p.A. and La Doria S.p.A.’. Final Report
No. 276. Canberra: Australian Government.
Aprodev. 2007. ‘No More Chicken, Please: How a Strong Grassroots Movement in Cameroon
Is Successfully Resisting Damaging Chicken Imports from Europe, Which Are
Ruining Small Farmers All over West Africa’. Brussels: APRODEV.
Ayisi, N., and K. Adu. 2016. ‘Challenges and Future Prospects for Broiler Meat Consumption
in Ghana.’ Imperial Journal of Interdisciplinary Research 2 (8): 648–54.
Banson, K., G. Muthusamy, and E. Kondo. 2015. ‘The Import Substituted Poultry Industry;
Evidence from Ghana.’ International Journal of Agriculture and Forestry 5 (2): 166–
75.
Bardají, I., and A. Garrido, eds. 2016. ‘State of Play of Risk Management Tools Implemented
by Member States during the Period 2014--2020: National and European
Frameworks’. Brussels: European Parliament, Directorate General for Internal
Policies.
Barker, G. 2015. ‘Assessment of the Market Situation: Factors in Italy for Prepared or
Preserved Tomatoes’. Sydney: Law and Economics Consulting Associates Ltd
(LECA) For Australian Anti-Dumping Commission.
Bertholot, J. 2018. ‘All EU Agricultural Subsidies to Exported Products Can Be Sued for
Dumping’. SOL Alternatives Agroécologiques et Solidaires.
Blanco, M. 2018. ‘The Impact of the Common Agricultural Policy on Developing Countries’.
Brussels: European Parliament Directorate-General for External Affairs.
Borras Jr, S. M., P. Seufert, S. Backes, D. Fyfe, R. Herre, L. Michele, and E. Mills. 2016.
‘Land Grabbing and Human Rights: The Involvement of European Corporate and
Financial Entities in Land Grabbing Outside the European Union’. Brussels: European
Parliament Directorate-General for External Affairs.
Boysen, O., H. G. Jensen, and A. Matthews. 2016. ‘Impact of EU Agricultural Policy on
Developing Countries: A Uganda Case Study.’ The Journal of International Trade &
Economic Development 25 (3): 377–402.
Brot für die Welt. 2010. ‘Milk Dumping in Cameroon’. Stuttgart: Brot für die Welt.
Choplin, G. 2016. ‘L’Industrie Laitière Européenne - Lorgne Sur l’Afrique de l’Ouest’.
Brussels: Oxfam-Solidarité and SOS Faim Belgique.
———. 2019. ‘N’Exportons Pas Nos Problèmes’. Brussels: SOS Faim Belgique.
COMDEVE. 2019. ‘Opinion of the Committee on Development of the European Parliament
on the proposal for a regulation of the European Parliament and of the Council on
establishing rules on support for strategic plans to be drawn up by Member States
under the Common agricultural policy (CAP Strategic Plans) and financed by the
European Agricultural Guarantee Fund (EAGF) and by the European Agricultural
Fund for Rural Development (EAFRD) and repealing Regulation (EU) No 1305/2013
of the European Parliament and of the Council and Regulation (EU) No 1307/2013 of
the European Parliament and of the Council’.
Curtis, M. 2011. ‘Milking the Poor - How EU Subsidies Hurt Dairy Producers in
Bangladesh’. Copenhagen: ActionAid Denmark.
De Schutter, O. 2011. ‘The Common Agricultural Policy towards 2020: The Role of the
European Union in Supporting the Realization of the Right to Food’. Geneva: UN
High Commissioner for Human Rights.

iv
DG AGRI. 2013. ‘EU Beef Farms Report 2012 Based on FADN Data’. Brussels: European
Commission Directorate-General for Agriculture and Rural Development.
———. 2015. ‘Voluntary Coupled Support – Sectors Mostly Supported. Notification of
Decisions Taken by Member States by 1 August 2014’. Brussels: European
Commission Directorate-General for Agriculture and Rural Development.
———. 2016. ‘EU Cereal Farms Report Based on 2013 FADN Data’. Brussels: European
Commission Directorate-General for Agriculture and Rural Development.
———. 2017. ‘Voluntary Coupled Support: Notification of the Revised Decisions Taken by
Member States by 1 August 2016 ('the Review’)’. Informative Note. Brussels:
European Commission.
———. 2018a. ‘Direct Payments 2015-2020: Decisions Taken by Member States: State of
Play as from December 2018’. Information Note. Brussels: Directorate-General for
Agriculture and Rural Development.
———. 2018b. ‘EU Dairy Farms Report Based on 2016 FADN Data’. Brussels: European
Commission Directorate-General for Agriculture and Rural Development.
———. 2018c. ‘EU Agricultural Outlook for Markets and Income 2018-2030’. Brussels:
European Commission Directorate-General for Agriculture and Rural Development
———. 2018d. ‘Operating Subsidies (both Direct Payments and Rural Development except
Investment Support)’. Brussels: European Commission Directorate-General for
Agriculture and Rural Development.
DG ENV. 2013. ‘The Impact of EU Consumption on Deforestation: Comprehensive Analysis
of the Impact of EU Consumption on Deforestation’. Brussels: European Commission.
Dorémus-Mege, C., C. Gaurdard, D. Horman, B. Hermelin, and J.-J. Grodent. 2004. ‘Chicken
Exports: Europe Plucks Africa!’. Paris: Agir Ici and other development NGOs.
EMB. 2018. ‘What Is the Cost of Producing Milk? Results for 2017’, 2nd Edition. Brussels:
European Milk Board.
European Commission. 2018. ‘Impact Assessment Accompanying the Commission’s
Legislative Package on the Common Agricultural Policy Post 2020’. Staff Working
Document SWD/2018/301. Brussels.
———. 2019a. ‘2019 EU Report on Policy Coherence for Development’. SWD(2019) 20.
Brussels.
———. 2019b. ‘An Africa-Europe Agenda for Rural Transformation: Report by the Task
Force Rural Africa’. Brussels.
European Committee of the Regions. 2016. ‘Evaluation of the market responsibility
programme put forward by the European Milk Board taking 2014 as a test year’.
Report written by Matthews, A. and R.Soldi. doi:10.2863/185270.
European Parliament. 2018. ‘Resolution of 15 March 2018 on US Measures on EU Farm
Support under the CAP (in the Context of Spanish Olives)’. P8_TA(2018)0091.
Brussels.
Fritz, T. 2011. ‘Globalising Hunger: Food Security and the EU’s Common Agricultural
Policy (CAP)’. Berlin: Transnational Institute, FDCL-Verlag.
Garrido, A., M. Bielza, and J. Sumpsi. 2003. ‘The Impact of Crop Insurance Subsidies on
Land Allocation and Production in Spain’. OECD Papers 420 (5): 11.
Gasperin, C., and I. Doporto Miguez. 2009. ‘Green Box Subsidies and Trade-Distorting
Support: Is There a Cumulative Impact?’ In Agricultural Subsidies in the WTO Green
Box, edited by R. Melendez Ortiz, C. Bellmann, and J. Hepburn. Cambridge, U.K.:
Cambridge University Press.
GIZ. 2018. ‘Poultry Production in Cameroon: How the Import Restriction Affects the
Cameroonian Poultry Sector’. Bonn: Deutsche Gesellschaft für Internationale
Zusammenarbeit (GIZ) GmbH.

v
Goodison, P. 2015. ‘The Impact of EU Poultry Sector Policies on Sub-Saharan African
Countries’. Copenhagen: Initiativet for Handel og Udvikling.
———. 2018. ‘EU Poultry Exports to South Africa In the Face of Avian Influenza
Based Export Restrictions.’ EPA Monitoring. October 11, 2018.
Horne, P. van. 2017. ‘Competitiveness of the EU Poultry Meat Sector, Base Year 2015:
International Comparison of Production Costs’. Report 2007-15. Wageningen:
Wageningen Economic Research.
ITAC. 2015. ‘Investigation into the Alleged Dumping of Frozen Bone-in Portions of Fowls of
the Species Gallus Domesticus, Originating in or Imported from Germany, the
Netherlands and the United Kingdom: Final Determination’. Report No. 492. Pretoria:
International Trade Administration Commission.
Josling, T., K. Anderson, A. Schmitz, and S. Tangermann. 2010. ‘Understanding International
Trade in Agricultural Products: One Hundred Years of Contributions by Agricultural
Economists.’ American Journal of Agricultural Economics 92 (2): 424–446.
Kusi, L., S. Agbeblewu, I. Anim, and K. Nyarku. 2015. ‘The Challenges and Prospects of the
Commercial Poultry Industry in Ghana: A Synthesis of Literature.’ International
Journal of Management Sciences 5 (6): 476–89.
Lanje, K., A. Müller-Frank, T. Reichert, and B. Thomsen. 2009. ‘Consequences of the EU
Trade and Agriculture Policy for Zambia’s Dairy Farmers’. Bonn: GermanWatch e.V.
Massow, V. von. 1984. ‘Dairy Imports into Sub-Saharan Africa: Development and Policies’.
LPU Working Paper No. 4. Addis Ababa: International Livestock Centre for Africa.
———. 1989. ‘Dairy Imports into Sub-Saharan Africa: Problems, Policies and Prospects’.
ILCA Research Report No. 17. Addis Ababa: International Livestock Centre for
Africa.
Matthews, A. 1985. ‘The Common Agricultural Policy and the Less Developed Countries’.
Dublin: Gill and Macmillan.
———. 2017. The Development-Related Impacts of EU Agricultural Subsidies. TEP
Working Paper No. 1617. Dublin: Trinity College Dublin.
Matthews, A., L. Salvatici, and M. Scoppola. 2016. ‘Trade Impacts of the Common
Agricultural Policy’. IATRC Commissioned Paper 19. Minneapolis: International
Agricultural Trade Research Consortium.
M'Barek, R., Barreiro-Hurle, J., Boulanger, P., Caivano, A., Ciaian, P., Dudu, H., Espinosa,
M., Fellmann, T., Ferrari, E., Gomez y Paloma, S., Gorrin Gonzalez, C., Himics, M.,
Louhichi, K., Perni, A., Philippidis, G., Salputra, G., Witzke, P., and Genovese, G.
2017. ‘SCENAR 2030 - Pathways for the European Agriculture and Food Sector
beyond 2020’. EUR 28797 EN. Luxembourg: Publications Office of the European
Union.
Meijerink, G., and T. Achterbosch. 2013. ‘CAP and EU Trade Policy Reform: Assessing
Impact on Developing Countries’. LEI Report 2013-023. The Hague: LEI
Wageningen UR.
Mittenzwei, K., W. Britz, and C. Wieck. 2012. ‘Studying the Effects of Domestic Support
Provisions on Global Agricultural Trade: WTO and OECD Policy Indicators in the
CAPRI Model’.
Moro, D., and P. Sckokai. 2013. ‘The Impact of Decoupled Payments on Farm Choices:
Conceptual and Methodological Challenges.’ Food Policy 41: 28–38.
Netherlands Embassy. 2014. ‘Analysis Poultry Sector Ghana: An Inquiry of Opportunities
and Challenges’. Accra: Embassy of the Kingdom of the Netherlands.
OECD. 2001. ‘Decoupling: A Conceptual Overview’. Paris: Organisation for Economic
Cooperation and Development.

vi
———. 2011. ‘Managing Risk in Agriculture Policy Assessment and Design’. Paris: OECD
Publishing.
OECD/FAO. 2018. ‘OECD‑FAO Agricultural Outlook 2018‑2027’. Paris and Rome: OECD
Publishing and FAO.
Oxfam. 2002. ‘Stop the Dumping! How EU Agricultural Subsidies Are Damaging
Livelihoods in the Developing World’. Briefing Paper 31. Brussels: Oxfam
International.
Oxfam Deutschland. 2009. ‘Dumping von Milch Durch Deutschland Und Die Europäische
Union’.
Oxfam International. 2018. ‘Taking a Fresh Approach: Enabling Local Producers to Meet
Rising Demand in West Africa’s Dairy Sector’. Cowley, Oxford: Oxfam GB.
Paasch, A. 2008. ‘Devastating Floods Man-Made: European Trade Policy Violates Right to
Food in Ghana – Chicken and Tomatoes’. Bonn: GermanWatch e.V.
Pendrill, F., U. Martin Persson, J. Godar, T. Kastner, D. Moran, S. Schmidt, and R. Wood.
2019. ‘Agricultural and Forestry Trade Drives Large Share of Tropical Deforestation
Emissions.’ Global Environmental Change 56 (May): 1–10.
https://doi.org/10.1016/j.gloenvcha.2019.03.002.
Rickard, B., and D. Sumner. 2008. ‘Domestic Support and Border Measures for Processed
Horticultural Products.’ American Journal of Agricultural Economics 90 (1): 55–68.
———. 2011. ‘Was There Policy “Reform”? Evolution of EU Domestic Support for
Processed Fruits and Vegetables.’ Food Policy 36: 438–49.
Robinson, E., and S. Kolavalli. 2010a. ‘The Case of Tomato in Ghana: Institutional Support’.
Ghana Strategy Support Programme (GSSP) Working Paper #22. Washington, D.C.:
International Food Policy Research Institute.
———. 2010b. ‘The Case of Tomato in Ghana: Processing’. Ghana Strategy Support
Programme (GSSP) Working Paper #21. Washington, D.C.: International Food Policy
Research Institute.
Rude, J. 2008. ‘Production Effects of the European Union’s Single Farm Payment.’ Canadian
Journal of Agricultural Economics/Revue Canadienne d’agroeconomie 56 (4): 457–
471.
Rudloff, B. and E. Schmieg. 2016. ‘More bones to pick with the EU? Controversial Poultry
Exports to Africa: Sustainable Trade Policy as a Task for the G20’, SWP Comments
57, Berlin: Stiftung Wissenschaft und Politik/German Institute for International and
Security Affairs.
Salla, A. 2017. ‘Review of the Livestock/Meat and Milk Value Chains and Policy Influencing
Them in West Africa’. Rome: FAO and ECOWAS.
Schroeder, L. A., A. Gocht, and W. Britz. 2015. ‘The Impact of Pillar II Funding: Validation
from a Modelling and Evaluation Perspective.’ Journal of Agricultural Economics 66
(2): 415–41.
Schutter, O. de. 2011. ‘The Common Agricultural Policy towards 2020: The Role of the
European Union in Supporting the Realization of the Right to Food’. Comments and
Recommendations by the United Nations Special Rapporteur on the Right to Food.
Geneva: United Nations Special Rapporteur on the Right to Food.
Smit, B., R. Jongeneel, H. Prins, J. Jager, and W. Hennen. 2017. ‘Impact of Coupled EU
Support for Sugar Beet Growing: More Production, Lower Prices’. Report 2017-114.
Wageningen: Wageningen Economic Research.
Solazzo, R., M. Donati, F. Arfini, and G. Petriccione. 2014. ‘A PMP Model for the Impact
Assessment of the Common Agricultural Policy Reform 2014-2020 on the Italian
Tomato Sector.’ New Medit, no. 2: 9–19.

vii
Sumberg, J., M. Awo, and G. Kwadzo. 2017. ‘Poultry and Policy in Ghana: Lessons from the
Periphery of an Agricultural Policy System.’ Development Policy Review 35 (3): 419–
38.
Swinbank, A., and R. Tranter. 2005. ‘Decoupling EU Farm Support-Does the New Single
Payment Scheme Fit within the Green Box.’ The Estey Centre Journal of International
Law and Trade Policy 6 (1): 47–61.
Swinnen, J. 2011. ‘The Right Price of Food.’ Development Policy Review 29 (6): 667–688.
Tangermann, S. 2011. ‘Market and Trade Implications of Risk Management Policies in
Agriculture: The Case of the EU’s Common Agricultural Policy’. ICTSD Programme
on Agricultural Trade and Sustainable Development. Issue Paper No. 34. Geneva:
International Centre for Sustainable Trade and Development.
USDA. 2017. ‘2017 Ghana Poultry Report Annual’. GAIN Report. Washington, D.C.: US
Department of Agriculture, Foreign Agricultural Service.
———. 2018. ‘South Africa Extends Safeguard Duty on EU Bone-in Broiler Meat’. GAIN
Report. Washington, D.C.: US Department of Agriculture, Foreign Agricultural
Service.
US Department of Commerce. 2018. ‘Ripe Olives From Spain: Final Affirmative
Countervailing Duty Determination.’ Federal Register 83 (117): 28186–89.
USITC. 2018. ‘Ripe Olives from Spain’. Publication 4805. Washington, D.C.: US
International Trade Commission.
WTO. 2019a. ‘DS577 United States – Anti-Dumping and Countervailing Duties on Ripe
Olives from Spain.’ 2019.
———. 2019b. ‘United States – Anti-Dumping and Countervailing Duties on Ripe Olives
from Spain: Request for Consultations by the European Union’. WT/DS577/1.
Geneva: World Trade Organization.

EN
QG-03-19-654-EN-N
ISBN 978-92-895-1025-7doi:10.2863/81237
Created in 1994 following the signing of the Maastricht Treaty, the European Committee of the Regions is the EU's assembly of 350 regional and
local representatives from all 28 Member States, representing over 507 million Europeans.
Rue Belliard/Belliardstraat 101 | 1040 Bruxelles/Brussel | BELGIQUE/BELGIË | Tel. +32 22822211www.cor.europa.eu | @EU_CoR | /european.committee.of.the.regions
/european-committee-of-the-regions