Evaluation of the Aquifer Hydraulic Characteristics from … · Figure 1 shows the location map of...
8
International Journal of Modern Engineering Research (IJMER) www.ijmer.com Vol. 2, Issue. 5, Sep.-Oct. 2012 pp-3237-3244 ISSN: 2249-6645 www.ijmer.com 3237 | Page Ikechukwu Boniface Ijeh Department of Physics, College of Natural and Applied Sciences, Michael Okpara University of Agriculture, Umudike. PMB 7267, Umuahia, Abia State, Nigeria. ABSTRACT: Thirty two vertical electrical sounding data sets were obtained from various parts of the study area, located within latitudes 5 o 30''N and 5 o 45''N, and longitudes 7 o 00''E and 7 o 30''E, in the middle Imo River Basin. The litho- stratigraphic unit of Ogwashi-Asaba Formation was investigated. The sounding data were analyzed with the RESIST software to delineate the sub-surface layering. Three soundings were made at existing boreholes for comparison. The concept of Da-Zarrouk parameters (transverse unit resistance and longitudinal conductance in porous media) was used to determine aquifer hydraulic characteristics. The following values of hydraulic conductivity and transmissivity were obtained for the formation: K mean = 6.71m/day; T mean =327.91m 2 /day; K max =19.71m/day; T max =2906.52m 2 /day; K min =1.13m/day; T min = 8.01m 2 /day. The aquifer thicknesses range from 18m to 148m for the Formation. It was established from the study that thick productive aquifers are located in the Ogwashi-Asaba Formation. Keywords: Imo River Basin, Da-Zarrouk parameters, Aquifer hydraulic characteristics. I. Introduction Determination of aquifer characteristics is essential to the solution of several hydrological and hydrogeological problems. Fluid transmissivity, transverse resistance, longitudinal conductance, hydraulic conductivity and aquifer depth are very useful in describing subsurface hydrology. Much geophysical investigation of groundwater is directed towards the determination of the spatial distribution of the above mentioned aquifer hydraulic parameter (Mendosa et al., 2003). Aquifer characteristics calculated from existing boreholes are usually correlated with surface resistivity measurements based on their relationship with pore space and heterogeineity (Rubin and Hubbard, 2005; De Lima et al., 2005; Niwas et al., 2006). The Imo River Basin is based on a bedrock of a sequence of sedimentary rocks of about 5480m thick and with ages ranging from Upper Cretaceous to Recent (Uma, 1989). It is known to contain several aquiferous units. The characteristics of these aquifers such as transmissivity, hydraulic conductivity and storage potentials are not clearly understood. Since the mid 1980’s, some researchers from the academia have carried out geological/geochemical investigations. Uma (1989) carried out a study on the groundwater resources of the Imo River Basin using hydro-geological data from existing boreholes. He concluded that three aquifer systems (shallow, middle and deep) exist in the area. His data were, however too sparse to make any general statement on the hydraulic characteristics of the middle Imo River Basin aquifers. Geophysical investigations on groundwater resources in the Imo River Basin were also carried out in different sections of the basin. While the contributions made by these workers are remarkable, more work still needs to be done, particularly in the area of geophysical studies, which so far have covered only a small fraction of the area of the basin. The present study is aimed at the estimation of geometry, hydraulic conductivity and transmissivity of the aquifers within the Ameki and Imo shale Formations of the Imo River Basin using the electrical resistivity method. Thirty vertical two electrical soundings (VES) were obtained at various locations within the study area. 1.1 The Study Area Figure 1 shows the location map of the Imo River Basin where the study area is situated. The study area (Figure 2) lies between latitudes 5 o 30 ′ N and 5 o 45 ′ and longitudes 7 o 00 ′ and 7 o 30 ′ . Some major communities within the study area include: Amarauku, Atta, Ikeduru, Nnarambia, Umuahia, Ogbe, Obowo and Nkwerre. The Ogwashi-Asaba formation (Oligocene to Miocene) consists in the Coastal Plain Sand which is composed of non-indurated sediments. It is generally made up of clays, sands, grits and seams of lignite alternating with gritty clay (Dessauvagie, 1972).This formation is characterized by its up dip and down dip pinch outs within the Imo River Basin. The Imo River Basin has a large amount of recharge; estimated at 2.5 billion m 3 per annum, coming mainly from direct infiltration of precipitation. Average annual rainfall is about 2000mm (Onwuegbuche, 1993). Evaluation of the Aquifer Hydraulic Characteristics from Electrical Sounding Data in Imo River Basin, South Eastern Nigeria: the Case of Ogwashi- Asaba Formation.
Transcript of Evaluation of the Aquifer Hydraulic Characteristics from … · Figure 1 shows the location map of...

International Journal of Modern Engineering Research (IJMER)
www.ijmer.com Vol. 2, Issue. 5, Sep.-Oct. 2012 pp-3237-3244 ISSN: 2249-6645
www.ijmer.com 3237 | Page
Ikechukwu Boniface Ijeh Department of Physics, College of Natural and Applied Sciences, Michael Okpara University of Agriculture, Umudike. PMB
7267, Umuahia, Abia State, Nigeria.
ABSTRACT: Thirty two vertical electrical sounding data sets were obtained from various parts of the study area, located
within latitudes 5o 30''N and 5o 45''N, and longitudes 7o 00''E and 7o 30''E, in the middle Imo River Basin. The litho-
stratigraphic unit of Ogwashi-Asaba Formation was investigated. The sounding data were analyzed with the RESIST
software to delineate the sub-surface layering. Three soundings were made at existing boreholes for comparison. The
concept of Da-Zarrouk parameters (transverse unit resistance and longitudinal conductance in porous media) was used to determine aquifer hydraulic characteristics. The following values of hydraulic conductivity and transmissivity were obtained
for the formation: Kmean= 6.71m/day; Tmean=327.91m2/day; Kmax=19.71m/day; Tmax=2906.52m2/day; Kmin=1.13m/day; Tmin=
8.01m2/day. The aquifer thicknesses range from 18m to 148m for the Formation. It was established from the study that thick
productive aquifers are located in the Ogwashi-Asaba Formation.
Keywords: Imo River Basin, Da-Zarrouk parameters, Aquifer hydraulic characteristics.
I. Introduction Determination of aquifer characteristics is essential to the solution of several hydrological and hydrogeological problems.
Fluid transmissivity, transverse resistance, longitudinal conductance, hydraulic conductivity and aquifer depth are very
useful in describing subsurface hydrology. Much geophysical investigation of groundwater is directed towards the
determination of the spatial distribution of the above mentioned aquifer hydraulic parameter (Mendosa et al., 2003). Aquifer
characteristics calculated from existing boreholes are usually correlated with surface resistivity measurements based on their
relationship with pore space and heterogeineity (Rubin and Hubbard, 2005; De Lima et al., 2005; Niwas et al., 2006).
The Imo River Basin is based on a bedrock of a sequence of sedimentary rocks of about 5480m thick and with ages ranging
from Upper Cretaceous to Recent (Uma, 1989). It is known to contain several aquiferous units. The characteristics of these
aquifers such as transmissivity, hydraulic conductivity and storage potentials are not clearly understood. Since the mid
1980’s, some researchers from the academia have carried out geological/geochemical investigations. Uma (1989) carried out a study on the groundwater resources of the Imo River Basin using hydro-geological data from existing boreholes. He
concluded that three aquifer systems (shallow, middle and deep) exist in the area. His data were, however too sparse to make
any general statement on the hydraulic characteristics of the middle Imo River Basin aquifers. Geophysical investigations on
groundwater resources in the Imo River Basin were also carried out in different sections of the basin. While the contributions
made by these workers are remarkable, more work still needs to be done, particularly in the area of geophysical studies,
which so far have covered only a small fraction of the area of the basin. The present study is aimed at the estimation of
geometry, hydraulic conductivity and transmissivity of the aquifers within the Ameki and Imo shale Formations of the Imo
River Basin using the electrical resistivity method. Thirty vertical two electrical soundings (VES) were obtained at various
locations within the study area.
1.1 The Study Area
Figure 1 shows the location map of the Imo River Basin where the study area is situated. The study area (Figure 2) lies between latitudes 5o30′N and 5o45′ and longitudes 7o00′ and 7o30′. Some major communities within the study area
include: Amarauku, Atta, Ikeduru, Nnarambia, Umuahia, Ogbe, Obowo and Nkwerre. The Ogwashi-Asaba formation
(Oligocene to Miocene) consists in the Coastal Plain Sand which is composed of non-indurated sediments. It is generally
made up of clays, sands, grits and seams of lignite alternating with gritty clay (Dessauvagie, 1972).This formation is
characterized by its up dip and down dip pinch outs within the Imo River Basin. The Imo River Basin has a large amount of
recharge; estimated at 2.5 billion m3 per annum, coming mainly from direct infiltration of precipitation. Average annual
rainfall is about 2000mm (Onwuegbuche, 1993).
Evaluation of the Aquifer Hydraulic Characteristics from
Electrical Sounding Data in Imo River Basin, South Eastern
Nigeria: the Case of Ogwashi- Asaba Formation.

International Journal of Modern Engineering Research (IJMER)
www.ijmer.com Vol. 2, Issue. 5, Sep.-Oct. 2012 pp-3237-3244 ISSN: 2249-6645
www.ijmer.com 3238 | Page
Figure 2: Geology Map of the Study Area Showing VES locations

International Journal of Modern Engineering Research (IJMER)
www.ijmer.com Vol. 2, Issue. 5, Sep.-Oct. 2012 pp-3237-3244 ISSN: 2249-6645
www.ijmer.com 3239 | Page
II. Methodology Geoelectric resistivity method has been used extensively for structural, hydrological, geothermal investigations ( Majumdar and Das, 2011). Geoelectrical investigations were employed to delineate formations, distinguish between sandy, shale, clay,
and other layers and establish the depth to the water table, and determine the nature of the overburden. Schlumberger
resistivity sounding method was used in this research. Thirty two vertical electrical soundings were carried out to establish
the characteristics of the aquifers in the study area. Modeling of VES results was done using the RESIST software, which is
an iterative inversion-modeling program. Analysis of the resulting apparent resistivity versus the half-current electrode
separations yielded layered earth models composed of individual layers of specified thickness and apparent resistivity. The
ABEM Terrameter SAS 4000, was used to obtain VES data from the field. The VES locations are shown in figure 2 coded
KS.
2.1 Aquifer Hydraulic Characteristics from Vertical Electrical Sounding Data The primary purpose of the resistivity method is to measure the potential differences on the surface due to the
current flow within the ground. Since the mechanisms which control the fluid flow and electric current and conduction are
generally governed by the same physical parameters and lithological attributes, the hydraulic and electric conductivities are
dependent on each other .
To obtain a layer parameter, a unit square cross sectional area is cut out of a group of n-layers of infinite lateral
extent. The total transverse resistance R is given by:
𝑅 = ℎ𝑖 𝑛𝑖=1 𝜌𝑖 (1)
For a horizontal, homogeneous and isotropic medium
𝜌 = 𝑅1 − 𝑅2 / ℎ𝑖 − ℎ2 (2) where hi and ρi are respectively the thickness and resistivity of the ith layer in the section. The total longitudinal conductance
S is:
𝑆 = ℎ𝑖
𝜌 𝑖
𝑛𝑖=1 (3)
The longitudinal layer conductance Si can also be expressed by
Si = σi hi (4)
where σi is the layer conductivity. Conductivity in this case is analogous to the layer transmissivity, T, given by:
T = Ki hi (5)
Ki is the hydraulic conductivity of the ith layer of thickness hi. R and S of equations 1 and 3 are called the Dar Zarrouk
parameters, which have been shown to be powerful interpretational aids in groundwater surveys (Zohdy et al, 1974)
According to the fundamental Darcy’s law, the fluid discharge, Q, is given by
Q = KIA (6)
Where K is the hydraulic conductivity, I is the hydraulic gradient, A is the cross-sectional area perpendicular to the direction
of flow. Ohm’s law gives: j = σ E (7)
where j is the current density; and σ is the electrical conductivity, which is the reciprocal of the resistivity, ρ. For aquifer
material having unit cross-sectional and thickness h, the two fundamental laws can be combined to give, according to
Niswass & Singhal (1981):
T = K σ R = K S/ σ = K h (8)
Where T is the transmissivity; R is the transverse resistance of the aquifer, K is the hydraulic conductivity and S is the
longitudinal conductance.
It has also been shown by Niwas and Singhal (1981) that in areas of similar geologic setting and water quality the
product Kσ remains fairly constant. Thus, knowledge of K from some existing boreholes and of σ from VES sounding can be
used to estimate Kσ for the same geologic zone. Hence, the aquifer hydraulic conductivity and transmissivity for the entire
area can be estimated. This relationship forms the basis for the determination of aquifer hydraulic parameters used in this study.
III. Results and Discussion
3.1 Aquifer Characterization of the Study Area
The various aquifer characteristics within the study area are shown in Table 1. In order to reveal the geologic sections in
different parts of the study area, a profile, BB′, was selected as shown in figure 2, which traverses Ibeme (KS50), Umueze
(KS42), Obohia (KS37) in Ogwashi-Asaba Formation. The section shows the presence of sands and sandstone, figure 3.
There is a correlation between the VES result and the lithologs of boreholes drilled at locations KS32 (Avutu Obowo), KS37 (Nkwo Obohia) and KS42(Umueze) in Figure 4. They both show fine-medium and coarse-grained sand. They indicate the
presence of productive aquifers in the area. According to the geology of the area, the formation is made up of clays, sands,
sandstones. KS37 at Nkwo Obohia features the most productive aquifer system discovered in the study, with saturated
thickness of 147m, consisting of thick sandstones. Depth to the water table across the study area was deduced from the VES
result. The mean depth to the water table of the aquifers in this zone is 60.57m. The depth to the water table at KS37 is quite

International Journal of Modern Engineering Research (IJMER)
www.ijmer.com Vol. 2, Issue. 5, Sep.-Oct. 2012 pp-3237-3244 ISSN: 2249-6645
www.ijmer.com 3240 | Page
small at 2.5m which obviously confirms the shallow unconfined aquifer system reported for the area in literature (Uma,
1989).
International Journal of Modern Engineering Research (IJMER)
www.ijmer.com Vol. 2, Issue. 5, Sep.-Oct. 2012 pp-3237-3244 ISSN: 2249-6645
www.ijmer.com 3241 | Page
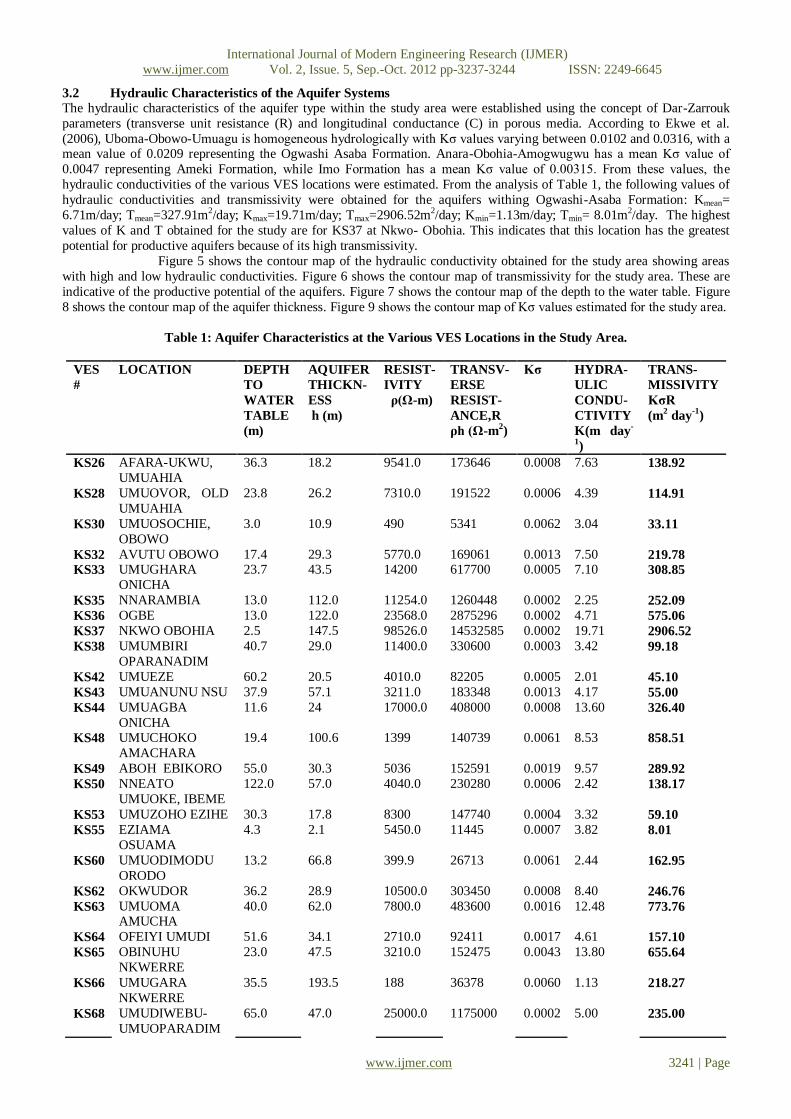
3.2 Hydraulic Characteristics of the Aquifer Systems
The hydraulic characteristics of the aquifer type within the study area were established using the concept of Dar-Zarrouk
parameters (transverse unit resistance (R) and longitudinal conductance (C) in porous media. According to Ekwe et al.
(2006), Uboma-Obowo-Umuagu is homogeneous hydrologically with Kσ values varying between 0.0102 and 0.0316, with a mean value of 0.0209 representing the Ogwashi Asaba Formation. Anara-Obohia-Amogwugwu has a mean Kσ value of
0.0047 representing Ameki Formation, while Imo Formation has a mean Kσ value of 0.00315. From these values, the
hydraulic conductivities of the various VES locations were estimated. From the analysis of Table 1, the following values of
hydraulic conductivities and transmissivity were obtained for the aquifers withing Ogwashi-Asaba Formation: Kmean=
6.71m/day; Tmean=327.91m2/day; Kmax=19.71m/day; Tmax=2906.52m2/day; Kmin=1.13m/day; Tmin= 8.01m2/day. The highest
values of K and T obtained for the study are for KS37 at Nkwo- Obohia. This indicates that this location has the greatest
potential for productive aquifers because of its high transmissivity.
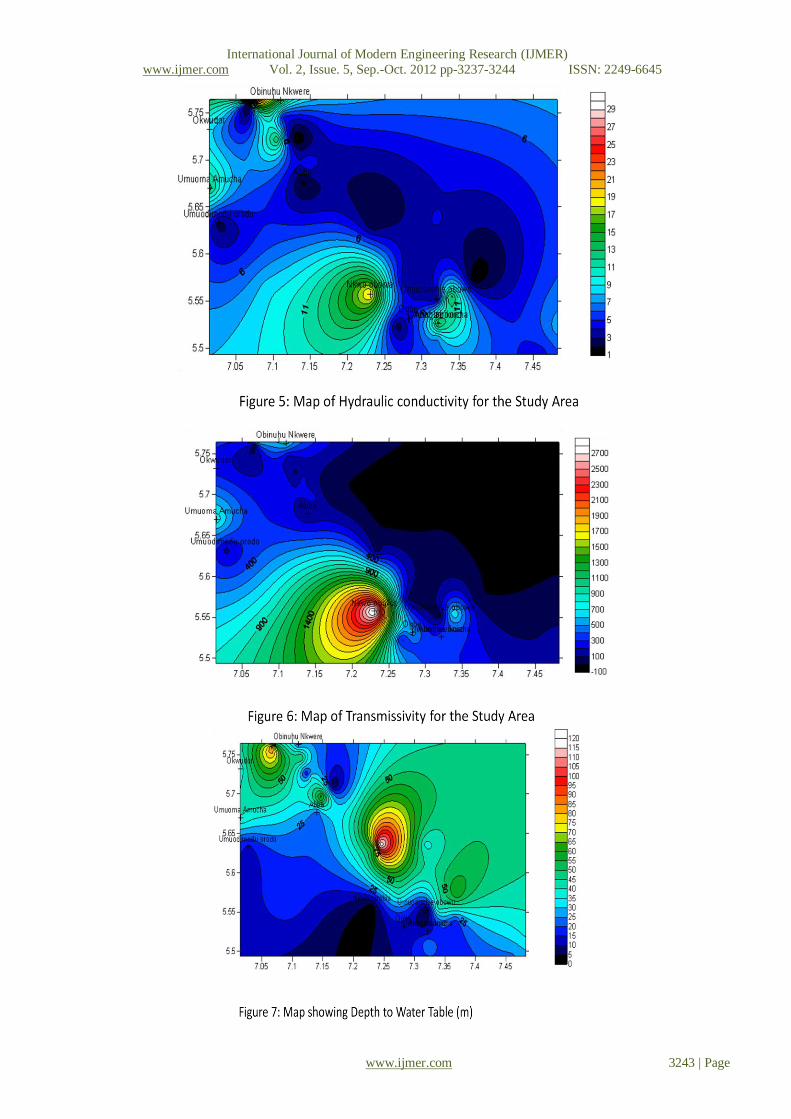
Figure 5 shows the contour map of the hydraulic conductivity obtained for the study area showing areas
with high and low hydraulic conductivities. Figure 6 shows the contour map of transmissivity for the study area. These are
indicative of the productive potential of the aquifers. Figure 7 shows the contour map of the depth to the water table. Figure
8 shows the contour map of the aquifer thickness. Figure 9 shows the contour map of Kσ values estimated for the study area.
Table 1: Aquifer Characteristics at the Various VES Locations in the Study Area.
VES
#
LOCATION DEPTH
TO
WATER
TABLE
(m)
AQUIFER
THICKN-
ESS
h (m)
RESIST-
IVITY
ρ(Ω-m)
TRANSV-
ERSE
RESIST-
ANCE,R
ρh (Ω-m2)
Kσ HYDRA-
ULIC
CONDU-
CTIVITY
K(m day-
1)
TRANS-
MISSIVITY
KσR
(m2 day
-1)
KS26 AFARA-UKWU,
UMUAHIA
36.3 18.2 9541.0 173646 0.0008 7.63 138.92
KS28 UMUOVOR, OLD
UMUAHIA
23.8 26.2 7310.0 191522 0.0006 4.39 114.91
KS30 UMUOSOCHIE,
OBOWO
3.0 10.9 490 5341 0.0062 3.04 33.11
KS32 AVUTU OBOWO 17.4 29.3 5770.0 169061 0.0013 7.50 219.78
KS33 UMUGHARA
ONICHA
23.7 43.5 14200 617700 0.0005 7.10 308.85
KS35 NNARAMBIA 13.0 112.0 11254.0 1260448 0.0002 2.25 252.09
KS36 OGBE 13.0 122.0 23568.0 2875296 0.0002 4.71 575.06
KS37 NKWO OBOHIA 2.5 147.5 98526.0 14532585 0.0002 19.71 2906.52
KS38 UMUMBIRI
OPARANADIM
40.7 29.0 11400.0 330600 0.0003 3.42 99.18
KS42 UMUEZE 60.2 20.5 4010.0 82205 0.0005 2.01 45.10
KS43 UMUANUNU NSU 37.9 57.1 3211.0 183348 0.0013 4.17 55.00
KS44 UMUAGBA
ONICHA
11.6 24 17000.0 408000 0.0008 13.60 326.40
KS48 UMUCHOKO
AMACHARA
19.4 100.6 1399 140739 0.0061 8.53 858.51
KS49 ABOH EBIKORO 55.0 30.3 5036 152591 0.0019 9.57 289.92
KS50 NNEATO
UMUOKE, IBEME
122.0 57.0 4040.0 230280 0.0006 2.42 138.17
KS53 UMUZOHO EZIHE 30.3 17.8 8300 147740 0.0004 3.32 59.10
KS55 EZIAMA
OSUAMA
4.3 2.1 5450.0 11445 0.0007 3.82 8.01
KS60 UMUODIMODU
ORODO
13.2 66.8 399.9 26713 0.0061 2.44 162.95
KS62 OKWUDOR 36.2 28.9 10500.0 303450 0.0008 8.40 246.76
KS63 UMUOMA AMUCHA
40.0 62.0 7800.0 483600 0.0016 12.48 773.76
KS64 OFEIYI UMUDI 51.6 34.1 2710.0 92411 0.0017 4.61 157.10
KS65 OBINUHU
NKWERRE
23.0 47.5 3210.0 152475 0.0043 13.80 655.64
KS66 UMUGARA
NKWERRE
35.5 193.5 188 36378 0.0060 1.13 218.27
KS68 UMUDIWEBU-
UMUOPARADIM
65.0 47.0 25000.0 1175000 0.0002 5.00 235.00
GROUND SURFACE
LEGEND
TOP SOIL
CLAY
SAND
SHALE
SANDY SHALE
SAND STONE
SILT
DRY SAND/SAND
DRY SAND/SAND STONE
CLAYEY SAND
SILTY SAND
CLAYEY SHALE
SAND/SANDSTONE

International Journal of Modern Engineering Research (IJMER)
www.ijmer.com Vol. 2, Issue. 5, Sep.-Oct. 2012 pp-3237-3244 ISSN: 2249-6645
www.ijmer.com 3242 | Page
KS69 ABBA 21.7 73.3 2800.0 205240 0.0005 1.68 102.62
KS70 UMUANYA-AMAIGBO
14.9 24.4 2400 58560 0.0013 3.12 76.13
KS71 UMULEKE-
AMAIGBO
36.6 19.3 10200.0 196860 0.0013 13.26 255.92
KS74 AVUTU-OBOWO 58.0 21.0 1200.0 25200 0.0013 1.56 32.76
KS75 UMUARIAM 42.0 53.0 8608.2 456235 0.0016 13.77 729.96
KS77 AFOR UMUOKEH 59.4 31.6 3570.0 112812 0.0004 1.43 45.12
KS86 UMUDIMOHA-
AMAIKE
88.4 49.6 6590.0 326864 0.0002 1.32 65.37
KS89 UMUEZE-AMIKE
ORLU
41.3 21.1 10800.0 227880 0.0030 32.40 683.60
IV. Conclusion
The diagnostic features of the Kσ product proved useful in the study. It was used to estimate the hydraulic conductivity and
the transmissivity for the sounding locations across the study area. The hydraulic conductivity varies between 1.13m/day
(KS66) and 19.71 m/day (KS37).The highest transmissivity value was obtained at Nkwo Obohia in Mbaise area, along
profile BB′, with 2906.52 m2/day. The aquifer there consists of thick coarse sands and sandstones with a thickness of 122m.
Acknowledgements The authors wish to acknowledge with gratitude the Anambra-Imo River Basin Authority, the Imo State Rural Water Supply
Agency, and UNICEF Owerri for giving us access to their information resources. Special thanks to Engr. Emeka Udokporo
of FLAB Engineering and Mr. A. O. Kanu of the Abia State Water Board, who made a lot of useful material available and
helped in many other ways; also Mr. R. C. Oty of the Anambra- Imo River Basin Authority, and Mr. R. N. Ibe of the
Ministry of Public Utilities, Owerri for their tremendous help in the work.
References [1] Dessauvagie, T. F. J., (1972); Biostratigraphy of the Odukpani (Cretaceous) Type Section, Nigeria Proc. of the Conf.
on African Geology, Ibadan, Nigeria, pp.207-218. [2] Ekwe, A. C., Onu N. N., and Onuoha K. M. (2006); Estimation of Aquifer Hydraulic Characteristics from Electrical
Sounding Data: The Case of Middle Imo River Basin Aquifers, South-Eastern Nigeria. Journal of Spatial Hydrology,
Vol. 6, No. 2, pp. 121-132.
[3] Rubin Y. and Hubbard S.(2005); Hydrogeophysics, Springer, Netherlands, Water and Science Technology Library, V.
50, 523 p., 2005.
[4] Majumdar R. K. and Das D. (2011); Hydrological Characterization and Estimation of Aquifer Properties from
Electrical Sounding Data in Sagar Island Region, South 24 Parganas, West Bengal, India. Asian Journal of Earth
Sciences, 4(2) pp. 66-74.
[5] Mendosa, F.G., Steenhuis, S.T., Todd Walter, M., Parlange, J.-Y., (2003). Estimating basin-wide hydraulic parameters
of a semi-arid mountainous watershed by recession-flow analysis. Journal ofHydrology 279, 57–69.
[6] Niwas, S., Singhal, D.C., (1981); Estimation of aquifer transmissivity from Dar-Zarrouk parameters in porous media. Journal of Hydrology 50, 393–399.
[7] Niwas, S., Gupta, P.K., de Lima, O.A.L., (2006); Nonlinear electrical response of saturated shaley sand reservoir and
its asymptotic approximations. Geophysics 71 (3), 129–133.
[8] Onwuegbuche, A. A., (1993); Geoelectrical investigations in the Imo River Basin Nigeria. Unpublished Ph.D thesis.
Department of Physics ,University of Calabar. pp.2-62.
[9] Uma, K.O., (1989); An appraisal of the groundwater resources of the Imo River Basin, Nigeria. Journal of Mining and
Geology Vol. 25 Nos 1&2, pp.305-31
[10] Zohdy, A. A. R., Eaton, G.P. and Marbey, D. R., (1974); Application of surface Geophysics to groundwater
investigations. US Geological Survey.
International Journal of Modern Engineering Research (IJMER)
www.ijmer.com Vol. 2, Issue. 5, Sep.-Oct. 2012 pp-3237-3244 ISSN: 2249-6645
www.ijmer.com 3243 | Page

International Journal of Modern Engineering Research (IJMER)
www.ijmer.com Vol. 2, Issue. 5, Sep.-Oct. 2012 pp-3237-3244 ISSN: 2249-6645
www.ijmer.com 3244 | Page
GROUND SURFACE
LEGEND
TOP SOIL
CLAY
SAND
SHALE
SANDY SHALE
SAND STONE
SILT
DRY SAND/SAND
DRY SAND/SAND STONE
CLAYEY SAND
SILTY SAND
CLAYEY SHALE
SAND/SANDSTONE
CLAY
SAND
SHALY
SAND
SHALE