Evaluation of the Ad Council/DOE “What’s Your Excuse ... · Renewable Energy (EERE), Office of...
87
Evaluation of the Ad Council/DOE “What’s Your Excuse” Public Service Advertising Campaign June 2010 Prepared by: Jane T. Bertrand Tulane University Patty Goldman Ad Council Paul Metz, Erin Barber, Kym Wegenka C&R Research
Transcript of Evaluation of the Ad Council/DOE “What’s Your Excuse ... · Renewable Energy (EERE), Office of...

Evaluation of the Ad Council/DOE “What’s Your Excuse” Public Service Advertising Campaign
June 2010
Prepared by:
Jane T. Bertrand Tulane University
Patty Goldman Ad Council
Paul Metz, Erin Barber, Kym Wegenka C&R Research

ES-1

ACKNOWLEDGEMENTS
This report presents the findings from an evaluation of the “What‟s Your Excuse” energy
efficiency public service advertising campaign. The study was funded by the Department of
Energy (DOE) under project award number DE-FC36-07GO17103.
Dr. Jane T. Bertrand, Tulane University, was the primary author of this report. Patty Goldman
coordinated the different organizations and individuals involved in the design and
implementation of this evaluation. Jeff Dowd of DOE‟s Office of Energy Efficiency and
Renewable Energy (EERE), Office of Planning, Budget and Analysis (PBA) was the DOE
project manager. Dr. Yaw Agyeman, Senior Associate at IBM, provided project management
oversight and managed a peer review of the evaluation plan and first draft of this report.
C&R Research, Chicago, IL, designed the sampling approach, collected all data, and supervised
the data processing. Paul Metz, Erin Barber, and Kym Wegenka guided the process at C&R
Research. Dr. Natalia Zhivan of Tulane University assisted in additional data processing and
analysis for this report.
Several reviewers offered valuable comments on earlier drafts of this report, including Jeff
Dowd, Yaw Agyeman, Patty Goldman, and other staff at the Ad Council. The external review
panel for this effort was led by Julia Coffman, Senior Consultant at the Harvard Family Research
Project. Other involved members include: Edith Asibey, Principal, Asibey Consulting,
Communication and Advocacy Strategies; and Johanna Morariu, Senior Associate at the
Innovation Network, Inc. The external review panel assessed the evaluation plan and the first
draft of this report.
NOTICE
This document was prepared as an account of work sponsored by an agency of the United States
government. Neither the United States government nor any agency thereof, nor any of their
employees, makes any warranty, express or implied, or assumes any legal liability or
responsibility for the accuracy, completeness, or usefulness or any information, apparatus,
product, or process disclosed, or represents that its use would not infringe privately owned rights.
Reference herein to any specific commercial product, process, or service by trade name,
trademark, manufacturer, or otherwise does not necessarily constitute or imply its endorsement,
recommendation, or favoring by the United States government or any agency thereof. The views
and opinions of authors expressed herein do not necessarily state or reflect those of the United
States government or any agency thereof.
iii

CONTENTS
Section Page
Acknowledgements ............................................................................................................................. iii
Executive Summary ....................................................................................................................... ES-1
1. Background ................................................................................................................................... 1-1
1.1 Objectives of the Campaign ............................................................................................. 1-1
1.2 Pathways to Change ......................................................................................................... 1-1
1.3 Channels and Content of the Campaign Targeted at 8-12 Year Olds .............................. 1-2
2. Methodology .................................................................................................................................. 2-1
2.1 Evaluation Questions ....................................................................................................... 2-1
2.2 Study Design .................................................................................................................... 2-1
2.3 Three Surveys Conducted for this Evaluation ................................................................. 2-1
2.4 Metrics ............................................................................................................................. 2-3
2.5 Data Analysis ................................................................................................................... 2-5
2.6 Website Traffic Analysis ................................................................................................. 2-5
2.7 Timeline for the Conduct of the Surveys and Launch of the Campaign .......................... 2-6
2.8 Limitations of the Research ............................................................................................. 2-7
3. Results ............................................................................................................................................ 3-1
3.1 Socio-Demographic Characteristics of the Tween Sample .............................................. 3-2
3.2 Ad Recognition from the Campaign ................................................................................ 3-5
3.3 Knowledge Related to Energy Saving ........................................................................... 3-14
3.4 Proactive Attitudes Toward Energy Saving ................................................................... 3-16
3.5 Energy-Saving Behaviors .............................................................................................. 3-20
iv

3.6 Regression Analysis of Campaign Effects: Factors Associated with Positive
Outcomes ....................................................................................................................... 3-24
3.7 Propensity Score Analysis ............................................................................................. 3-29
4. Discussion ...................................................................................................................................... 4-1
4.1 Measurement Issues ......................................................................................................... 4-1
4.2 Theory of Change Underlying the Design of the Campaign ............................................ 4-2
4.3 Campaign Results in the Context of the Other Behavior Change Campaigns ................. 4-3
References ......................................................................................................................................... R-1
Appendixes ....................................................................................................................................... A-1
A. Energy Action Plan .......................................................................................................... A-1
B. Questionnaire Used in the Omnibus Survey (Both Waves) .............................................. B-1
C. Questionnaire Used in the Custom Survey........................................................................ C-1
D. Details Regarding Sampling for the Custom Survey ....................................................... D-1
E. Response Rates for the Three Surveys .............................................................................. E-1
F. Web and Donated Media Statistics – Analysis of Traffic to Websites Promoted by the
Campaign .......................................................................................................................... F-1
v

FIGURES
Number Page
Figure ES-1. Results of the Propensity Score Matching: Average Treatment Effect
of Ad Recognition on the Number of Behaviors Related to Saving Energy .......... ES-5
Figure 1-1. Diagram of the Conceptual Framework Underlying the Campaign ......................... 1-2
Figure 3-1. Results of the Propensity Score Matching: Average Treatment Effect
of Ad Recognition on the Number of Behaviors Related to Saving Energy .......... 3-31
Figure F-1. Consumer Response: LoseYourExcuse.gov Visitor Sessions .................................. F-1
Figure F-2. Donated Media, September 2008 – September 2009 ................................................ F-2
Figure F-3. Total Donated Media and Website Visitors .............................................................. F-3
Figure F-4. Statistics for EERE “Tinkerbell” Site ....................................................................... F-4
vi

TABLES
Number Page
Table 1-1. Key Message(s) in each of the Twelve Campaign Advertisements (Executions) .... 1-3
Table 2-1. Inclusion of Questions to Measure Recognition of Specific Campaign Ads/Items
in the Omnibus Surveys and in the Custom Survey.................................................. 2-2
Table 2-2. Inclusion of Questions to Measure Category Awareness and Specific
Outcomes in the Omnibus Surveys and Custom Surveys ......................................... 2-4
Table 2-3. Timeline for the Conduct of Surveys and Launch of the Campaign ......................... 2-6
Table 3-1. Socio-Demographic Characteristics of the Three Samples: Omnibus-Wave #1,
Omnibus-Wave #2, and Custom Survey (Excluding Supplement) ........................... 3-2
Table 3-2. Socio-Demographic Characteristics by Age and Gender: Custom Survey
(Excluding Supplement) ........................................................................................... 3-4
Table 3-3a. Awareness of Energy Saving Messages by Age and Gender: Custom Survey
(Excluding Supplement) ........................................................................................... 3-5
Table 3-3b. Awareness of Energy Saving Messages by Campaign Media Intensity:
Custom Survey (Including Supplement) ................................................................... 3-6
Table 3-4. Recognition of Specific Ads and Other Items from the Campaign: Omnibus
Wave #1, Omnibus Wave #2, and Custom Survey (Excluding Supplement) ........... 3-8
Table 3-5. Recognition of Specific Ads and Other Items from the Campaign by Media
Intensity: Custom Survey (Including Supplement) ................................................. 3-11
Table 3-6. Mean Number of Messages Recognized by Socio-Demographic Characteristics
and Campaign Media Intensity (Custom Survey Only) .......................................... 3-13
Table 3-7a. Knowledge Related to Saving Energy (Key Messages) by Age And Gender:
Custom Survey Only (Excluding The Supplement) ............................................... 3-14
Table 3-7b. Knowledge of Key Messages Related to Saving Energy in Relation to
Media Intensity: Custom Survey Only (Including the Supplement) ....................... 3-15
Table 3-7c. Knowledge Related to Saving Energy (Key Messages) by Exposure to the
Campaign: Custom Survey Only (Including the Supplement) ............................... 3-16
vii

Table 3-8a. Proactive Attitudes Toward Saving Energy: Omnibus Wave #1, Omnibus
Wave #2, and Custom Survey (Excluding Supplement) ......................................... 3-17
Table 3-8b. Proactive Attitudes Toward Saving Energy by Campaign Media Intensity:
Custom Survey (Including Supplement) ................................................................. 3-18
Table 3-8c. Proactive Attitudes Toward Saving Energy by Exposure to the Campaign:
Custom Survey (Including Supplement) ................................................................. 3-19
Table 3-9a. Behaviors Related To Saving Energy by Age And Gender: Custom Survey
(Excluding Supplement) ......................................................................................... 3-20
Table 3-9b. Behaviors Related to Saving Energy by Media Intensity: Custom Survey
(Including Supplement) .......................................................................................... 3-22
Table 3-9c. Behaviors Related to Saving Energy by Ad Recognition: Custom Survey
(Including Supplement) .......................................................................................... 3-23
Table 3-9d. Performance of a Specific Energy-Saving Behavior by Ad Recognition
of the Relevant Spot ................................................................................................ 3-23
Table 3-10a. Regression Results: Knowledge Related to Saving Energy
(Dependent Variable) .............................................................................................. 3-25
Table 3-10b. Regression Results: Attitude that Saving Energy is Important
(Dependent Variable) .............................................................................................. 3-26
Table 3-10c. Regression Results: Intention to Talk to Parents about Saving Energy .................. 3-27
Table 3-10d. Regression Results: Taken Action to Save Energy (Dependent Variable) ............. 3-29
Table 3-11a. Average Treatment Effect (ATT) of Ad Campaign on Behaviors Related
to Saving Energy (Excluding Supplement) ............................................................. 3-30
Table 3-11b. Results of Sensitivity Analysis of the Estimates of the Effects of Ad
Recognition to Violation of the Conditional Independence Assumption (CIA) ..... 3-31
Table 3-11c. Converting the Results of the Propensity Score Matching to an Effect Size .......... 3-32
Table E-1. Response Rates and Incidence Rates for the Three Surveys..................................... E-1
viii

ES-1
EXECUTIVE SUMMARY
A two-part energy efficiency campaign was launched in September 2008 by the U.S. Department of
Energy (DOE) in partnership with the Ad Council. The campaign encouraged 8 to 12 year-old children to
save energy by highlighting simple behavioral changes at home, and asked kids to use energy wisely.
A significant amount of free time and space was donated by television, radio, and other media outlets
nationwide to run the campaign entitled “What‟s Your Excuse?” The campaign consisted of 12
advertisements: three TV ads (“Malcolm,” “April,” “Tinkerbell”), two radio ads (“Matthew,” “April”),
four billboards (three “What‟s your Excuse?,” one “Tinkerbell”), and three Web banner ads. Some of the
ads encouraged tweens to visit two campaign-related websites: www.LoseYourExcuse.gov and
www.energy.gov/tink.
The objectives of the campaign were:
To raise awareness of energy savings;
To increase knowledge of energy-saving key facts;
To foster a proactive attitude toward energy savings; and
To change energy usage habits.
The total value of donated media for the campaign, over the period examined in this evaluation, came to
$41,041,261, driven primarily by radio and TV. In addition to radio and TV coverage, overall, the
www.LoseYourExcuse.gov website received over 93,000 visits between September 2008 and December
2009, averaging about 5,800 visits per month.
Evaluation Approach
Three online nationwide surveys of the targeted population were used to evaluate this campaign. The first
survey occurred in August 2008 as a benchmark/baseline survey (Omnibus Wave #1). In August 2009, a
second survey designed as a follow-up survey (Omnibus Wave #2) occurred. Finally, a custom survey in
August 2009 was designed to measure the impact of the campaign under varying conditions of media
exposure and to obtain more in-depth information on ad exposure and selected outcomes. The analysis
also included traffic to the websites promoted by the campaign.
The evaluation focused on five key questions:
What percentage of tweens recognized one or more ads/items from this campaign?
What percentage of tweens had correct knowledge of at least two energy savings facts after the
campaign?
Was there an increase in the percentage of tweens before and after the campaign possessing
proactive energy savings attitudes?

Evaluation of the Ad Council/DOE “What’s Your Excuse” Public Service Advertising Campaign
ES-2
Was there an increase in the percent of tweens before and after the campaign that practiced
energy saving behaviors?
Was exposure to the campaign associated with the desired outcomes (knowledge, proactive
attitudes, and energy savings behaviors), after controlling for socio-demographic factors and
underlying motivational variables?
The study used regression analysis to understand relationships between ad recognition and potential
media exposure (number of detections) as independent variables, and desired outcomes among the target
audience as dependent variables. The study hoped to observe cause-and-effect; i.e. the campaign caused
observable changes within the outcome variables. Regression established correlation, not causation;
however, the results of propensity score matching strengthen the possibility of a causal relationship.
Survey Results
The total number of tween respondents was 500, 498, and 2,496, respectively, for each survey wave.
Response rates were 47%, 40%, and 45%, split nearly evenly between boys and girls. These findings are
consistent with other panel surveys among children.
All differences cited are statistically significant at the p<0.05 level. Any mention in this report of a
“significant difference” should be interpreted as a “statistically significant difference at the p=0.05 level,”
unless noted to the contrary. Key findings are summarized below and arranged by topic.
Ad Recognition
Forty-six percent of respondents recognized at least one of the 12 campaign ads. The “April” TV ad had
the single highest recognition rating at 30%, followed by the Tinkerbell TV ad (24%), the Internet banner
ads (23%), and the Tinkerbell billboard (19%).
The percentages for ad recognition increased significantly between the first (baseline) and second
(follow-up) survey for ads that were included in both waves. The repeated ads and their corresponding
recognition percentage were as follows:
”Malcolm”: 4% (baseline) to 13% (follow-up)
“April”: 2% (baseline) to 23% (follow-up) - based specifically on tweens viewing only
storyboards of the ad
“Tinkerbell”: 15% (baseline) to 24% (follow-up)
“Matthew”: 5% (baseline) to 7% (follow-up)
“What‟s Your Excuse?”: 4% (baseline) to 9% (follow-up)
With a recognition percentage of 46, the campaign reach is average when compared to other U.S.
behavior change campaigns across a wide range of topics. Recognition percentages for individual ads
were, in some cases, much higher. These include the “April” TV ad (tweens viewing actual video clips)

ES-3
having a 30% recognition – a percentage well above the average of 14 percent in previous Ad Council
campaigns. It should be noted that in the previous airings, the ad was integrated into a campaign that
focused on different topics and audiences than the What’s Your Excuse demographic.
Respondents reporting to have seen or heard an ad that had not yet aired ranged from 2% to 5%. This
percentage was well within the norm of 6 percent “ghost awareness” established in previous Ad Council
campaigns. The exception to the average was the “Tinkerbell” ad, at 15% perceived recognition, which
may be due to tweens‟ difficulty distinguishing between the Disney character and the campaign ad.
Tweens recognized, on average, approximately one ad. This mean was slightly higher among girls who
were 11 or 12 years old, non-Caucasians, and tweens living in urban areas. The Omnibus survey found no
statistically significant evidence that household income or location was associated with a higher
recognition percentage.
The third survey (Custom Survey) explored advertisement recognition through campaign intensity – i.e.,
the frequency with which public service ads (PSAs) are shown in a given market. Data collected did not
correlate with mean number of ads recognized, nor was there a strong and consistent relationship
evidenced between campaign media intensity and recognition of specific ads. The lack of association
between campaign media intensity and other variables occurred throughout the analysis.
In retrospect, the measure of campaign media intensity did not capture key media (e.g., local and national
cable, national TV broadcasting). The measure used in the survey was not a valid tool for quantifying
campaign media intensity. Because the original evaluation plan called for testing this association, we must
report this recurrent lack of association between campaign media intensity and outcomes. It should be
stressed, however, that it would be incorrect to conclude that media intensity does not influence key
outcomes based on these findings.
Knowledge of Key Facts Related to Energy Savings
Over 70% of tweens correctly answered three knowledge questions on the post-campaign Custom Survey
(two of which related directly to campaign messaging). Little variation was found in knowledge by age,
gender identity or campaign media intensity. By contrast, correct knowledge did relate to ad recognition:
a higher percentage of tweens who recognized at least one ad answered correctly to both knowledge items
from the campaign. Moreover, those that saw or heard an “April” ad were more likely (88%) than others
(81%) to know that if a cell phone charger is plugged in, it is still using energy. Similarly, those that saw
the “Malcolm” TV ad or heard the “Matthew” radio ad were more likely (82%) than others (70%) to
know that energy saving light bulbs last six times longer than regular bulbs (p<0.05).
Proactive Attitudes toward Saving Energy
Over 80% of tweens on all three surveys felt that it was very or somewhat important to save energy. The
percent did not increase significantly in the follow-up surveys. The majority of tween respondents (54%
Executive Summary

Evaluation of the Ad Council/DOE “What’s Your Excuse” Public Service Advertising Campaign
ES-4
to 65% on the three surveys) felt it was “not very” or “not at all hard” to save energy on a daily basis.
Both campaign intensity and ad recognition were associated with proactive attitudes, though the findings
included counterintuitive results.
Ad recognition was associated with proactive attitudes. Tweens who reported to have seen one or more
ads were more likely to feel that saving energy was very or somewhat important (88%) than those that
had not (83%). Also, those reporting to have seen at least one ad expressed a greater likelihood that they
would talk to their parents about saving energy (70%) than those not having seen any ad (65%). However,
campaign media intensity was not associated with positive attitudes, reflecting the problem with this
measure of intensity discussed above.
Regarding the intention to talk with parents about saving energy, over half of the tween respondents
reported that they were “very” or “somewhat” likely to talk to their parents about saving energy. The
increase between Wave #1 (52%) and Wave #2 (57%) surveys was not statistically significant, though the
percent for Wave #2 is highly consistent with the Custom Survey (58%). Ad recognition did show a
strong and consistent association with intention to speak with parents about saving energy: those
reporting to have seen at least one ad expressed a greater likelihood that they would talk to their parents
about saving energy (70%) than those not having seen any ad (65%) (p<0.05). Campaign media intensity
did not show a strong and consistent association with intention to speak with parents about saving energy.
Energy Saving Behaviors
Current levels of energy saving behaviors were high across all three surveys. Over 90% of tweens
reported participating in at least one energy saving behavior within six months of the survey. Tweens
reported performing an average of five actions (of the 10 specifically mentioned on the survey) in the past
six months. No consistent association was found between gender and age across these 10 actions.
There was, however, a statistically significant association between energy saving behavior and ad
recognition. This study classified tweens by the number of energy saving behaviors reported: 0-3, 4-5, or
6-10. The percent of tweens reporting the most energy saving actions was higher among those that
reported to recognize at least one ad (51%) than those who didn‟t see any of the ads (35%). Tweens who
recognized messages with specific cues to action were more likely to perform the action promoted. For
example, tweens who saw or heard of the “April” ads were more likely (69%) than others (53%) to report
unplugging their cell phone chargers. Similarly, those that saw the “Malcolm” ad or had heard the
“Matthew” ad were more likely (68%) than others (56%) to have switched to energy saving light bulbs.
No association between campaign media intensity and energy saving behaviors was found. In fact,
campaign intensity was associated with behavior on only two of the 10 actions: saving bulbs and cell
phone charger unplugging. These were two behaviors promoted in the TV ads. There was no noticeably
strong or consistent pattern for the other eight actions, in cases where the action had been implemented.

ES-5
Multivariate Regression Results of Campaign Effects
Regression was used to test the association between two independent variables: ad recognition and
campaign media intensity. Four outcome variables (knowledge, proactive attitude, intention to talk to
parents about saving energy, and energy-saving behaviors) were also analyzed. Across the entire study,
attempts were made to control socio-demographic characteristics and motivators affecting attitude
towards energy consumption or conservation.
Across all four outcomes, one or both of the control variables (predilection to save energy and perceived
difficulty of saving energy) were statistically significant. Ad recognition was associated with two of the
four outcomes: proactive attitude and energy-saving behavior. Intensity of campaign media was not
associated with any of the four outcomes. Even when controlling for the two proxy variables for
motivation, tweens that reported having seen or heard a campaign message were more likely to believe in
the importance of energy savings and more likely to engage in energy-saving behaviors.
Propensity Score Matching to Estimate “Effect Size” for the Campaign
The propensity score matching analytic method created a statistically equivalent control group to
determine campaign effects on those exposed to the campaign (the treatment group), thus correcting for
people with different socio-demographic characteristics and underlying motivations who may be more (or
less) likely to attend to a campaign of this type. By creating two groups that are statistically equivalent on
all relevant variables measured in the survey, the method allowed reduction of selectivity bias, and more
accurately measured the ad recognition effects on a given outcome (such as behavior).
Figure ES-1. Results of Propensity Score Matching: Average Treatment Effect of Ad Recognition
on the Number of Behaviors Related to Saving Energy
The difference in mean number of reported energy savings actions between those that recognized one or
more ads (“treatment group”) and the non-exposed (“control group”) was 0.799. After propensity score
matching, this difference was reduced to 0.48, meaning that the campaign increased the number of
energy-saving actions reported by one-half an action, as shown in Figure ES-1. This difference, though
small, is statistically significant, indicating that the campaign had a measurable effect on behavior.
Nu
mb
er
of
En
erg
y
Sav
ing
Act
ion
s
Executive Summary

Evaluation of the Ad Council/DOE “What’s Your Excuse” Public Service Advertising Campaign
ES-6
Summary of Key Findings and Discussion
The key findings of this evaluation are:
Forty-six percent of respondents recognized at least one ad.
The “April” TV ad had the highest recognition for a single ad (30%).
No significant increases occurred between Waves #1 and #2 on the three measured outcomes in
both surveys: proactive attitudes, intention to talk to parents, and energy-saving behaviors.
Recognition of at least one ad was associated with all four outcomes (p<0.05) – knowledge,
proactive attitudes, intention to talk to parents, and energy-saving behaviors.
No consistent, positive association was found between campaign media intensity and any of the
four outcomes.
The regressions demonstrated a positive association between ad recognition and outcomes –
while controlling for socio-demographic characteristics and two control variables – for two of the
four outcomes (proactive attitudes and energy saving behaviors), but not for two others
(knowledge or intention to talk with parents about saving energy).
Propensity score analysis confirmed the campaign increased the number of energy-saving actions
by one-half an action – a small but measurable and statistically significant effect on energy saving
behavior.
The two post-campaign surveys that were conducted in August 2009 provided highly consistent findings
on almost every variable, underscoring the survey‟s reliability of tween responses. By contrast, the
measure of campaign media intensity based on number of detections (computed from Nielsen ratings) did
not prove to be a valid indicator of potential exposure because it did not accurately capture ad broadcast
frequency on several important channels used in this campaign. Based on a prompted recall of 10 energy
saving actions over the past six months, the surveys provided useful variation across respondents. They
did, however, yield high levels of affirmative response, which suggested the need to shorten the reference
period or introduce a measure of consistency of behavior to “heighten the bar” in future surveys. Future
campaigns of this type should develop strategy and messaging to explicitly reflect tweens‟ motivations
with regard to saving energy. It was unclear that the design of this campaign addressed the question: What
would make tweens want to save energy? The report concludes with a comparison of this campaign to
others that aimed to change behavior.

1-1
1. BACKGROUND
The U.S. Department of Energy (DOE), in partnership with the Ad Council, launched a two-part energy
efficiency campaign in September 2008, aimed at boys and girls 8-12 years old (“tweens”). The campaign
highlighted the simplicity of making energy efficient changes in the home and asked kids to join millions
of others to make a difference by using their energy wisely. TV, radio, and other media outlets nationwide
donated a significant amount of free time and space to run this campaign entitled “What‟s Your Excuse?”
The sponsor of this campaign – DOE – wished to determine the reach and impact of this campaign among
the target audience of 8-12 year-olds in the U.S. This report describes the findings from the evaluation of
this campaign, based on a pre- and post-campaign survey, as well as a more in-depth survey with
stratified sampling by DMAs (designated media areas, a term coined by Nielsen Media Research, of
which there are 210 in the United States). The follow-up surveys were fielded in August 2009.
1.1 Objectives of the Campaign
The public service advertising (PSA) campaign had four main objectives among 8-12 year olds:
To raise awareness of energy savings;
To increase knowledge of energy-saving facts;
To foster a proactive attitude toward energy savings; and
To change energy usage habits.
1.2 Pathways to Change
The Ad Council based the campaign on the conceptual framework that appears in Figure 1-1. It indicates
that Ad Council activities, consisting of distribution and marketing of PSAs and public relations/press
outreach, were intended to result in recognition of the campaign messages and press coverage.
This recognition, in turn, was hypothesized to increase awareness of the importance of saving energy
(including specific measures), promote word-of-mouth discussions, and drive tweens to the campaign
websites. The long-term outcomes were to ingrain the value of saving energy to the next generation and
increase daily energy-saving actions. The ultimate impact of this campaign (not measured by this
evaluation) included decreased energy consumption in U.S. households, decreased foreign energy
dependence, and reduction of negative environmental impacts. The variables measured in the survey map
to the boxes on the conceptual framework (Figure 1-1).

Evaluation of the Ad Council/DOE “What’s Your Excuse” Public Service Advertising Campaign
1-2
Figure 1-1. Diagram of the Conceptual Framework Underlying the Campaign
1.3 Channels and Content of the Campaign Targeted at 8-12 Year-Olds
The campaign “What’s Your Excuse?” consisted of the following elements:
Two 30-second TV spots, entitled “Malcolm” and “April”
Two 30-second radio spots, entitled “Matthew” and “April”
Three billboards with an energy-saving message aimed at kids
Three web banners via the Internet
Collateral materials
The PSAs directed tweens to the interactive website www.LoseYourExcuse.gov, where they could
download an Energy Action Plan (see Appendix A) and learn fun, simple tips on energy efficient
behaviors to reduce energy consumption in the home. Several supplemental PSAs ran at the same time as
the primary campaign. The second series of PSAs, including a TV ad, web banners, and outdoor
billboards, were developed in collaboration with the Ad Council and featured characters from Walt
Disney Studios Home Entertainment's DVD and Blu-RayTM
release Tinker Bell. These spots, also released
in September 2008, aimed to educate 8-9 year-olds about energy efficient habits and to drive kids to visit

Background
1-3
www.energy.gov/tink. Given the similar objectives and overlapping target audiences, they are considered
as part of a single campaign in this evaluation.
Table 1-1 summarizes the ads and other items that made up this campaign. All elements were created to
work together to promote the main campaign message: that there are simple steps tweens can take in the
home to save energy. All ads also encouraged tweens to visit the campaign website. Each element
highlighted specific recommended individual energy actions, as shown in Table 1-1.
Table 1-1. Key Message(s) in each of the 12 Campaign Advertisements (Executions)
1 2 3 4 5 6 7 8
Ad or item Phone
charger
uses
energy
…
Energy
-saving
bulbs
last
longer
…
Use
energy
saving
light
bulbs
Use
power
strips
Turn off
gaming
systems
…
Turn
off
lights
Use
energy
wisely
Go to
Lose
Your
Excuse
website
“Malcolm” TV X
“April” TV X
“Tinkerbell”
TV X X X
“Matthew”
radio X
“April” radio X
Billboard –1 X X X
Billboard – 2 X X X
Billboard – 3 X X X
“Tinkerbell”
BB X
Web banner 1 X
Web banner 2 X
Web banner 3 X
The Ad Council used the donated media model for this campaign. Specifically, all ads created for this
campaign ran in available time and space via the support of thousands of media outlets nationwide. Ad
Council staff employed various promotional tactics – such as sending tween-targeted kits to media
outlets, attending meetings with local and national media outlet representatives, and sending targeted
follow-up outreach emails to key media contacts to encourage the placement of the campaign – all in an
effort to secure donated media in support of the campaign. The benefit of working within the donated
media model is the potential return on investment, if measurable effects from ads run are achieved. The
challenge of working within this model is that without purchasing media, the Ad Council had limited
control over the reach and frequency of PSA airings to the tween audience.

Evaluation of the Ad Council/DOE “What’s Your Excuse” Public Service Advertising Campaign
1-4

2-1
2. METHODOLOGY
2.1 Evaluation Questions
This evaluation focused on five key questions among tweens in the U.S:
What percentage of tweens recognized one or more ads/items from this campaign?
What percentage of tweens had correct knowledge of two energy savings facts after the
campaign?
Was there an increase in the percent of tweens before and after the campaign that had proactive
attitudes toward saving energy?
Was there an increase in the percent of tweens before and after the campaign that practiced
energy saving behaviors?
Was exposure to the campaign associated with the desired outcomes (knowledge, proactive
attitudes, behavioral intention, and energy savings behaviors), after controlling for underlying
motivational variables?
2.2 Study Design
Typical evaluation of Ad Council public service campaigns include analysis of donated media received,
publicity results, website traffic, and national tracking surveys of the target audience fielded pre-
campaign and post-campaign launch. Survey instruments focus on campaign awareness, attitudes, and
behaviors relating to the social issue addressed by the campaign. Such studies utilize identical
questionnaires and methodologies among discrete non-overlapping samples. Before and after
comparisons among the total sample and key demographic subgroups are included. In addition, a website
traffic analysis was conducted of the two websites for this campaign: www.LoseYourExcuse.gov and
www.energy.gov/tink.
2.3 Three Surveys Conducted for this Evaluation
The Ad Council, in consultation with the DOE, commissioned C&R Research to conduct three nationally-
representative surveys among boys and girls 8-12 years old, as follows:
A baseline survey in August 2008, prior to the launch of the campaign, as part of C&R
Research‟s KidzEyes Omnibus (“Wave #1”) (n=500);
A follow-up survey in August 2009, 12 months after the launch of the campaign to allow for
media buildup, also via the KidzEyes Omnibus (“Wave #2”) (n=498); and
A Custom Survey in August 2009, using a comparable methodology, among a large sample of
2,500 children ages 8-12; the Custom Survey allowed for more detailed questions about exposure
to the campaign and outcomes of interest.
KidzEyes Omnibus Survey is a monthly, quantitative, online omnibus of kids operated in full compliance
with federal online privacy legislation (COPPA laws protect the personal information collected online

Evaluation of the Ad Council/DOE “What’s Your Excuse” Public Service Advertising Campaign
2-2
from children under age 13). It includes respondents 6-14; however, this analysis used data from
respondents 8-12 only. In order to make the data as representative as possible of the U.S. population of
this age, C&R Research applied 2007 U.S. Census weights to both the August 2008 and August 2009
data. As a result, one can consider the two waves of the Omnibus Survey data as close to “Census
representative” as possible from an online survey.1
Respondents for both waves of the Omnibus Survey answered eight questions related to saving energy
and the campaign (see Appendix B for copies of the questionnaire for each wave). The online survey
included “stimuli” that the respondents could watch or listen to (i.e., TV storyboards, radio scripts, and a
billboard image in Wave #1; Wave #2 and the Custom Survey included those stimuli, as well as TV
videos and radio audio files). The ad recognition items that appeared in both the Omnibus Surveys and the
Custom Survey are listed in Table 2-1.
Table 2-1. Inclusion of Questions to Measure Recognition of Specific Campaign Ads/Items in
the Omnibus Surveys and in the Custom Survey
Wave #1 Wave #2 Custom
TV ads:
“Malcolm” X X X
“April” X X X
“Tinkerbell” X X X
Radio ads:
“Matthew” X X X
“April” n/a n/a X
Billboards:
“What‟s Your Excuse?” X X X
“Tinkerbell” n/a n/a X
Web banner ad n/a n/a X
Website: What‟s Your Excuse? n/a n/a X
The Custom Survey aimed to evaluate the impact of the campaign under varying conditions of media
exposure. C&R Research carried it out as an Internet-based survey in August 2009, overlapping in time
with the Omnibus Wave #2 Survey. However, the Custom Survey differed in the following ways:
It contained additional questions regarding outcomes requested by DOE (knowledge, proactive
attitudes, and energy saving behavior; see Table 2-2 and Appendix C); also, it measured
1 An online sample under-represents certain ethnic and income subgroups that access the Internet at lower rates, specifically
children living at or below poverty level. While C&R Research was able to provide some representation of the lowest
income group (<$35,000/year household income), this income group would be populated primarily with households making
$20,000 to $35,000.

Methodology
2-3
recognition of the full range of ads included in the campaign, and thus yielded a more complete
measure of “dose” (i.e., the number of ads seen or heard);
It used a different sampling strategy, described in Appendix D, expected to yield differing levels
of campaign media intensity to address the question: were tweens in “media-heavy” markets
more likely than others to recognize the importance of saving energy, have better knowledge,
have proactive attitudes, and report energy-saving behaviors?
Since the Ad Council does not buy media time or space, it could not plan or estimate media intensity prior
to the campaign‟s launch. Rather, it was necessary to estimate campaign intensity relying on a variety of
media monitoring services after the campaign launched. The sample design included both a representative
sample of 2,000 drawn from randomly selected DMAs, and an augment of 500 interviews in DMAs
estimated to have heavier campaign media intensity, based on local broadcast detections (airings). The
tables in this report present some data for the total sample, excluding the supplement and other tables with
the supplement (e.g., cross tabulation of outcomes by levels of campaign media intensity). The response
rates for the three surveys were 47%, 40%, and 45%, respectively. This represents the percent of kids that
accessed the survey of those contacted by email to participate. These percentages are consistent with other
panel surveys among kids conducted by C&R Research. Of those kids that accessed the survey, 100, 94,
and 74 percent on the three surveys, respectively, completed it (see Appendix E for details).
2.4 Metrics
The two waves of the Omnibus Survey included a common set of variables available both at baseline and
follow-up (Waves #1 and #2); however, this list was relatively short. In contrast, the Custom Survey
included more questions regarding ad recognition and outcomes, but these were only available at follow-
up. Also, not all of the radio and TV ads were available for inclusion as video or audio clips on the
baseline survey. As a result, the Custom Survey included more questions regarding ad recognition than
was possible for the Omnibus Surveys, although comparable data are available for recognition of three
TV ads, one radio ad, and one billboard ad. The full listing of the campaign elements and surveys that had
the corresponding ad recognition questions appears in Table 2-1.
The Custom Survey contained a larger number of the outcome measures than did the Omnibus Surveys.
Table 2-2 outlines the category awareness and outcome variables that were available on the Omnibus
Surveys, the Custom Survey, or both.
Two measures of exposure to the campaign were used2: self-report of ad recognition and campaign media
intensity based on number of detections in a given DMA (media market). In all three surveys, tweens
viewed story boards, heard video clips, and viewed examples of billboards and Internet banners produced
as part of the campaign. For each item, they responded as to whether they had seen or heard this item,
which is the basis of the ad recognition results.
2 Note: we acknowledge that the terms “exposure,” “campaign awareness,” “reach,” “penetration,” and “ad recognition” may be
defined differently in different settings. In this report we have used “ad recognition” in preference to other terms.

Evaluation of the Ad Council/DOE “What’s Your Excuse” Public Service Advertising Campaign
2-4
Table 2-2. Inclusion of Questions to Measure Category Awareness and Specific Outcomes in
the Omnibus Surveys and Custom Surveys
Outcome/Metric Omnibus
Surveys
Custom Survey
Category awareness of messages on saving energy:
Seen or heard any message related to energy savings in
past 6 months X
Reports seeing or hearing more about saving energy than
a year ago (“buzz”) X
Knowledge related to saving energy (key messages):
If a cell phone charger is plugged in, it is still using
energy X
Watching TV on the computer does (not) save energy X
Energy savings light bulbs last 6 times longer than regular
bulbs X
Proactive attitude toward saving energy:
Believes saving energy is important X X
Reasons given that saving energy is important (or not) X
Self-efficacy: believes it is not very hard to save energy X X
Behavioral intention: intends to talk with parents about
saving energy X X
Energy-saving behavior:
Position on the “stages of change” spectrum X
Has personally taken action to save energy X X
Has suggested to parents to save energy X
Has spoken with other persons about saving energy X
Campaign media intensity was measured by the number of detections (or airings) provided by commercial
tracking services (such as Nielsen) that measured broadcasting frequency of the campaign‟s TV ads on
local broadcast television for a specific media market. The sampling for the Custom Survey, stratified by
DMAs, allowed the researchers to determine the level of detections in each of these media markets by the
end of the campaign and to classify each market as “heavy, moderate, or low” based on an arbitrary split
by quintiles on the number of detections in the DMAs in the sample. The highest quintile was defined as
“heavy,” the second and third highest as “moderate,” and the bottom two as “low.” In addition, the
supplement of 500 cases in the Custom Survey was selected from “media heavy” DMAs. By linking the
data on number of detections per DMA to the location of residence for the respondent, we identified
respondents as living in “heavy, moderate, or low intensity” media markets for this campaign.
In retrospect, this measure of media intensity based on detections did not work well, for reasons reviewed
in Section 4. The tracking services did not monitor local cable television PSA placements nor were
national broadcast and cable placements available at the DMA level. As such, detection amount was an
inadequate proxy for total TV media support, which explains the lack of association between campaign
media intensity and ad recognition, knowledge, attitudes, and behavior in the results below.

Methodology
2-5
Moreover, this measure does not reflect exposure to the campaign via the other channels (e.g., radio,
billboards), although fewer tweens reported seeing ads on these channels as compared to TV.
2.5 Data Analysis
In the data analysis presented below, the chi-square statistic was used to test for statistically significant
differences (e.g., in the percentages on Wave #1 versus Wave #2). The study also utilized step-wise and
logistic regression modeling to identify factors (such as ad recognition) associated with four desired
outcomes: knowledge, proactive attitudes, behavioral intention, and energy-saving behaviors. In these
regression models, two variables served as control variables: predilection to act (position on the “stages to
change” continuum) and self-efficacy (perceived difficulty of saving energy). The stages to change model
is further explained in Section 3.6.3
Propensity score matching was performed to test the relationship between the campaign and a behavioral
outcome. This analytic method created a “statistically equivalent control group” to determine the effect of
the campaign on the treatment group and to control the problem of endogeneity in ad recognition.
Propensity score matching strengthens the argument of causality, i.e., the argument that the program
caused the observed change in outcome.
In the survey results presented in this report, where comparable data are available across the three studies
(Omnibus Wave #1, Omnibus Wave #2, and Custom Study), the percentages and means for each survey
are documented. For questions that appeared only on the Custom Survey, the percentage and means for
the total, as well as a breakdown by age and gender (boys 8-10, boys 11-12, girls 8-10, girls 11-12),
campaign media intensity, and ad recognition are provided.
2.6 Website Traffic Analysis
The Ad Council provided data on traffic to two websites promoted in the campaign:
www.LoseYourExcuse.gov and www.energy.gov/tink. The definition of terms related to this analysis is
as follows:
Visits: sessions during which visitors interacted with the site content (i.e., viewed a page or
downloaded a file);
Page views: number of times a Web page was viewed or a file was downloaded;
File download: number of times a file (.pdf, .doc, .xls, or .ppt file) was downloaded; and
Direct traffic: visitor typed the URL directly into their browser, accessed the site via a bookmark,
or clicked on an email link, or other direct links that could not be captured by tracking tools.
3 Note: unless noted to the contrary, any mention of a “significant difference” should be interpreted as a “statistically significant
difference at the p=0.05 level.”

Evaluation of the Ad Council/DOE “What’s Your Excuse” Public Service Advertising Campaign
2-6
2.7 Timeline for the Conduct of the Surveys and Launch of the Campaign
Table 2-3 outlines the timeline for the campaign launch and evaluation surveys. As shown in the figure,
the baseline survey (Omnibus Wave #1) took place in September 2008. The materials for the campaign
began to reach the airways, billboards, and Internet by October 2008. The campaign ran through August
2009, at which time both the Wave #2 Omnibus Survey and the Custom Survey took place. (Note:
although the Wave #2 started before the Custom Survey, the fieldwork for the two overlapped.)
Table 2-3. Timetable for the Design and Implementation of the Campaign and its Evaluation
J F M A M J J A S O N D J F M A M J J A S O N D
Activity: Strategic
development
and research X X X
Strategic
development
and production X X X X X
Development of
contract with
C&R X X
Design of the
sampling
strategy and
instruments for
Wave #1
X X X
Data collection
for the baseline
study (Omnibus
Wave #1):
X
Implementation
of the
campaign: TV,
radio,
interactive
banners, and
billboards
X X X X X X X X X X X
Design of the
sampling
strategy and
instruments for
Wave #2 and
Custom Survey
X X X
Data collection
for Wave #2
and the Custom
Survey
X
Data
processing/
analysis X X X X X
2008 2009

MBackground
3-7
2.8 Limitations of the Research
There were a number of methodological limitations to this research, some of which were specific to this
study, others that are applicable to online survey research in general.
Specific to this Study
It would have been desirable to have a before and after survey that used the same sampling methodology
and questionnaire with the full range of questions used in each survey. However, the resources to conduct
a fuller evaluation became available only after the launch of the campaign, so the larger Custom Survey
with its more inclusive questionnaire could not be conducted until post-campaign.
Secondly, since all markets received distributions of the PSAs, there were no DMAs to serve as control
markets with zero exposure. Rather, the Ad Council sought to test “higher” exposure and “lower”
exposure markets instead of exposure versus non-exposure markets. To this end, it obtained data on
number of detections of the campaign PSAs in different DMAs, and set cut-points that defined exposure
in DMAs as “none/low, moderate, and heavy” on the post-test (Custom Survey) only.
Moreover, the number of ads available for testing ad recognition varied across the three surveys. On
Wave #1, it was only possible to test the storyboards, because the actual videos of the TV ads did not yet
exist. The video clips of the ads were only available in the post study (Wave #2 and Custom Study).
Additionally, false ads, which are sometimes encouraged for use in ad recognition batteries to ascertain
false awareness, were not included in the post questionnaires, as they were not part of the Wave #1
survey. A radio ad, “April,” and Internet banner PSAs were produced after Wave #1 was fielded, so aided
recognition questions on these PSAs were asked in the post study only. Table 2-2 indicates which surveys
asked which questions.
Fourth, the evaluation budget was a limiting factor. The $50,000 available for the data collection and
processing for this study represented a significant investment in evaluation research; however, the
methodological options and sample size was still constrained. For example, a random-digit-dialed (RDD)
telephone survey might have been better able to obtain random sampling of households with children age
8-12 across the US, and would have been better able to reach poverty-level households and provide a
Census-representative sample. This approach was ruled out though because of the existing online
benchmark study (Wave #1), as well as the prohibitive cost of RDD phone methodology.
General to Surveys or Online Surveys
One limitation with online panels, such as Omnibus surveys, is their lack of representation among below
poverty-level households and some smaller, rural areas. The weighting helps to adjust for this limitation,
but the sample under-represents kids living below the poverty line.
Methodology
2-7

Evaluation of the Ad Council/DOE “What’s Your Excuse” Public Service Advertising Campaign
2-8
Second, in this type of analysis, the researchers would like to determine cause-and-effect, seeking to
verify the campaign‟s effect on changes observed in the outcome variables. Regression analysis was used
to understand relationships between ad recognition and potential media exposure (number of detections)
as independent variables, and desired outcomes among the target audience as dependent variables.
Regression establishes correlation, not causation. However, propensity score matching increases the
likelihood of causality.
It is important to address the frequent criticism of an inherent bias in online surveys among respondents
who are offered incentives to take surveys. The topical academic literature has noted that incentives:
Improve survey response rates significantly;
Are effective with younger respondents, thus helping to reduce non-responsive error among this
group; and
Enhance panelist retention, minimize panel attrition, and encourage respondents to complete
surveys in a timely manner.
Even so, C&R Research implements a non-biasing incentive program with its panelists, which led to high
response rates (60-65% among kids). A points-based incentive system in which a survey respondent
receives a point award for each survey taken was used. After reaching a certain threshold, the points can
be redeemed for a check. Thus, incentives are neither immediate nor do the incentive points "interact"
with the survey topics. Not offering incentives would have resulted in a much higher non-response level
and could‟ve led to unusually biased samples that favored the subject of the research study. In any
experimental design, such as a pre-post study, the results should be self-calibrating, such that the effects
(if any) of giving incentives can be assumed to be identical in each cell or wave. Therefore, the observed
differences across cells (or waves) can be attributed to factors other than the incentives or survey
protocols.
Online panel studies also face the problem of bias arising from self-selection among respondents. Self-
selection bias also applies to other survey modalities, such as RDD phone and in-person interviewing, so
it is not clear how much would be gained in the reduction of self-selection bias by changing survey
modality. One option to help identify the level of bias in the custom online study would have been to
conduct a parallel test among an RDD phone sample. But as previously mentioned, this type of study was
beyond the available budget. Although self-selection bias may be a factor, this bias would be consistent
across the two waves of the Omnibus survey.
The final limiting factor for this research design was the target sample. Kids age 8-12 have a limited
survey taking capacity due to their limited vocabulary and reading skills. Thus, options for question
wording and survey length are limited. Surveys were modified accordingly, with effort made to ensure
survey language was straightforward and that survey length did not exceed 10 to 15 minutes. Despite
these limitations, all three surveys yield valuable insights regarding the reach and effects of the campaign.

3-1
3. RESULTS
In this section, overall findings from both the Omnibus surveys and the Custom Survey are presented. As
a preface to the results, we reiterate the following operating functions:
Only the Omnibus Surveys provided before/after comparisons;
Only the post-campaign Custom Survey measured the full range of ad recognition questions and
all four outcome variables;
The Custom Survey included the supplement of 500 additional respondents, which had missing
values on a small but notable percent of cases for four socio-economic variables; the variable
income had the largest percentage of missing cases (12 percent).
Only the Custom Survey allowed for classification of the respondents by campaign intensity of
media market (including the supplement, which was designed to be “heavy”);
Only the Custom Survey allowed for tabulation of outcomes by recognition of one or more ads in
the campaign.
The findings were integrated from all three surveys instead of presenting the results one survey at a time.
Data results are discussed in this paper by topic so that the analysis concentrates on presenting the reader
with the most relevant data for the specific question at hand. To every extent possible, the paper presents
a before/after comparison of key variables from the Omnibus surveys, along with data on the same
variables from the Custom Survey.4 Additional data from the Custom Survey is then included, broken
down by:
Age and gender (excluding the supplement);
Campaign media intensity (including the supplement); and
Recognition of at least one ad (including the supplement).
The cross tabulations by intensity of media markets and by recognition of at least one ad tested the
hypotheses that greater exposure and desired outcomes correlation. Study measures included four
regressions that tested the relationship between exposure (two separate measures) and four different
outcomes. Likewise, the study controlled for two motivational variables: self-efficacy and predilection to
save energy. The findings from the propensity score were also matched to assess campaign impact. Any
mention of a “significant difference” should be interpreted as a “statistically significant difference at the
p=0.05 level,” unless noted to the contrary.
4 Note: we expect the results from the Omnibus Wave #2 Survey and the Custom Survey to be very similar, and consistency in
percentages across these two data sets provides evidence of the reliability of the data.

Evaluation of the Ad Council/DOE “What’s Your Excuse” Public Service Advertising Campaign
3-2
3.1 Socio-Demographic Characteristics of the Tween Sample
This analysis focused exclusively on boys and girls aged 8-12 years old. The data in Table 3-1 records the
socio-demographic characteristics of the tweens on Omnibus Wave #1, Omnibus Wave #2, and the
Custom Survey.
Table 3-1. Socio-Demographic Characteristics of the Three Samples: Omnibus-Wave #1,
Omnibus-Wave #2, and Custom Survey (Excluding Supplement)5
Omni Wave #1 Omni Wave #2 Custom
Unweighted n=502 n=478 n=1996
Weighted n=502 n=478 n=1996
Percent Percent Percent
Region of the country:
Northeast 23.5 19.0 15.2
Midwest 26.0 23.0 21.6
South 25.1 34.0* 51.0
West 25.3 24.0 12.3
County size:
Urban 40.8 56.3 31.1
Suburban 22.8 18.6 45.9
Rural 36.3 25.1 23.0
Income:
<$35,000 19.1 17.0 18.0
$35,000-$74,999 35.8 29.4 39.4
$75,000 or more 31.8 35.9 31.5
Don‟t know 0.1 0.3 0.2
Decline to answer 13.2 17.4 10.8
Ethnicity:
White 76.0* 67.1 73.9
African American 9.5 13.7 10.3
Hispanic 7.5 11.2 8.8
Asian 2.6 2.8 2.9
Other 2.1 2.4 2.5
Prefer not to say 2.3 2.8 1.4
Age:
8-10 60.4 57.7 58.8
11-12 39.6 42.3 41.2
Gender:
Male 50.9 51.5 51.5
Female 49.2 48.5 48.5
5 An asterisk in this table denotes a significant difference between the percentages for a given category of the variable between
Wave #1 and Wave #2 (at the p<0.05 level). Example: the percent of tween respondents from the South was significantly higher
on Wave #2 compared to Wave #1.

Results
3-3
One would expect the distributions to be similar across Wave #1 and Wave #2, given the same sampling
technique used in both. In contrast, the sampling for the Custom Survey was designed to provide differing
levels of media exposure to the campaign, not to be “online Census representative,” which would yield
slight variations in the socio-demographic characteristics of the sample population.
The respondents in the two waves of the Omnibus Survey were fairly well distributed across the four
geographical regions of the U.S., with a slightly stronger showing from the South in Wave #2. Over 60
percent in both waves lived in urban or suburban areas, while at least one quarter in both waves lived in a
rural area. Approximately two-thirds (65-68%) of tweens lived in homes with a household income
between $35,000-74,999. Almost one in five lived in households with an income under $35,000,
compared to approximately one-third whose household income was $75,000 or more.
The strong majority of respondents were white (67-76% on the two waves). African Americans
constituted 10-14%, with Hispanics at 8-11%. Less than three percent each identified their races as Asian,
Other, or declined to designate. On both waves of the Omnibus Survey, more of the respondents were
aged 8-10 (58-60%) than ages 11-12 (40-42%), reflecting that the younger category included three single-
year ages whereas the older included only two single years of age. The gender breakdown was 51 percent
male, 49 percent female.
The characteristics of the respondents on the Custom Survey (excluding the supplement, for which some
socio-economic data were missing) were generally similar to those on the Omnibus Surveys, with a few
exceptions. The Custom Survey had 51% of the respondents from the South, with fewer than expected
respondents from the Northeast (15%) or West (12%). The disparity reflects the geography of the
randomly selected DMAs and the oversample markets. The Custom Sample was the most “suburban” of
the three (although the difference between urban and suburban may be more statistical than reflective of a
lifestyle difference). However, the Custom Survey was fairly comparable to one or both waves of the
Omnibus Survey on income, ethnicity, age, and gender.
Table 3-2 provides greater detail on the socio-demographic characteristics of the Custom Study
respondents by age and gender. Due to the number of missing values for the supplement, the data in Table
3-2 excludes the supplement. As such, this sample population should closely resemble that of the
Omnibus Surveys.

Evaluation of the Ad Council/DOE “What’s Your Excuse” Public Service Advertising Campaign
3-4
Table 3-2. Socio-Demographic Characteristics by Age and Gender: Custom Survey (Excluding
Supplement)6
Total
Boys Girls
8-10 11-12 8-10 11-12
(1) (2) (3) (4) (5)
Unweighted n=1996 n=659 n=365 n=589 n=383
Weighted n=1996 n=624 n=404 n=549 n=419
Percent Percent Percent Percent Percent
Region of the
country:
Northeast 15.2 19.2 9.9(2)
17.0 11.8(2,4)
Midwest 21.6 18.3 25.8(2)
19.6 25.2
South 51.0 50.9 52.7 49.5 51.3
West 12.3 11.6 11.6 13.9 11.7
Place of
residence:
Urban 31.1 27.7 30.4 29.5 38.8(3,4)
Suburban 45.9 48.2 47.5 47.3 39.2(3,4)
Rural 23.0 24.0 22.1 23.2 22.0
Ethnicity:
White 73.9 72.0 75.6 75.2 73.6
African
American
10.3 11.1 9.8 9.3 11.0
Hispanic 8.8 11.0 5.3(2)
9.2 8.4
Asian 2.9 2.9 3.9 3.7 1.0(3,4)
Other 2.5 2.5 3.3 2.0 2.6
Prefer not to say 1.4 0.5 2.2(2)
0.6 3.3(4)
Income:
<$35,000 18.0 19.1 17.2 17.1 18.5
$35,000-74,999 39.4 40.8 39.2 38.2 39.1
$75,000 or more 31.5 31.2 32.3 34.1 27.9(4)
DK, decline to
answer
11.0 9.0 11.0 11.0 14.7
Mean income $71,100 $69,800 $74,400 $72,700 $67,600
Distribution by
cities:
Group 1 53.2 54.0 52.3 52.6 53.8
Group 2 36.5 35.9 36.6 37.9 35.4
Group 3 10.3 10.0 11.1 9.5 10.8
Media coverage
market:
Heavy 23.2 26.1 21.3 26.7 16.1(4)
Moderate 51.3 49.4 52.9 50.7 53.5
Low 25.4 24.4 25.8 22.6 30.5(4)
6 The superscript for a given value indicates that it is statistically different (p<0.05) from the value in the column noted in the
superscript. The column numbers are indicated in row 3.

Results
3-5
3.2 Ad Recognition from the Campaign
Category Awareness
The Custom Survey asked the generic question: “Have you seen, heard or read something about saving
energy in the past 6 months?” Almost two-thirds of the tweens (64%) reported that they had (see Table 3-
3a, excluding the supplement). Older kids (11-12) were more likely (68%) than younger ones 8-10 years
old (60%) to report this finding (p<0.05 level).
Table 3-3a. Awareness of Energy Saving Messages by Age and Gender: Custom Survey
(Excluding Supplement)7
Total
Boys Girls
8-10 11-12 8-10 11-12
(1) (2) (3) (4) (5)
Unweighted n=1996 n=659 n=365 n=589 n=383
Weighted n=1996 n=624 n=404 n=549 n=419
Percent Percent Percent Percent Percent
Has heard, seen or read
anything about saving energy
in the past six months:
Yes 63.7 58.1 65.3(2)
62.8 71.6(4)
No 19.1 24.5 16.2(2)
18.8(2)
14.0(4)
No sure 17.3 17.4 18.5 18.4 14.4
Has seen or read something
about saving energy via the
following channels
(prompted):
TV 73.5 69.1 75.2(2)
70.6 82.4(2,3,4)
School 72.3 71.2 72.1 72.0 74.7
Friends, family 68.4 67.2 68.2 70.6 67.3
Internet 34.2 27.9 35.6(2)
31.1 46.1(2,3,4)
Poster, billboard 29.8 24.8 30.7(2)
30.3(2)
35.8(2)
Magazine 28.8 23.4 27.7 28.2 38.8(2,3,4)
Radio 27.5 22.0 29.1(2)
25.5 36.9(2,3,4)
Thinks he/she is seeing or
hearing more about saving
energy (compared to a year
ago) (“buzz”):
More 62.5 58.9 64.5 60.5 68.7(4)
Less 2.7 3.5 2.4 2.8 1.9
About the same 23.5 25.3 21.6 24.1 22.1
Not sure 11.2 12.3 11.6 12.6 7.3(3,4)
When asked on the Custom Survey if they had heard something on saving energy via specific media or
sources, almost three-quarters of the tweens cited TV (74%) and school (72%), followed by
family/friends (68%). A third or less mentioned the Internet (34%), posters/billboards (30%), magazines
7 The superscript for a given value indicates that it is statistically different (p<0.05) from the value in the column noted in the
superscript. The column numbers are indicated in row 3.

Evaluation of the Ad Council/DOE “What’s Your Excuse” Public Service Advertising Campaign
3-6
(29%), or radio (28%). For all items but one, girls 11-12 were most likely to report affirmatively. Nearly
two-thirds of tweens (63%) thought they were hearing more now than a year ago about saving energy
(what advertisers call “buzz”), with no difference by age or gender.
Table 3-3b. Awareness of Energy Saving Messages by Campaign Media Intensity: Custom
Survey (Including Supplement)8
Total
Suppl.
Campaign media intensity
Heavy9 Moderate Low
(1) (2) (3) (4) (5)
Unweighted n=2496 n=500 n=984 n=1010 n=502
Weighted n=2496 n=500 n=963 n=1025 n=508
Percent Percent Percent Percent Percent
Has heard, seen or read
anything about saving energy
in the past six months:
Yes 63.1 60.8 60.2 65.1(3)
64.7
No 19.9 23.2 22.6 18.5(3)
17.6(3)
Not sure 17.0 16.0 17.3 16.4 17.7
Has seen or read something
about saving energy via the
following channels
(prompted):
TV 73.1 71.6 68.8 76.4(3)
74.7(3)
School 72.8 74.8 74.1 73.0 70.0
Friends, family 68.2 67.6 67.7 68.7 68.1
Internet 33.7 31.8 31.5 35.3 34.4
Poster, billboard 30.4 32.8 30.3 29.1 33.4
Magazine 29.4 31.6 28.4 30.6 28.7
Radio 27.6 28.2 25.6 29.2 28.4
Thinks he/she is seeing or
hearing more about saving
energy (compared to a year
ago) (“buzz”):
More 62.6 63.0 61.7 64.5 60.5
Less 3.0 3.8 3.7 2.4 2.8
About the same 23.3 22.2 23.5 22.8 23.8
Not sure 11.2 11.0 11.1 10.3 13.0
The data for variation in awareness by campaign media intensity does not show that tweens living in
higher media markets were more likely than others to be aware of energy saving messages. As explained
in Section 4, this may be because the variable used to define media intensity – “number of detections” –
was not a valid measure for donated media analysis.
8 The superscript for a given value indicates that it is statistically different (p<0.05) from the value in the column noted in the
superscript. The column numbers are indicated in row 3. 9 Heavy (n=984) includes the supplement (n=500). A statistically significant difference for heavy (which includes the
supplement), moderate and low are in relation to each other.
Results
3-7
Recognition of Specific Campaign Ads
The Custom Survey included more questions regarding recognition of specific ads than was possible on
the Omnibus surveys, although comparable data are available for the recognition of three TV ads
(storyboard format only), one radio ad, and one billboard ad, as shown in Table 2-1. If the campaign was
effective in reaching this audience, we would expect to see an increase on ad recognition between Wave
#1 and Wave #2 of the Omnibus Surveys. Theoretically, the baseline value for ad recognition prior to the
launch of the campaign should have been zero. Based on the experience of the Ad Council with 14
previous socially-oriented campaigns (although not on energy and not directed to tweens), the average
post-campaign recognition of a given TV spot is 14% of the intended audience (Goldman, 2009).
TV Ad Recognition Based on Storyboards
Prior to the launch of the campaign, the TV ads were not yet available in video form but were available in
storyboard form. Thus, the comparable data over the three surveys for recognition of the ads were based
on storyboards only. Several findings emerged, as shown in Table 3-4:
On Wave #1, 2-4% of tweens reported that they had already seen the ads on TV for “Malcolm” or
“April,” suggesting a possible social approval bias (or simply mistaking it for something else). A
surprising 15% of tweens reported that they had seen the “Tinkerbell” ad on TV, which most likely
reflects their recognition of “Tinkerbell” as a character in other media.
The percentages recognizing the ad increased between Wave #1 and Wave #2 for “Malcolm” (9
percentage points), for “April” (21 percentage points), and for “Tinkerbell” (9 percentage points).
On Wave #2, the percent of tweens that recognized the ads for “April” and “Tinkerbell” based on the
storyboard showing was far higher (23-24%) than for “Malcolm” (13%).
Although the level of ad recognition for “April” and “Tinkerbell” was similar on Wave #2, the
amount of increase for “April” over “Tinkerbell” and the apparent “ghost awareness” for “Tinkerbell”
suggests that “April” had the more extensive reach.
Because Wave #2 and the Custom Survey occurred in the same month (August 2009), we would expect
the results to be similar for the two in terms of the percent of tweens reporting to have seen or heard a
specific ad (although the differences in sampling for the Custom Survey could introduce slight variation).
In the case of ad recognition via storyboard, the percentages for Wave #2 and the Custom Survey were
within two percentage points of each other, underscoring the consistency of these responses from the two
surveys.

Evaluation of the Ad Council/DOE “What’s Your Excuse” Public Service Advertising Campaign
3-8
Table 3-4. Recognition of Specific Ads and Other Items from the Campaign: Omnibus
Wave #1, Omnibus Wave #2, and Custom Survey (Excluding Supplement)
10 In the Custom Survey, each respondent was shown a full storyboard of two of the three ads (“Malcolm,” “April,” or
“Tinkerbell”) in a random split. Thus, the n for each of these questions comes to approximately two-thirds of the full sample of
1996. An asterisk denotes a change (p<0.05) between Omnibus surveys #1 and #2.
11 In the Custom Survey, the data collection allowed for a comparison of recognition when the ad in question was shown first
versus when it was shown at all, to detect possible positioning effect. However, the percentages that recognized each ad were
virtually identical, whether it was shown first or not. Thus, in this table we present the data, irrespective of whether the
storyboard/video was shown first.
12 In the Custom Survey, each respondent was also shown the video of one of the three ads. Thus, the n for recognition of each ad
based on the viewing a video clip of it was about one-third of the full sample of 1,996. A very small number were unable to view
the video during the online survey, and these cases were excluded from analysis.
Omnibus Wave #1 Omnibus Wave #2 Custom Survey
TV ads: n= Percent n= Percent n= Percent
“Malcolm”
Based on
viewing
storyboard10
257 3.6 251 13.0* 1324 10.711
Based on
viewing video
spot12
-- -- 333 14.4 1288 14.0
“April”
Based on
viewing
storyboard
245 1.9 227 23.3* 1340 21.3
Based on
viewing video
spot
-- -- 302 29.5 1300 25.8
“Tinkerbell”
Based on
viewing
storyboard
502 15.0 478 23.8* 1328 22.2
Based on
viewing video
spot
-- -- 321 18.1 1296 23.4
Radio ads:
“Matthew” 502 4.7 478 7.2 941 6.8
“April” -- -- -- -- 922 10.8
Banner -- -- -- -- 1996 22.7
Billboards:
What‟s Your
Excuse?
502 4.0 478 8.6* 1005 11.0
“Tinkerbell” -- -- -- -- 991 19.4
Website:
“What‟s Your
Excuse?”
-- -- -- 1996 5.6

Results
3-9
TV Ad Recognition – Based on Video Clips
By Wave #2 and the Custom Survey, the TV spots were available to be shown on the survey exactly as
they appeared on TV. Respondents clicked on an icon (button) that allowed them to see and hear each
spot and to repeat the spot if desired. In a very few cases, the respondents were not able to see or hear the
video spot in full during the survey, and we excluded such cases from this analysis.
When the tween respondents viewed the ads as actual video spots instead of storyboards (Wave #2),
“April” showed by far the highest recognition: 30%. “Tinkerbell” followed in second place (with 18%),
and “Malcolm” had only 14% recognition.
The increase in recognition of the ad when seen as a video instead of a storyboard was minimal for
“Malcolm” (1 percentage point), notable for “April” (6 percentage points), and in the reverse direction for
“Tinkerbell” (falling from 24% to 18% when respondents saw the TV spot instead of the storyboard). It is
possible that when tween respondents saw the actual video clip, they were able to separate the ad from
“anything Tinkerbell” and thus did not provide the trigger response that seems to have occurred with
“recognition” of the “Tinkerbell” storyboard on the baseline (with 15% reporting to have seen an ad that
had not yet aired).
In comparing Omnibus Wave #2 and the Custom Survey based on video clips, the study found
recognition of the two to be within five percentage points, with no particular directionality. This lends
further credence to these self-reported results.
Radio Ads
The campaign included two radio ads, one about “Matthew,” the other about “April” (closely paralleling
the TV ad about the same character). The data across all three surveys for the radio spot about “Matthew”
indicate an increase from 4% to 7% between the two waves of the Omnibus survey; 7% of tweens on the
post-campaign Custom Survey also claimed to have heard it. The responses on the two post-campaign
surveys were highly consistent (7%). Only the Custom Survey included data on the “April” radio spot:
about 11 percent reported having heard it. To summarize, the percentage of teens that reported having
heard a radio spot on either of the post-campaign surveys ranged from 7-11%.
Billboards
Data from the two waves of the Omnibus Survey indicated a slight increase – from 4% to 9% – in the
percent of tweens reporting to have seen a billboard from the “What‟s Your Excuse?” campaign. The
Custom Survey produced a similar percent recognition in the post-campaign period: 11%. Only the
Custom Survey included questions about the “Tinkerbell” billboard, with 19% reporting to have seen it
(Table 3-4).

Evaluation of the Ad Council/DOE “What’s Your Excuse” Public Service Advertising Campaign
3-10
Web Banner Ads
On the Custom Survey, tweens were shown the banner ad montage (consisting of the three panels) with
the mention that “these images are from ads you may have seen on the Internet.” Almost a quarter (23%)
reported to recognize the ads.
Website
Only six percent of tweens reported seeing something about the “What‟s Your Excuse?” website (Custom
Survey only).
In short, of the 12 ads or items included in the campaign, the available data suggest that the “April” TV ad
had the greatest recognition: 30% among tweens that viewed the video clip as part of the Wave #2 survey.
Approximately a quarter of the tween respondents recognized the “Tinkerbell” TV ad, but the high
baseline number calls into question if this recognition was truly related to this ad campaign. The TV ads
for “Malcolm” (14%) did slightly better than the “What‟s Your Excuse?” billboards (9%) or the
“Matthew” radio spot (7%).
One of the objectives of the Custom Survey (and the reason for including the 500 tween supplement
respondents) was to test the hypothesis that tweens living in markets with a higher level of campaign
media intensity would be more likely than others to recognize the different ads (and to have more
favorable outcomes). The data in Table 3-5 show the percent of respondents that reported to have seen or
heard each of the 12 items, based on the Custom Survey (including the supplement). In addition, the table
reports the percentage that recognized each ad or item by campaign media intensity, including the media-
heavy supplement, as well as heavy, moderate and low media markets.
The data in Table 3-5 do not provide convincing evidence that tweens living in higher intensity media
markets were more likely than others to report having seen or heard the campaign messages. Although the
campaign saw some variation in the percentages that reported seeing or hearing specific ads across the
different levels of campaign media intensity, few of these differences achieve statistical significance at
the 0.05 level (Exceptions include seeing the TV ad for “Malcolm,” based on either storyboard or video
clip, and hearing the radio spot for “April”). In fact, at least one is counterintuitive with the trend going in
the opposite direction from what would be expected (seeing the TV ad for “April,” based on the either the
storyboard or the video clip). In the discussion in Section 4, the argument was made that the variable
“number of detections” – used to define the campaign media intensity in a given market – may not be a
valid measure of frequency of broadcast of ads for this particular campaign.

Results
3-11
Table 3-5. Recognition of Specific Ads and Other Items from the Campaign by Media
Intensity: Custom Survey (Including Supplement) 13
Total
Suppl.
Campaign media intensity
Heavy14
Moderate Low
TV ads: (1) (2) (3) (4) (5)
n= Percent Percent Percent Percent Percent
“Malcolm”:
Based on
viewing
storyboard15
1661 11.9 16.6 13.8 12.3 7.3(3,4) 16
Based on
viewing video
spot17
1614 15.1 19.6 17.4 15.5 10.0(3,4)
“April”:
Based on
viewing
storyboard
1668 21.2 21.0 19.7 24.4(3)
17.8(4)
Based on
viewing video
spot
1618 25.6 24.8 23.9 28.8 22.7(4)
“Tinkerbell”:
Based on
viewing
storyboard
1662 22.1 21.6 20.6 22.7 23.7
Based on
viewing video
spot
1617 23.6 24.6 24.5 23.6 21.9
“What‟s Your
Excuse?”
2496 6.1 8.0 7.5 5.8 4.0(3)
(continued)
13
The superscript for a given value indicates that it is statistically different (p<0.05) from the value in the column noted in the
superscript. The column numbers are indicated in row 3.
14 Heavy (n=984) includes the supplement (n=500). A statistically significant difference for heavy (which includes the
supplement), moderate and low are in relation to each other.
15 In the Custom Survey, each respondent was shown a full storyboard of two of the three ads (“Malcolm,” “April,” or
“Tinkerbell”) in a random split. Thus, the n for each of these questions comes to approximately two-thirds of the full sample of
1996. An asterisk denotes a change (p<0.05) between Omnibus surveys #1 and #2.
16 In the Custom Survey, the data collection allowed for a comparison of recognition when the ad in question was shown first
versus when it was shown at all, to detect possible positioning effect. However, the percentages that recognized each ad were
virtually identical, whether it was shown first or not. Thus, in this table we present the data, irrespective of whether the
storyboard/video was shown first.
17 In the Custom Survey, each respondent was also shown the video of one of the three ads. Thus, the n for recognition of each ad
based on the viewing a video clip of it was about one-third of the full sample of 1,996. A very small number were unable to view
the video during the online survey, and these cases were excluded from analysis.

Evaluation of the Ad Council/DOE “What’s Your Excuse” Public Service Advertising Campaign
3-12
Table 3-5. Recognition of Specific Ads and Other Items from the Campaign by Media
Intensity: Custom Survey (Including Supplement), (Continued)
Total
Suppl.
Campaign media intensity
Heavy18
Moderate Low
(1) (2) (3) (4) (5)
n= Percent Percent Percent Percent Percent
Radio ads:
“Matthew” 1169 7.1 8.3 8.0 6.2 7.2
“April” 1163 12.9 20.7 17.3 10.3(3)
9.2(3)
Banner 2496 22.7 22.6 22.1 22.0 25.2
Billboards:
“What‟s
Your
Excuse?”
1244 11.9 15.9 13.1 12.1 9.2
“Tinkerbell” 1252 11.9 20.3 19.6 19.9 19.2
Website:
“What‟s
Your
Excuse?”
2496 6.1 8.0 7.5 5.8 4.0(3)
Total Number of Campaign Items Seen/Heard
Only the Custom Survey asked respondents about ad recognition of all elements from the campaign. The
campaign surveys employed split samples. Respondents only answered the ad recognition question for
two of the three TV ads, one of the two radio ads, and one of the two billboards; but all were asked about
the banner and the website. The possible number of items seen/heard ranged from zero to seven. The
actual numbers reported by the tweens in the Custom Survey ranged from zero to five. Just under half of
respondents (46.3%) reported to have seen or heard at least one ad from the campaign.
Table 3-6 provides data on the socio-demographic correlates of having seen or heard something from the
campaign based on the Custom Survey (note: the differences reported in the bullets below are slight but
statistically significant at the 0.05 level):
The mean number of ads/items seen or heard (of a possible 7) was 0.9.
On average, girls had seen a larger number of ads than boys (1.0 vs. 0.8), and girls 11-12 reported
a higher number than those 8-10 (1.1 vs. 0.9).
Non-Caucasians reported recognition of more items (1.1) than Caucasians (0.8).
Urban tweens reported recognition of more items (1.0) than their suburban or rural counterparts
(0.8).
18 Heavy (n=984) includes the supplement (n=500). A statistically significant difference for heavy (which includes the
supplement), moderate and low are in relation to each other.

Results
3-13
Income, census region and media intensity did not influence number of ads recognized.
The mean number of items seen or heard was highly similar for the Custom Survey when one included
versus excluded the supplement data (Table 3-6), even though the supplement was designed to be “media
heavy.”
Table 3-6. Mean Number of Messages Recognized by Socio-Demographic Characteristics and
Campaign Media Intensity (Custom Survey Only)19
Excluding supplement Including supplement
Total sample 0.9 0.9
Gender and Age:
Boys 8-10 0.8 0.9
Boys 11-12 0.8 0.9
Girls 8-10 0.9 1.0
Girls 11-12 1.1 (*) 1.1
Ethnicity:
Caucasian 0.8 0.8
Non-Caucasian 1.1 (*) 1.1(*)
African-American 1.2 1.2
Hispanic 1.1 1.1
Other 1.0 1.0
Number of Missing (%) 29 (1.5%) 32 (1.3%)
Income:
<$35,000 0.9 1.0
$35,000-49,999 0.9 0.9
$50,000-74,999 0.8 0.9
$75,000-99,999 0.8 0.8
$100,000 or more 0.9 1.0
Number of Missing (%) 221 (11%) 311 (12%)
County size:
Urban 1.0 (*) 1.1(*)
Suburban 0.8 0.9
Rural 0.8 0.9
Number of Missing (%) 0 51 (2%)
Census region:
Northeast 0.9 1.0
Midwest 0.9 0.9
South 0.9 0.9
West 0.7 0.8
Media coverage markets:
Heavy market supplement 1.0 1.0
Heavy 0.9 1.0
Moderate 0.9 0.9
Low 0.8 0.9
19 (*) statistically significant (p <0.01)

Evaluation of the Ad Council/DOE “What’s Your Excuse” Public Service Advertising Campaign
3-14
3.3 Knowledge Related to Energy Savings
The Custom Survey measured tweens‟ knowledge on three key energy-saving facts, two of which were
addressed by one or more of the campaign messages (The Omnibus Survey did not include these
knowledge questions, making it impossible to compare levels of response before and after the campaign).
On all three questions, at least 70% of kids chose the correct answer (see Table 3-7a):
If a cell phone charger is plugged in, it is still using energy (true): 82%
Watching TV with the computer on saves energy (false): 73%
Energy-saving light bulbs last 6 times longer than regular bulbs (true): 71%
Knowledge of the correct answer on these three points was not strongly correlated with gender/age (see
Table 3-7a).
Table 3-7a. Knowledge Related to Saving Energy (Key Messages) by Age and Gender: Custom
Survey Only (Excluding the Supplement) 20
Total Boys Girls
8-10 11-12 8-10 11-12
(1) (2) (3) (4) (5)
Unweighted n=1996 n=659 n=365 n=589 n=383
Weighted n=1996 n=624 n=404 n=549 n=419
Percent Percent Percent Percent Percent
Responses to knowledge
questions:
If a cell phone is plugged in, it
is still using energy:
True 82.3 81.3 84.2 81.0 83.8
False 5.4 5.1 6.3 5.1 5.4
Don‟t know 12.3 13.6(3)
9.5 14.0 10.8
Watching TV the computer on
saves energy:
True 4.8 6.2(4)
4.9 3.4 4.3
False 72.9 71.0 74.9 73.53 73.5
Don‟t know 22.3 22.8 20.2 23.3 22.2
Energy-saving light bulbs last
six times longer than regular
bulbs:
True 71.2 69.2 72.7 70.7 73.5
False 2.0 2.8 2.8(5)
1.7 0.5
Don‟t know 26.7 27.9 24.5 27.6 26.0
In fact, the campaign did not address whether “watching TV with the computer on saves energy” in any
of its messages. Rather, the Ad Council included this question as a sort of control variable to see what
kids might know about energy savings without exposure to this campaign. The correct answers to this
20
The superscript for a given value indicates that it is statistically different (p<0.05) from the value in the column noted in the
superscript. The column numbers are indicated in row 3.

Results
3-15
question (73%) fell in the same range as to the other two questions covered by the campaign ads (71%-
82%), suggesting that tweens may already have had a fairly high level of knowledge on certain aspects of
energy saving. The cross tabulation in Table 3-7b tested the hypothesis that tweens living in DMAs with
high campaign media intensity would be more likely to have the correct answers to these knowledge
questions. The data show no statistically significant differences by intensity of media market, a topic to
which we return in the discussion in Section 4.
Table 3-7b. Knowledge of Key Messages Related to Saving Energy in Relation to Media
Intensity: Custom Survey Only (Including the Supplement) 21
Total
Suppl.
Campaign media intensity
Heavy22
Moderate Low
(1) (2) (3) (4) (5)
Unweighted n=2496 n=500 n=984 n=1010 n=502
Weighted n=2496 n=500 n=963 n=1025 n=508
Percent Percent Percent Percent Percent
Responses to knowledge
questions:
If a cell phone is plugged in, it
is still using energy:
True 82.5 83.2 82.5 83.7 80.1
False 5.4 5.6 6.4 4.4 5.8
Don‟t know (DK) 12.1 11.2 11.1 11.9 14.1
Watching TV with the
computer on saves energy:
True 5.7 9.4 7.0 5.4 4.0(3)
False 72.2 69.4 71.2 72.4 73.7
Don‟t know 22.1 21.2 21.8 22.2 22.3
Energy-saving light bulbs last
six times longer than regular
bulbs:
True 71.7 73.6 71.7 73.5 68.0(4)
False 2.1 2.2 2.0 1.8 2.7
Don‟t know 26.2 24.2 26.2 24.7 29.3
By contrast, the data support the association between ad recognition and correct knowledge related to
energy savings. For Table 3-7c, the knowledge question that was not addressed by any message in the
campaign was excluded. Only the knowledge questions regarding phone chargers and energy efficient
light bulbs, which were part of the campaign messaging, were included. The data in Table 3-7c
demonstrates association between ad recognition and correct knowledge about saving energy.
Respondents that recognized at least one ad were more likely than others to know the right answer to both
knowledge questions (68% vs. 57% respectively; p<0.05).
21
The superscript for a given value indicates that it is statistically different (p<0.05) from the value in the column noted in the
superscript. The column numbers are indicated in row 3. 22 Heavy (n=984) includes the supplement (n=500). A statistically significant difference for heavy (which includes the
supplement), moderate and low are in relation to each other.

Evaluation of the Ad Council/DOE “What’s Your Excuse” Public Service Advertising Campaign
3-16
Table 3-7c. Knowledge Related to Saving Energy (Key Messages) by Exposure to the
Campaign: Custom Survey Only (Including the Supplement)
Moreover, the study found a statistically significant association between recognizing a particular message
and giving the correct answer regarding the fact covered in that ad. For example, tweens that had seen or
heard the TV or radio ad about “April” were more likely (88%) than others (81%) to answer correctly that
if a cell phone charger is plugged in, it is still using energy (p<0.05). Similarly, tweens that that had seen
the TV ad on “Malcolm” or heard the radio spot on “Matthew” were more likely (82%) than others (70%)
to answer correctly that energy-saving light bulbs last 6 times longer than regular bulbs (p<0.05).
3.4 Proactive Attitudes Toward Saving Energy
All three surveys asked the tweens “how important is saving energy to you?” Over 80 percent answered
“very” or “somewhat” on all three surveys (see Table 3-8a). The percent manifesting this favorable
attitude increased from 82% on Omnibus Wave #1 to 87% on Wave #2, although the increase was not
statistically significant at the p=0.05 level. The Custom Survey showed a similar level post-campaign
(86%), underscoring the consistency in responses between the two post-campaign surveys. The variation
by age and gender was not significant at the p=0.05 level.
23 The survey tested knowledge on three questions, two of which campaign messaging addressed; thus, we omitted the third
knowledge question from this index.
Saw “April” TV and/or
heard “April” radio
Yes No
Responses to knowledge
questions: n=406 n=1225
If a cell phone is plugged
in, it is still using energy. Percent Percent
True 88.1 80.8
False 4.3 5.5
Don‟t know 7.5 13.8
p=0.000
Saw “Malcolm” and/or
heard “Matthew”
Yes No
Responses to knowledge
questions: n=239 n=1400
Energy-saving light
bulbs last six times
longer than regular
bulbs.
Percent Percent
True 82.4 69.8
False 1.0 2.0
Don‟t know 16.5 28.2
p=0.003
Recognized at least one ad
Yes No
n=932 n=1064
Number of
correct
answers on
knowledge
questions23
:
Percent Percent
0 6.0 10.4
1 26.3 32.8
2 67.8 56.8
p=0.042

Results
3-17
The Custom Survey explored tweens‟ reasons for believing that saving energy was important (or not).
Among those believing it to be important, the most common reasons were to save money (37%) and to
help the planet (31%). The next three answers all alluded to our collective fate as inhabitants of this
planet: environment (16%), future (13%), and limited supply (10%), as presented in Table 3-8a.
Table 3-8a. Proactive Attitudes Toward Saving Energy: Omnibus Wave #1, Omnibus Wave #2,
and Custom Survey (Excluding Supplement)
Omni Wave #1 Omni Wave #2 Custom
Unweighted n=502 n=478 n=1996
Weighted n=502 n=478 n=1996
Percent Percent Percent
How important is saving energy to you?
Very important 41.0 38.5 41.6
Somewhat important 40.9 48.0 43.9
Not very important 9.8 7.1 8.2
Not at all important 1.3 2.0 1.7
Don‟t know 7.0 4.3 4.7
Reasons that saving energy is
important:
(not asked on
Wave #1)
(not asked on
Wave #2)
n=1702
n=1706
Cost/money 37.2
Helps/saves the planet 30.5
Environment 16.2
Future 13.1
Limited supply 10.3
Improve Life for People 4.2
Ozone layer 0.9
Other, none (other and none) 5.7
Reasons saving energy is not important : (not asked on
Wave #1)
(not asked on
Wave #2)
n=197
n=197
Irrelevant to kids 26.3
Don‟t think about it 20.5
It is important 8.7
Alternative sources 4.3
Don‟t know/understand much 37.4
Other, no reason, don‟t know
Self-efficacy: perceived difficulty of
saving energy on a daily basis:
Very hard 7.0 5.3 5.0
Somewhat hard 31.3 26.4 25.6
Not very hard 39.8 45.5 45.0
Not at all hard 14.2 18.9 19.5
Don‟t know 7.7 3.9 4.8
How likely are you to talk to your
parents about saving energy?
Very likely 22.3 18.9 24.5
Somewhat likely 29.6 37.6 33.8
Not very likely 22.0 22.7 19.1
Not at all likely 10.8 9.8 7.9
Have already spoken 6.4 5.4 9.0
Don‟t know 9.1 5.6 5.6

Evaluation of the Ad Council/DOE “What’s Your Excuse” Public Service Advertising Campaign
3-18
Among kids that did not think that saving energy was important, the main reasons given were that it‟s
irrelevant to them and/or they just don‟t think about it.
Tweens on all three surveys responded to the question: “How hard do you think it is to save energy on a
daily basis?” (a proxy for self-efficacy). The data showed changes in the expected direction, but they
were not statistically significant. In fact, the Custom Survey results were very close to those on Wave #2,
lending further credence to the noted post-campaign level of self-efficacy. Similarly, all three surveys
asked tweens how likely they were to talk to their parents about saving energy (considered to be a
measure of behavioral intention). The observed increase from 52% to 56% from Wave #1 to Wave #2 was
not statistically significant. Tween respondents gave a similar post-campaign response to this question in
the Custom Survey. Fifty-eight percent intended to talk with their parents, confirming the post-campaign
level again. However, few on either wave of the Omnibus Survey had actually done so (6% and 5% over
the two waves of the Omnibus Survey, 9% on the Custom Survey).
Table 3-8b presents data on proactive attitudes and self-efficacy by intensity of the media market.
Admittedly, the findings are mixed. The percentage of tweens believing it is “very important to save
energy” was higher in the supplement sample and heavy media markets (48%, 45%) than in the moderate
(42%) or low (40%) (p<0.05); however, the differences in other categories did not reach statistical
significance. In terms of self-efficacy, the trend was counterintuitive: those in the highest media intensity
DMAs were most likely to report that it was very hard to save energy (p<0.05).
Table 3-8b. Proactive Attitudes Toward Saving Energy by Campaign Media Intensity: Custom
Survey (Including Supplement) 24
Total
Suppl.
Campaign media intensity
Heavy25
Moderate Low
(1) (2) (3) (4) (4)
Unweighted n=2496 n=500 n=984 n=1010 n=502
Weighted n=2496 n=500 n=963 n=1025 n=508
Percent Percent Percent Percent Percent
How important is saving energy to you?
Very 42.8 47.8 45.2 42.1 39.8(3)
Somewhat 43.1 40.0 41.5 44.1 44.2
Not very 8.0 7.4 8.0 7.9 8.6
Not at all 1.6 1.6 1.7 1.9 1.0
Don‟t know 4.4 3.2 3.6 4.1 6.4
Self-efficacy: perceived difficulty of
saving energy on a daily basis:
Very hard 5.8 8.6 6.7 5.6 4.3(3)
Somewhat hard 25.3 24.4 26.4 25.6 22.6
Not very hard 46.0 50.0 49.3 44.2 43.6
Not at all hard 18.4 14.0 13.8 19.8 24.4
Don‟t know 4.5 3.2 3.9 4.7 5.1
24
The superscript for a given value indicates that it is statistically different (p<0.05) from the value in the column noted in the
superscript. The column numbers are indicated in row 3. 25 Heavy (n=984) includes the supplement (n=500). A statistically significant difference for heavy (which includes the
supplement), moderate and low are in relation to each other.
(continued)

Results
3-19
Table 3-8b. Proactive Attitudes Toward Saving Energy by Campaign Media Intensity: Custom
Survey (Including Supplement), (Continued)
Total
Suppl.
Campaign media intensity
Heavy Moderate Low
(1) (2) (3) (4) (4)
Unweighted n=2496 n=500 n=984 n=1010 n=502
Weighted n=2496 n=500 n=963 n=1025 n=508
How likely are you to talk to your
parents about saving energy?
Very likely 25.7 30.2 29.5 23.8(3)
22.4(3)
Somewhat likely 33.9 34.2 34.7 33.3 33.7
Not very likely 18.6 16.8 17.0 20.3 18.3
Not at all likely 7.5 5.6 6.1 8.7(3)
7.4
Have already spoken 9.0 9.2 8.0 8.6 11.8(3)
Don‟t know 5.3 4.0 4.7 5.4 6.4
By contrast, ad recognition did yield the expected association to proactive attitudes (see Table 3-8c).
Those reporting to have seen at least one ad were more likely to feel that saving energy was
very/somewhat important (88%) than those that had not (83%); p<0.05). Also, those who reported to have
seen at least one ad expressed a greater likelihood that they would talk to their parents about saving
energy (70%) than those not having seen any ad (65%); (p<0.05).
Tables 3-8c. Proactive Attitudes Toward Saving Energy by Exposure to the Campaign: Custom
Survey (Including Supplement)
Recognized at least one ad
Yes No
n=932 n=1064
How important is
saving energy to
you?
Percent Percent
Very/somewhat
important
88.1 83.1
Not very/not at all
important
11.8 16.9
p=0.001
Recognized at least one ad
Yes No
n=932 n=1064
How likely are you
to talk to your
parents about
saving energy?
Percent Percent
Very/somewhat
likely
70.2 64.9
Not very/not at all
likely
29.8 35.1
p=0.012

Evaluation of the Ad Council/DOE “What’s Your Excuse” Public Service Advertising Campaign
3-20
3.5 Energy-Saving Behaviors
The Custom Survey asked tweens to describe their current level of involvement with the topic of saving
energy. Allowable survey answers were designed to classify respondents along a “stages of change”
continuum,26
ranging from “I don‟t really think too much about saving energy” on one end, to “I do things
to save energy” on the other. Although the survey variable had five possible responses, the respondents
were fairly evenly divided between the “doers” (those that do things to save energy often or once in a
while; 45%) and others that just think about saving energy or don‟t even think much about it (48%)
(Table 3-9a). This variable served as a control variable in the regression model, as a measure of
“predilection to act.”
Table 3-9a. Behaviors Related to Saving Energy by Age and Gender: Custom Survey
(Excluding Supplement) 27
Total
Boys Girls
8-10 11-12 8-10 11-12
(1) (2) (3) (4) (5)
Unweighted n=1996 n=659 n=365 n=589 n=383
Weighted n=1996 n=624 n=404 n=549 n=419
Percent Percent Percent Percent Percent
Position on “stages of change” spectrum:
I don‟t really think too much about saving
energy
13.3 15.8(4)
16.0(5)
10.9 10.3
I think about saving energy sometimes 35.2 33.6 38.8 36.4 32.4
I am planning to do something soon to
save energy
6.4 7.2 5.5 6.9 5.6
I do things to save energy once in a while 23.5 25.9(3)
19.0 22.0 26.1
I do things to save energy often 21.6 17.4 20.7 23.8(2)
25.6
Has spoken to someone about saving
energy?
Yes 55.5 54.9 53.3 58.2 54.9
No 30.6 31.8 33.6 27.7 29.8
Not sure 13.9 13.2 13.2 14.1 15.3
Unweighted n=1111 n=364 n=194 n=342 n=211
Weighted n=1108 n=343 n=215 n=320 n=230
Percent Percent Percent Percent Percent
Person spoken to about saving energy:
Parent 68.4 68.7 63.4 73.0 66.1
Teacher 61.7 65.4 58.4 63.7 56.7
Friend 36.5 30.1 29.9 37.6(2)
50.6(3,4)
Other adult 22.8 17.3 24.4 24.1(2)
27.8
Someone online 4.6 2.7 3.6 3.1 10.2(3,4)
Someone else 7.9 7.1 5.8 7.4 11.6(3,4)
26 The “stages of change model” (SCM) refers to the transtheoretical model developed by Prochaska and diClemente in the late
1970s and early 1980s in relation to smoking cessation. It posits that behavior change does not happen in one step. Rather, people
tend to progress through different stages on their way to successful change. As of 1997, the model consisted of the following six
stages: pre-contemplation, contemplation, preparation, action, maintenance and termination. It is arguably the dominant model of
behavior change programs. (Prochaska and Velicer 1997).
27
The superscript for a given value indicates that it is statistically different (p<0.05) from the value in the column noted in the
superscript. The column numbers are indicated in row 3.
(continued)

Results
3-21
Table 3-9a. Behaviors Related to Saving Energy by Age and Gender: Custom Survey
(Excluding Supplement), (Continued)
Total
Boys Girls
8-10 11-12 8-10 11-12
(1) (2) (3) (4) (5)
Unweighted n=1111 n=364 n=194 n=342 n=211
Weighted n=1108 n=343 n=215 n=320 n=230
Percent Percent Percent Percent Percent
Didn‟t speak to anyone 0.2 0.2 - 0.5 -
Personal actions to save energy in the
past 6 months (prompted):
Turned off lights 93.9 91.1 94.4(2)
96.1(2)
94.8
Shut off computers or other electronic
devices
81.5 79.5 83.7 81.4 82.3
Unplugged a video game device when not
in use
61.0 58.7 56.1 63.2 66.5(3)
Switched to energy saving bulbs 57.2 57.5 56.4 58.0 56.7
Unplugged a cell phone charger 56.9 49.7 60.3(3)
56.4(2)
65.0(4)
Talked to parents about making changes
at home to save energy
45.9 43.0 44.5 49.8(2)
46.6
Used a digital thermostat 35.9 33.5 37.3 38.9 34.3
Used natural heat/cooling/light 34.2 32.9 35.7 34.8 33.9
Used “smart” power strips 25.0 25.4 24.2 25.9 24.3
Talked to parents about Energy Star
Appliances
14.2 11.8 13.3 14.9 17.5
The Custom Survey asked tweens if they had already spoken to someone about saving energy. Just over
half (56%) had, with relatively little variation by gender or sex (see Table 3-9a). Among those that had
spoken to someone, the two most frequent responses were parent (68%) and teacher (62%). Less popular
answers were friend (36%), other adult (23%), someone online (5%), or someone else (8%).
All three surveys asked tweens “what have you done personally to save energy?” (in an unaided format).
In addition, the Custom Study asked the same question in a prompted format with 10 possible actions.
The post-campaign results from these questions were quite similar, with over 90% reporting at least one
behavior. Heading the list (based on aided recall) were turning off lights (94%), shutting off computers or
other electronic devices (82%), and unplugging a video game device when not in use (61%). Other
actions that approximately half of the respondents reported doing were: switching to energy saving light
bulbs (57%), unplugging the cell phone charger (57%), and talking to parents about making changes at
home to save energy (46%). A third mentioned using a digital thermostat or natural heat/cooling/light.
One quarter (25%) reported using “smart” power strips, and only 14% talked to parents about Energy Star
appliances (see Table 3-9a). Responses to this same question in unaided format were very similar to
those found with the aided format. Of note, the percent of tweens that reported unplugging equipment
when not in use increased for 0% to 9% (unaided recall). There was no statistically significant change
between Waves #1 and #2 on the Omnibus Survey, possibly because the baseline level was already so
high (data not shown in Table 3-9a). It was hypothesized that campaign media intensity would be
associated with taking action to save energy. However, only one of the 10 actions showed this trend at the
level of p<0.05: switched to energy saving bulbs (Table 3-9b).

Evaluation of the Ad Council/DOE “What’s Your Excuse” Public Service Advertising Campaign
3-22
Table 3-9b. Behaviors Related to Saving Energy by Media Intensity: Custom Survey (Including
Supplement) 28
Total
Suppl.
Campaign media intensity
Heavy29
Moderate Low
(1) (2) (3) (4) (5)
Unweighted n=2496 n=500 n=984 n=1010 n=502
Weighted n=2496 n=500 n=963 n=1025 n=508
Percent Percent Percent Percent Percent
Position on “stages of change” spectrum:
I don‟t really think too much about saving
energy
13.0 11.6 11.8 13.7 13.7
I think about saving energy sometimes 34.8 33.4 35.5 35.0 33.1
I am planning to do something soon to save
energy
6.6 7.4 8.0 5.9 5.6
I do things to save energy once in a while 23.3 22.4 22.4 23.3 24.8
I do things to save energy often 22.3 25.2 22.3 22.1 22.8
Has spoken to someone about saving energy:
Yes 55.8 57.0 57.3 55.7 53.2
No 30.6 30.4 30.2 30.9 30.6
Not sure 13.6 12.6 12.5 13.4 16.2
Unweighted n=1396 n=285 n=566 n=564 n=266
Weighted n=1393 n=285 n=553 n=570 n=270
Percent Percent Percent Percent Percent
Person spoken to about saving energy:
Parent 69.2 72.6 69.5 69.5 68.0
Teacher 62.2 63.9 63.9 61.5 60.0
Friend 37.2 40.0 37.5 35.9 39.3
Other adult 22.9 23.2 21.7 22.9 25.0
Someone online 4.3 3.5 3.7 4.2 6.0
Someone else 7.4 5.6 5.7 8.2 9.1
Didn‟t speak to anyone 0.3 0.7 0.5 0.0 0.6
Personal actions to save energy in the past 6
months (prompted):
Turned off lights 93.8 93.2 93.6 94.3 93.1
Shut off computers or other electronic devices 81.9 83.4 82.4 82.2 80.1
Unplugged a video game device when not in
use
61.6 63.6 64.6 59.3(3)
60.4
Switched to energy saving bulbs 58.5 63.6 60.4 59.4 53.2(3,4)
Unplugged a cell phone charger 57.7 60.8 60.3 56.8 54.4(3)
Talked to parents about making changes at
home to save energy
46.9 50.6 48.5 44.9 47.7
Used natural heat/cooling/light 35.6 41.2 37.1 35.8 32.3
Used a digital thermostat 35.5 33.8 32.2 39.0(3)
34.6
Used “smart” power strips 25.1 25.4 25.8 25.0 24.2
Talked to parents about Energy Star
Appliances
15.3 20.0 18.2 12.0(3)
16.5(4)
28
The superscript for a given value indicates that it is statistically different (p<0.05) from the value in the column noted in the
superscript. The column numbers are indicated in row 3. 29 Heavy (n=984) includes the supplement (n=500). A statistically significant difference for heavy (which includes the
supplement), moderate and low are in relation to each other.

Results
3-23
As with the other outcomes, the survey found a statistically significant association between energy saving
behavior and ad recognition. Tweens were classified by the number of energy saving behaviors they
reported: 0-3, 4-5, or 6-10. As reported in Table 3-9c, the percent tweens reporting the most energy
saving actions (6-10) was higher among those that reported to recognize at least one ad (51%) than among
those reporting to have seen none of the ads (35%); (p<0.05).
Table 3-9c. Behaviors Related to Saving Energy by Ad Recognition: Custom Survey (Including
Supplement)
Exposed to campaign (saw at least one ad)
Yes No
n=1174 n=1322
Number of energy
savings actions
reported30
Percent Percent
0-3 19.2 30.9
4-5 29.8 34.0
6-10 51.0 35.1
p=0.001
Mean # of actions
reported 5.6 4.7
p=0.000
The study also examined whether tweens that had seen either of the ads on two specific behaviors were
more likely to have performed those behaviors than others. As shown in Table 3-9d, tweens that had seen
or heard either of the “April” ads were more likely (69%) than others (53%) to report unplugging their
cell phone chargers in the past 6 months. Similarly, tweens that had seen the “Malcolm” ad or had heard
the “Matthew” ad were more likely (68%) than others (56%) to have switched to energy saving light
bulbs.
Table 3-9d. Performance of a Specific Energy-Saving Behavior by Ad Recognition of the
Relevant Spot
Saw “April” TV and/or
heard “April” radio
Yes No
Personal actions to save
energy in the past 6 months
(prompted):
n=523 n=1531
Percent Percent
Unplugged a cell phone
charger
Yes 68.9 53.3
No 31.1 46.7
p=0.000
30
Based on the 10 possible actions listed in Table 3-10a.
Saw “Malcolm” TV ad and/or
heard “Matthew” radio ad
Yes No
Switched to
energy
saving bulbs
n=323 n=1730
Percent Percent
Yes 68.3 55.5
No 31.7 44.5
p=0.000

Evaluation of the Ad Council/DOE “What’s Your Excuse” Public Service Advertising Campaign
3-24
3.6 Regression Analysis of Campaign Effects: Factors Associated with Positive
Outcomes
The campaign used multivariate analysis of data from the Custom Survey to test the hypothesis that ad
recognition and campaign media intensity would be positively associated with each of four outcomes of
interest – knowledge, proactive attitudes, intention to talk to parents, and energy-saving behavior – after
controlling for underlying motivational levels.
The two independent variables were ad recognition and campaign media intensity based on number of
detections per DMA (media market). It was hypothesized that:
The percent of tweens reporting favorable outcomes would be higher among those that
recognized at least one ad, controlling for other factors; and
Tweens living in “heavier” media markets for this campaign would report higher levels of the
desired outcomes, controlling for other factors.
“Other factors” fall into two categories: socio-demographic characteristics of the study population and
pre-existing levels of motivation. Socio-demographic characteristics include gender, age, place of
residence, race, and region of the country. Income was excluded as a defining characteristic because it
had a missing values rate of twelve percent as well as not correlating with any of the outcomes in the
bivariate analyses.
Regarding motivation, it is likely that some tweens are more interested in saving energy than others,
independent of this campaign. The theory of selective exposure generally would predict that such tweens
would be more likely to attend to the messages of this campaign, precisely because of their greater
interest in the topic. During the study, two control variables were included to serve as a proxy for
motivation. They are:
Predilection to save energy:
Measured in terms of position along the stages-of-change continuum. The survey asked: “What
best describes you?” Possible answers (from least to most): “I don’t really think too much about
saving energy,” “I think about saving energy sometimes,” “I am planning to do something soon
to save energy,” “I do things to save energy once in a while,” and “ I do things to save energy
often.”
Self-efficacy:
Measured as the perceived difficulty of saving energy. The question on the survey read: “People
do different things at home to save energy. How hard do you think it is to do this on a daily
basis?” Possible answers: “Very hard,” “somewhat hard,” “not very hard,” “not at all hard,”
and “don’t know.”

Results
3-25
Knowledge of Energy Saving Facts
In this regression, the dependent variable “knowledge” had a range of 0 to 2 (number of correct answers).
The regression results, shown in Table 3-10a, suggest that:
Age was the only socio-demographic characteristic measured in the surveys that was associated
with knowledge. Older tweens are more likely to provide the correct answers to the two
knowledge questions;
Ad recognition via TV, radio, Internet, or billboard was associated with correct knowledge of key
facts;
Both control variables (predilection to save energy and perceived difficult of saving energy) were
associated with higher knowledge scores; and
Campaign media intensity was not associated with knowledge of these key facts. Although ad
recognition was associated with knowledge in the bivariate analysis (cross tabulation above) it
did not remain significant in the presence of the two control variables.
Table 3-10a. Regression Results: Knowledge Related to Saving Energy (Dependent Variable)
Variable:
Excluding supplement Including supplement
Odds Ratio
How hard to save energy 1.19**
1.18**
Predilection to act 1.35**
1.32**
# Detections: none 0.83 0.81
# Detections: low 0.87 0.86
# Detections: moderate 1.15 1.11
Female 0.93 0.91
Age 1.10**
1.11**
Rural 0.89 0.85
Nonwhite 1.03 1.08
Northeast 0.94 0.97
South 0.98 0.95
West 0.76 0.75*
# ads recognized: 1 1.20 1.24*
# ads recognized: 2 1.45**
1.45**
# ads recognized: 3+ 1.60**
1.72**
Threshold: 1 correct answer -0.14 -0.18
Threshold: 2 correct answers 1.89 1.85
Number of observations 1,861 2,111
Pseudo R-squared 0.0404 0.0391 Notes:
Reference (omitted) categories: male, heavy number of detections, urban/suburban, white, Midwest, no ads recognized.
Significance level: ** means p<0.05; * means p<0.10.
The variable “how hard to save energy” takes values from 1 “very hard” through 4 “not at all hard.”
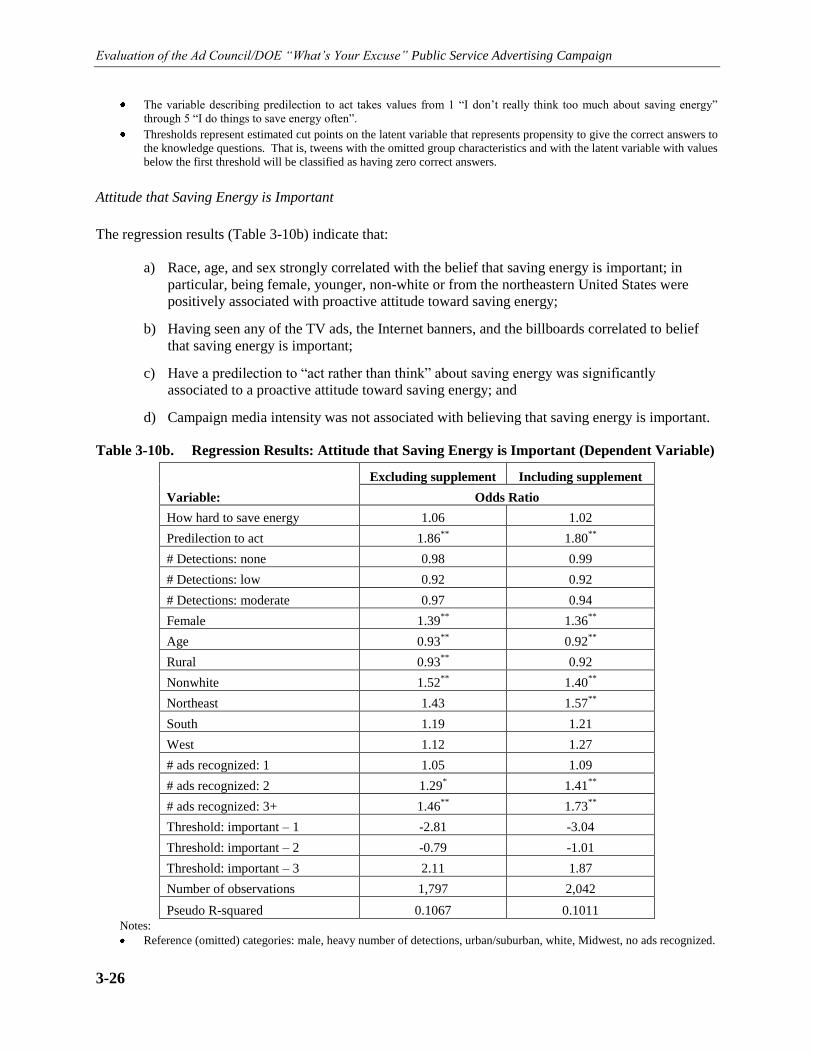
Evaluation of the Ad Council/DOE “What’s Your Excuse” Public Service Advertising Campaign
3-26
The variable describing predilection to act takes values from 1 “I don‟t really think too much about saving energy”
through 5 “I do things to save energy often”.
Thresholds represent estimated cut points on the latent variable that represents propensity to give the correct answers to
the knowledge questions. That is, tweens with the omitted group characteristics and with the latent variable with values
below the first threshold will be classified as having zero correct answers.
Attitude that Saving Energy is Important
The regression results (Table 3-10b) indicate that:
a) Race, age, and sex strongly correlated with the belief that saving energy is important; in
particular, being female, younger, non-white or from the northeastern United States were
positively associated with proactive attitude toward saving energy;
b) Having seen any of the TV ads, the Internet banners, and the billboards correlated to belief
that saving energy is important;
c) Have a predilection to “act rather than think” about saving energy was significantly
associated to a proactive attitude toward saving energy; and
d) Campaign media intensity was not associated with believing that saving energy is important.
Table 3-10b. Regression Results: Attitude that Saving Energy is Important (Dependent Variable)
Variable:
Excluding supplement Including supplement
Odds Ratio
How hard to save energy 1.06 1.02
Predilection to act 1.86**
1.80**
# Detections: none 0.98 0.99
# Detections: low 0.92 0.92
# Detections: moderate 0.97 0.94
Female 1.39**
1.36**
Age 0.93**
0.92**
Rural 0.93**
0.92
Nonwhite 1.52**
1.40**
Northeast 1.43 1.57**
South 1.19 1.21
West 1.12 1.27
# ads recognized: 1 1.05 1.09
# ads recognized: 2 1.29* 1.41
**
# ads recognized: 3+ 1.46**
1.73**
Threshold: important – 1 -2.81 -3.04
Threshold: important – 2 -0.79 -1.01
Threshold: important – 3 2.11 1.87
Number of observations 1,797 2,042
Pseudo R-squared 0.1067 0.1011 Notes:
Reference (omitted) categories: male, heavy number of detections, urban/suburban, white, Midwest, no ads recognized.

Results
3-27
Significance level: ** means p<0.05; * means p<0.10.
Variable “how hard to save energy” takes values from 1 “very hard” through 4 “not at all hard.” Variable describing
predilection to act takes values from 1 “I don‟t really think too much about saving energy” through 5 “I do things to
save energy often.”
Thresholds represent estimated cut points on the latent variable that represents degree of importance of saving energy.
For example, tweens with the omitted group characteristics and with the latent variable with values below the first
threshold will be classified as reporting “not at all important,” while similar tweens with the latent variable above the
third threshold will be classified as reporting “very important.”
This same pattern appeared if the respondent recognized the “Malcolm” ad (specifically) and the “April”
ad (specifically). However, having seen the “Tinkerbell” TV ad was not associated with a more proactive
attitude toward saving energy.
In short, tweens that reported having seen a TV ad (or specifically “April” or “Malcolm”), the web
banners, or the billboards were more likely to believe that saving energy is important, even after
controlling for pre-existing motivations.
Intention to Talk to Parents about Saving Energy
In contrast to the above, the only predictors of intention to talk with parents about saving energy were
socio-demographic characteristics (being younger and from a geographical region in the U.S. other than
the Midwest) and the predilection “to act rather than to think” about saving energy (Table 3-10c). In this
model, having seen/heard any of the campaign ads was not associated with intention to talk to parents, nor
was campaign media intensity. Curiously, having seen the “Tinkerbell” TV ad emerged as a negative
driver on this outcome.
Table 3-10c. Regression Results: Intention to Talk to Parents about Saving Energy
Variable:
Excluding supplement Including supplement
Odds Ratio
How hard to save energy 1.10* 1.05
Predilection to act 1.73**
1.71**
# Detections: none 1.20 1.20
# Detections: low 0.99 0.98
# Detections: moderate 1.08 1.07
Female 1.05 1.08
Age 0.94* 0.95
*
Rural 1.02 1.02
Nonwhite 1.13 1.09
Northeast 1.27 1.43**
South 1.27**
1.29**
West 1.52**
1.65**
(continued)

Evaluation of the Ad Council/DOE “What’s Your Excuse” Public Service Advertising Campaign
3-28
Table 3-10c. Regression Results: Intention to Talk to Parents about Saving Energy, (Continued)
Variable:
Excluding supplement Including supplement
Odds Ratio
# ads recognized: 1 0.98 0.98
# ads recognized: 2 0.96 1.00
# ads recognized: 3+ 1.05 1.19
Threshold: intention to talk – 1 -1.12 -1.24
Threshold: intention to talk – 2 0.55 0.47
Threshold: intention to talk – 3 2.35 2.28
Threshold: intention to talk – 4 4.20 4.20
Number of observations 1,769 2,013
Pseudo R-squared 0.0606 0.0596 Notes:
Reference (omitted) categories: male, heavy number of detections, urban/suburban, white, Midwest, no ads recognized.
Significance level: ** means p<0.05; * means p<0.10.
Variable “how hard to save energy” takes values from 1 “very hard” through 4 “not at all hard.”
Variable describing predilection to act takes values from 1 “I don‟t really think too much about saving energy” through
5 “I do things to save energy often”.
Thresholds represent estimated cut points on the latent variable that represents intention to talk to parents. For
example, tweens with the omitted group characteristics and with the latent variable with values below the first threshold
will be classified as reporting “not at all likely to talk to parents,” while similar tweens with the latent variable above
the fourth threshold will be classified as reporting “have already talked.”
Taking action to save energy. The regression result for this outcome were similar to those found for
believing that saving energy is important.
Race was the only socio-demographic characteristic associated with energy-savings actions; non-
whites were more likely than whites to report such actions;
Having seen any of the TV ads and the web banner were correlates of having taken action to save
energy; seeing a billboard ad was of borderline significance; this held true for “any TV ad,” the
“Malcolm” ad, or the “April” ad, but not for the “Tinkerbell” ad;
Having a predilection “to act rather than think” about saving energy and feeling that saving
energy isn‟t too hard were significantly associated to having taken action to save energy.
Campaign media intensity was not associated with having a proactive belief about saving energy.
Tweens that reported having seen a TV ad (or specifically “April” or “Malcolm”) and the web banners
were more likely to have taken action to save energy, even after controlling for preexisting motivation.

Results
3-29
Table 3-10d. Regression Results: Taken Action to Save Energy (Dependent Variable)
Variable: Excluding supplement Including supplement
Odds Ratio
How hard to save energy 1.17**
1.12**
Predilection to act 1.82**
1.75**
# Detections: none 1.04 1.05
# Detections: low 1.02 1.02
# Detections: moderate 1.20 1.18
Female 0.97 1.03
Age 1.03 1.04
Rural 0.93 0.91
Nonwhite 1.28**
1.25**
Northeast 1.07 1.20
South 1.16 1.16
West 1.10 1.19
# ads recognized: 1 1.18 1.21*
# ads recognized: 2 1.82**
1.94**
# ads recognized: 3+ 2.06**
2.25**
Threshold: action – 1 1.73 1.63
Threshold: action – 2 3.40 3.30
Number of observations 1,861 2,111
Pseudo R-squared 0.1043 0.0961 Notes:
Reference (omitted) categories: male, heavy number of detections, urban/suburban, white, Midwest, no ads recognized.
Significance level: ** means p<0.05; * means p<0.10.
Variable “how hard to save energy” takes values from 1 “very hard” through 4 “not at all hard.”
Variable describing predilection to act takes values from 1 “I don‟t really think too much about saving energy” through
5 “I do things to save energy often.”
Thresholds represent estimated cut points on the latent variable that represents propensity to practice higher number of
energy saving actions. For example, tweens with the omitted group characteristics and with the latent variable with
values below the first threshold will be classified as practicing zero to three energy saving actions, while similar tweens
with the latent variable above the second threshold will be classified as practicing from 6 to 10 actions.
In sum, the regression results showed that ad recognition was associated with two of the four outcomes
(proactive attitude and energy-saving behavior) but not with knowledge or intention to discuss with
parents.
3.7 Propensity Score Analysis
Regression analysis establishes a statistical relationship between ad exposure and outcomes of interest.
However, it does not allow for causal interpretation since ad recognition is an endogenous variable (that
is, the direction of cause-and-effect may be ambiguous). For example, a tween that has grown up in an
energy-conscious household might be more likely than his peers to pay attention when a PSA on energy
savings airs on TV. Surveys of our nature employ the propensity score matching methods to control for

Evaluation of the Ad Council/DOE “What’s Your Excuse” Public Service Advertising Campaign
3-30
the endogeneity of ad recognition in order to determine the effect of the ad campaign on energy-saving
behavior.
Propensity score matching determines ad recognition by pairing tweens exposed to ad campaign with
“equivalent” non-exposed tweens, based on their observed characteristics. It is similar to creating control
group that is statistically similar to the group of tweens that reported to recognize at least one ad.
Outcome measures for the “equivalent” non-exposed tweens will serve as a counterfactual (answering the
question: what would have happened in the absence of the campaign?). They allow us to compare the
non-exposed tweens with tweens exposed to the campaign (based on ad recognition) to determine the
effect of the ad campaign. This measure is known as the “average treatment effect on treated” (ATT). The
main underlying assumption of this approach is the conditional independence assumption (CIA), which
would mean that in studies of this type, ad recognition is solely determined by observed characteristics
(Babalola and Kincaid, 2009).
Explanatory variables (i.e., predilection to save energy, self-efficacy, campaign media intensity, and
socio-demographic characteristics) were used to calculate propensity of ad recognition. Derived
propensity score matched exposed and unexposed tweens using nearest neighbor matching. The operating
campaign survey model satisfied the balancing property (i.e., that exposed and non-exposed tweens were
considered to be statistically equivalent based on their observed characteristics).
Table 3-11a. Average Treatment Effect (ATT) of Ad Campaign on Behaviors Related to Saving
Energy (Excluding Supplement)
Number of energy savings actions reported: Treated
Matched
Controls Difference Std. Errors
Unmatched 5.683 4.885 0.799***
0.103
Average treatment effect on treated (ATT) 5.683 5.203 0.480***
0.148 Note: Significance level: *** means p<0.01.
Table 3-11a and Figure 3-1 present the results of the propensity score matching. This analytic method
created a “statistically equivalent control group” for purposes determining the effect of the campaign on
the treatment group, correcting for endogeneity of ad recognition. Prior to this analysis, the difference in
mean number of reported energy savings actions between those that recognized one or more ads
(“treatment group”) and the non-exposed (“control group”) was 0.799. After propensity score matching,
this difference was reduced to 0.48. That is, the effect of the campaign was to increase the number of
energy saving behaviors by half a behavior. This difference of 0.48, though small, is statistically
significant at the p=0.05 level, indicating that the campaign had a measurable effect on behavior. Stating
this in other words, propensity score analysis showed how much “effect” the campaign has on those
exposed to it after removing selectivity bias.

Results
3-31
Figure 3-1. Results of Propensity Score Matching: Average Treatment Effect (ATT) of Ad
Recognition on the Number of Behaviors Related to Saving Energy
Table 3-11b presents the results of a sensitivity analysis to assess the robustness of the findings to
possible deviations from the CIA. Specifically, potential unobserved confounders were simulated to
mimic the behavior of some important observed covariates, such as predilection to save energy, self-
efficacy, and race. The results of the sensitivity analysis show that the finding of the propensity score is
very robust to the potential violation of the CIA.
Table 3-11b. Results of Sensitivity Analysis of the Estimates of the Effects of Ad Recognition to
Violation of the Conditional Independence Assumption (CIA)
Potential Confounder
Comparable in Size of
Effect to …
Potential Size of
Effects on
Outcome: Odds
Ratio
Potential Size
of Effects on
Exposure
Odds Ratio
Simulated Effects of Exposure
on Outcomes When Potential
Confounders are Included ATT
(Standard Error)
How hard to save energy 0.691 0.937 0.493***
(0.173)
Predilection to act 2.578 1.455 0.428**
(0.177)
Nonwhite 1.348 1.485 0.449***
(0.174)
"Killer" Confounder 4.188 12.418 0.010 (0.215)
Notes:
Significance level: *** means p<0.01; ** means p<0.05.
Odds ratio describes the effects of the potential unmeasured confounder on the outcome/exposure if included in the
model.
“Killer” confounder is a confounder that would potentially wipe out the observed effect.
Variable describing "How hard is it to save energy" was converted to a binary variable with 1 corresponding to “very
hard” or “somewhat hard” and zero corresponding to “not very hard” or “not at all hard.”
Variable describing "Predilection to act" was converted to a binary variable with 1 corresponding to “I do things to save
energy once in a while” or “I do things to save energy often” and zero corresponding to “I don‟t really think too much about saving energy,” “I think about saving energy sometimes,” or “I am planning to do something soon.”
Another approach to sensitivity analysis involves the simulation of a “killer” confounder - a confounder
that would potentially eliminate the observed effect. That is, by simulating a confounder that could wipe
out the effect of the ad campaign, and examining the relationships between the confounder and ad
recognition, and the confounder and outcome variables, the plausibility of this unobserved variable can be
assessed. The analysis found that, in order to eliminate the effect of ad recognition on energy saving
behavior, this unobserved characteristic would have to increase the odds of ad recognition by more than
Nu
mb
er o
f En
ergy
S
avin
g A
ctio
ns

Evaluation of the Ad Council/DOE “What’s Your Excuse” Public Service Advertising Campaign
3-32
12 times, and the odds of performing energy-saving actions by more than 4 times. Thus, the existence of a
“killer” confounder appears to be unrealistic, which supports the robustness of our estimate.
Taking into account all the measured factors that determine ad recognition by creating a statistically
equivalent control group to the exposed group that recognized at least one campaign ad, the effect of the
campaign on behavior decreases as expected. However, the fact remained that a statistically significant
result was produced, indicating that the campaign did have a measurable effect on energy-saving
behavior.
Table 3-11c shows how this calculation was done in the current survey. The result for this campaign is an
effect size of r=0.09. The “effect size” refers to the magnitude of change in the desired behavior. The
interpretation of the effect size is discussed in Section 4.
Table 3-11c. Converting the Results of the Propensity Score Matching to an Effect Size
Results from the STATA (propensity score matching):
---------------------------------------------------------------
n. treat. n. contr. ATT Std. Err. t
---------------------------------------------------------------
786 476 0.480 0.148 3.251
---------------------------------------------------------------
Formula used for conversion (Rosnow, Rosenthal, and Rubin, 2000):
N
df
n
ng
gr
within
h
42
Where t is a t-test,hwithin
n
n
df
tg
2,
21
212
nn
nnnh , N is a total number of observations, 1n is a
number of the tweens exposed to ad complain, 2n is a number of tweens in the control group, n is an
average number of tweens per group, withindf is a degree of freedom for the t statistic.

4-1
4. DISCUSSION
The key findings from the evaluation appear in the Executive Summary. We will not repeat them in this
Discussion section. This section will examine issues related to measurement, the theory of change
underlying the campaign, and the effect size of this campaign in relation to other behavior change
campaigns.
4.1 Measurement Issues
Consistency of Findings between Omnibus Wave #2 and the Custom Survey
It is useful to reiterate the degree of consistency in the data between Omnibus Wave #2 and the Custom
Survey, which were conducted the same month (August 2009) among independent random samples of
tweens that were “online Census representative” of the U.S. population (excluding the supplement). In
social science research, one often wonders how robust the numbers are for self-reported data, including ad
recognition, attitudes, and behaviors. This research allowed the unusual opportunity to compare the
results from these two samples, shown in Tables 3-1, 3-4, and 3-8a. In this report we have repeatedly
commented on the consistency of findings between these two studies, which lends further credibility to
the data used in this analysis.
Measurement of Campaign Media Intensity
This analysis provided useful insights into the measure of number of detections of local broadcasts as a
proxy for potential media intensity in this type of campaign. In fact, the lack of association between
number of detections (which served to classify DMAs as “heavy, moderate, or low” on campaign media
intensity) and ad recognition or any of the outcome variables was noteworthy. In contrast, ad recognition
was consistently associated with all four outcomes in the bivariate analyses and with two of the four in the
regression analyses.
Two likely explanations emerge. First, the number of detections measures the frequency with which the
campaign ads air on local broadcast television, but not on national broadcast TV, national cable TV or
local cable TV. Given that the number of detections did not correlate with self-report of number of ads
recognized, it is highly likely that the tweens who saw the ads on TV channels were not captured in the
number of detections variable. Additionally, the ads‟ run were not necessarily targeted to tweens in terms
of channels used or times of broadcast. Because the Ad Council depends on donated media, it does not
have any control over when and where the ads appear. For example, a TV station with programming
aimed at another demographic group might run the tween-targeted PSAs in relative high rotation,
generating a lot of detections but little reach among this target audience. If exposure to the ads had no
effect on outcomes, then the campaign would not have seen the significant associations between ad
recognition and two of the four outcomes (proactive beliefs and energy saving behaviors). One additional
finding from this study is that number of local broadcast TV detections is not a useful proxy for campaign

Evaluation of the Ad Council/DOE “What’s Your Excuse” Public Service Advertising Campaign
4-2
media intensity. Detections across a more comprehensive range of media would be needed for a true test
of the association between media intensity and selected outcomes.
Measure of Energy Saving Behaviors
All three surveys measured energy saving behavior by the unaided response question, “What have you
personally done to save energy?” In addition, the Custom Survey asked “In the past six months, have you
done any of the following,” and then listed 10 possible actions. Both questions yielded very high levels of
reported behavior. Additionally, actions reported from the unaided and the prompted responses were
highly similar. In future studies, the use of the prompted question is highly recommended. It ensures that
all respondents answered the same queries for coherent assessment. Also, future studies should find ways
to “heighten the bar” for desired behaviors. Most kids probably have turned off the lights or shut down a
computer at least once in the past 6 months. The question used in the survey would be far more useful if it
was asked in reference to a short, recent time period (e.g., the last 24 hours). Alternatively, future studies
could stress the consistency of these behaviors (e.g., “When you leave a room, do you always, sometimes,
rarely, or never turn out the light?”). In this study, the number of items included in the survey (10)
allowed the campaign to achieve some variation across respondents. Future studies, however, should try
to capture consistent energy saving behaviors.
4.2 Theory of Change Underlying the Design of the Campaign
The evaluation focused on the campaign as it was implemented, not as it might have been implemented.
Nonetheless, one legitimate question relates to the theory of change underlying this campaign, that is, the
basis for believing that the particular campaigns, as designed, can be reasonably expected, based on
behavioral science principles, to lead to the expected outcomes among the intended audience. The Ad
Council provided the conceptual framework outlined in Figure 1-1. However, it is unclear that the
campaign had a strong theoretical basis. In discussing the evolution of behavior change media campaigns
(in this case, related to health), Robert Hornik – a leading figure in this field – noted that early campaigns
often tended to be prescriptive (e.g., “get a mammogram,” and “get screened for TB”). This approach did
not fit with problem perceptions, so the public did not respond with desired behaviors. Campaign planners
then began to focus on the development of health behavior choice and understanding why people do or do
not participate in particular behaviors. The process now informs behavior change efforts. Understandings
of human behavior – trying to influence the knowledge base, or the beliefs, or the social norms
underpinning the behaviors rather than just recommending new behaviors – is the way to create the
behavior change desired (Hornik 2002). Today, most major campaigns are designed around one or more
of the major theoretical models (i.e., Health Belief Model, Theory of Reasoned Action, Social Cognitive
Theory, social learning/modeling, and Stages of Change, to name the most common).
In the case of this particular campaign, the survey asked, “What are the factors that would drive a tween
to want to adopt energy-saving behaviors?” The Ad Council conducted formative research within certain
aspects of the campaign to address this unknown. Several focus groups provided valuable information on

Discussion
4-3
family dynamics related to energy consumption (e.g., energy efficiency is the parents‟ job, much of the
communication around saving energy involves “nagging,” kids are not driving the energy-saving process
in households). For a future campaign of this type, it would be important to know what causes energy
saving tweens to adopt that desired behavior. What perceptions distinguish tweens that already act in the
desired way from those that don‟t? How do tweens perceive saving energy: as “cool?” “nerdy?” What
seems lacking in the current campaign was a clear-cut understanding prior to designing the messaging of
what would appeal to tweens and make them want to change. Although funding for this campaign was
limited, future Ad Council campaigns would do well to invest more heavily in this type of formative
research.
4.3 Campaign Results in the Context of Other Behavior Change Campaigns
It is useful to consider how the results of this energy efficiency campaign for tweens compare to other
campaigns designed to change behavior. A quick review of the literature suggests that energy savings
campaigns have not been systematically evaluated in terms of effectiveness, although the “Flex your
Power” campaign in California in 2000 reportedly lowered energy use by 14 percent
(http://energy.dow.com/energy_plan/efficiency_education.htm, accessed on 1/31/10).
The Disney Ratatouille CFL campaign in 2007 reported important lessons learned about investing in
creative design versus purchasing media time, but did not include an evaluation of effectiveness. The
DOE‟s “Smart Power Echo Boomer Social Marketing initiative (www.LetsGetEnergySmart.com) targets
teens and young adults using new media, but no evaluation results are available as yet. In contrast, by far
the greatest numbers of socially-oriented behavior change campaigns in the U.S. involve public health
topics. Thus, we look to this literature on campaign effects in public health as well as to the experience of
the Ad Council to gain some perspective on the results obtained in this evaluation.
Within field literature, very few campaigns have targeted tweens 8-12 years old. The large majority target
adults and/or adolescents (e.g., smoking, HIV prevention, mammograms, high blood pressure, and family
planning). Campaigns intending to benefit children often target the care-takers, rather than the kids
themselves (e.g., immunization, placement of infants while sleeping to avoid SIDS). Perhaps the most
comparable data come from the VERB campaign (on youth physical fitness, sponsored by the Centers for
Disease Control), the Legacy Foundation‟s Truth campaign against youth smoking, and the national anti-
drug youth campaign sponsored by the Office of National Drug Control Policy.
Ghost Awareness
Ghost awareness refers to the tendency for respondents to claim to recognize an ad on the baseline survey
before it has ever been broadcast. In this survey, the percent of tweens claiming to have seen a TV ad on
the baseline survey ranged from 2% for “April” to 4% for “Malcolm” and a surprising 15% for
“Tinkerbell.” Ghost awareness on the baseline survey was 5% for the “Matthew” radio ad and 4% for the
“What‟s Your Excuse?” billboards. In fact, these percentages, with the exception of “Tinkerbell,” are

Evaluation of the Ad Council/DOE “What’s Your Excuse” Public Service Advertising Campaign
4-4
below the average of 6% ghost awareness at baseline for 14 other socially-oriented campaigns previously
conducted by the Ad Council (Goldman 2009).
At least two ghost awareness explanations are plausible within the survey results. First, survey answers
may represent a variation on the social desirability or courtesy bias that is very prevalent in survey
research. That is, respondents often want to please the interviewer by giving them what seems like the
desirable answer; similarly, they may want to appear to be “in the know” and thus might tend to claim to
recognize to a given ad for this reason. Second, in the case of this campaign, ad recognition for
“Tinkerbell” at baseline, based on a storyboard depiction of the eventual ad, was notably higher (15%)
than for the other four ads/items on the baseline (with 2-5% claiming to have seen or heard ads that had to
yet aired). In this case, it is highly likely that the tween respondents recognized the character within the
storyboard (Tinkerbell) and confused this with recognition of an ad with Tinkerbell on saving energy.
This explanation seems even more plausible when one considers that recognition of the “Tinkerbell” ad
on Wave #2 was actually lower (18%) when respondents were able to view the actual video clip of the
“Tinkerbell” spot than when they saw the “Tinkerbell” ad in storyboard format (24%).
In short, the percentages of ghost awareness found on this survey – with the exception of the “Tinkerbell”
ads – seem well within the norms for this type of campaign.
Campaign Reach
“Reach” is the term used by many evaluators of behavior change communication programs to refer to the
percent of respondents that recall having been exposed to at least one campaign ad/item (Snyder and
Hamilton 2002). In this report, we have instead used the term “ad recognition” to avoid any ambiguity,
but in this discussion section we treat the two as synonymous.
Based on meta-analysis of 48 behavior change campaigns in the United States, Snyder and Hamilton
(2002) reported average reach to be 40% of their target audience. When required to convert verbal
descriptions of campaign reach as “weak, average or high” to a percentage for some campaigns included
in the meta-analysis, the researchers considered “average reach” to be 50%. A second source of
comparative data is The Ad Council. Although these data do not relate to campaigns about energy or
campaigns targeted to tweens, the average post-campaign recognition of a given TV spot is 14% of the
intended audience (Goldman 2009).
With this perspective, the reach from this energy efficiency campaign (46%) puts it in the average range
for behavior change communication campaigns as a whole. However, the ad recognition for a single ad –
the “April” TV ad with 30% ad recognition – is dramatically higher than the average for Ad Council spots
in previous campaigns (14%).

Discussion
4-5
Effect Size
Even without truly comparable campaigns, we can nonetheless consider the average effectiveness of
campaigns aimed at other target groups to give some perspective to the results obtained from this energy
efficiency campaign. For topics for which numerous campaigns have run, researchers are able to conduct
meta-analysis, a technique that estimates the average effect of campaigns and tests for contingent
conditions that may be responsible for differential results (Snyder 2007).
Dr. Leslie Snyder, a leading scholar on meta-analysis of health campaigns, has studied campaigns in both
in the United States and in developing countries. She has found, for example, that in U.S. health
communication campaigns, the average effect size is r=0.05. Moreover, Dr. Snyder found that the effect
size of U.S. campaigns differs by the specific behavior that is promoted. For example, seat belt campaigns
(r=0.15), dental care campaigns (r=0.13), and adult alcohol reduction (r=0.11) have had the greatest levels
of success. Topics with moderate effect sizes include family planning (r=0.06), youth smoking prevention
(r=0.06), and heart disease prevention; which includes diet and physical activity behaviors (r=0.05),
sexual risk-taking (r=0.04), mammography screening (r=0.04), adult smoking cessation (r=0.04), youth
alcohol prevention and cessation (r=0.04 to 0.07), and tobacco prevention campaigns (r=0.04). Programs
with the least success to date include youth drug and marijuana campaigns (r=0.01 to 0.02).
The current analysis did not calculate effect size as the difference of two percentages but rather using a
formula (Rosenbaum et al 1983), based on the t score produced by STATA in the propensity score
matching. The effect size was r=0.09, which according to Cohen (1988) should be considered a “small
effect.”
Most of the meta-analyses have focused on behavior change. Relatively little data exists on the impact of
campaigns on knowledge, beliefs, and interpersonal communication (which would be relevant to the
Energy Efficiency campaign). Although these intermediate variables are considered important pathways
to attaining the behavior change goal, researchers have shown far greater interest in measuring the all-
important objective of behavior change (Snyder 2007). One exception has been a meta-analysis of youth
substance abuse campaigns by Derzon and Lipsey (2002), which showed very small effects on attitudes
(r=-0.01 to 0.03).
The meta-analysis by Snyder and Hamilton (2002) produced valuable insights about behavior change
campaigns, based on their meta-analysis of 48 health campaigns in the U.S. Campaigns that have an
element of enforcement/coercion (such as seat belt usage or the sale of alcohol to minors) have stronger
effect sizes than “persuasive” campaigns (such as the Energy Efficiency campaign). The meta-analysis
underscored the importance of presenting new information in the campaign; campaigns with new
information had higher effect sizes and greater reach among the target audience. Synder and Hamilton
(2002) provided evidence for the common-sense notion that campaigns with greater reach resulted in
higher effect sizes. Among persuasive campaigns, short campaigns (one year or less) were more effective
in reaching a greater portion of the target audience than longer ones (Snyder and Hamilton 2002).

Evaluation of the Ad Council/DOE “What’s Your Excuse” Public Service Advertising Campaign
4-6
As energy-savings garners increasing attention in the media, with more campaigns designed to change
behavior, it will be essential to track the reach and effectiveness of such campaigns. Moreover, it will be
important to build the evidence base that will provide guidance in the design of future campaigns. In
funding this evaluation through the Ad Council, the Department of Energy has made an important first
step in this direction.

R-1
REFERENCES
Babalola, Stella, & Kincaid, D. Lawrence (2009). New Methods for Estimating the Impact of Health
Communication Programs. Communication Methods and Measures, 3 (1), 61-83.
Cohen, J. (1988). Statistical power analysis for the behavioral sciences (2nd ed.). Mahwah, NJ:
Lawrence Earlbaum Associates.
Derzon, J.H., & M.W. Lipsey. (2002). A meta-analysis of the effectiveness of mass-communication for
changing substance-use knowledge, attitudes and behavior. In W.D. Crano and M. Burgoon (Eds.), Mass
media and drug prevention: Class and contemporary theories and research (231-258). Mahwah, NJ:
Lawrence Erlbaum Associates.
Farrelly, M.C., Davis, K.C., Haviland, M.L., Messeri, P., & Healton, C.G. (2005). Evidence of a dose-
response relationship between “truth” anti-smoking ads and youth smoking prevalence. Am J Public
Health, (95), 425-431.
Goldman, Patty. Ad Council, New York. Personal communication.
Hornik, Robert (ed). (2002). Public health communication: Evidence for behavior change. Mahwah, NJ:
Lawrence Earlham Associates.
Hornik, R., Maklan, D., & Cadell, D., et al. (2003). Evaluation of the national youth anti-drug media
campaign: Fifth semi-annual report of findings. Rockville, MD: Westat.
Huhman, M., Potter, L.D, Wong, L.F., Banspach, S.W., Duke, J.C., & Heitzler, C.D. (2005). Effects of a
mass media campaign to increase physical activity among children: Year 1 results of the VERB
campaign. Pediatrics, (116), 277-284.
Prochaska, J.O., & Velicer, W.F. (1997). The transtheoretical model of health behavior change. Am J
Health Promot, 12 (1), 38-48.
Rosenbaum, P. R., & Rubin, D. B. (1983). The central role of the propensity score in observational
studies for causal effects. Biometrika, 70 (1), 41–55.
Rosenbaum, P. R. (1987). Sensitivity analysis to certain permutation inferences in matched observational
studies. Biometrika, 74 (1), 13–26.
Snyder, Leslie & Hamilton, Mark. (2002). Meta-analysis of U.S. health campaign effects. In R. Hornik
(ed.), Public health communication: Evidence for behavior change. Mahwah, NJ: Lawrence Earlham
Associates.
Snyder, Leslie. (2007). Health communication campaigns and their impact on behavior. J of Nutrition
Education and Behavior, 39 (2), S32-S40.

Evaluation of the Ad Council/DOE “What’s Your Excuse” Public Service Advertising Campaign
R-2

A-1
APPENDIX A:
ENERGY ACTION PLAN
Source: www.LoseYourExcuse.gov

Evaluation of the Ad Council/DOE “What’s Your Excuse” Public Service Advertising Campaign
A-2

B-1
APPENDIX B:
QUESTIONNAIRE USED IN THE OMNIBUS SURVEY (BOTH WAVES)
Research Questions for Sample A (KidzEyes Omnibus)
1. How important is saving energy to you? Very important, Somewhat important, Not very
important, Not at all important, Don‟t know
2. How likely are you to talk to your parents about saving energy? Very likely, Somewhat
likely, Not very likely, Not at all likely, Have already spoken to parents about saving energy,
Don‟t know
3. People do different things at home to save energy. How hard do you think it is to do this
on a daily basis? Very hard, Somewhat hard, Not very hard, Not at all hard, Don‟t know
4. What have you personally done to save energy? (Open-ended) (Post-coded)
SPLIT SAMPLE. EACH RESPONDENT SHOWN 1 RANDOMLY SELECTED AD;
“MALCOM” OR “APRIL”. ASK Q5 ASKED ONCE FOR THE ONE AD THAT THEY
SEE. SHOW FULL-SCREEN SIZE TV AD STORYBOARD [See Appendix E, F]
These pictures and words are from a TV commercial. Please look at it carefully.
[NEXT SURVEY PAGE] SHOW THUMBNAIL OF 1ST
FRAME
5. Have you ever seen this commercial on TV? Yes, No, Not Sure
SHOW FULL-SCREEN SIZE TV AD STORYBOARD: “TINKERBELL” [See Appendix G]
These pictures and words are from another TV commercial. Please look at it carefully.
[NEXT SURVEY PAGE] SHOW THUMBNAIL OF ONLY 1ST
FRAME
6. Have you ever seen this commercial on TV? Yes, No, Not Sure
Now please listen to a commercial you may hear on the radio.
Please be patient because it may take a few seconds for you to hear it.
PLAY RADIO AD 1 = “Matthew”
If you‟d like to hear the commercial again, please click here.
RE-PLAY THE AUDIO CLIP IF THEY CLICK “here.”
Otherwise, please click Continue.
[NEXT SURVEY PAGE]
7a. Did you hear the radio commercial? Yes [CONTINUE TO Q7b]; No [SHOW THE NEXT
TEXT SCREEN]
(continued)

Evaluation of the Ad Council/DOE “What’s Your Excuse” Public Service Advertising Campaign
B-2
Research Questions for Sample A (KidzEyes Omnibus)
SHOW THIS SCREEN ONLY IF “No” IN Q.7a.
You said that you could not hear the radio commercial. Instead, please read this
description of it carefully.
SHOW DESCRIPTION: RADIO AD “Matthew” [see Appendix C]
7b. Have you ever heard this commercial on the radio? Yes, No, Not Sure
These pictures and words are from ads you may have seen on billboards.
Please look at them carefully.
SHOW FULL-SCREEN SIZE STORYBOARD: “What‟s Your Excuse Montage” [See
Appendix H]
[NEXT SURVEY SCREEN]
SHOW THUMBNAIL IMAGE
8. Have you ever seen these ads? Yes, No, Not sure
SPLIT SAMPLE. EACH RESPONDENT SHOWN 2 RANDOMLY SELECTED VIDEO AD
OF 3: “MALCOM” OR “APRIL” OR “TINKERBELL”. Q ASKED ONCE FOR EACH AD
THAT THEY SEE.
SHOW VIDEO OF TV AD.
Now please watch a commercial you may see on TV.
Please be patient because it may take a few seconds to load.
PLAY TV AD = “MALCOM” OR “APRIL” OR “TINKERBELL”
If you‟d like to watch the commercial again, please click here.
RE-PLAY THE VIDEO CLIP IF THEY CLICK “here.”
Otherwise, please click Continue.
[NEXT SURVEY PAGE]
9. Did you see the TV commercial? Yes [CONTINUE TO Q10]; No [SKIP TO THANK YOU
PAGE]
[NEXT SURVEY PAGE] SHOW THUMBNAIL OF 1ST
FRAME
10. Have you ever seen this commercial on TV? Yes, No, Not Sure
(REPEAT Q.9 AND 10 FOR SECOND RANDOMLY SELECTED AD)
DISPLAY THANK YOU PAGE
Demographic Questions (asked of parents)
Age
(continued)
B-2

Appendix B: Questionnaire Used in the Omnibus Survey
B-3
Research Questions for Sample A (KidzEyes Omnibus)
Gender
Ethnicity
Income
Demographic Data to be appended:
County Size
Census Region

Evaluation of the Ad Council/DOE “What’s Your Excuse” Public Service Advertising Campaign
B-4

C-1
APPENDIX C:
QUESTIONNAIRE USED IN THE CUSTOM SURVEY
Research Questions for Sample B (Custom Study)
1. How important is saving energy to you? Very important, Somewhat important, Not very
important, Not at all important, Don‟t know
2. [IF RESPOND „Very important‟ or “Somewhat important” at Q1:] Why do you think it is
important? (Open ended) (Skip to Q.4)
3. [IF RESPOND „Not very important‟ or “Not at all important” at Q1:] Why?
4. How likely are you to talk to your parents about saving energy? Very likely, Somewhat
likely, Not very likely, Not at all likely, Have already spoken to parents about saving energy,
Don‟t know
5. [IF SAID „HAVE ALREADY SPOKEN TO PARENTS AT Q4]: What did you say to your
parents about saving energy? (Open ended)
6. Have you spoken to anyone about what you can do to save energy? Yes, No, Not Sure
7. [IF SAID „YES‟ AT Q.6] Who did you talk to about it? Teacher, Friend, parent, other adult,
someone online (using IM, webpage, email, twitter, MySpace, Facebook, something else),
didn‟t speak to anyone about saving energy
8. People do different things at home to save energy. How hard do you think it is to do this
on a daily basis? Very hard, Somewhat hard, Not very hard, Not at all hard, Don‟t know
9. What have you personally done to save energy? (Open-ended)
10. Please answer if you think these statements are true or false. (True/False/Don‟t know to
each)
(Randomly rotate list)
If a cell phone charger is plugged in, it is still using energy
Watching TV with the computer on saves energy
Energy saving light bulbs last 6 times longer than regular bulbs
11. In the past 6 months, have you done any of the following? (Yes, No, Not Sure) (Randomize
list)
unplugged cell phone charger
unplugged video game device when not in use
used natural heat/cooling/light
turned off lights
switched to energy saving bulbs
shut off computers or other electronic device
used “smart” power strips
talked to parents about Energy Star appliances
talked to parents about making changes at home to save energy
used a digital thermostat
(others TBD)
(continued)

Evaluation of the Ad Council/DOE “What’s Your Excuse” Public Service Advertising Campaign
C-2
Research Questions for Sample B (Custom Study)
12. What best describes you? I don‟t really think too much about saving energy, I think about
saving energy sometimes, I am planning to do something soon to save energy, I do things to
save energy once in a while, I do things to save energy often
13. These days, do you think you are hearing more about saving energy than you were a year
ago, less about it, or about the same amount? More, Less, About the same, Not Sure
14. Have you ever heard of a website, LoseYourExcuse.gov? Yes, and have visited the site,
Yes, and have not been to the site, No, Not Sure.
15. [IF RESPOND „YES, AND HAVE VISITED THE SITE‟ AT Q.13, ASK]: What do you
remember reading or seeing on the website? (Open-ended)
16. Have you heard, seen or read anything about saving energy in the past six months? Yes,
No, Not sure
17. Where was that? (Radio button select Yes/No:) TV, radio, magazine or newspaper, Internet,
in school, from friends or family, in posters or billboards, not sure
SPLIT SAMPLE. EACH RESPONDENT SHOWN 2 RANDOMLY SELECTED ADS OF
THE 3: “MALCOM” OR “APRIL” OR “TINKERBELL.” Q ASKED ONCE FOR EACH
AD THAT THEY SEE.
SHOW FULL-SCREEN SIZE TV AD STORYBOARD [See Appendix E, F, G]
These pictures and words are from a TV commercial. Please look at it carefully.
[NEXT SURVEY PAGE] SHOW THUMBNAIL OF 1ST
FRAME
18. Have you ever seen this commercial on TV? Yes, No, Not Sure
(FOR NEXT AD SHOWN, STATE:
These pictures and words are from another TV commercial. Please look at it carefully.)
[NEXT SURVEY PAGE] SHOW THUMBNAIL OF 1ST
FRAME
19. Have you ever seen this commercial on TV? Yes, No, Not Sure
(continued)

Appendix C: Questionnaire Used in the Custom Survey
C-3
Research Questions for Sample B (Custom Study)
SPLIT SAMPLE. EACH RESPONDENT SHOWN 2 RANDOMLY SELECTED VIDEO AD
OF 3: “MALCOM” OR “APRIL” OR “TINKERBELL.” Q ASKED ONCE FOR EACH AD
THAT THEY SEE.
SHOW VIDEO OF TV ADS.
Now please watch a commercial you may see on TV.
Please be patient because it may take a few seconds to load.
PLAY TV AD = “MALCOM” OR “APRIL” OR “TINKERBELL”
If you‟d like to watch the commercial again, please click here.
RE-PLAY THE VIDEO CLIP IF THEY CLICK “here.”
Otherwise, please click Continue.
[NEXT SURVEY PAGE]
20. Did you see the TV commercial? Yes [CONTINUE TO Q21]; No [SHOW THE NEXT
TEXT SCREEN]
[NEXT SURVEY PAGE] SHOW THUMBNAIL OF 1ST
FRAME
21. Have you ever seen this commercial on TV? Yes, No, Not Sure
FOR NEXT AD SHOWN, STATE:
Now please watch another commercial you may see on TV.
Please be patient because it may take a few seconds to load.
PLAY VIDEO OF TV AD = “MALCOM” OR “APRIL” OR “TINKERBELL”
If you‟d like to watch the commercial again, please click here.
RE-PLAY THE VIDEO CLIP IF THEY CLICK “here.”
Otherwise, please click Continue.
[NEXT SURVEY PAGE]
22. Did you see the TV commercial? Yes [CONTINUE TO Q23]; No [SHOW THE NEXT
TEXT SCREEN]
[NEXT SURVEY PAGE] SHOW THUMBNAIL OF 1ST
FRAME
23. Have you ever seen this commercial on TV? Yes, No, Not Sure
(continued)

Evaluation of the Ad Council/DOE “What’s Your Excuse” Public Service Advertising Campaign
C-4
Research Questions for Sample B (Custom Study)
SPLIT SAMPLE. EACH RESPONDENT PLAYED 1 RANDOMLY SELECTED AUDIO
AD OF 2: ““MATTHEW”” OR “APRIL”. Q ASKED ONCE FOR EACH AD THAT THEY
HEAR.
Now please listen to a commercial you may hear on the radio.
Please be patient because it may take a few seconds for you to hear it.
PLAY RADIO AD 1 = “Matthew” OR RADIO AD 2 = “April (radio)”
If you‟d like to hear the commercial again, please click here.
RE-PLAY THE AUDIO CLIP IF THEY CLICK “here.”
Otherwise, please click Continue.
[NEXT SURVEY PAGE]
24. Did you hear the radio commercial? Yes [GO TO Q25]; No [SHOW THE NEXT TEXT
SCREEN, Q26]
25. Have you ever heard this commercial on the radio? Yes, No, Not Sure
SHOW THIS SCREEN ONLY IF “No” IN Q.24
You said that you could not hear the radio commercial. Instead, please read this
description of it carefully.
SHOW SCRIPT: RADIO AD “Matthew” [see Appendix C] or RADIO AD “April (radio)”
[see Appendix D]
26. Have you ever heard this commercial on the radio? Yes, No, Not Sure
These images are from ads you may have seen on the Internet. Please look at them
carefully.
SHOW BANNER AD MONTAGE [Note: Montage image not yet available. To see ads, go to
http://www.adcouncil.org/default.aspx?id=19]
27. Have you ever seen any of these ads? Yes, No, Not Sure
(continued)

Appendix C: Questionnaire Used in the Custom Survey
C-5
Research Questions for Sample B (Custom Study)
SPLIT SAMPLE. EACH RESPONDENT SHOWN 1 RANDOMLY SELECTED MONTAGE
OF 2: “What‟s Your Excuse OOH” OR “Tinkerbell” Outdoor. Q ASKED ONCE FOR EACH
AD SHOWN
These pictures and words are from ads you may have seen on billboards or outdoor
posters.
Please look at them carefully.
SHOW FULL-SCREEN SIZE STORYBOARD: “What‟s Your Excuse OOH Montage” [See
Appendix H] OR SHOW “Tinkerbell” Outdoor [See Appendix I]
[NEXT SURVEY SCREEN]
SHOW THUMBNAIL IMAGE
28. Have you ever seen any of these ads? Yes, No, Not sure
DISPLAY THANK YOU PAGE
Demographic Questions (asked of parents)
Age
Gender
Ethnicity
Income
Demographic Data to be appended:
County Size and Census Region

Evaluation of the Ad Council/DOE “What’s Your Excuse” Public Service Advertising Campaign
C-6

Appendix C: Questionnaire Used in the Custom Survey
C-7
APPENDIX D:
DETAILS REGARDING SAMPLING FOR THE CUSTOM SURVEY
In order to obtain a large national sample without conducting surveys in each of the 210 DMAs, C&R
Research utilized a stratified cluster sample design. The protocol was as follows:
The 210 Nielsen DMAs were divided into three strata based on market size (# of television
households)
Group 1 included all DMAs with greater than 1 million television households.
N = 30 DMAs representing 53.7% of U.S. households
Group 2 included all DMAs with a household population between 250,000 to 1
million.
N = 85 DMAs representing 35.9% of U.S. households
Group 3 included all DMAs with a household population of less than 250,000.
N = 95 DMAs representing 10.4% of U.S. households
Within each strata (group of DMAs), C&R Research randomly selected a small group of
markets in which to conduct the survey.
15 DMAs from each strata were included in the final sample plan, or 45 DMAs in
total.
Within each of the selected DMAs, they drew a sample of children ages 8-12 proportionate in
size to the percent of population that the DMA represented.
Ultimately, the sample size per DMA depended on the overall rep quota size as well
as the particular DMAs sampled.
A listing of all Nielsen DMAs, by population, and their group (strata) assignments, are
available upon request.
The augment sample included 500 interviews independent of the “rep” sample, from among 5-
10 DMAs that were identified as higher in media exposure.
Some of these DMAs may end up being the same DMAs that are included in the rep
sample.
The augment DMAs were selected in July 2009 from among the top 50 DMAs in population size. They
were: Birmingham, Greenville-Spartanville-Anderson-Asheville, Los Angeles, Indianapolis, Dallas, New
York, Phoenix, San Francisco, St. Louis and Seattle-Tahoma. To more accurately reflect the cumulative
level of support by DMA, C&R Research used data on number of detections (as a proxy for donated
media support) for the period through August 2009.
D-1
APPENDIX D:
DETAILS REGARDING SAMPLING FOR THE CUSTOM SURVEY

Evaluation of the Ad Council/DOE “What’s Your Excuse” Public Service Advertising Campaign
D-2

E-1
APPENDIX E:
RESPONSE RATES FOR THE THREE SURVEYS
The response rates and incidence rates for the three surveys were as follows:
Table E-1: Response Rates and Incidence Rates for the Three Surveys
Response rate = the number of emails sent/the number of respondents who accessed the survey.
Incidence = the number of respondents who accessed the survey and completed the survey based on
qualifying criteria.
The C&R Research panel included children 6-18 years of age. To keep in compliance of COPPA
(Children's Online Privacy Protection Act), C&R Research obtained permission from the parents of all
kids under the age of 13 for their participation in KidzEyes surveys. Once they obtained this permission,
C&R Research sent the surveys directly to the kids; all parents were notified when their child received a
survey.
The response rate for the Custom Survey is lower than for the Omnibus surveys, because C&R Research
screened for residential location in representative sample DMAs and supplemental DMAs. The surveys
were able to target for location based on information provided in their database, but in some cases people
had moved or lived just outside of the specific area they were targeting. The Omnibus surveys both
utilized a fully-representative national sample, which did not require or exclude respondents from any
particular geography or metropolitan area.
The response rates for the Omnibus Surveys are typical for C&R panel surveys among this population.
Depending on multiple factors, including respondent characteristics (such as age, gender, and location),
length of survey, methods and others, response rates typically fall between 40-60%. (Personal
communication, C&R Research).
Response Rate Incidence Rates
Omnibus 2008 47% 100%
Omnibus 2009 40% 94%
Custom 2009 45% 73%

Evaluation of the Ad Council/DOE “What’s Your Excuse” Public Service Advertising Campaign
E-2

F-5
APPENDIX F:
WEB AND DONATED MEDIA STATISTICS - ANALYSIS OF TRAFFIC TO
WEBSITES PROMOTED BY THE CAMPAIGN31
One of the primary campaign goals is intended increased tweens website traffic on the domain
www.LoseYourExcuse.gov. In addition, the advertising done in collaboration with Disney aimed at 8-9
year olds urged them to visit www.energy.gov/tink. The data in Figures F-1, F-3, and F-4 summarize the
number of visits to these two websites, defined as the numbers of sessions during which visitors
interacted with the site content (i.e., viewed a page or downloaded a file).
Figure F-1 shows that site www.LoseYourExcuse.gov received 4,000 visits in the first month of
campaign implementation, September 2008. The following month, the website traffic jumped to almost
7,000 visits. Although activity decreased slightly in November and December 2008, the numbers climbed
steadily during the first three months of 2009. During this time, website activity reached its highest point
of over 8,000 visits a month (March 2009). However, from April to December 2009, the number of visits
gradually declined, to a concluding rate of around 5,000 at the end of the evaluation period (September
31 The Ad Council provided the data on website traffic used in the section and shown on Figures F-1 through F-4.
Figure F-1. Consumer Response: LoseYourExcuse.gov Visitor Sessions (Visits)
F-1

Evaluation of the Ad Council/DOE “What’s Your Excuse” Public Service Advertising Campaign
F-2
2009) and fewer than 4,000 by the last month for which data were available (December 2009). Overall,
the domain received over 93,000 visits between September 2008 and December 2009, with an average of
5,800 visits per month.
Figure F-2 shows the amount of media donated in each month from September 2008 to September 2009.
The total amount came to $41,041,261, driven primarily by radio and TV. According to the Ad Council,
the spikes in February and April were due largely to increases in radio support, whereas the July 2009
increase resulted from a boost in TV support.
Figure F-2. Donated Media, September 2008 – September 2009

F-7
Figure F-3 combines data for website visits and levels of donated media by month from September 2008
to December 2009. Although the level of donated media fluctuated by month, there is an observable
generally upward trend from $2.2 million a month beginning in September 2008 that reaches a high of
$4.4 million in April 2009. After April, the level of donated media decreased for two months, spiked and
then ended at a level of $2.8 million a month in September 2009.
Although both number of visits to the website and levels of donated media fluctuated, the gradually
increasing level of visits to the website from September 2008 to March 2009 corresponded with the
gradually increasing levels of donated media between September 2008 and April 2009. Similarly, both
lines gradually decline after the March-April period. The subsequent spike in donated media in July-
August 2009 was not matched with a regeneration of interest in visiting the website.
Figure F-3. Total Donated Media and Website Visitors
F-3
Appendix F: Web and Donated Media Statistics – Analysis of Traffic to Websites Promoted by the Campaign

Evaluation of the Ad Council/DOE “What’s Your Excuse” Public Service Advertising Campaign
F-2
The trend in visitors to the second website www.energy.gov/tink showed a different pattern and attained a
much greater number of visits, as shown in Figure F-4. Data on number of visits to the additional
websites were available from August 2008 to December 2009. In terms of the overall activity pattern, the
number of visits per month was relatively low during the first six months, jumped abruptly in the period
from February to June 2009 and more than doubled in July and August. The high activity periods
corresponded to the summer break period for respondents. Activity levels dropped in September, but
regained an upward trend in October, an all-time high in November and a slight decline in December
2009.
Figure F-4. Statistics for EERE “Tinkerbell” Site - www.eere.energy.gov/kids/
August 2008 – December 2009
2009
Metrics Jan Feb Mar Apr May Jun Jul Aug Sept Oct Nov Dec
Visitors 9,887 158,170 137,668 145,094 100,855 129,548 281,764 406,078 227,221 302,679 469,091 394,674
Visits 13,154 190,221 167,971 182,147 116,168 150,807 398,994 611,756 285,317 373,615 627,112 513,857
Page Views 58,188 339,107 297,059 349,455 222,134 260,583 514,677 767,297 425,029 607,779 875,720 765,647
Action
Plan
Download
937 2,976 2,855 2,809 2,055 2,435 2,787 3,418 3,186 5,028 5,513 5,581
F-4

F-9
Terms
Visits
Sessions during which visitors interacted with the site content (i.e., viewed a page or
downloaded a file.)
Page Views
Number of times a Web page was viewed or a file was downloaded.
File Downloads
Number of times a file (such as a PDF or Word, Excel, or PowerPoint file) was
downloaded.
Direct Traffic
Visitors typed the URL directly into their browser, accessed the site via a bookmark, or
clicked on an email, shortcut or direct link.
In comparison to the average of 5,800 visits a month to the www.LoseYourExcuse.gov site, the
www.energy.gov/tink site had 20 to 125 times the number over the campaign implementation period. By
month 6, it recorded over 13,000 visits and jumped in a single month to over 190,000. By summer it
attracted from 400,000 (July) to over 600,000 visits (August). Even in its September “slump,” it received
over 285,000 visits.
Those monitoring the www.energy.gov/tink website were unclear as to the driver of this level of traffic to
the website. It was the most visited/viewed page on www.energy.gov/eere from January through May
2009. The increased level of traffic was unique to the “Tinkerbell” site; no other EERE site experienced
it. Nothing in the “Tinkerbell” statistics explained this trend, and webmaster inquires and searches on
Yahoo and Google revealed little. In May, the DOE and Ad Council learned that the high levels of traffic
appeared to be related to an ad server program (malware) linked to www.energy.gov/tink. The website
traffic to the site attained dramatically higher levels in the months that followed.
F-5
Appendix F: Web and Donated Media Statistics – Analysis of Traffic to Websites Promoted by the Campaign