
Evaluation of RT-PCR data using -...
42
Transcript of Evaluation of RT-PCR data using -...
Evaluation of RT-PCR using
A (extremely) short introduction to RT-PCR
CT-value
Import ct-values => Expression matrix
Edit the header / data
Analyze / view your data
dCT-Calculation
ddCT – Calculation
Christian Schwager, 2013, [email protected]

PCR - run certain number of cycles (e.g. 30) - analyse amplified product e.g.on agarose gel Problem: some gene is already amplified, some other gene not vsibile yet Solution: take aliquots after certain number of cycles (e.g. 10,15,20,25) and analyze RT-PCR Continuously monitor amount of synthesized dsDNA - find when „exactly“a certain „amount“ of dsDNA is synthesized for each sample - monitor dynamics - direct access to quantitative data
Christian Schwager, 2013, [email protected]

Online detection - fluorescence measurment Sybr green: - doesn't fluoresce by itsself - intercalates into dsDNA => now it emits Advantage: - simple - cheap Problem: - stain any kind of dsDNA - length dependant – 2xPCR product length mimiques 2x higher expression - sequence dependant ??
Toto-1 dye, ABI
Christian Schwager, 2013, [email protected]
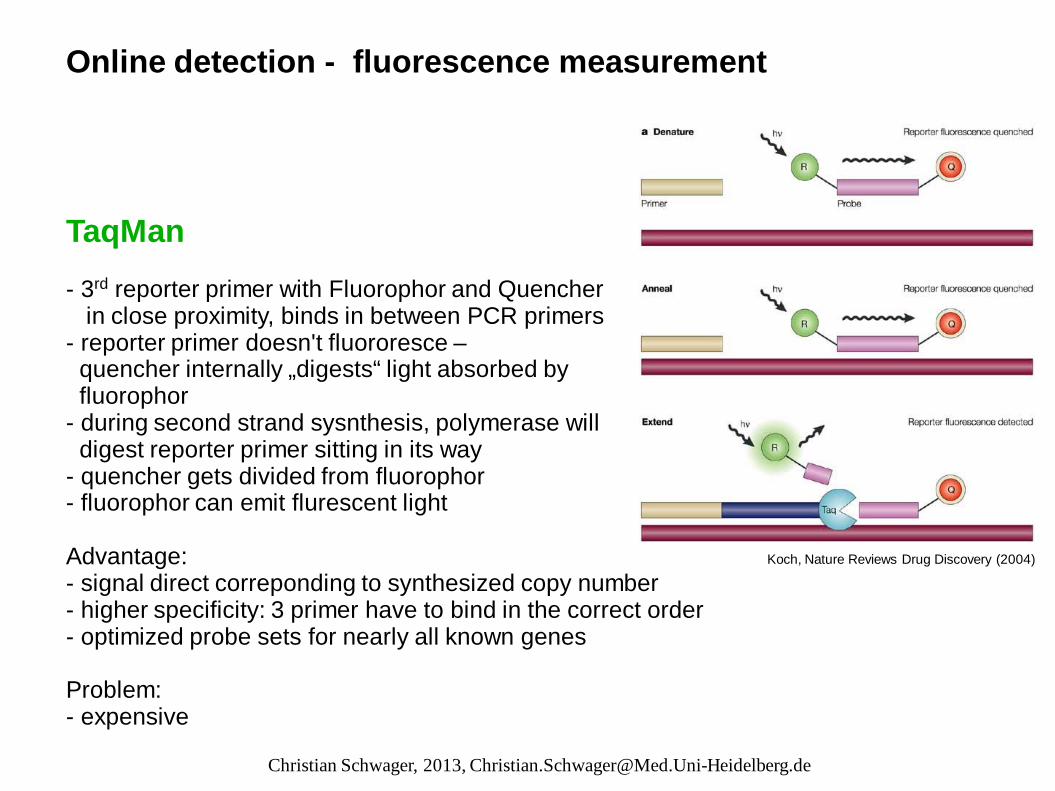
Online detection - fluorescence measurement TaqMan - 3rd reporter primer with Fluorophor and Quencher in close proximity, binds in between PCR primers - reporter primer doesn't fluororesce – quencher internally „digests“ light absorbed by fluorophor - during second strand sysnthesis, polymerase will digest reporter primer sitting in its way - quencher gets divided from fluorophor - fluorophor can emit flurescent light Advantage: - signal direct correponding to synthesized copy number - higher specificity: 3 primer have to bind in the correct order - optimized probe sets for nearly all known genes Problem: - expensive
Koch, Nature Reviews Drug Discovery (2004)
Christian Schwager, 2013, [email protected]
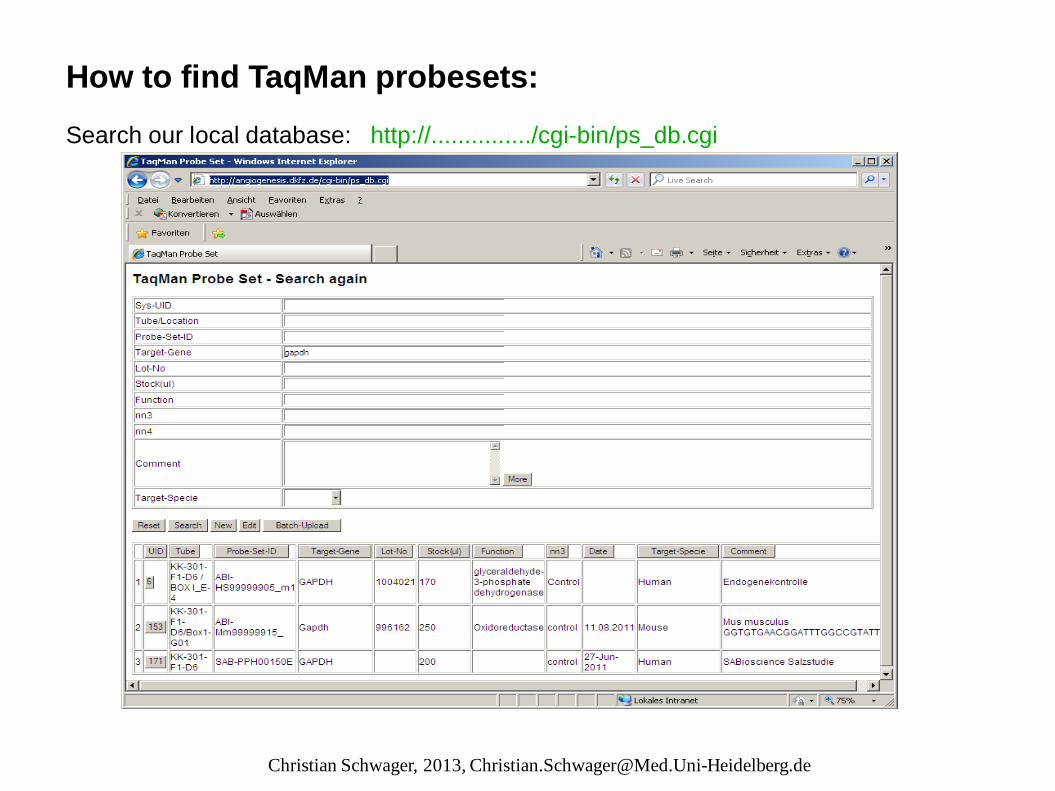
How to find TaqMan probesets: Search our local database: http://.............../cgi-bin/ps_db.cgi
Christian Schwager, 2013, [email protected]
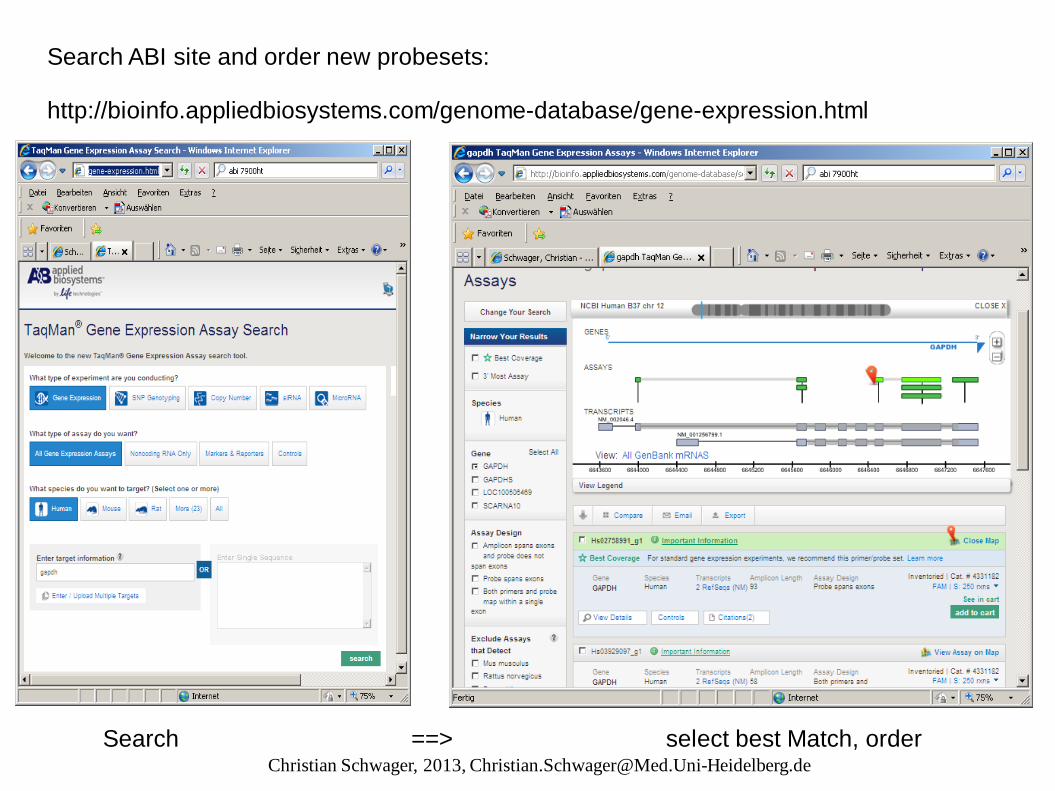
Search ABI site and order new probesets: http://bioinfo.appliedbiosystems.com/genome-database/gene-expression.html
Search ==> select best Match, order Christian Schwager, 2013, [email protected]
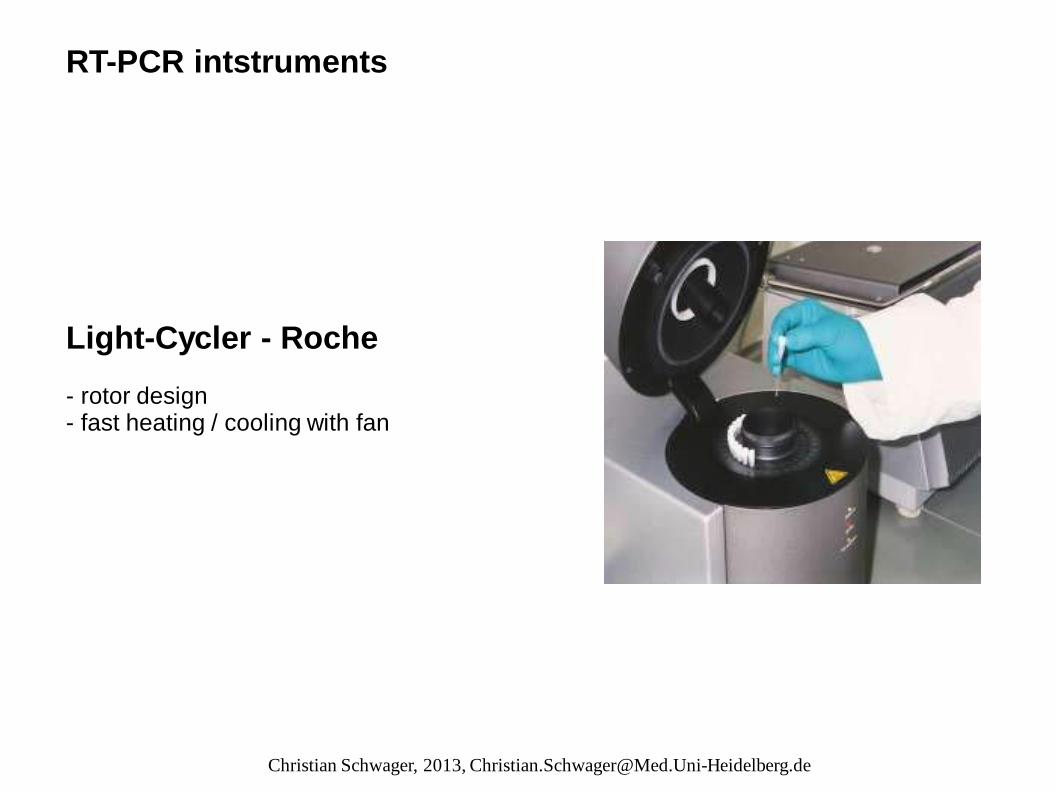
RT-PCR intstruments Light-Cycler - Roche - rotor design - fast heating / cooling with fan
Christian Schwager, 2013, [email protected]
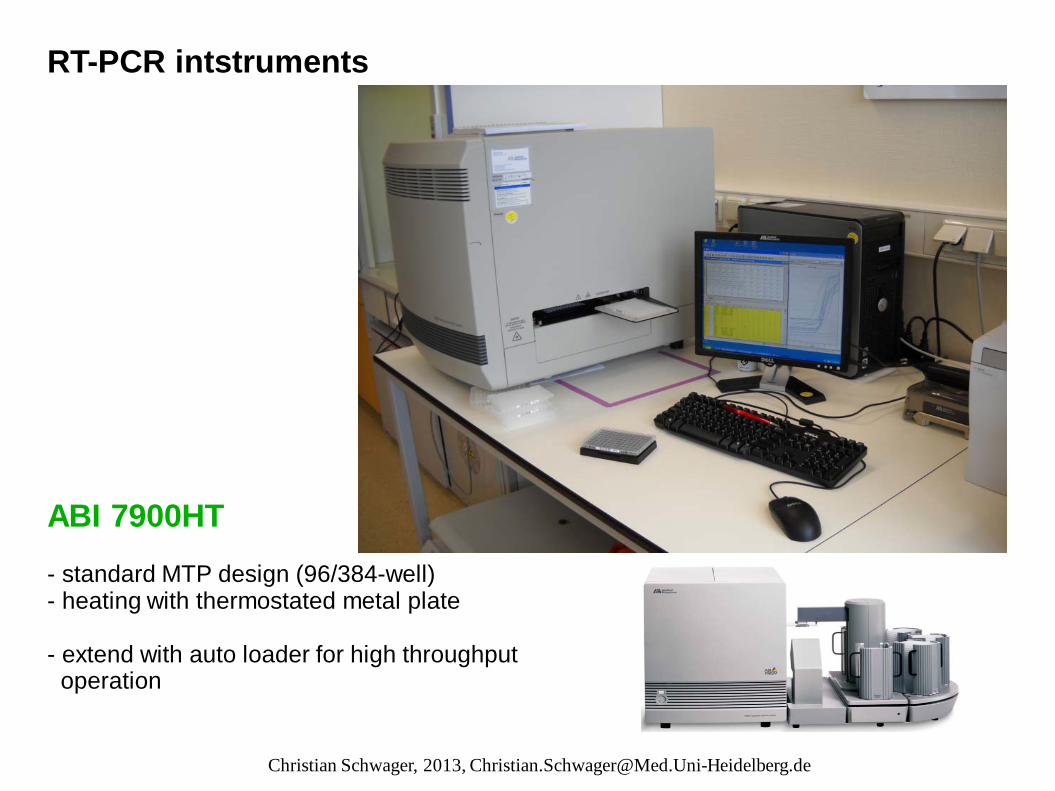
RT-PCR intstruments ABI 7900HT - standard MTP design (96/384-well) - heating with thermostated metal plate - extend with auto loader for high throughput operation
Christian Schwager, 2013, [email protected]

Evaluation - CT value - measure fluorescence - define background level and noise at first few cylces => define threshold - as soon as flourescence larger threshold => CT (Cycle at which Threshold crossed) - CT gives the number of PCR cycles required to generate the same amount of PCR product Important: - as higher the CT - as more cycles required to synthesize a given Amount of DNA - as less starting DNA - CT is ~log2: 10 cycles difference => 2^10 => ~1000 times less starting material
Christian Schwager, 2013, [email protected]

CT-values As more cycles as higher the probaility you are amplifying also artifacts - contaminating RNAs / DNAs - unspecific hybridisations - primer / primer bindings … cDNAs with CT>36 are probably meaningless Don't use them for quantification, only information „very low signal“) CT of 36 means you need to generate 2^36 ~ 60 000 000 000 copies of your original whatever !! miRNAs with CT>33 are probably meaningless
Christian Schwager, 2013, [email protected]

Compute CT-values ABI SDS software for a single plate ABI RQ-Manager for multiple plates (up to 10) - export Amplification data as text files - convert with SUMO into expression matrix, which you can evaluate with SUMO or any other software.
Christian Schwager, 2013, [email protected]

Import ct-values => Expression matrix Import raw CT-values from RQ-manager exported „amplification data“ SUMO File Import ABI rt-Amplification data
Part of a CT-matrix Christian Schwager, 2013, [email protected]

Import ct-values From the file dialog select one (or multiple) exported amplification data files. A preview shows a part of the first selectd data file: Verify: - The selected data file(s) have the correct structure - The CT column is grayed Click OK-button to import the data into SUMO
Christian Schwager, 2013, [email protected]

Import ct-values A parameter dialog opens up: Average replicas: SUMO detects replicates (i.e. IDENTICAL Gene AND sample name). Define how to average replicas: - Arithmetic mean - Median mean (less sensitive to outliers, recommended)
Remove outliers: Try to detect obvious outliers, applying the standard statistical Grubbs test. Only use ful for larger replica numbers ( >=5 ) Replace non numeric values: RQ-manager exports „not detected“ for each PCR where threshold value was never crossed. But with „not detected“ you can‘t calculate nor generate graphs – it is not a number. For most subsequent tasks, SUMO will ignore „non numerical values“. Another solution could be to set the „not detected“ to the maximum number of PCR cycles (as defined on the cycler, in our case most often 40).
Christian Schwager, 2013, [email protected]

Import ct-values A parameter dialog open up: Replace empty matrix cells: In case you have mixed samples with different probesets (e.g.samples S1..S4 with probesets P1..P3, and samples S5..S8 with probesets P4..P6). The way SUMO will build the expression matrix, it will leave the complementary matrix cells Empty. It may be useful to replace such values with a fixed value (e.g. 40).
Christian Schwager, 2013, [email protected]
S1 S2 S3 S4 S5 S6 S7 S8
P1 21 22 21 22 NAN NAN NAN NAN
P2 22 23 22 23 NAN NAN NAN NAN
P3 30 31 32 31 NAN NAN NAN NAN
P4 NAN NAN NAN NAN 24 25 24 25
P5 NAN NAN NAN NAN 28 29 28 29
P6 NAN NAN NAN NAN 27 26 25 26
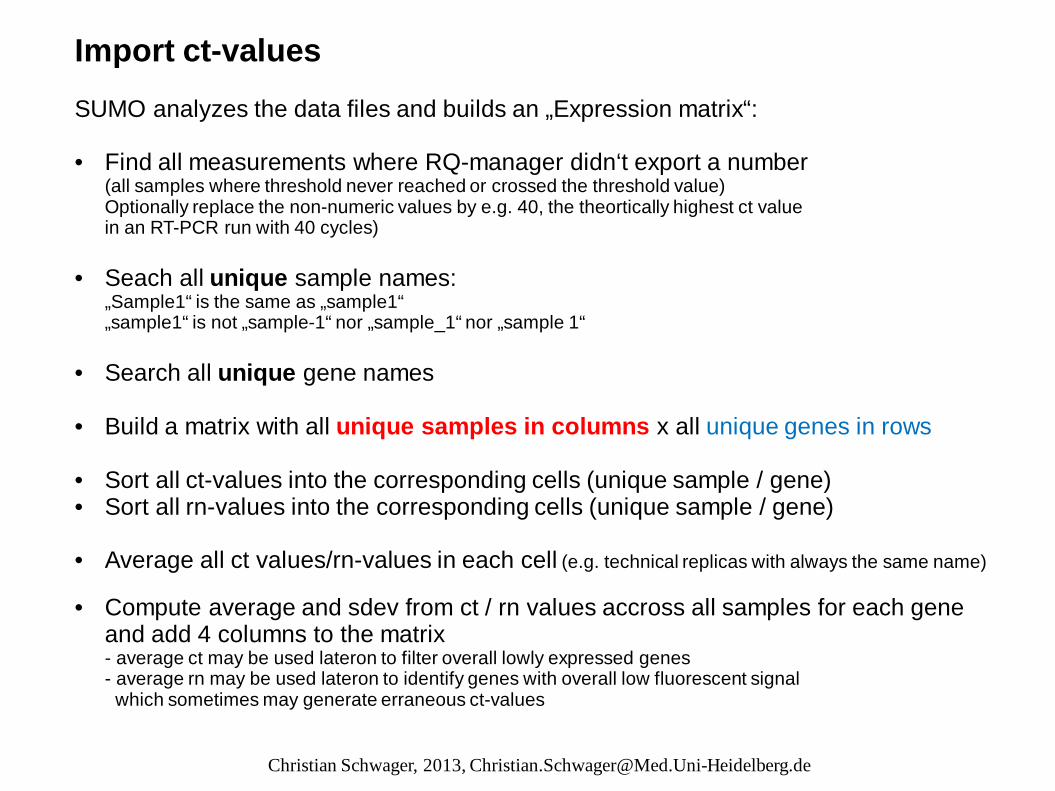
Import ct-values SUMO analyzes the data files and builds an „Expression matrix“: • Find all measurements where RQ-manager didn‘t export a number
(all samples where threshold never reached or crossed the threshold value) Optionally replace the non-numeric values by e.g. 40, the theortically highest ct value in an RT-PCR run with 40 cycles)
• Seach all unique sample names: „Sample1“ is the same as „sample1“ „sample1“ is not „sample-1“ nor „sample_1“ nor „sample 1“
• Search all unique gene names
• Build a matrix with all unique samples in columns x all unique genes in rows
• Sort all ct-values into the corresponding cells (unique sample / gene) • Sort all rn-values into the corresponding cells (unique sample / gene)
• Average all ct values/rn-values in each cell (e.g. technical replicas with always the same name)
• Compute average and sdev from ct / rn values accross all samples for each gene
and add 4 columns to the matrix - average ct may be used lateron to filter overall lowly expressed genes - average rn may be used lateron to identify genes with overall low fluorescent signal which sometimes may generate erraneous ct-values
Christian Schwager, 2013, [email protected]
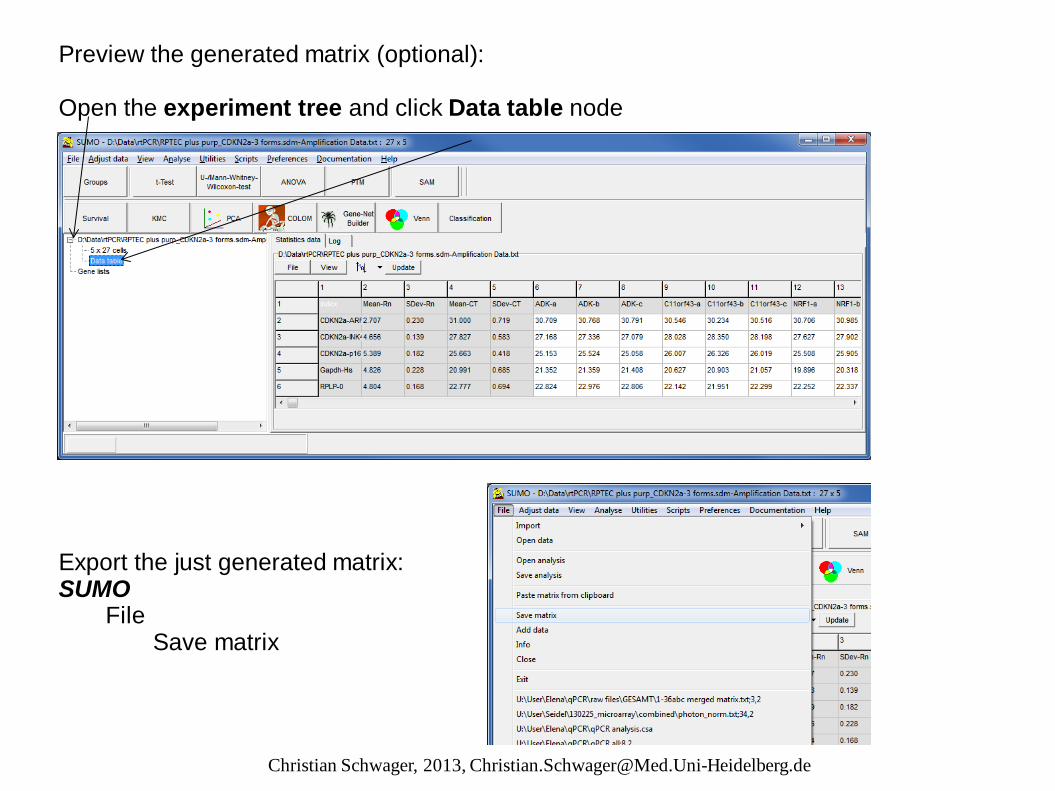
Preview the generated matrix (optional): Open the experiment tree and click Data table node Export the just generated matrix: SUMO File Save matrix
Christian Schwager, 2013, [email protected]

Edit the header – Sample annotations (optional): It may be useful to have additional header rows containing treatment details: - Cell type (fibroblasts, endothelial, a549, …) - Phenotype (healthy, primary cancer, recurrent, metastasis, …) - Kind of treatment (drug1, drug2, ….) - Dose ( 10mg, 20mg, …) - … This may help lateron to (auto-) group the samples for statistic tests / graphs SUMO Experiment tree Data table Context menu Edit header A basic table editor opens-up:
Christian Schwager, 2013, [email protected]

Edit the header – Sample annotations (optional): Select a line by Insert / delete Copy / Paste clicking the row header: rows rows Edit the contents of any header cell, any way you like. When done update the data matrix into SUMO:
Christian Schwager, 2013, [email protected]

Edit the data (optional): - Change any
data annotation / matrix cell
- Rearrange data colums to sort samples in any convenient order: Click into a column header cell, and drag the seöected column wherever you like it
- Click Update button to save modifications to SUMO data matrix.
Christian Schwager, 2013, [email protected]

Analyze / view your data One picture is better then 1250 numbers – View the data as heatmap
- Black = low ct-value => higz abundance - Bright red = high ct-value => low abundance
SUMO View Heatmap Look at control genes Identify obvious outliers (genes or samples) Identify interesting genes
Christian Schwager, 2013, [email protected]
Endogenous controls CT value is influenced by - total number of grown cells - efficiency of cell harvesting - efficiency of RNA extraction - RNA quality what if RNA is degraded in such a way, that one of the PCR primer sites is affected in one of the genes ? - RNA concentration measurement - pipetting accuray - RT-PCR instrument Use controls to estimate all effects and compensate them by normalisation => Control genes Best would be a reference which is included in your sample => Endogenous controls - Genes which are always expressed at high level, whatever the cell is doing - Genes sitting deeply inside vital metabolic pathways What if the pathway of your endogenous control gene is affected by your treatment? You would normalize your regulation effect out. => Multiple control genes, from different vital metabolic pathways
Christian Schwager, 2013, [email protected]

View endogenous controls Use multiple endogenous control genes from different pathways Gapdh - energy metabolism Rpsxx / prlxx - protein synthese pathway Hprt1 - salvage pathway (purines) Actb UBC .... Review the controls and - DON'T use obvious outliers - Don‘t use controls which follow the treatment groups (regulated too) Use average (mean or median) from controls to normalize your samples
Christian Schwager, 2013, [email protected]
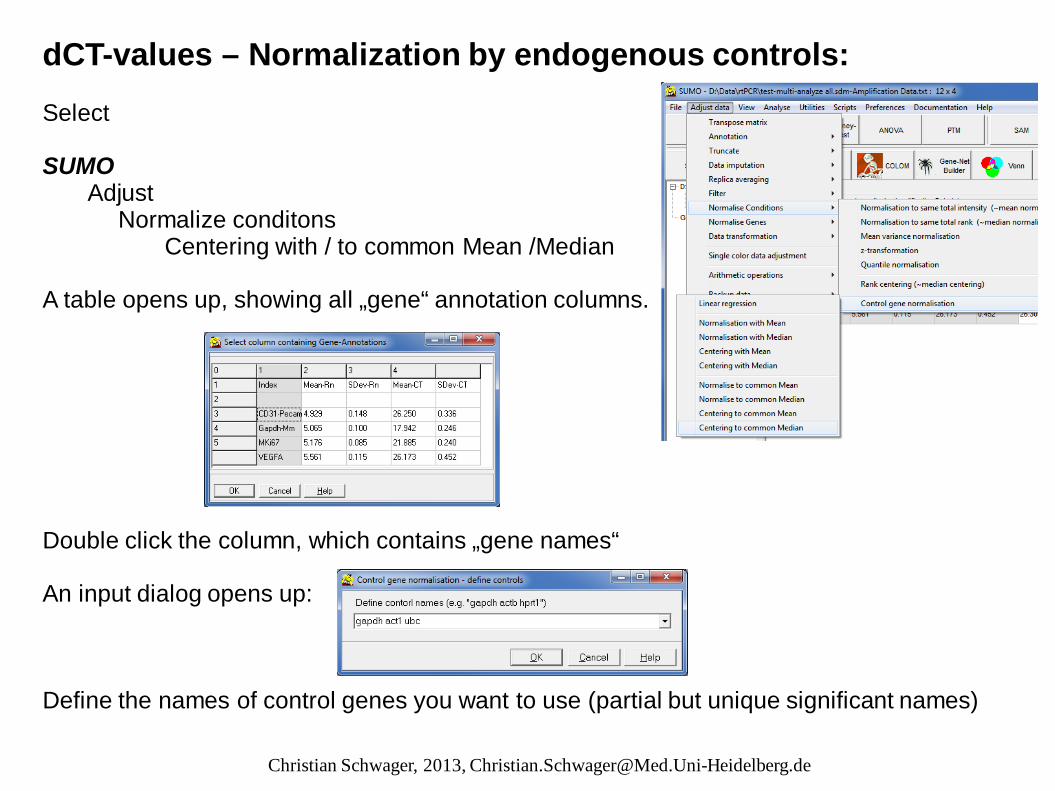
dCT-values – Normalization by endogenous controls: Select SUMO Adjust Normalize conditons Centering with / to common Mean /Median A table opens up, showing all „gene“ annotation columns. Double click the column, which contains „gene names“ An input dialog opens up: Define the names of control genes you want to use (partial but unique significant names)
Christian Schwager, 2013, [email protected]

Normalization – Centering ?? Your CT-values are ~log-2 (doubling of DNA per PCR-cycle) Thus, normalization has to be done by SUBTRACTING (=centering) the respective reference value (With linear intensities you would divide.)
Christian Schwager, 2013, [email protected]

dCT-values – Normalization with endogenous controls: For each individual sample, - compute average ct from the respective control(s) - Subtract this average from the genes to analyze - => dCT Now the, the dCT show relative CT-changes against the sample‘s control(s). Information about averall ct level is lost. Look at the example: After centering with endo-controls, most interesting gene seems to be CTCFL: Largest ct-difference between groups !!
Christian Schwager, 2013, [email protected]

Instead of centering with, you could also center to the endo controls. - Compute a grand average from all endo controls in all samples - Shift all CT-values up/down in each sample for all tested genes in such a way,
that the average of endo-controls in this sample will get the grand average (i.e. virtually dilute/concentrate your starting material to same amount, defined by controls)
- sample individual effects are removed - overall information about expression is kept After centering to control, it is abvious: CTCFL is useless: - signal levels above 36 !! - In two treatment groups even around 40
Most interesting: PARP4
Christian Schwager, 2013, [email protected]
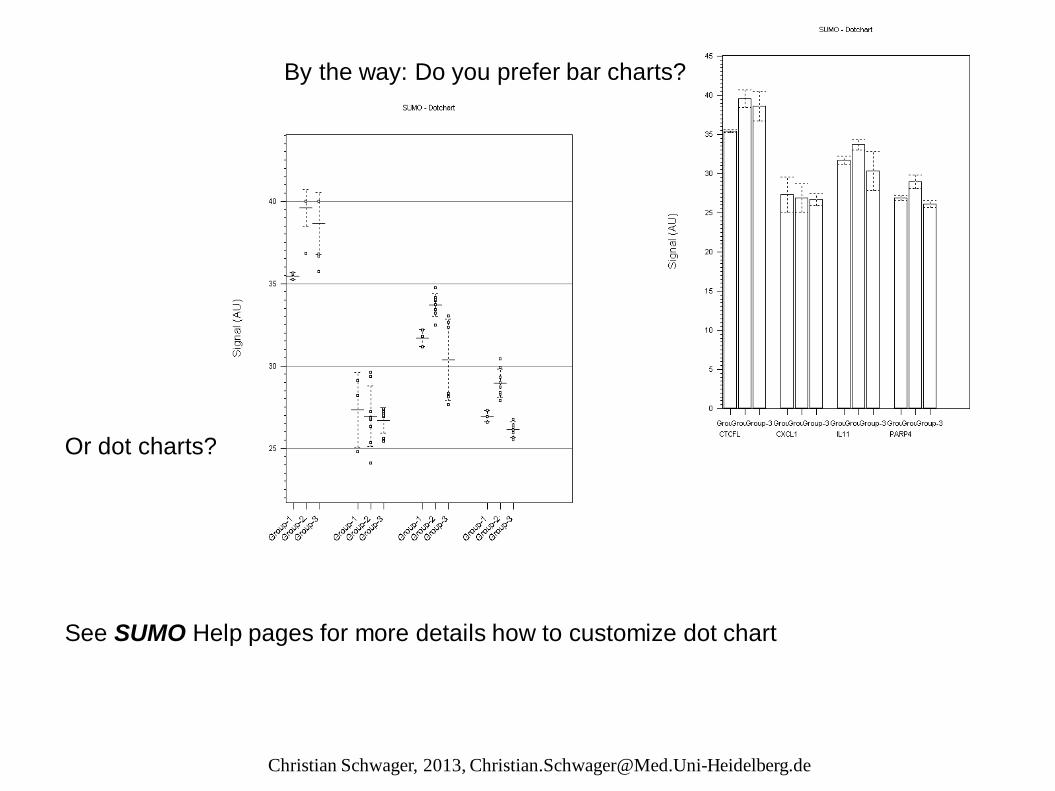
By the way: Do you prefer bar charts? Or dot charts? See SUMO Help pages for more details how to customize dot chart
Christian Schwager, 2013, [email protected]

ddCT - Specific regulation of genes in your samples - Compute regulation against control / reference samples (a single or better the mean/median of a set of ref. samples) - subtract reference-mean from your samples SUMO main menu Adjust data Normalise genes Hybridisation normalisation/centering Mean/Median centering Assign the Reference/Control samples to group 2: - Select all Controls in Condition list - Double click Group-2 in Groups list Assign the „treated“ samples to group 1 - Select all Treatments in Condition list - Double click Group-1 in Groups list Click OK-button You may perform this for different sample groups independently (e.g. Normalize all treated fibroblasts fo control fibroblasts, All endothelial cells to endothelial controls,…) Don‘t forget to save new matrix. See SUMO Help pages for more details how to use the grouping tools
Christian Schwager, 2013, [email protected]

ddCT to Log-2 regulation Still, our data are CT-values. ddCT > 0: more ct-cycles are required to synthesie the same amout of DANN in your sample compared to the control sample => Sample is down-regulated compared to control. ddCT < 0: less ct-cycles are required to synthesie the same amout in your sample compared to the control sample => Sample is up-regulated compared to control. To fix this, invert the sign: -(ddCT-values) => ~ log2 regulation SUMO main menu Adjust data Arithmetic operations Invert sign Assign all samples to Group1 and press RUN button.
Christian Schwager, 2013, [email protected]

Log-2 regulation => relative regulation SUMO main menu Adjust data Data transformation Exp2
Christian Schwager, 2013, [email protected]
Christian Schwager, 2013, [email protected]
What to do now ? Use SUMO to - Run statistic test - generate graphs for your test groups - save transformed data as tab delimited text (File | Save matrix) How to get SUMO – www.oncoexpress.de/software/sumo - Download What else can I do with SUMO – Look in SUMO web pages.

Christian Schwager, 2013, [email protected]
Statistical tests Question: Which genes are statistically significant differentially expressed between Samples from Treatment1 Treatment2 Treatment3 … SUMO offers to perform a variaty of standard class tests to find statistically significant regulated genes between your treatment groups: - Gaussian distrubtion based parametric tests - Gaussian distrubtion based permutaion tests - Non-parametric Rank tests
- Single class - Two class – unpaired - Paired samples - Multiclass
See SUMO Help pages for more details about hypthesis testing / class tests
Christian Schwager, 2013, [email protected]
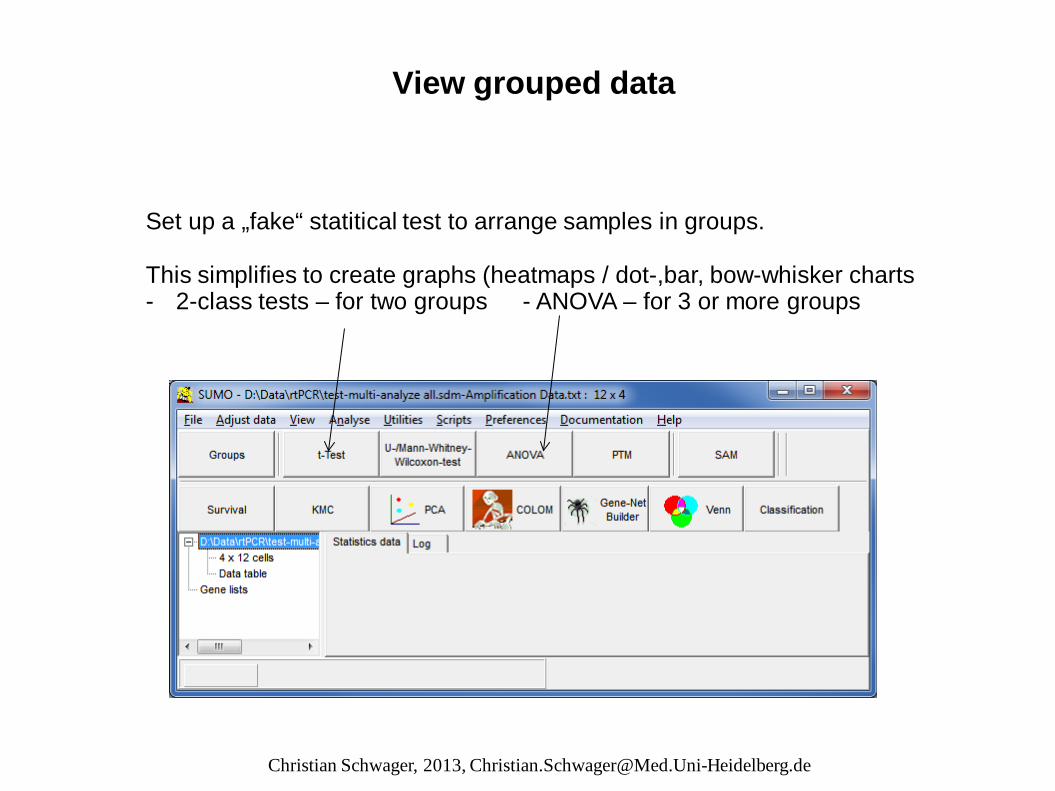
View grouped data Set up a „fake“ statitical test to arrange samples in groups. This simplifies to create graphs (heatmaps / dot-,bar, bow-whisker charts - 2-class tests – for two groups - ANOVA – for 3 or more groups

Christian Schwager, 2013, [email protected]
View grouped data The grouping tool opens up: Set number of groups (ANOVA) Select individual samples and Double click respective group Repeat this for all relevant groups Change groups names: Right click a group name, select Rename from context menu Reorder Groups: Select a group, Drag it to another position in the group list Repeat this for all relevant groups See SUMO Help pages for more details about the grouping tool

Christian Schwager, 2013, [email protected]
View group data Go to Paramter page: Select t/f distribution Click RUN-button to execute the „fake“ test
Christian Schwager, 2013, [email protected]
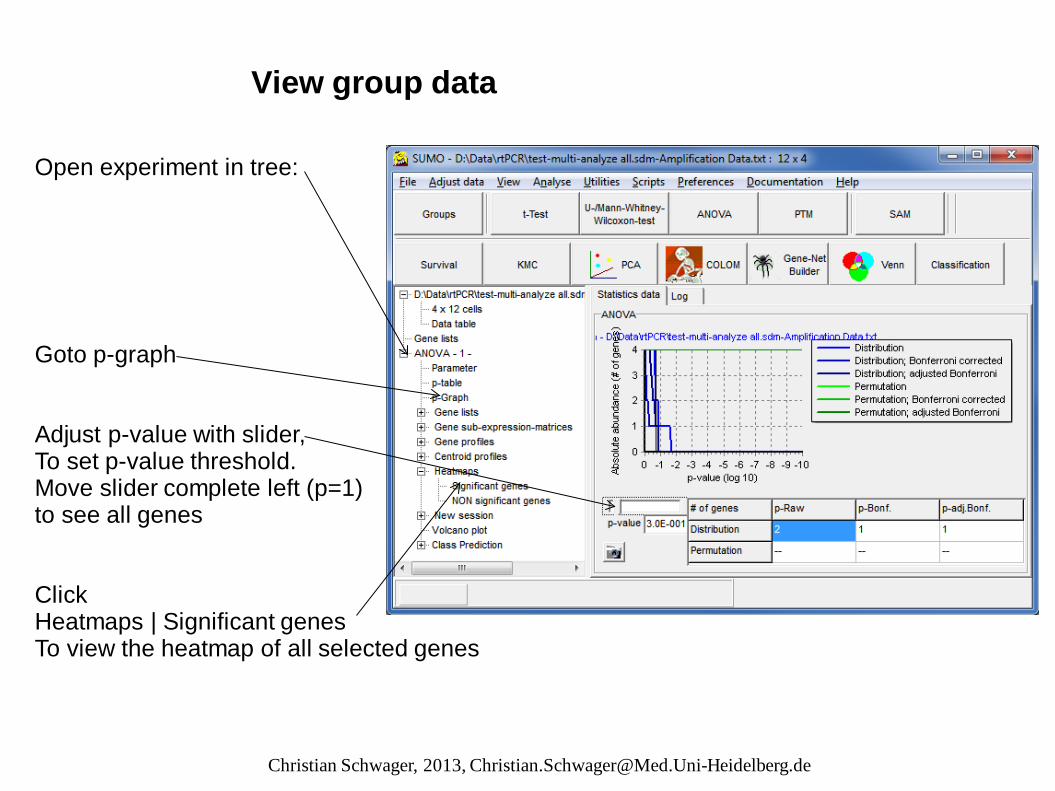
View group data Open experiment in tree: Goto p-graph Adjust p-value with slider, To set p-value threshold. Move slider complete left (p=1) to see all genes Click Heatmaps | Significant genes To view the heatmap of all selected genes

Christian Schwager, 2013, [email protected]
Heatmap of grouped data Use slider to adjust height, width of genes, color contrast. Autoscale all Snapshot Select sample annotation to be Shown on top of heatmap Color bars indicating groups Right click into colum header, to select gene annotation to be Shown in respective column See SUMO Help pages for more details how to customize the heatmap

Christian Schwager, 2013, [email protected]
View group data‘s profiles Select multiple genes (CTRL+Click) Click right mouse button, From context menu select View | Selected genes profiles

Christian Schwager, 2013, [email protected]
View group data‘s dot chart (bow whisker plot / bar chart) Select genes (CTRL+Click) Click right mouse button, From context menu select View | Selected genes dot chart See SUMO Help pages for more details how to customize the dot chart.
How to get SUMO ? => http://www.oncoexpress.de/software/sumo What else can I do with SUMO – Look in SUMO web pages. If I don't want to use SUMO – what else could I use ? Any other program where you can work with data matrices.
Christian Schwager, 2013, [email protected]