Evaluation of physicochemical properties and ...
12
GSC Biological and Pharmaceutical Sciences, 2020, 12(03), 061-072 Available online at GSC Online Press Directory GSC Biological and Pharmaceutical Sciences e-ISSN: 2581-3250, CODEN (USA): GBPSC2 Journal homepage: https://www.gsconlinepress.com/journals/gscbps Corresponding author: Ike Christian Chukwuemeka Department of Biological Sciences (Microbiology Programme), College of Basic and Applied Sciences, Rhema University, Nigeria, P.M.B. 7021 Aba, Abia State. Copyright © 2020 Author(s) retain the copyright of this article. This article is published under the terms of the Creative Commons Attribution Liscense 4.0. (R ESEARCH A RTICLE ) Evaluation of physicochemical properties and microbiological safety of pumpkin (Cucurbita pepo) seed composite flours. Peace Chika Emeka-Ike 1 and Christian Chukwuemeka Ike 2, * 1 Department of Food Science and Technology, Imo State University, Owerri, P.M.B. 2000 Owerri, Imo State, Nigeria. 2 Department of Biological Sciences (Microbiology Programme), College of Basic and Applied Sciences, Rhema University, Nigeria, P.M.B. 7021 Aba, Abia State. Publication history: Received on 13July 2020; revised on 06 September 2020; accepted on 09 September 2020 Article DOI: https://doi.org/10.30574/gscbps.2020.12.3.0223 Abstract The physicochemical properties and microbiological safety of pumpkin (Cucurbita pepo) seed composite flours were evaluated using standard analytical and microbiological assessment methods. The increased substitution of PSF into WF1 had significant (p<0.05) decrease on some functional properties of the blends such as water absorption capacity (WAC), oil absorption capacity (OAC), gelation capacity (GC) and bulk density (BD). WAC of blends ranged from 1.40±0.06 mL/g to 1.70±0.19 mL/g, OAC ranged from 3.22±0.19 mL/g to 3.55±0.15 mL/g, GC ranged from 15.50±0.79 % to 18.84±1.15%, and BD ranged from 0.41±0.07 g/mL to 0.69±0.10 g/mL. Conversely, as levels of substitution of PSF into WF1 increased, there was significant (p<0.05) increase on emulsifying capacity (EC), emulsion stability (ES), foaming capacity (FC) and foaming stability (FS). EC of blends ranged from 14.67±1.18% to 18.41±1.55%, ES ranged from 25.28±2.22% to 38.45±1.91%, FC ranged from 21.03±1.87% to 24.93±1.28%, and FS ranged from 41.49±1.78% to 48.81±2.03%. The blending of PSF into WF1 had significant (p<0.05) decrease on pasting attributes of the blends as protein content increased with the exception of pasting temperature. The values of pasting attributes ranges as: peak viscosity- PV (RVU) 1362.7±2.90 to 1445.5±3.10, trough viscosity- TV (RVU) 778.30±3.92 to 806.08±3.80, breakdown viscosity- BV (RVU) 628.10±3.33 to 658.22±2.15, final viscosity- FV (RVU) 1572.30±2.46 to 1693.9±3.64, setback value- SB (RVU) 843.4±2.04 to 901.8±1.98, peak time- PT (min) 5.88±0.28 to 5.64±0.29, and pasting temperature- PTemp ( o C) 89.28±1.77 to 91.74±2.11. Bacterial and fungal counts (CFU/g) of blended flours ranged from 2.83x10 3 ±0.09 to 3.15x10 3 ±0.52 and 3.59x10 2 ±1.81 to 3.92x10 2 ±1.12 respectively. The inclusion of different levels of pumpkin seed flour (PSF) into wheat flour (WF1) had good physicochemical and microbiological properties that would eventually result in safe, high quality and value added products. Keywords: Pumpkin (Cucurbita pepo) seed flour; Wheat flour; Functional properties; Pasting properties; Microbiological safety. 1. Introduction Pumpkin (Cucurbita pepo) is a monoecious, annual plant of the Cucurbitaccae family. Pumpkin is botanically classified as a fruit but widely regarded as a vegetable. Pumpkin and their seeds are native to America, and various species are found across the North, South and Central America. Pumpkin varies greatly in form, but is generally oblong or ovoid in shape. The rind is smooth and varies in colour between cultivars. Some fruits are dark green, pale green, orange-yellow, white, red or grey. Pumpkin seeds also known as pepitas are flat, dark green seeds encased in a yellow-white husk [1].
Transcript of Evaluation of physicochemical properties and ...

GSC Biological and Pharmaceutical Sciences, 2020, 12(03), 061-072
Available online at GSC Online Press Directory
GSC Biological and Pharmaceutical Sciences
e-ISSN: 2581-3250, CODEN (USA): GBPSC2
Journal homepage: https://www.gsconlinepress.com/journals/gscbps
Corresponding author: Ike Christian Chukwuemeka Department of Biological Sciences (Microbiology Programme), College of Basic and Applied Sciences, Rhema University, Nigeria, P.M.B. 7021 Aba, Abia State.
Copyright © 2020 Author(s) retain the copyright of this article. This article is published under the terms of the Creative Commons Attribution Liscense 4.0.
(RE SE AR CH AR T I CL E)
Evaluation of physicochemical properties and microbiological safety of pumpkin (Cucurbita pepo) seed composite flours.
Peace Chika Emeka-Ike 1 and Christian Chukwuemeka Ike 2, *
1Department of Food Science and Technology, Imo State University, Owerri, P.M.B. 2000 Owerri, Imo State, Nigeria. 2 Department of Biological Sciences (Microbiology Programme), College of Basic and Applied Sciences, Rhema University, Nigeria, P.M.B. 7021 Aba, Abia State.
Publication history: Received on 13July 2020; revised on 06 September 2020; accepted on 09 September 2020
Article DOI: https://doi.org/10.30574/gscbps.2020.12.3.0223
Abstract
The physicochemical properties and microbiological safety of pumpkin (Cucurbita pepo) seed composite flours were evaluated using standard analytical and microbiological assessment methods. The increased substitution of PSF into WF1 had significant (p<0.05) decrease on some functional properties of the blends such as water absorption capacity (WAC), oil absorption capacity (OAC), gelation capacity (GC) and bulk density (BD). WAC of blends ranged from 1.40±0.06 mL/g to 1.70±0.19 mL/g, OAC ranged from 3.22±0.19 mL/g to 3.55±0.15 mL/g, GC ranged from 15.50±0.79 % to 18.84±1.15%, and BD ranged from 0.41±0.07 g/mL to 0.69±0.10 g/mL. Conversely, as levels of substitution of PSF into WF1 increased, there was significant (p<0.05) increase on emulsifying capacity (EC), emulsion stability (ES), foaming capacity (FC) and foaming stability (FS). EC of blends ranged from 14.67±1.18% to 18.41±1.55%, ES ranged from 25.28±2.22% to 38.45±1.91%, FC ranged from 21.03±1.87% to 24.93±1.28%, and FS ranged from 41.49±1.78% to 48.81±2.03%. The blending of PSF into WF1 had significant (p<0.05) decrease on pasting attributes of the blends as protein content increased with the exception of pasting temperature. The values of pasting attributes ranges as: peak viscosity- PV (RVU) 1362.7±2.90 to 1445.5±3.10, trough viscosity- TV (RVU) 778.30±3.92 to 806.08±3.80, breakdown viscosity- BV (RVU) 628.10±3.33 to 658.22±2.15, final viscosity- FV (RVU) 1572.30±2.46 to 1693.9±3.64, setback value- SB (RVU) 843.4±2.04 to 901.8±1.98, peak time- PT (min) 5.88±0.28 to 5.64±0.29, and pasting temperature- PTemp (oC) 89.28±1.77 to 91.74±2.11. Bacterial and fungal counts (CFU/g) of blended flours ranged from 2.83x10³ ±0.09 to 3.15x10³ ±0.52 and 3.59x10² ±1.81 to 3.92x10² ±1.12 respectively. The inclusion of different levels of pumpkin seed flour (PSF) into wheat flour (WF1) had good physicochemical and microbiological properties that would eventually result in safe, high quality and value added products.
Keywords: Pumpkin (Cucurbita pepo) seed flour; Wheat flour; Functional properties; Pasting properties;
Microbiological safety.
1. Introduction
Pumpkin (Cucurbita pepo) is a monoecious, annual plant of the Cucurbitaccae family. Pumpkin is botanically classified as a fruit but widely regarded as a vegetable. Pumpkin and their seeds are native to America, and various species are found across the North, South and Central America. Pumpkin varies greatly in form, but is generally oblong or ovoid in shape. The rind is smooth and varies in colour between cultivars. Some fruits are dark green, pale green, orange-yellow, white, red or grey. Pumpkin seeds also known as pepitas are flat, dark green seeds encased in a yellow-white husk [1].

GSC Biological and Pharmaceutical Sciences, 2020, 12(03), 061–072
62
Ways of expanding the use of available local sources are increasingly pursued but knowledge of the nutritive value of such local ingredient and foodstuffs are necessary in order to encourage an increase in cultivation and consumption of those that are highly nutritive. This will help to supplement the nutrients of the stable carbohydrate foods of the poor, who cannot afford enough protein foods of animal origin. Proteins are commonly employed as food ingredients on the basis of their importance in human diets. The best proteins belong to animal sources, since they are nutritionally better. However the high cost of animal protein makes vegetable protein the main dietary component for most of the world’s population. The use of plant protein in the formulation of new food products or in conventional foods has been the focus of most research in recent years. To develop plant protein for use as food ingredients their physicochemical and functional properties must be evaluated [2].
Proteins principally determine the functionality of a food, although carbohydrates also play a role in water-binding, swelling and viscosity control of a food. Functional properties of food proteins are important in food processing and food product formulation. These properties are affected by intrinsic factors of protein such as molecular structure and many environmental factors including the method of protein separation/production, pH, ionic strength, and the presence of other components in the food system [3].
The pasting properties of a food refer to the changes that occur in the food as a result of application of heat in the presence of water. These changes affect texture, digestibility, and end use of the food product. Pasting property is one of the most important properties that influence quality and aesthetic considerations in the food industry since they affect texture and digestibility as well as the end use of starch-based food commodities [4; 5; 6].
For food industry, the selected protein should display a wide range of functional properties which are closely related to their structure [7]. The effective utilization of protein entails matching a wide variety of functional and nutritional characteristics to the complex needs of manufactured products. The downturn of this shift is that traditional food crops are facing poor consumption, especially in urban and cosmopolitan centers where dwellers are purchasing more of processed foods [8]. Traditional cuisines have been replaced with away-from-home consumption meal, comprising mainly fast foods [9]. The microbiological safety of products after considering their good functional and pasting attributes to processing methods is vital in assuring consumers of reposed food safety confidence and assurance as it pertains to shelf life. Therefore, this work is targeted at evaluating the physicochemical properties and microbiological safety of pumpkin (Cucurbita pepo) seed composite flours.
2. Material and methods
2.1. Determination of functional properties
Water absorption and oil absorption capacities were determined using the method outlined by [10]. Emulsifying capacity and stability was determined using the method of [11]. Foaming capacity and stability was determined by the method of [12]. The gelation capacity of the samples was determined using [13] modification method, as was described by [14]. The method of [15] was adopted in bulk density determination.
2.2. Determination of pasting properties
The method of [16] was adopted. Pasting characteristics were determined using a Rapid Visco Analyzer (RVA) with Model RVA 3D+, Newport Scientific, Australia.
2.3. Microbiological analysis of samples
Flour samples were analyzed for bacterial and fungal counts using spread plate method as described by [17]. Ten fold serial dilutions of flour samples were done using sterile peptone water as diluent. One gramme (1 g) each of sample was aseptically transferred into a sterile test tube containing nine milliliter (9 mL) of sterile peptone water, stirred with sterile glass rod and was shaken vigorously to ensure adequate disengagement of microorganisms to obtain 10-1 dilution. Serial dilutions of the homogenates were continued and made step-wisely till the fifth (5th) tube, to obtain dilutions of 10-2 to 10-5.Spread plate techniques of [17] were used to enumerate bacteria and fungi in the samples and each dilution was plated in replicates using plate count agar for mean bacterial count and fortified sabouraud dextrose agar (SDA) for mean fungal count. The plates were incubated at 35±2 °C for 72 hours for mean bacterial counts and 25±2 °C for 120 hours for mean fungal counts.
GSC Biological and Pharmaceutical Sciences, 2020, 12(03), 061–072
63
2.4. Statistical analyses
All obtained data in this study were analyzed using analysis of variance (ANOVA). Descriptive statistics in form of mean, standard deviation and Duncan post hoc were also used to assess the data, and analyses were done using SPSS version 20 (Statistical Product and Service Solutions).
3. Results
3.1. Functional properties
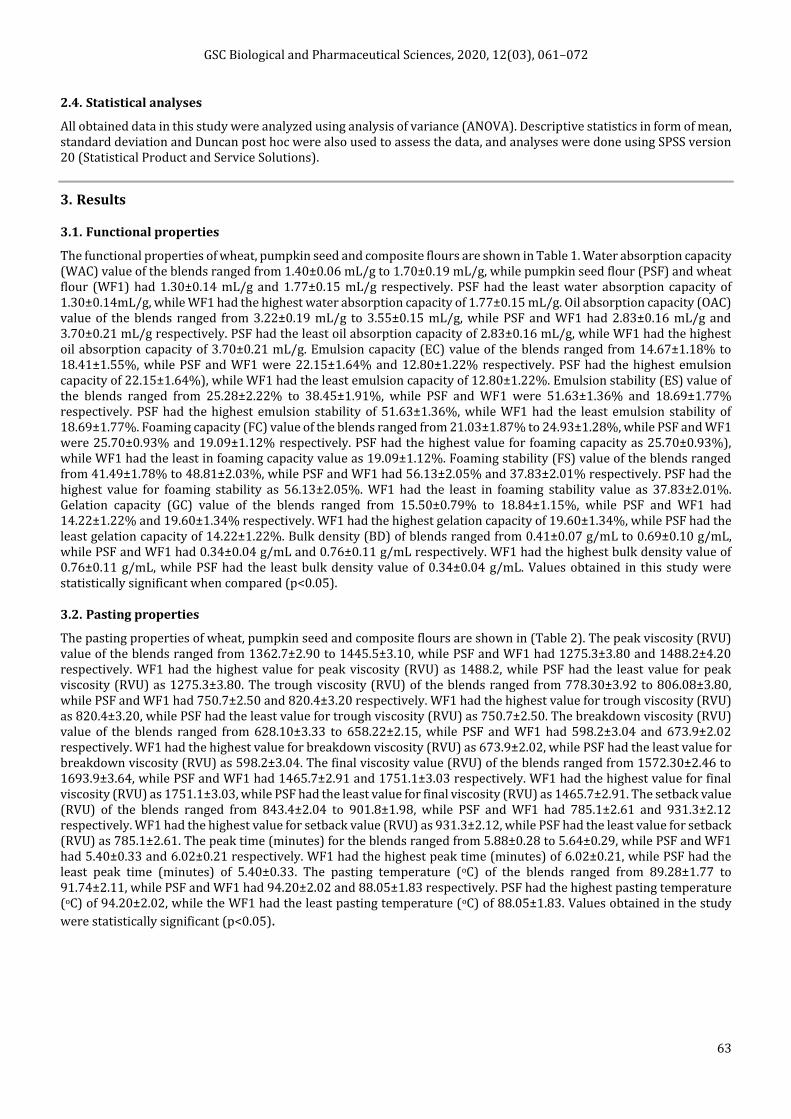
The functional properties of wheat, pumpkin seed and composite flours are shown in Table 1. Water absorption capacity (WAC) value of the blends ranged from 1.40±0.06 mL/g to 1.70±0.19 mL/g, while pumpkin seed flour (PSF) and wheat flour (WF1) had 1.30±0.14 mL/g and 1.77±0.15 mL/g respectively. PSF had the least water absorption capacity of 1.30±0.14mL/g, while WF1 had the highest water absorption capacity of 1.77±0.15 mL/g. Oil absorption capacity (OAC) value of the blends ranged from 3.22±0.19 mL/g to 3.55±0.15 mL/g, while PSF and WF1 had 2.83±0.16 mL/g and 3.70±0.21 mL/g respectively. PSF had the least oil absorption capacity of 2.83±0.16 mL/g, while WF1 had the highest oil absorption capacity of 3.70±0.21 mL/g. Emulsion capacity (EC) value of the blends ranged from 14.67±1.18% to 18.41±1.55%, while PSF and WF1 were 22.15±1.64% and 12.80±1.22% respectively. PSF had the highest emulsion capacity of 22.15±1.64%), while WF1 had the least emulsion capacity of 12.80±1.22%. Emulsion stability (ES) value of the blends ranged from 25.28±2.22% to 38.45±1.91%, while PSF and WF1 were 51.63±1.36% and 18.69±1.77% respectively. PSF had the highest emulsion stability of 51.63±1.36%, while WF1 had the least emulsion stability of 18.69±1.77%. Foaming capacity (FC) value of the blends ranged from 21.03±1.87% to 24.93±1.28%, while PSF and WF1 were 25.70±0.93% and 19.09±1.12% respectively. PSF had the highest value for foaming capacity as 25.70±0.93%), while WF1 had the least in foaming capacity value as 19.09±1.12%. Foaming stability (FS) value of the blends ranged from 41.49±1.78% to 48.81±2.03%, while PSF and WF1 had 56.13±2.05% and 37.83±2.01% respectively. PSF had the highest value for foaming stability as 56.13±2.05%. WF1 had the least in foaming stability value as 37.83±2.01%. Gelation capacity (GC) value of the blends ranged from 15.50±0.79% to 18.84±1.15%, while PSF and WF1 had 14.22±1.22% and 19.60±1.34% respectively. WF1 had the highest gelation capacity of 19.60±1.34%, while PSF had the least gelation capacity of 14.22±1.22%. Bulk density (BD) of blends ranged from 0.41±0.07 g/mL to 0.69±0.10 g/mL, while PSF and WF1 had 0.34±0.04 g/mL and 0.76±0.11 g/mL respectively. WF1 had the highest bulk density value of 0.76±0.11 g/mL, while PSF had the least bulk density value of 0.34±0.04 g/mL. Values obtained in this study were statistically significant when compared (p<0.05).
3.2. Pasting properties
The pasting properties of wheat, pumpkin seed and composite flours are shown in (Table 2). The peak viscosity (RVU) value of the blends ranged from 1362.7±2.90 to 1445.5±3.10, while PSF and WF1 had 1275.3±3.80 and 1488.2±4.20 respectively. WF1 had the highest value for peak viscosity (RVU) as 1488.2, while PSF had the least value for peak viscosity (RVU) as 1275.3±3.80. The trough viscosity (RVU) of the blends ranged from 778.30±3.92 to 806.08±3.80, while PSF and WF1 had 750.7±2.50 and 820.4±3.20 respectively. WF1 had the highest value for trough viscosity (RVU) as 820.4±3.20, while PSF had the least value for trough viscosity (RVU) as 750.7±2.50. The breakdown viscosity (RVU) value of the blends ranged from 628.10±3.33 to 658.22±2.15, while PSF and WF1 had 598.2±3.04 and 673.9±2.02 respectively. WF1 had the highest value for breakdown viscosity (RVU) as 673.9±2.02, while PSF had the least value for breakdown viscosity (RVU) as 598.2±3.04. The final viscosity value (RVU) of the blends ranged from 1572.30±2.46 to 1693.9±3.64, while PSF and WF1 had 1465.7±2.91 and 1751.1±3.03 respectively. WF1 had the highest value for final viscosity (RVU) as 1751.1±3.03, while PSF had the least value for final viscosity (RVU) as 1465.7±2.91. The setback value (RVU) of the blends ranged from 843.4±2.04 to 901.8±1.98, while PSF and WF1 had 785.1±2.61 and 931.3±2.12 respectively. WF1 had the highest value for setback value (RVU) as 931.3±2.12, while PSF had the least value for setback (RVU) as 785.1±2.61. The peak time (minutes) for the blends ranged from 5.88±0.28 to 5.64±0.29, while PSF and WF1 had 5.40±0.33 and 6.02±0.21 respectively. WF1 had the highest peak time (minutes) of 6.02±0.21, while PSF had the least peak time (minutes) of 5.40±0.33. The pasting temperature (oC) of the blends ranged from 89.28±1.77 to 91.74±2.11, while PSF and WF1 had 94.20±2.02 and 88.05±1.83 respectively. PSF had the highest pasting temperature (oC) of 94.20±2.02, while the WF1 had the least pasting temperature (oC) of 88.05±1.83. Values obtained in the study
were statistically significant (p<0.05).

GSC Biological and Pharmaceutical Sciences, 2020, 12(03), 061–072
64
Table 1 Functional properties of wheat, pumpkin seed and composite flours.
Functional Properties WF1 PSF Composite flours (%)
CF2 CF4 CF5 CF6
Water absorption capacity (ml/g) 1.77±0.15a 1.30±0.14d 1.70±0.19ab 1.62±0.08abc 1.53±0.07bc 1.40±0.06cd
Oil absorption capacity (ml/g) 3.70±0.21a 2.83±0.16d 3.55±0.15ab 3.39±0.16abc 3.34±0.12bc 3.22±0.19c
Emulsifying capacity (%) 12.80±1.22d 22.15±1.64a 14.67±1.18cd 16.54±0.98bc 17.48±1.08b 18.41±1.55b
Emulsion stability (%) 18.69±1.77e 51.63±1.36a 25.28±2.22d 31.87±2.01c 35.16±2.39c 38.45±1.91b
Foaming capacity (%) 19.09±1.12d 25.70±0.93a 21.03±1.87cd 22.43±1.53bc 23.89±1.61abc 24.93±1.28ab
Foaming stability (%) 37.83±2.01e 56.13±2.05a 41.49±1.78d 45.15±1.65c 46.98±1.91bc 48.81±2.03b
Gelation capacity (%) 19.60±1.34a 14.22±1.22d 18.84±1.15a 17.72±1.07ab 16.64±0.98bc 15.50±0.79cd
Bulk density(g/ml) 0.76±0.11a 0.34 ±0.04d 0.69±0.10ab 0.57±0.09bc 0.48±0.12bcd 0.41±0.07cd
Legend: WF1 = 100% Wheat flour, CF2 = 20% Pumpkin seed flour, CF4 = 40% Pumpkin seed flour, CF5 = 50% Pumpkin seed flour, CF6 = 60% Pumpkin seed flour, PSF = Pumpkin seed flour, Values are given as mean ± SD. Within rows, values followed by the same alphabets are not significantly different but those followed by different alphabets are significantly different p<0.05.
Table 2 Pasting properties of wheat, pumpkin seed and composite flours
Pasting Properties WF1 PSF Composite flours (%)
CF2 CF4 CF5 CF6
Peak Viscosity (RVU) 1488.2±4.20a 1275.3±3.80f 1445.5±3.10b 1403.80±4.00c 1382.40±3.50d 1362.70±2.90e
Trough Viscosity (RVU) 820.40±3.20a 750.70±2.50e 806.08±3.80b 792.10±2.65c 785.05±1.74d 778.30±3.92d
Breakdown Viscosity (RVU) 673.9±2.02a 598.2±3.04f 658.22±2.15b 643.06±3.08c 635.08±2.95d 628.10±3.33e
Final Viscosity (RVU) 1751.10±3.03a 1465.70±2.91f 1693.90±3.64b 1634.10±4.11c 1605.60±3.00d 1572.30±2.46e
Setback value (RVU) 931.30±2.12a 785.10±2.61f 901.80±1.98b 872.60±3.14c 858.10±2.13d 843.40±2.04e
Peak time (min) 6.02±0.21a 5.40±0.33b 5.88±0.28ab 5.76±0.30ab 5.70±0.19ab 5.64±0.29ab
Pasting Temperature (oC) 88.05±1.83b 94.20±2.02a 89.28±1.77b 90.51±2.04b 91.13±1.64ab 91.74±2.11ab
Legend: WF1 = 100% Wheat flour, CF2 = 20% Pumpkin seed flour, CF4 = 40% Pumpkin seed flour, CF5 = 50% Pumpkin seed flour, CF6 = 60% Pumpkin seed flour, PSF = Pumpkin seed flour. Values are given as mean ± SD. Within rows, values followed by the same alphabets are not significantly different but those followed by different alphabets are significantly different p<0.05.

GSC Biological and Pharmaceutical Sciences, 2020, 12(03), 061–072
65
3.3. Microbiological analysis of wheat and blended flours
The microbial qualities of wheat and blended flours are shown in Table 3. Bacterial and fungal counts (CFU/g) of blended flours ranged from 2.83x10³ ±0.09 to 3.15x10³ ±0.52 and 3.59x10² ±1.81 to 3.92x10² ±1.12 respectively. WF1 flour recorded the highest bacterial and fungal (CFU/g) counts (3.20x10³ ±1.33/ 4.19x10² ±0.46), while CF6 (60% pumpkin) recorded the least bacterial and fungal (CFU/g)counts (2.83x10³ ±0.09/ 3.59x10² ±1.81) respectively. There were significant differences (p<0.05) in microbial counts among various samples when compared.
Table 3 Microbiological results of wheat and composite flours
Legend: WF1 = 100% Wheat flour, CF2 = 20% Pumpkin seed flour, CF4 = 40% Pumpkin seed flour, CF5 = 50% Pumpkin seed flour, CF6 = 60% Pumpkin seed flour, PSF = Pumpkin seed flour. Values are given as mean ± SD. Within columns, values followed by the same alphabets are not significantly different but those followed by different alphabets are significantly different p<0.05.
4. Discussion
4.1. Functional properties
The addition of pumpkin seed flour (PSF) into wheat flour (WF1) at different levels to form blends had significant (p<0.05) effect on all functional properties. This effect turned retrogressive as there was a decrease in recorded values as substitution of WF1 with increasing levels of PSF occurred. As the blending ratio of PSF into WF1 increased, lower were the values for water absorption capacity, oil absorption capacity, gelation capacity and bulk density as shown in Table 1.
Conversely, the addition of PSF into WF1 at different levels to form blends had significant (p<0.05) increase on emulsifying capacity, emulsion stability, foaming capacity and foaming stability. This effect was progressive with an increase in recorded values as substitution of WF1 with increasing levels of PSF occurred. As the blending ratio of PSF into WF1 increased, higher were the values for emulsifying capacity, emulsion stability, foaming capacity and foaming stability among blends as shown in Table 1.
Water absorption capacity (WAC) of the blends decreased as the level of PSF substitution increased. This decrease is due to the low starch content of pumpkin seed flour (PSF) over wheat flour (WF1). The ability of flour to absorb water is called water absorption capacity. Water absorption capacity represent the ability of a product to associate with water under conditions where water is limited [18]. High water absorption capacity could be attributed to high amount of carbohydrates (starch) present in the flour [19].
WAC of the blended flour had no similarity in trend with the reports of Nguyen and Nguyen [20]. In the report of Nguyen and Nguyen [20], value of WAC for PSF was higher than that of WF1. Water absorption capacity results for PSF was in agreement with reports of Atuonwu and Akobundu [21]. Values of water absorption capacity among the blends when compared were statistically significant (p<0.05). Water absorption capacity is an important functional property required in food formulations especially those involving dough handling [22]. Water absorption capacity is important in bulking and consistency of products as well as in baking applications [22]. Thus, the sample with the highest water absorption capacity is best accepted in baking applications.
Oil absorption capacity obtained in the blends was retrogressive and in trend with WAC with increasing level of additions of PSF into WF1. Oil absorption capacity of the blends decreased as the level of PSF substitution increased. This decrease in oil absorption capacity among blends may be due to the low starch content of pumpkin seed flour (PSF) over wheat flour (WF1). High oil absorption capacity could be attributed to high amount of carbohydrates (starch) present in the flour [19]. Oil absorption capacity of the blends had similar trend and are in agreement with reports of
Samples Bacteria (CFU/g) Fungi (CFU/g)
WF1 3.20x10³ ±1.33a 4.19x10² ±0.46a
CF2 3.15x10³ ±0.52ab 3.92x10² ±1.12b
CF4 3.01x10³ ±0.44c 3.80x10² ±1.60bc
CF5 2.90x10³ ±1.35c 3.76x10² ±0.76bc
CF6 2.83x10³ ±0.09cd 3.59x10² ±1.81c

GSC Biological and Pharmaceutical Sciences, 2020, 12(03), 061–072
66
Nguyen and Nguyen [20] and Yusuf and Ejeh [23]. However, the results of oil absorption capacity for wheat flour agreed with the reports of Nguyen and Nguyen [20] and Atuonwu and Akobundu [21]. Values of OAC in the reports of Yusuf and Ejeh [23] were much lower than obtained results in this study. Values of oil absorption capacity among the blends when compared were statistically significant (p<0.05).
Oil absorption capacity (OAC) is an important functional property that enhances the mouth feel while retaining the flavour of food products [24]. Absorption of oil by food products improves mouth feel and flavour retention, and this makes it an important property in such food formulations [25]. The ability of the carbohydrates (starch) of these flours to bind with oil makes it useful in food system as a flavor retainer where optimum oil absorption is desired. This makes flour to have potential functional uses in foods, as in sausage production. The OAC also makes the flour suitable in facilitating enhancement in flavor and mouth feel when used in food preparation.
Emulsion capacity obtained in the blends was progressive with increasing level of additions of PSF into WF1. Emulsion capacity of the blends increased as the level of PSF substitution increased. This increase in emulsion capacity among blends were significant (p<0.05) and may be attributed to high protein content of pumpkin seed flour [26]. Iwe et al. [25] stated that higher emulsion capacity could be as a result of higher protein content. According to Garba and Kaur [27], soluble proteins enhance the emulsifying capacity of foods. This increase in emulsifying capacity indicated that substitution of PSF into WF1 will enhance the flours suitability for incorporation into food systems. Emulsion capacity results obtained in this study for pumpkin seed and wheat flours were in agreement with reports of Atuonwu and Akobundu [21] and Mepba et al. [28] respectively. Values of emulsion capacity among the blends when compared were statistically significant (p<0.05).
Emulsion stability followed the same trend with emulsion capacity among the blends. Emulsion stability of the blends increased as the level of PSF substitution increased. This increase in emulsion stability among blends were significant (p<0.05) and may be attributed to high protein content of pumpkin seed flour [26]. Iwe et al. [25] stated that higher emulsion stability could be as a result of higher protein content. Emulsion stability results obtained in this study for pumpkin seed and wheat flours were in agreement with reports of Atuonwu and Akobundu [21] and Mepba et al. [28] respectively. Values of emulsion stability among the blends when compared were statistically significant (p<0.05).
The formation and stability of emulsion is very important in food systems such as salad dressing. Proteins are composed of charged amino acids, non-charged polar amino acids and non-polar amino acids, which make protein a possible emulsifier, the surfactant possessing both hydrophilic and hydrophobic properties and able to interact with both water and oil in food system [29]. Highly insoluble proteins are not good emulsifiers and can generate coalescence [26]. Keto and Nakai [30] also reported that emulsifying properties show a good correlation with the presence of hydrophobic residues in the protein surface which are unstable in the oil-water interface.
Foaming capacity followed the same trend with both emulsion capacity and stability among the blends. Foaming capacity of the blends increased as the level of PSF substitution increased. This increase in foaming capacity among blends were significant (p<0.05) and may be attributed to high protein content of pumpkin seed flour [26]. Iwe et al. [25] stated that higher foaming capacity could be as a result of higher protein content.
Foaming capacity results among the blends were similar in trend and in agreement with report of Yusuf and Ejeh [23] when they studied production of bambara groundnut substituted whole wheat bread functional properties and quality characteristics respectively. Also, foaming capacity results for pumpkin seed and wheat flours were in agreement with reports of Atuonwu and Akobundu [21] and Mepba et al. [28] respectively. Values of foaming capacity among the blends when compared were statistically significant (p<0.05).
According to Garba and Kaur [27], soluble proteins enhance the emulsifying tendencies of foods. Brou et al. [31] reported that foaming capacity is positively correlated with protein content. Iwe et al. [25] stated that high foaming capacity reported in their work were because they are legumes with high protein content, which corroborated with the reports of Brou et al. [31]. Hence, PSF could be used in combination with WF1 to improve the textural consistency and appearance of baked foods. Good foaming capacity are desirable attributes for flours intended for the production of a variety of baked products such as cakes, cookies, muffins, akara, etc. It could also act as functional agents in other food formulations [32] and so a complementation of pumpkin seed flours with wheat flour is expected to give a product an improved texture, consistency and appearance.
Foaming stability followed the same trend with foaming capacity, emulsion capacity and stability among the blends. Foaming stability of the blends increased as the level of PSF substitution increased. This increase in foaming stability among blends were significant (p<0.05) and may be attributed to high protein content of pumpkin seed flour [26]. Iwe

GSC Biological and Pharmaceutical Sciences, 2020, 12(03), 061–072
67
et al. [25] stated that higher foaming stability could be as a result of higher protein content. Foaming stability results obtained in this study were similar in trend and in agreement with report of Yusuf and Ejeh [23]. Values of foaming stability among the blends when compared were statistically significant (p<0.05).
According to Garba and Kaur [27], soluble proteins enhance the emulsifying tendencies of foods. However, good foaming stability are desirable attributes for flours intended for the production of a variety of baked products such as cakes, cookies, muffins, akara, etc. and also act as functional agents in other food formulations [32] and so a complementation of pumpkin seed flours with wheat flour is expected to give a product an improved texture, consistency and appearance.
Gelation capacity followed the same trend with water absorption and oil absorption capacities among the blends. Gelation capacity of the blends decreased as the level of PSF substitution increased. This decrease in gelation capacity among blends were significant (p<0.05) and may be attributed to low starch content of pumpkin seed flour [19]. High peak viscosity is an index of high starch content [33]. Gelation is also related to the water absorption index of the starch-based flour during heating as was observed by Yusuf and Ejeh [23] where partial inclusion of Bambara groundnut flour into wheat flour caused a decline in gelation capacity. Ocheme et al. [34] observed a similar result of reduction in swelling capacity with inclusion of different levels of groundnut protein concentrate (GPC). Iwe et al. [25] stated that the property of starch granules to form a gel when subjected to heat is important in the formulation of baked foods.
Gelation capacity results of the blends were similar in trend and in agreement with reports of Yusuf and Ejeh [23] and Ocheme et al. [34] when they studied production of bambara groundnut substituted whole wheat bread functional properties and quality characteristics; and proximate composition, functional, and pasting properties of wheat and groundnut protein concentrate flour blends respectively. Chandra and Singh [19] in their study revealed that flour samples with high starch content took low least gelation concentrations (LGC) while flour samples with low starch content took high least gelation concentrations; as rice and potato flour took the lowest LGC due to their high starch content, while green gram flour took high LGC due to its low starch content. The later observation suggests the reason for the low gelation capacity of PSF compared to WF1 as flour with low LGC infers high gelation capacity. Results obtained in this study were in agreement with the assertions of [21; 23; 34; 35]. Values of gelation capacity among the blends when compared were statistically significant (p<0.05).
Bulk density followed the same trend with water absorption capacity, oil absorption capacity and gelation capacity among the blends. Bulk density of the blends decreased as the level of PSF substitution increased. This decrease in bulk density among blends were significant (p<0.05) and may be attributed to low starch content of pumpkin seed flour (PSF) over wheat flour (WF1). Pumpkin seed flour had high protein content over wheat flour [36]. PSF had low bulk density when compared with WF1 (Table 1). The variation in bulk density could be as a result of the variation in starch content. Iwe and Onuh [37] and Iwe and Onadipe [38] reported that starch content increased bulk density. There is a linear correlation between carbohydrate content and bulk density, hence result of reduction in carbohydrate content among blends is a direct consequence of low bulk density of pumpkin seed flour (PSF). Lower bulk density in the blends compared with 100% wheat flour could be a result of reduction in carbohydrate (starch) content [39]. Ocheme et al. [34] stated that the higher the starch, the higher the bulk density.
Results obtained in the study were statistically significant (p<0.05) and correlated with the assertions of [34; 39]. However, the reports of Nguyen and Nguyen [20] took a different trend with bulk density of pumpkin seed flour was higher than that of wheat flour.
4.2. Pasting properties
The blending of PSF into WF1 to form blends had significant (p<0.05) effect on peak viscosity. However, as the blending ratio of PSF into WF1 increased, lower were the values of peak viscosity, trough viscosity, breakdown viscosity, final viscosity, setback value and peak time among the blends. This substitution of WF1 with increasing ratios of PSF resulted in significant (p<0.05) decrease in peak viscosity, trough viscosity, breakdown viscosity, final viscosity, setback value and peak time among the blends. Conversely, the substitution of WF1 with increasing ratios of PSF resulted in significant (p<0.05) increase in pasting temperature among the blends. Also, as the blending ratio of PSF into WF1 increased, higher was the value for pasting temperature among the blends. The results obtained in Table 2 for pasting properties were statistically significant (p<0.05) and in agreement with the reports of [25; 34; 40; 41].
High peak viscosity is an index of high starch content [33]. According to Blazek and Copeland [42] peak viscosity is governed by the extent of starch swelling, whereas final viscosity is associated with quality of particular starch since it indicates the ability to form a viscous paste after cooking and cooling. However, starch content has a direct relationship with gelation and swelling capacity. Hence, Yusuf and Ejeh [23] had a decline in gelation capacity with partial inclusion

GSC Biological and Pharmaceutical Sciences, 2020, 12(03), 061–072
68
of bambara groundnut flour into wheat flour while Ocheme et al. [34] had a reduction in swelling capacity with inclusion of different levels of groundnut protein concentrate (GPC). Protein substantially affects the pasting properties of composites by reducing heat-induced swelling of the starch [41]. Unlike the low peak viscosity values recorded in this study among blends, high peak viscosity values is of processing advantage and has been reported to be significant in the preparation of stiff dough products like tuwoshinkafa, a stiff dough product made from cereal flour and eaten with stew and vegetable [43].
Reduction in peak viscosity could be due to lowering of the starch as well as interactions between the starch, fat, and protein contents of the blends. Peak viscosity is the maximum viscosity developed during or soon after the heating portion. It is an index of the ability of starch-based foods to swell freely before their physical breakdown [44; 45]. Peak viscosity has been reported to be correlated with water binding capacity of starch which takes place at equilibrium point between swelling which causes an increase in viscosity while rupturing and realignment cause its reduction [46].
Trough viscosity is the minimum viscosity value in the constant temperature phase of the Rapid Visco Analyzer pasting profile. In simple terms, trough viscosity is the point at which the viscosity reaches its minimum during either heating or cooling processes. It measures the ability of the paste to withstand breakdown during cooling. Protein substantially affects the pasting properties of composites by reducing heat-induced swelling of the starch [41]. Trough viscosity followed the same trend with that of peak viscosity. There were significant differences (p < 0.05) in trough viscosity of the composite flour.
Generally, the pasting properties (except pasting temperature) of flours indicate a direct relationship between the starch (carbohydrate) content and the pasting properties on one hand, and an inverse relationship between protein and the pasting properties on the other hand. As the carbohydrate content increased, the pasting attributes also increased, but as the protein content increased, the pasting attributes also decreased. The decrease in pasting attributes (except pasting temperature) with increasing protein may be due to the effect of protein on the starch [34].
The breakdown viscosity is an index of the stability of the starch and a measure of the ease with which the swollen granules can be disintegrated [47]. It is an indication of breakdown or stability of the starch gel during cooking [48]. The breakdown is regarded as a measure of paste stability. Protein substantially affects the pasting properties of composites by reducing heat-induced swelling of the starch [41]. A higher breakdown viscosity is considered to be an indicator of better palatability [25], although Adebowale et al. [4] reported that the higher the breakdown viscosity, the lower the ability of the flour to withstand heating and shear stress during cooking.
Final viscosity is commonly used to define the quality of particular starch-based flour since it indicates the ability of the flour to form a viscous paste after cooking and cooling. It also gives a measure of the resistance of the paste to shear force during stirring [4; 45]. The variations in the final viscosity might be due to the simple kinetic effect of cooling on viscosity and the re-association of starch molecules in the flour samples. There was a significant decrease (p < 0.05) in the final viscosity among blends. Pasting properties of flours (except pasting temperature) indicate a direct and inverse relationship between the starch (carbohydrate) content and protein content respectively. As the carbohydrate content increased, the pasting attributes also increased, but as the protein content increased, the pasting attributes also decreased. The final viscosity values reported by Danbaba et al. [43] during pasting properties of rice may be attributed to the hydrogen bonding during cooling and the high amylose content of the rice flour [49].
Lower setback viscosity indicates higher potential for retrogradation in food products and gives an idea about retrogradation tendency of starch [50]. It shows the viscosity of cooked paste after cooling to 50 oC. Higher setback value is associated with cohesiveness. The higher the setback viscosity, the lower the retrogradation of the flour paste during cooling of the products made from flour [51]. High setback viscosity is also an indication of the amount of swelling power of samples and is usually related to the amylase content of the sample [52]. Setback viscosity has been correlated with the texture of various end products. Setback viscosity indicates the tendency of starch granules to retrograde on cooling.
Peak time is a measure of the cooking time [4] and it indicates the minimum temperature required to cook flour [25]. There were value reductions in peak, trough, breakdown, set back, and final viscosities except for pasting temperature in the composite flour. As the carbohydrate content increased, the pasting attributes also increased, but as the protein content increased, the pasting attributes decreased.
Since pasting temperature is a measure of the minimum temperature required to cook a given food sample, flour blends with higher pasting temperature may not be recommended for certain products due to high cost of energy [40]. The higher pasting temperature observed with increasing PSF in the blends was due to high protein contents of PSF. A higher
GSC Biological and Pharmaceutical Sciences, 2020, 12(03), 061–072
69
pasting temperature indicates high protein content [40]. Pasting temperature is one of the properties that provide an indication of the minimum temperature required for sample cooking, energy costs involved and other components stability. It is therefore clear from obtained results that WF1 will cook faster and less energy will be consumed, thus saving time and cost when compared to PSF and other flour blends because of its lower pasting temperature.
4.3. Microbiological studies
With the high microbial counts recorded in the results, there are indications of poor storage conditions for WF1 and poor processing quality for PSF and the composites. WF1 was observed to be sold from folded woven sacks which were often displayed open to attract customers in the market. The high oil content of pumpkin flour (PSF) over wheat flour (WF1) as was observed in a study by [36] could contribute to the reduced microbial counts recorded among the blends. In this study, there is a clear correlation between the blending ratios and microbial counts. Hence, as the blending ratio increased, the recorded microbial counts also decreased. Oil is an inhibitory substance that limits growth of aerobic microorganisms. It functions by sealing up the air pores through which air could flow in to support growth of aerobic microorganisms, thereby creating an unconducive environment that is devoid of oxygen (anaerobic). Oil could also be used in preserving food and other edible items because of its negative tendencies in supporting microbial growth especially the aerobes [53]. The results obtained in this study were in agreement with the reports of [54] and [55].
The low moisture content of PSF over WF1 as was reported by Emeka-Ike [36] was another factor pointing towards the reduced microbial counts recorded in the blends. Both moisture content and microbial counts are directly proportional, as the higher the blending ratio of PSF into WF1, lower were the microbial counts. According to Jay et al. [56], the preservation of foods by drying is a direct consequence of removal or binding of moisture, without which microorganisms do not grow. Water activity plays a role with moisture content in the growth of microorganisms, as it is the available water for microbial growth.
5. Conclusion
Functional properties improves mouth feel and flavour retention, and this makes it an important property in food formulations. Pasting property is one of the most important properties that influence quality and aesthetic properties of foods such as changes in texture and digestibility as well as end use of the food product. Generally, functional and pasting properties of flours indicate a relationship between the protein and starch (carbohydrate) contents. Therefore, an increase or decrease in starch or protein contents significantly (p<0.05) affects functional and pasting properties of blended flours, either positively or negatively. Microbiological quality is another important factor considered in determining not just shelf life of products but different processing methods applicable to a particular food, so as to ensure safety of such food products to consumers. This study has shown the effect of inclusion of different levels of pumpkin seed flour (PSF) into wheat flour (WF1) on the physicochemical properties and microbiological safety of the blended flours. The blended flours showed good physicochemical and microbiological properties that would result in high quality and value added products.
Compliance with ethical standards
Acknowledgments
The authors are grateful to contributors.
Disclosure of conflict of interest
No conflict of interest.
References
[1] Younis YMH, Ghirmy S and Al-Shihry SS. (2000). African Cucurbita pepo L: Properties of seed and variability in fatty acid composition of seed oil. Phytochemistry, 54, 71-75.
[2] Chavan UD, Mekenzic DB and Shahidi P. (2001). Functional properties of protein - isolates from Beach Pea (Lathyrus maritimus L.). Food Chemistry, 74, 177- 187.
[3] Jianmei Y, Mohammed A and Goktepe I. (2007). Peanut protein concentrate. Production and functional properties as affected by processing. Food Chemistry, 1303 (1), 121-129.

GSC Biological and Pharmaceutical Sciences, 2020, 12(03), 061–072
70
[4] Adebowale AA, Sanni LO andAwonarin SO. (2005). Effect of texture modifiers on the physicochemical and sensory properties of dried fufu. Food Science and Technology International, 11, 373–382.
[5] Onweluzo JC and Nnamuchi OM. (2009). Production and evaluation of porridge-type breakfast product from Treculia Africana and sorghum bicolor flours. Pakistan Journal of Nutrition,8, 731–736.
[6] Ajanaku KO, Ajanaku CO, and Edobor-Osoh A and Nwinyi OC. (2012). Nutritive value of sorghum ogi fortified with groundnut seed (Arachis hypogaea L.). American Journal of Food Technology,7, 82–88.
[7] Kinsela JE and Phillips L. (1989). Structure-function relationships in food proteins, film and foaming behaviour, In: Kinsdla JE and Soucic W (Eds), Food Proteins. The American Oil Chemists Society. Champaign, 52-77.
[8] Onyango MOA, Habwe FO and Walingo KM. (2008).Food processing and preparation technologies for sustainable utilization of African indigenous vegetables for nutrition security and wealth creation in Kenya. International Journal of Food Science and Technology, 13, 1-9.
[9] Ene C. (2008).Consumer food choices- trends and challenges. Petroleum-Gas University of Ploiesti Bulletin, 2(60), 77-82.
[10] Ogunwolu SO, Henshaw FO, Mock H, Santros A and Awonorin SO. (2009). Functional properties of protein concentrates and isolates produced from cashew (Anacardium occidentale L.) nut. Food Chemistry, 115, 852-858.
[11] Neto VQ, Narain N, Silva JB and Bora PS. (2001). Functional properties of raw and heat processed cashew nut (Anarcardium occidentale L) kernel protein isolate. Nahrung/Food, 45, 258-262.
[12] Eke SO and Akobundu ENT. (1993). Functional properties of African yam bean (Sphenostylis slenocarpa) seed flour as affected by processing. Food Chemistry, 48, 337-340.
[13] Coffman CV and Garcia VV. (1977). Functional properties and amino acid content of a protein isolate from mung bean flour. Journal Food Technology, 12, 473-480.
[14] Akubor PI and Adedeji EO. (2016). Effects of ph and sodium chloride concentration on the functional properties
of locust bean pulp flour. FUW Trends in Science & Technology Journal, 1(2), 344 – 347.
[15] Okezie BO and Bello AE. (1988). Physicochemical and functional properties of winged bean flour and isolate compared with soy-isolate. Journal of Food Science, 53(2), 450-454.
[16] Newport Scientific. (1998). Applications of manual for rapid visco analyzer using thcrmocline for windows. Newport Scientific Ply Ltd. Australia, 2-26.
[17] Cappucino GJR and Sherman B. (2010). Microbiology: A Laboratory Manual, 9thEdition.The Benjamin Publishing Company. California.
[18] Singh U. (2001). Functional properties of grain legume flours. Journal Food Science and Technology, 38, 191-199.
[19] Chandra S and Singh S. (2013). Assessment of functional properties of different flours. African Journal of Agricultural Research, 8(38), 4849–4852.
[20] Nguyen VT and Nguyen TTT. (2018). Production of high-quality flour and the made biscuits from pumpkin, International Journal of Food Science and Nutrition, 3(5), 157-166.
[21] Atuonwu AC and Akobundu ENT. (2010).Functional and pasting properties of pumpkin (Cucurbitapepo) seed products. Journal of Agricultural and Veterinary Sciences, 2, 36-49.
[22] Lorenz K and Collins F. (1980). Quinoa starch physiochemical properties and functional characteristics. Starch, 42, 81-86.
[23] Yusuf MI and Ejeh DD. (2018). Production of bambara groundnut substituted whole wheat bread functional properties and quality characteristics. Journal of Nutrition & Food Sciences, 8(5), 2-7.
[24] Adebowale KO and Lawal OS. (2004). Comparative study of the functional properties of bambarra groundnut (Voandzeia subterranean), jack bean (Canavalia ensiformis) and mucuna bean (Mucuna pruriens) flours. Food Research International, 37, 355–365.
[25] Iwe MO, Onyeukwu U and Agiriga AN. (2016). Proximate, functional and pasting properties of FARO 44 rice, African yam bean and brown cowpea seeds composite flour. Cogent Food and Agriculture, 2, 1-10.
[26] Moure A, Sineiro J, Dominguez H and Parajo JC. (2006). Functionality of oil seed protein products: A review. Food Research International, 39 (9), 945- 963.
GSC Biological and Pharmaceutical Sciences, 2020, 12(03), 061–072
71
[27] Garba U and Kaur S. (2014). Review-protein isolates: Production, functional properties and application. International Research Journal of Chemistry, 4, 22–36.
[28] Mepba HD, Eboh L and Nwaojigwa SU. (2007).Chemical composition, functional and baking properties of wheat-plantain composite flours. African Journal of Food Agriculture, Nutrution and Development, 7(1), 1-23.
[29] Yu J, Ahmedna M and Goktepe I. (2007). Peanut protein concentrate production and functional properties as affected by processing. Food Chemistry, 130(1), 121-129.
[30] Keto A and Nakai S. (1980). Hydrophobicity determined by a flourescence probe method and its correlation with surface properties of proteins, Biochemica et Biophysica Acta, 624(1), 13-20.
[31] Brou, K, N’Da-Kouassi A, Kouadio J, Guehi T, N’Guessan K and Gnakri D. (2013). Biochemical characterization and functional properties of weaning food made from cereals (millet, maize) and legumes (beans, soybeans). Journal of Food Chemistry and Nutrition, 1(1), 22–32.
[32] El-Adawy TA. (2001). Characteristics and composition of watermelon, pumpkin, and paprika seed oils and flours. Journal of Agricultural and Food Chemistry, 49, 1253– 1259.
[33] Osungbaro TO. (1990). Effect of differences in variety and dry milling of maize on textural characteristics of ogi (fermented maize porridge) and agidi (fermented maize meal). Journal of the Science of Food and Agriculture, 52, 1–11.
[34] Ocheme OB, Adedeji OE, Chinma CE, Yakubu CM and Ajibo UH. (2018). Proximate composition, functional, and pasting properties of wheat and groundnut protein concentrate flour blends. Food Science and Nutrition. 6, 1173–1178.
[35] Chandra S, Singh S and Kumari D. (2015). Evaluation of functional properties of composite flours and sensorial attributes of composite flour biscuits. Journal Food Science and Technology, 52(6), 3681–3688.
[36] Emeka-Ike PC. (2020). Potentials of wheat and pumpkin (Cucurbita pepo) seed composite flours in cake making. Unpublished M.Sc. Thesis, Department of Food and Technology, Faculty of Engineering, Imo State University, Owerri, 1-124.
[37] Iwe MO and Onuh JO. (1992). Functional and sensory properties of soybean and sweet potato flour mixtures. Lebensmittelwissenschaft und Technologie, 25, 569–573.
[38] Iwe MO and Onadipe OO. (2001). Effect of addition of extruded full fat soy flour into sweet potato flour on the functional properties of the mixture. Journal of Sustainable Agriculture and the Environment, 3, 109–117.
[39] Gernah DI, Ariahu CC and Ingbian EK. (2011). Effects of malting and lactic fermentation on some chemical and functional properties of maize. The American Journal of Food Technology, 6, 404–412.
[40] Kiin-Kabari DB, Eke-Ejiofor J and Giami SY. (2015). Functional and pasting properties of wheat / plantain flours enriched with bambara groundnut protein concentrate. International Journal of Food Science and Nutrition Engineering, 5(2), 75-81.
[41] Ohizua ER, Adeola AA, Idowu MA, Sobukola OP, Afolabi TA, Ishola RO and Falomo A. (2017). Nutrient composition, functional and pasting properties of unripe cooking banana, pigeon pea and sweet potato flour blend. Food Sciences and Nutrition, 5, 750–762.
[42] Blazek J and Copeland L. (2008). Pasting and swelling properties of wheat flour and starch in relation to amylose content. Carbohydrate Polymers, 71, 380-387.
[43] Danbaba N, Anounye JC, Gana AS, Abo ME, Ukwungwu MN and Maji AT. (2012). Physical and pasting properties of ‘ofada’ rice (Oryza sativa L.) varieties. Nigerian Food Journal, 30, 18–25.
[44] Sanni OL, Adebowale TA, Filani TA, Oyewole OB and Westby A. (2006).Quality of flash and rotary dryer dried fufu flour. Journal of Food, Agriculture and Environment, 4, 74–78.
[45] Adebowale ARA, Sanni SA and Oladapo FO. (2008). Chemical, functional and sensory properties of instant yam-breadfruit flour. Nigerian Food Journal, 26, 2–12.
[46] Sanni AI, Asiedu M and Ayernor GS. (2001). Influence of processing conditions on the nutritive value of ogi- baba, a Nigerian fermented sorghum gruel. Plant Foods for Human Nutrition, 56(3), 217–223.
[47] Kaur M, Shandu KS and Singh N. (2007). Comparative study of the functional, thermal and pasting properties of flour from different chickpea cultivars. Journal of Food Chemistry,104, 259–267.

GSC Biological and Pharmaceutical Sciences, 2020, 12(03), 061–072
72
[48] Ragace S, Adelel-Al EM and Naoman M. (2006). Antioxidant activity and nutrient composition of selected cereals for food use. Food Chemistry, 89, 32-38.
[49] Alais C and Linden G. (1986). Energy and protein intakes of infants and children from the low income group of Ibadan. Nutrition Research, 26, 129-137.
[50] Oduro I, Ellis WO, Argyectry SK, Atenkora K and Otoo JA. (2000). Pasting characteristics of starch from varieties of sweet potato. Tropical Science, 40, 25-28.
[51] Adeyemi IA and Idowu MA. (1990). The evaluation of pre-gelatinized maize flour in the development of maissa, a baked product. Nigerian Food Journal, 8, 63–73.
[52] Jennifer MD and Les C. (2004). Genotype and environmental influences on pasting properties of rice flour. Journal of Cereal Chemistry, 81, 486–489.
[53] Ike CC, Emeka-Ike PC, Nwokorie CC and Anochie CC. (2015). Microbiological quality evaluation of locally prepared snacks sold in Aba metropolis, Abia State, Nigeria. International Journal of Scientific Engineering and Applied Science (IJSEAS),1(7), 46-59.
[54] Manpreet K. (2017). Development and nutritional evaluation of pumpkin seed (Cucurbita moschata) supplemented products. Unpublished M.Sc. Thesis, Department of Food and Nutrition, College of Home Science, Punjab Agricultural University, Ludhiana-141004, 1-89.
[55] Emeka-Ike PC, Ike CC, Nwokorie CC and Ogwuegbu HO. (2019). Food safety processing and evaluation of powdered pap from maize and malted maize with carrot. Elixir International Journal - Elixir Food Science, 132, 53452-53457.
[56] Jay MJ, Loessner MJ and Golden DA. (2005). Modern Food Microbiology, Seventh Edition. Springer Publishers, USA, 39-60.