EVALUATION OF FLEXURAL RESPONSE OF … · EVALUATION OF FLEXURAL RESPONSE OF LAMINATED COMPOSITES...
15
† Corresponding author EVALUATION OF FLEXURAL RESPONSE OF LAMINATED COMPOSITES WITH VARYING REINFORCEMENTS Md. Zakaria Hossain † Department of Environmental Science and technology Graduate School of Bioresources, Mie University, 1515 Kamihama-cho, Tsu, Mie 514-8507, JAPAN +81-59-231-9591, Email: [email protected] Abstract An experimental investigation on the evaluation of flexural response of laminated cement composite containing varying number of layers as well as varying percentage of effective reinforcement has been demonstrated. A comparison of the load-deflection relationships between the varying number and types of layers of laminated composite is reported. Load carrying capacity of the laminated composites at first crack and ultimate loads is depicted. Results obtained revealed that the load carrying capacity increased with the increase in number of layers of reinforcements. The load-deflection relationships fluctuates for chicken-mesh-cement composites whereas it is almost smooth pattern for geogrid-mesh-cement composites with any number of mesh layers. Keywords: First crack load, Flexural behavior, Laminated composite, Load-deflection relationships, Ultimate load 1. INTRODUCTION With the advancement of research technology, use of thin cement composite elements made of cement mortar and layers of continuous and relatively small sized mesh is increasing day by day. Ferrocement is one of the most popular thin cement composite mainly made of cement mortar and steel wire meshes and is especially suitable for spatial structures such as shell and folded plate elements. Recent researches have shown that the basic definition of ferrocement is expanding in scope in the 21st century and it can be reinforced with steel or non-metallic meshes such as fiber reinforced polymeric (FRC) meshes or any other type of reinforcements (Naaman, 2000, 2001, Austriaco, 2001, El Debs and Naaman, 1995). Extensive research works on the use of steel wire meshes in cement composites (ferrocement) have been carried out by a number of researchers (Abdullah and Mansur, 2001, ACI, 1988, Johnston and Mowat, 1974, Hossain and Hasegawa, 1997, 1998, Hossain and Inoue, 2000, Mansur and Kiritharan, 2001 and Austriaco, 2001). Some research works on the use of PVA (poly vinyl alcohol), polypropylene, carbon, Kevlar, polyethylene (spectra) as the reinforcement in cement composite are also found (Ghavami, Filho, and Barbosa, 1999, Mansur and Kiritharan, 2001). The mechanical behavior of thin cement composite elements with sisal, jute bamboo, fabrics and textiles meshes can also be reported by very few researchers (Naaman and Chandrangsu, 2000, Mansur and Kiritharan, 2001). However, the research work on the flexural behavior of geogrid reinforced cement composite as well as Proceedings of the 4th International Conference on Engineering, Project, and Production Management (EPPM 2013) 98
Transcript of EVALUATION OF FLEXURAL RESPONSE OF … · EVALUATION OF FLEXURAL RESPONSE OF LAMINATED COMPOSITES...
† Corresponding author
EVALUATION OF FLEXURAL RESPONSE OF LAMINATED
COMPOSITES WITH VARYING REINFORCEMENTS
Md. Zakaria Hossain †
Department of Environmental Science and technology Graduate School of Bioresources, Mie University, 1515 Kamihama-cho, Tsu, Mie 514-8507, JAPAN +81-59-231-9591, Email: [email protected]
Abstract An experimental investigation on the evaluation of flexural response of laminated cement
composite containing varying number of layers as well as varying percentage of effective
reinforcement has been demonstrated. A comparison of the load-deflection relationships
between the varying number and types of layers of laminated composite is reported. Load
carrying capacity of the laminated composites at first crack and ultimate loads is depicted.
Results obtained revealed that the load carrying capacity increased with the increase in
number of layers of reinforcements. The load-deflection relationships fluctuates for
chicken-mesh-cement composites whereas it is almost smooth pattern for
geogrid-mesh-cement composites with any number of mesh layers.
Keywords: First crack load, Flexural behavior, Laminated composite, Load-deflection
relationships, Ultimate load
1. INTRODUCTION
With the advancement of research technology, use of thin cement composite elements
made of cement mortar and layers of continuous and relatively small sized mesh is increasing
day by day. Ferrocement is one of the most popular thin cement composite mainly made of
cement mortar and steel wire meshes and is especially suitable for spatial structures such as
shell and folded plate elements. Recent researches have shown that the basic definition of
ferrocement is expanding in scope in the 21st century and it can be reinforced with steel or
non-metallic meshes such as fiber reinforced polymeric (FRC) meshes or any other type of
reinforcements (Naaman, 2000, 2001, Austriaco, 2001, El Debs and Naaman, 1995).
Extensive research works on the use of steel wire meshes in cement composites (ferrocement)
have been carried out by a number of researchers (Abdullah and Mansur, 2001, ACI, 1988,
Johnston and Mowat, 1974, Hossain and Hasegawa, 1997, 1998, Hossain and Inoue, 2000,
Mansur and Kiritharan, 2001 and Austriaco, 2001). Some research works on the use of PVA
(poly vinyl alcohol), polypropylene, carbon, Kevlar, polyethylene (spectra) as the
reinforcement in cement composite are also found (Ghavami, Filho, and Barbosa, 1999,
Mansur and Kiritharan, 2001). The mechanical behavior of thin cement composite elements
with sisal, jute bamboo, fabrics and textiles meshes can also be reported by very few
researchers (Naaman and Chandrangsu, 2000, Mansur and Kiritharan, 2001). However, the
research work on the flexural behavior of geogrid reinforced cement composite as well as
Proceedings of the 4th International Conference on Engineering, Project, and Production Management (EPPM 2013)
98
comparative study with wire meshes is relatively scarce in spite of their great concern
especially in the water related structures. Ferrocement (thin cementitious composite with steel
wire meshes) when apply as the protection of reinforced concrete in salt water and when it
comes in touch with water, again raised some questions about its steel rusting. In such cases,
the geogrid mesh may be much more suitable as the reinforcement in cement composite
elements over the wire mesh reinforced cement composites. It is, therefore, prime importance
to study the mechanical behavior of this kind of composite material as well as the
comparative study of these cement composite elements and their composite properties
reinforced by both the mesh type for its effective use. It is also necessary to carry out
comparative research study on the effect of salt water on ferrocement and geogrid cement.
At a first investigation, the present research deals with the basic mechanical properties in
flexure such as load-deflection behavior and bearing capacity of thin cement composite
elements reinforced with welded square geogrid mesh and chicken (hexagonal) mesh
subjected to direct flexure. The major parameters investigated in this study are the number
and type of mesh layers in terms effective reinforcement as well as volume fraction of
reinforcement and the thickness of the cement composite elements. An experimental
investigation of 16 rectangular elements of sizes 200×400 mm with thickness 20 and 30 mm
reinforced with welded square geogrid mesh and chicken wire mesh has been carried out in
the laboratory. All the elements were tested under two point flexural loadings after 28 days of
curing. Results on load-deflection relationships, first crack and ultimate loads are reported and
pertinent discussion as regards to the efficiency of the investigated parameters are drawn.
2. MATERIALS AND METHODS
2.1 Method of specimen preparation
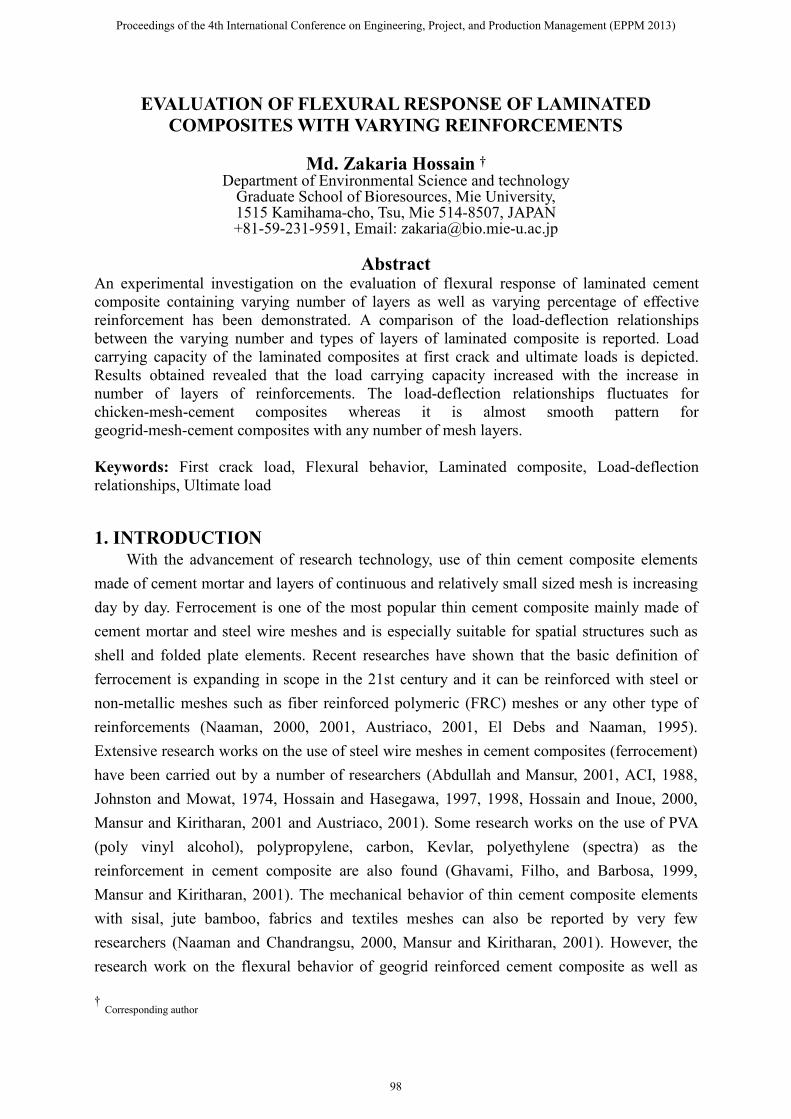
The specimens were made in wooden moulds with open tops. The moulds were made in
a form such that each of the four side walls and the base of the form work were detachable so
that the mould could be easily separated from cast element after its initial setting. Four timber
moulds were used in a batch. Indelible ink markings were made on all inside surfaces to
indicate levels of different mesh layers during casting. Therefore, a clear cover of 2 mm was
maintained at the bottom (tension) and top (compression) sides. The casting process is shown
in Fig.1.
The type of mesh impregnated, the number of layers, and the arrangement of the mesh were
marked on the element, and the date of casting was recorded. The requisite amount of sand
and cement was mixed dry in a pan, and then the requisite quantity of water was added
gradually while the mix was continuously stirred. The contact surfaces of the wooden mould
to the mortar were greased before casting the specimens to ease the demoulding process.
Proceedings of the 4th International Conference on Engineering, Project, and Production Management (EPPM 2013)
99
Figure 1: Wooden mould showing casting process
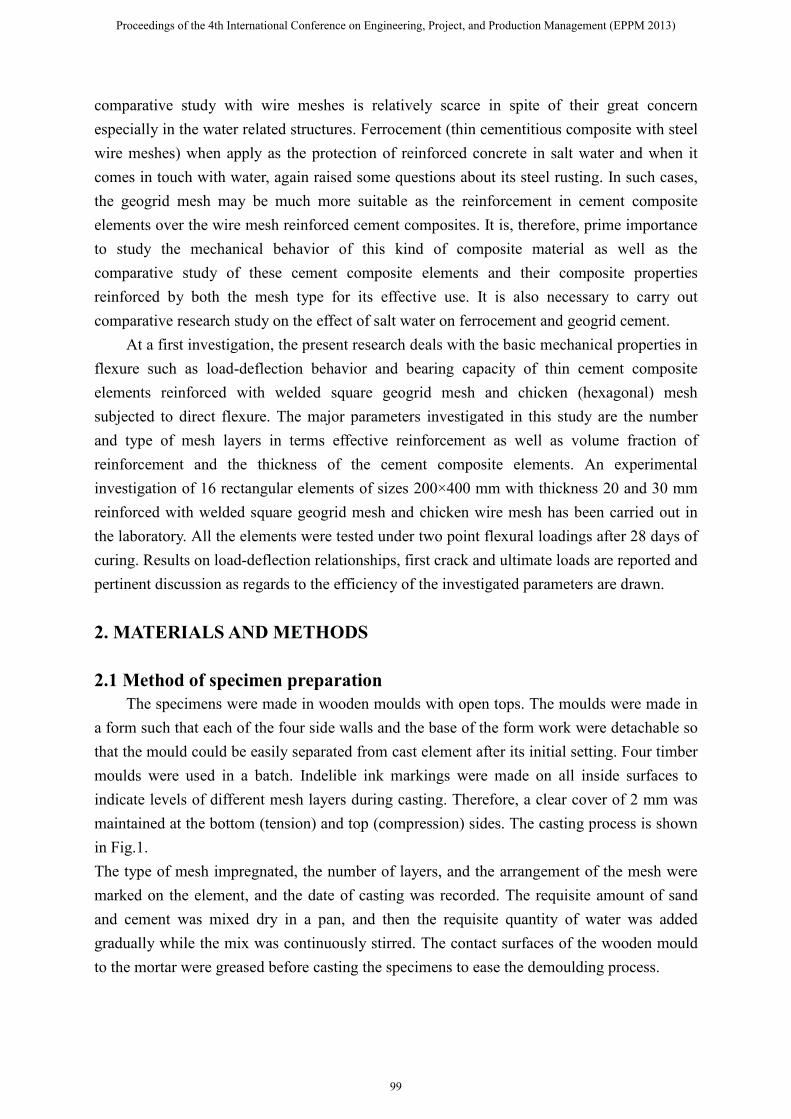
Ordinary Portland cement and river sand passing through a No.8 (2.38mm) sieve, which
has a fineness modulus of 2.33, were used for casting. For all the specimens, both of the ratios
(water to cement ratio and cement to sand ratio) were 0.5 by weight. In each casting, four
elements along with two elements of plain mortar of size 100×200 mm with thickness 20 and
30 mm, and three cylinders of diameter 100 mm and length 120 mm, were cast and tested to
find the compressive strength, modulus of elasticity and Poisson's ratio of the mortar: these
values are given in Table 1. Some elements ready for test is shown in Fig. 2.
Figure 2: Some elements after initial setting
An ordinary mesh obtained from the market was cut to obtain the requisite number of
layers of desired size and orientation. The sand cement mortar layer was spread at the base of
the mould, and on this base layer the first mesh was laid. The mesh layer was then covered by
another layer of mortar, and the process was repeated until the specimen contains the desired
number of mesh layers. Thus, the thickness of 20 or 30 mm was equally divided by the mesh
layers, leaving a cover of 2 mm at the top and bottom surfaces. The specimens were air-dried
for 24 hours for initial setting and then immersed in water for curing. The specimens were
removed from water after four weeks (28 days) and were air-dried for 48 hours in room
temperature of about 10oC and relative humidity of about 40%; then the test was performed.
Proceedings of the 4th International Conference on Engineering, Project, and Production Management (EPPM 2013)
100
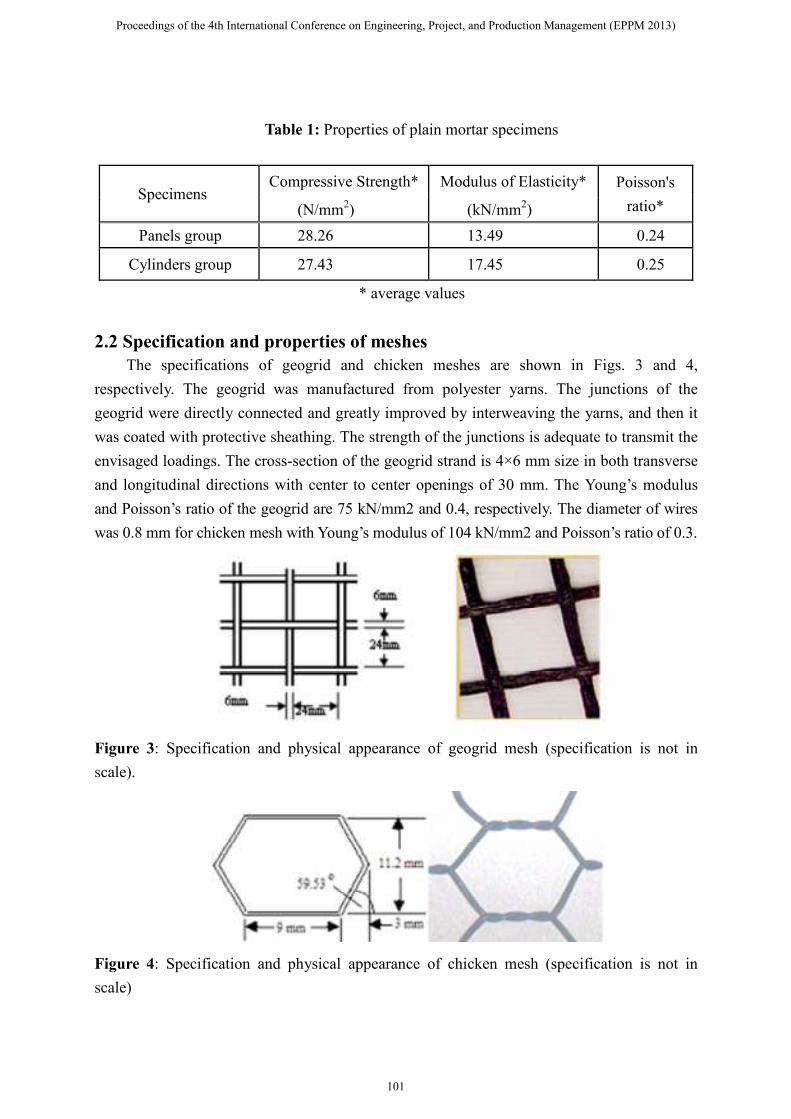
Table 1: Properties of plain mortar specimens
Specimens Compressive Strength* Modulus of Elasticity* Poisson's
ratio* (N/mm2) (kN/mm
2)
Panels group 28.26 13.49 0.24
Cylinders group 27.43 17.45 0.25
* average values
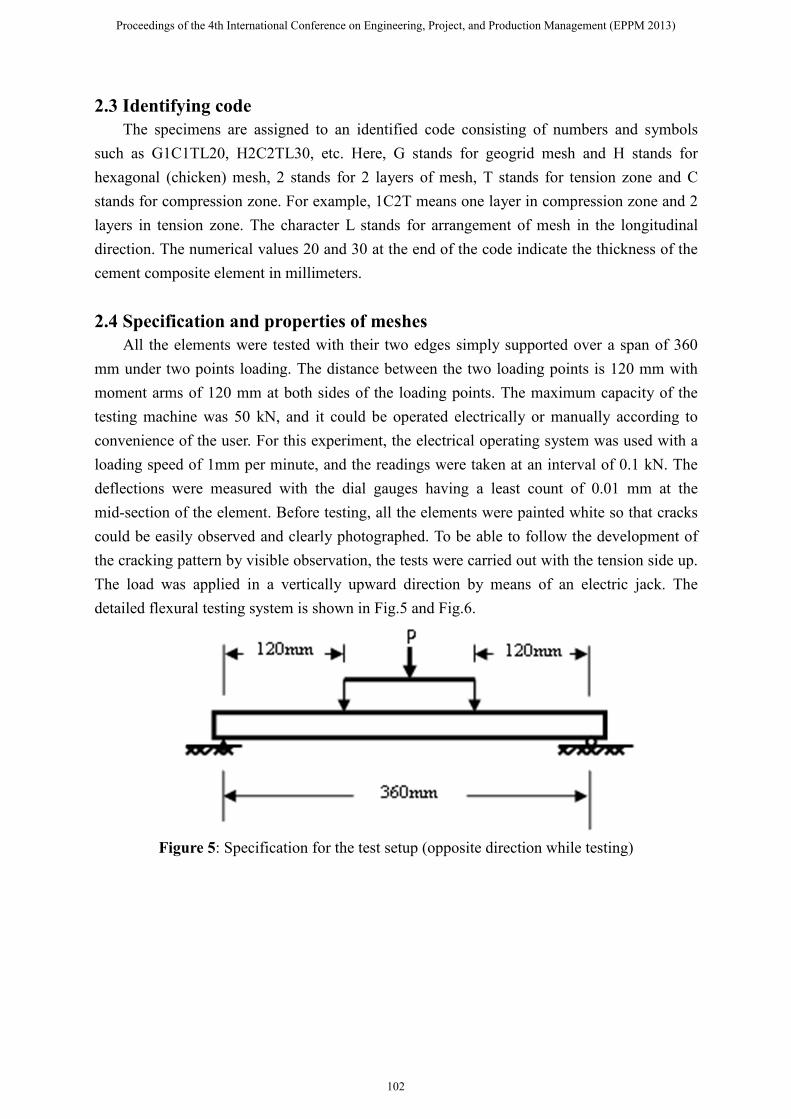
2.2 Specification and properties of meshes
The specifications of geogrid and chicken meshes are shown in Figs. 3 and 4,
respectively. The geogrid was manufactured from polyester yarns. The junctions of the
geogrid were directly connected and greatly improved by interweaving the yarns, and then it
was coated with protective sheathing. The strength of the junctions is adequate to transmit the
envisaged loadings. The cross-section of the geogrid strand is 4×6 mm size in both transverse
and longitudinal directions with center to center openings of 30 mm. The Young’s modulus
and Poisson’s ratio of the geogrid are 75 kN/mm2 and 0.4, respectively. The diameter of wires
was 0.8 mm for chicken mesh with Young’s modulus of 104 kN/mm2 and Poisson’s ratio of 0.3.
Figure 3: Specification and physical appearance of geogrid mesh (specification is not in
scale).
Figure 4: Specification and physical appearance of chicken mesh (specification is not in
scale)
Proceedings of the 4th International Conference on Engineering, Project, and Production Management (EPPM 2013)
101
2.3 Identifying code
The specimens are assigned to an identified code consisting of numbers and symbols
such as G1C1TL20, H2C2TL30, etc. Here, G stands for geogrid mesh and H stands for
hexagonal (chicken) mesh, 2 stands for 2 layers of mesh, T stands for tension zone and C
stands for compression zone. For example, 1C2T means one layer in compression zone and 2
layers in tension zone. The character L stands for arrangement of mesh in the longitudinal
direction. The numerical values 20 and 30 at the end of the code indicate the thickness of the
cement composite element in millimeters.
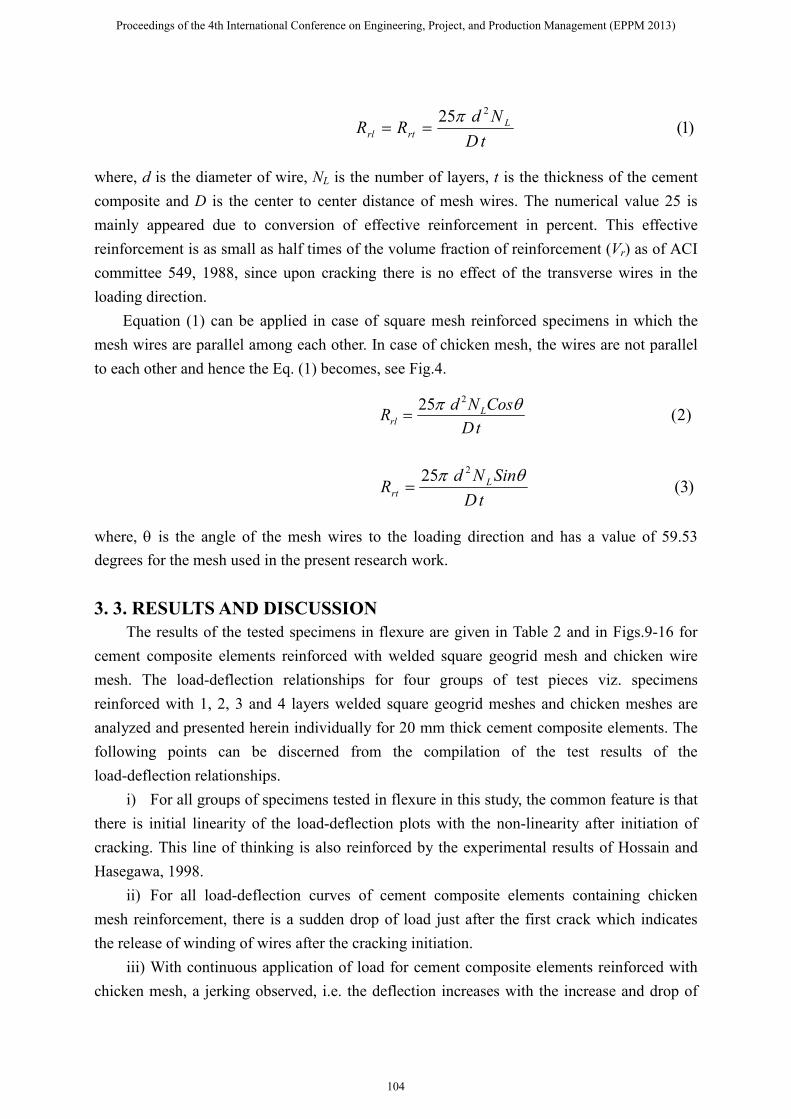
2.4 Specification and properties of meshes
All the elements were tested with their two edges simply supported over a span of 360
mm under two points loading. The distance between the two loading points is 120 mm with
moment arms of 120 mm at both sides of the loading points. The maximum capacity of the
testing machine was 50 kN, and it could be operated electrically or manually according to
convenience of the user. For this experiment, the electrical operating system was used with a
loading speed of 1mm per minute, and the readings were taken at an interval of 0.1 kN. The
deflections were measured with the dial gauges having a least count of 0.01 mm at the
mid-section of the element. Before testing, all the elements were painted white so that cracks
could be easily observed and clearly photographed. To be able to follow the development of
the cracking pattern by visible observation, the tests were carried out with the tension side up.
The load was applied in a vertically upward direction by means of an electric jack. The
detailed flexural testing system is shown in Fig.5 and Fig.6.
Figure 5: Specification for the test setup (opposite direction while testing)
Proceedings of the 4th International Conference on Engineering, Project, and Production Management (EPPM 2013)
102

Figure 6: Setting up for test of composite elements
The load application continued until the deflection became excessive. In general, most of
the elements produce initial cracks (visible to the naked eye) without any cracking noise.
Cement composite elements impregnated with chicken mesh showed some drop in the load
after the initial cracks and then jerking with the gradual increase of load. The crack patterns of
the tested elements in flexure are shown in Figs.7 and 8.
Figure 7: Crack pattern of cement composite with geogrid mesh
Figure 8: Crack pattern of cement composite with chicken mesh
2.5 Effective reinforcement
The effective reinforcement of the cement composite in a direction is defined as the ratio
of the area of mesh wires to the total area of specimen in the same direction. The percent
effective reinforcement Rrl in the longitudinal direction and Rrt in the transverse direction for
cement composite element containing square mesh in any direction after the cracking
initiation can be written as:
Proceedings of the 4th International Conference on Engineering, Project, and Production Management (EPPM 2013)
103
)1(25 2
tD
NdRR L
rtrl
π==
where, d is the diameter of wire, NL is the number of layers, t is the thickness of the cement
composite and D is the center to center distance of mesh wires. The numerical value 25 is
mainly appeared due to conversion of effective reinforcement in percent. This effective
reinforcement is as small as half times of the volume fraction of reinforcement (Vr) as of ACI
committee 549, 1988, since upon cracking there is no effect of the transverse wires in the
loading direction.
Equation (1) can be applied in case of square mesh reinforced specimens in which the
mesh wires are parallel among each other. In case of chicken mesh, the wires are not parallel
to each other and hence the Eq. (1) becomes, see Fig.4.
)2(25 2
tD
CosNdR L
rl
θπ=
)3(25 2
tD
SinNdR L
rt
θπ=
where, θ is the angle of the mesh wires to the loading direction and has a value of 59.53
degrees for the mesh used in the present research work.
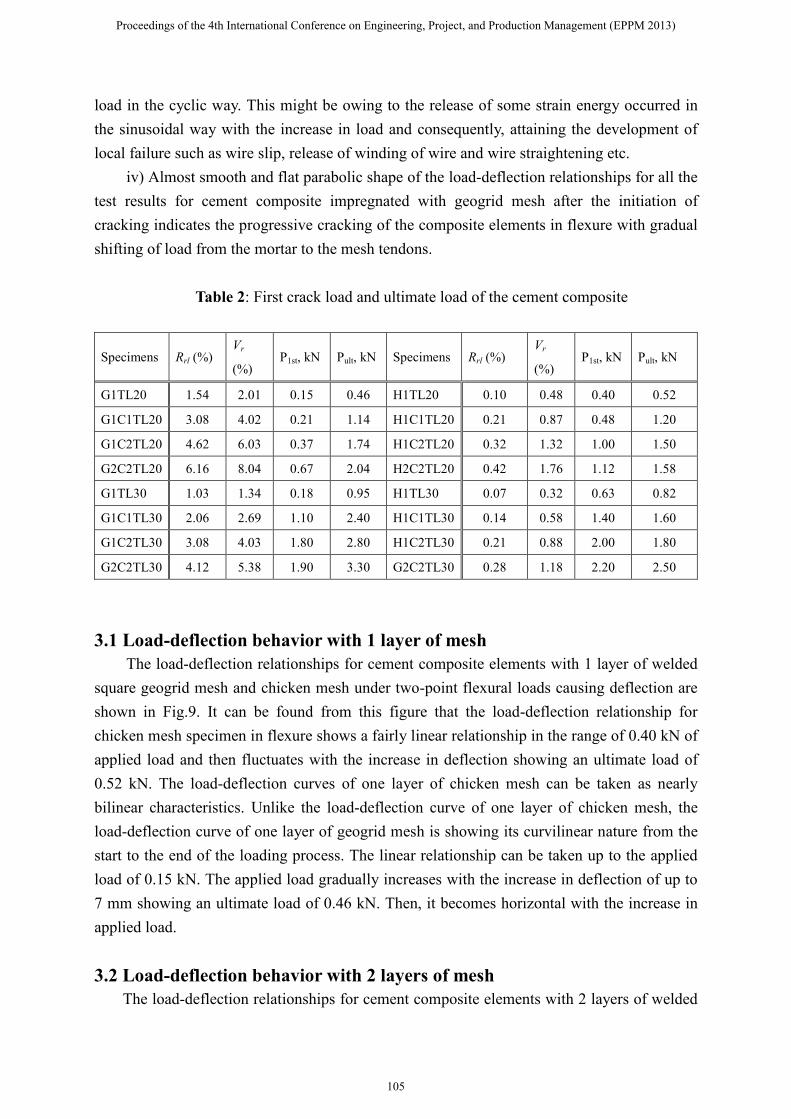
3. 3. RESULTS AND DISCUSSION
The results of the tested specimens in flexure are given in Table 2 and in Figs.9-16 for
cement composite elements reinforced with welded square geogrid mesh and chicken wire
mesh. The load-deflection relationships for four groups of test pieces viz. specimens
reinforced with 1, 2, 3 and 4 layers welded square geogrid meshes and chicken meshes are
analyzed and presented herein individually for 20 mm thick cement composite elements. The
following points can be discerned from the compilation of the test results of the
load-deflection relationships.
i) For all groups of specimens tested in flexure in this study, the common feature is that
there is initial linearity of the load-deflection plots with the non-linearity after initiation of
cracking. This line of thinking is also reinforced by the experimental results of Hossain and
Hasegawa, 1998.
ii) For all load-deflection curves of cement composite elements containing chicken
mesh reinforcement, there is a sudden drop of load just after the first crack which indicates
the release of winding of wires after the cracking initiation.
iii) With continuous application of load for cement composite elements reinforced with
chicken mesh, a jerking observed, i.e. the deflection increases with the increase and drop of
Proceedings of the 4th International Conference on Engineering, Project, and Production Management (EPPM 2013)
104
load in the cyclic way. This might be owing to the release of some strain energy occurred in
the sinusoidal way with the increase in load and consequently, attaining the development of
local failure such as wire slip, release of winding of wire and wire straightening etc.
iv) Almost smooth and flat parabolic shape of the load-deflection relationships for all the
test results for cement composite impregnated with geogrid mesh after the initiation of
cracking indicates the progressive cracking of the composite elements in flexure with gradual
shifting of load from the mortar to the mesh tendons.
Table 2: First crack load and ultimate load of the cement composite
Specimens Rrl (%) Vr
(%) P1st, kN Pult, kN Specimens Rrl (%)
Vr
(%) P1st, kN Pult, kN
G1TL20 1.54 2.01 0.15 0.46 H1TL20 0.10 0.48 0.40 0.52
G1C1TL20 3.08 4.02 0.21 1.14 H1C1TL20 0.21 0.87 0.48 1.20
G1C2TL20 4.62 6.03 0.37 1.74 H1C2TL20 0.32 1.32 1.00 1.50
G2C2TL20 6.16 8.04 0.67 2.04 H2C2TL20 0.42 1.76 1.12 1.58
G1TL30 1.03 1.34 0.18 0.95 H1TL30 0.07 0.32 0.63 0.82
G1C1TL30 2.06 2.69 1.10 2.40 H1C1TL30 0.14 0.58 1.40 1.60
G1C2TL30 3.08 4.03 1.80 2.80 H1C2TL30 0.21 0.88 2.00 1.80
G2C2TL30 4.12 5.38 1.90 3.30 G2C2TL30 0.28 1.18 2.20 2.50
3.1 Load-deflection behavior with 1 layer of mesh
The load-deflection relationships for cement composite elements with 1 layer of welded
square geogrid mesh and chicken mesh under two-point flexural loads causing deflection are
shown in Fig.9. It can be found from this figure that the load-deflection relationship for
chicken mesh specimen in flexure shows a fairly linear relationship in the range of 0.40 kN of
applied load and then fluctuates with the increase in deflection showing an ultimate load of
0.52 kN. The load-deflection curves of one layer of chicken mesh can be taken as nearly
bilinear characteristics. Unlike the load-deflection curve of one layer of chicken mesh, the
load-deflection curve of one layer of geogrid mesh is showing its curvilinear nature from the
start to the end of the loading process. The linear relationship can be taken up to the applied
load of 0.15 kN. The applied load gradually increases with the increase in deflection of up to
7 mm showing an ultimate load of 0.46 kN. Then, it becomes horizontal with the increase in
applied load.
3.2 Load-deflection behavior with 2 layers of mesh
The load-deflection relationships for cement composite elements with 2 layers of welded
Proceedings of the 4th International Conference on Engineering, Project, and Production Management (EPPM 2013)
105
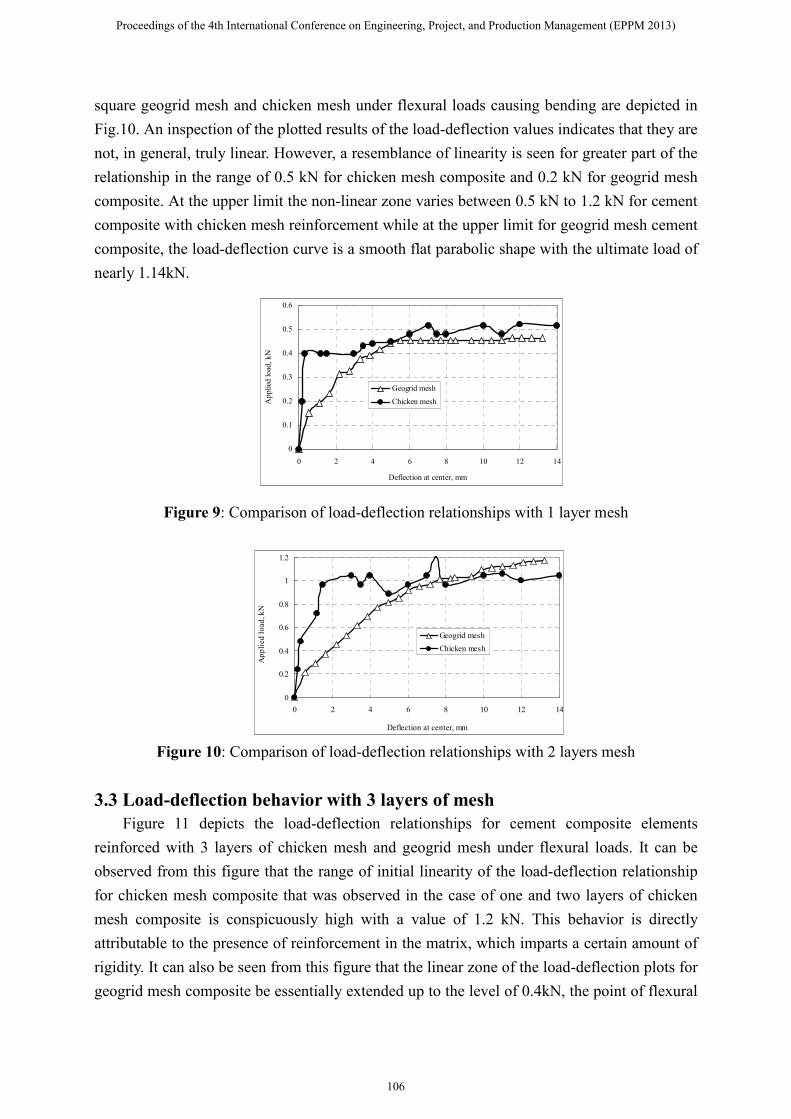
square geogrid mesh and chicken mesh under flexural loads causing bending are depicted in
Fig.10. An inspection of the plotted results of the load-deflection values indicates that they are
not, in general, truly linear. However, a resemblance of linearity is seen for greater part of the
relationship in the range of 0.5 kN for chicken mesh composite and 0.2 kN for geogrid mesh
composite. At the upper limit the non-linear zone varies between 0.5 kN to 1.2 kN for cement
composite with chicken mesh reinforcement while at the upper limit for geogrid mesh cement
composite, the load-deflection curve is a smooth flat parabolic shape with the ultimate load of
nearly 1.14kN.
Figure 9: Comparison of load-deflection relationships with 1 layer mesh
Figure 10: Comparison of load-deflection relationships with 2 layers mesh
3.3 Load-deflection behavior with 3 layers of mesh
Figure 11 depicts the load-deflection relationships for cement composite elements
reinforced with 3 layers of chicken mesh and geogrid mesh under flexural loads. It can be
observed from this figure that the range of initial linearity of the load-deflection relationship
for chicken mesh composite that was observed in the case of one and two layers of chicken
mesh composite is conspicuously high with a value of 1.2 kN. This behavior is directly
attributable to the presence of reinforcement in the matrix, which imparts a certain amount of
rigidity. It can also be seen from this figure that the linear zone of the load-deflection plots for
geogrid mesh composite be essentially extended up to the level of 0.4kN, the point of flexural
0
0.1
0.2
0.3
0.4
0.5
0.6
0 2 4 6 8 10 12 14
Deflection at center, mm
Ap
pli
ed l
oad
, k
N
Geogrid mesh
Chicken mesh
0
0.2
0.4
0.6
0.8
1
1.2
0 2 4 6 8 10 12 14
Deflection at center, mm
Ap
pli
ed l
oad
, kN
Geogrid mesh
Chicken mesh
Proceedings of the 4th International Conference on Engineering, Project, and Production Management (EPPM 2013)
106
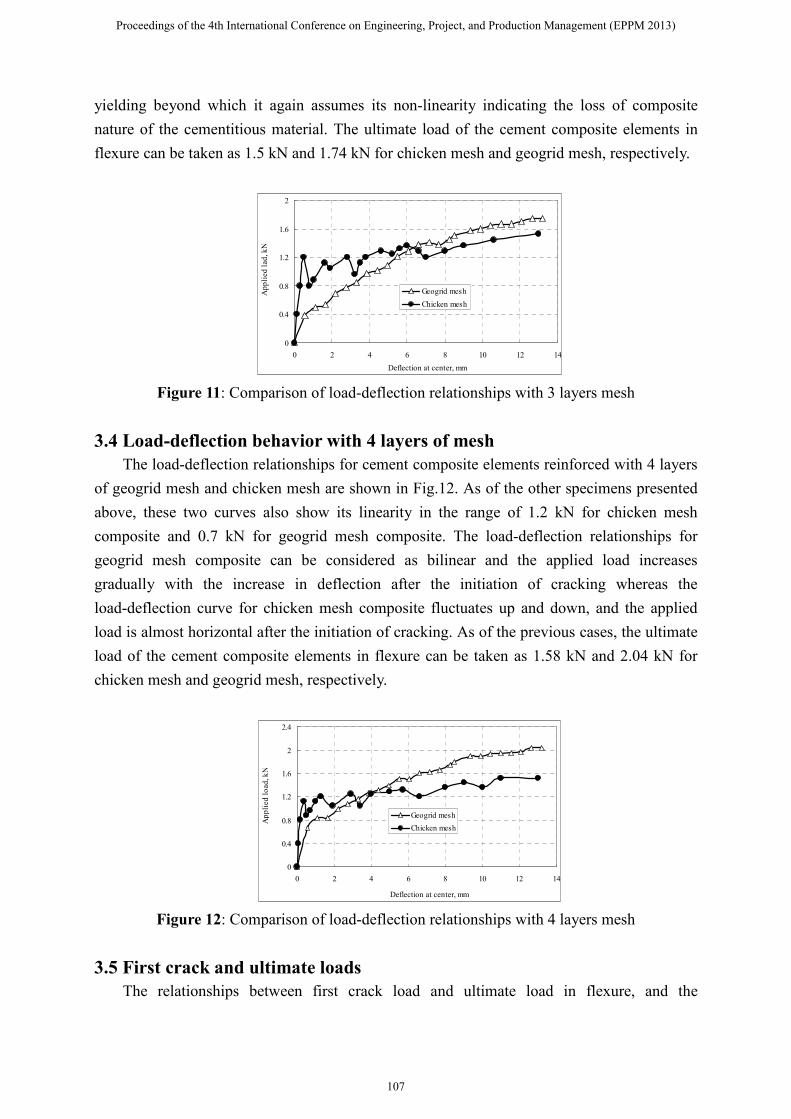
yielding beyond which it again assumes its non-linearity indicating the loss of composite
nature of the cementitious material. The ultimate load of the cement composite elements in
flexure can be taken as 1.5 kN and 1.74 kN for chicken mesh and geogrid mesh, respectively.
Figure 11: Comparison of load-deflection relationships with 3 layers mesh
3.4 Load-deflection behavior with 4 layers of mesh
The load-deflection relationships for cement composite elements reinforced with 4 layers
of geogrid mesh and chicken mesh are shown in Fig.12. As of the other specimens presented
above, these two curves also show its linearity in the range of 1.2 kN for chicken mesh
composite and 0.7 kN for geogrid mesh composite. The load-deflection relationships for
geogrid mesh composite can be considered as bilinear and the applied load increases
gradually with the increase in deflection after the initiation of cracking whereas the
load-deflection curve for chicken mesh composite fluctuates up and down, and the applied
load is almost horizontal after the initiation of cracking. As of the previous cases, the ultimate
load of the cement composite elements in flexure can be taken as 1.58 kN and 2.04 kN for
chicken mesh and geogrid mesh, respectively.
Figure 12: Comparison of load-deflection relationships with 4 layers mesh
3.5 First crack and ultimate loads
The relationships between first crack load and ultimate load in flexure, and the
0
0.4
0.8
1.2
1.6
2
0 2 4 6 8 10 12 14
Deflection at center, mm
Ap
pli
ed
lad
, k
N
Geogrid mesh
Chicken mesh
0
0.4
0.8
1.2
1.6
2
2.4
0 2 4 6 8 10 12 14
Deflection at center, mm
Ap
pli
ed
lo
ad
, k
N
Geogrid mesh
Chicken mesh
Proceedings of the 4th International Conference on Engineering, Project, and Production Management (EPPM 2013)
107
percentage reinforcement in cement composite elements are studied and the results are
analyzed to establish the material behavior and property of cement composite elements
reinforced with welded square geogrid meshes and chicken meshes. The strength properties in
terms of first crack and ultimate loads of the cement composite elements reinforced with
chicken mesh and geogrid mesh in flexure are summarized in Table 2. From the data given in
Table 2, we can arrive at the following opinions.
i) Scatters in the flexural test results regarding the first crack and ultimate loads is a common
feature for the individual specimen reinforced with geogrid and chicken meshes.
ii) There is an upswing in the values of first crack and ultimate load with the increase in
number of layers for cement composite reinforced with chicken mesh and geogrid mesh.
iii) Both the first crack and ultimate load in flexure for cement composite elements with any
type of reinforcement is increased with the increase in thickness.
For more clarification and clear perception, the data given in Table 2 are plotted in
Figs.13-16, in terms of first crack and ultimate loads with the variation of reinforcement for
20 and 30 mm thick cement composite elements reinforced with geogrid and chicken meshes.
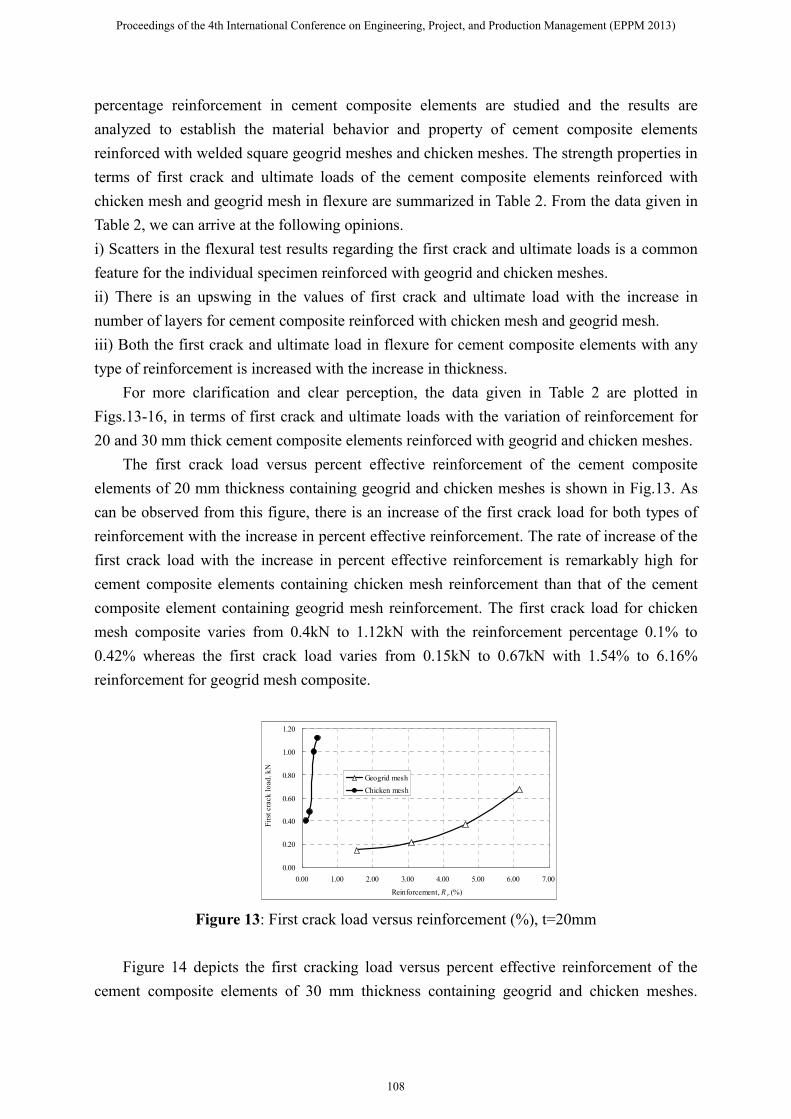
The first crack load versus percent effective reinforcement of the cement composite
elements of 20 mm thickness containing geogrid and chicken meshes is shown in Fig.13. As
can be observed from this figure, there is an increase of the first crack load for both types of
reinforcement with the increase in percent effective reinforcement. The rate of increase of the
first crack load with the increase in percent effective reinforcement is remarkably high for
cement composite elements containing chicken mesh reinforcement than that of the cement
composite element containing geogrid mesh reinforcement. The first crack load for chicken
mesh composite varies from 0.4kN to 1.12kN with the reinforcement percentage 0.1% to
0.42% whereas the first crack load varies from 0.15kN to 0.67kN with 1.54% to 6.16%
reinforcement for geogrid mesh composite.
Figure 13: First crack load versus reinforcement (%), t=20mm
Figure 14 depicts the first cracking load versus percent effective reinforcement of the
cement composite elements of 30 mm thickness containing geogrid and chicken meshes.
0.00
0.20
0.40
0.60
0.80
1.00
1.20
0.00 1.00 2.00 3.00 4.00 5.00 6.00 7.00
Reinforcement, R r (%)
Fir
st c
rack
lo
ad. k
N
Geogrid mesh
Chicken mesh
Proceedings of the 4th International Conference on Engineering, Project, and Production Management (EPPM 2013)
108
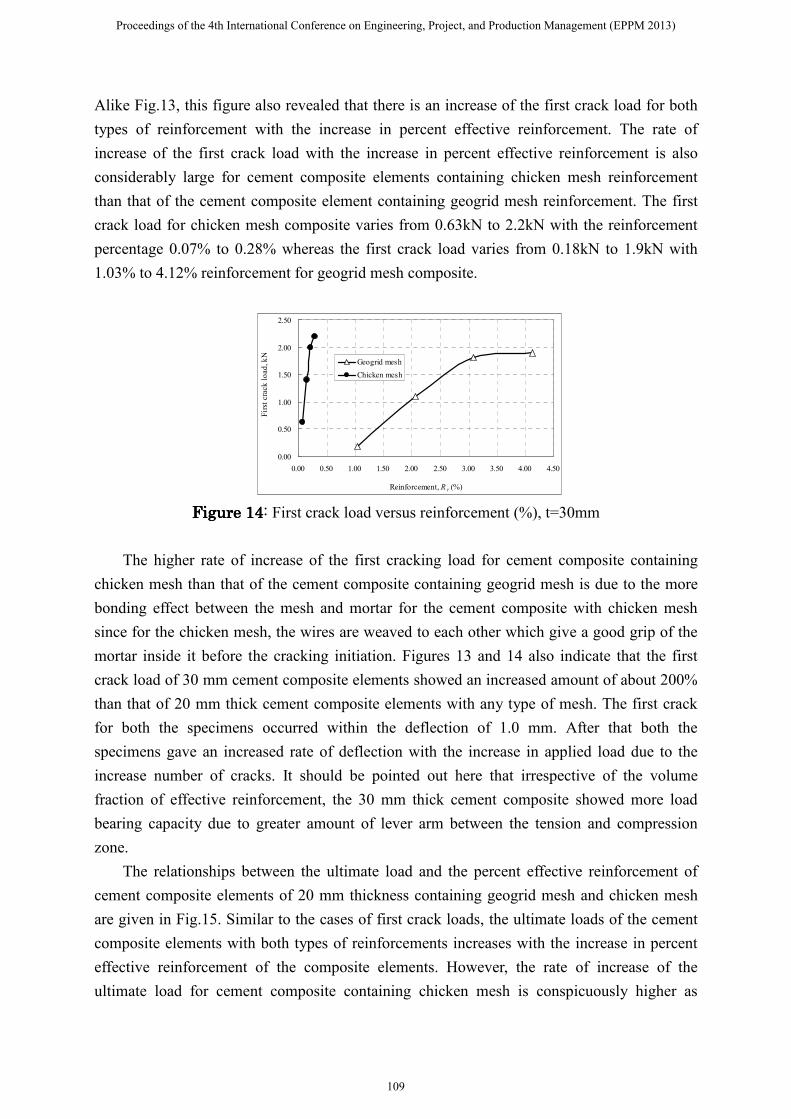
Alike Fig.13, this figure also revealed that there is an increase of the first crack load for both
types of reinforcement with the increase in percent effective reinforcement. The rate of
increase of the first crack load with the increase in percent effective reinforcement is also
considerably large for cement composite elements containing chicken mesh reinforcement
than that of the cement composite element containing geogrid mesh reinforcement. The first
crack load for chicken mesh composite varies from 0.63kN to 2.2kN with the reinforcement
percentage 0.07% to 0.28% whereas the first crack load varies from 0.18kN to 1.9kN with
1.03% to 4.12% reinforcement for geogrid mesh composite.
Figure Figure Figure Figure 14141414: First crack load versus reinforcement (%), t=30mm
The higher rate of increase of the first cracking load for cement composite containing
chicken mesh than that of the cement composite containing geogrid mesh is due to the more
bonding effect between the mesh and mortar for the cement composite with chicken mesh
since for the chicken mesh, the wires are weaved to each other which give a good grip of the
mortar inside it before the cracking initiation. Figures 13 and 14 also indicate that the first
crack load of 30 mm cement composite elements showed an increased amount of about 200%
than that of 20 mm thick cement composite elements with any type of mesh. The first crack
for both the specimens occurred within the deflection of 1.0 mm. After that both the
specimens gave an increased rate of deflection with the increase in applied load due to the
increase number of cracks. It should be pointed out here that irrespective of the volume
fraction of effective reinforcement, the 30 mm thick cement composite showed more load
bearing capacity due to greater amount of lever arm between the tension and compression
zone.
The relationships between the ultimate load and the percent effective reinforcement of
cement composite elements of 20 mm thickness containing geogrid mesh and chicken mesh
are given in Fig.15. Similar to the cases of first crack loads, the ultimate loads of the cement
composite elements with both types of reinforcements increases with the increase in percent
effective reinforcement of the composite elements. However, the rate of increase of the
ultimate load for cement composite containing chicken mesh is conspicuously higher as
0.00
0.50
1.00
1.50
2.00
2.50
0.00 0.50 1.00 1.50 2.00 2.50 3.00 3.50 4.00 4.50
Reinforcement, R r (%)
Fir
st c
rack
lo
ad
, k
N
Geogrid mesh
Chicken mesh
Proceedings of the 4th International Conference on Engineering, Project, and Production Management (EPPM 2013)
109
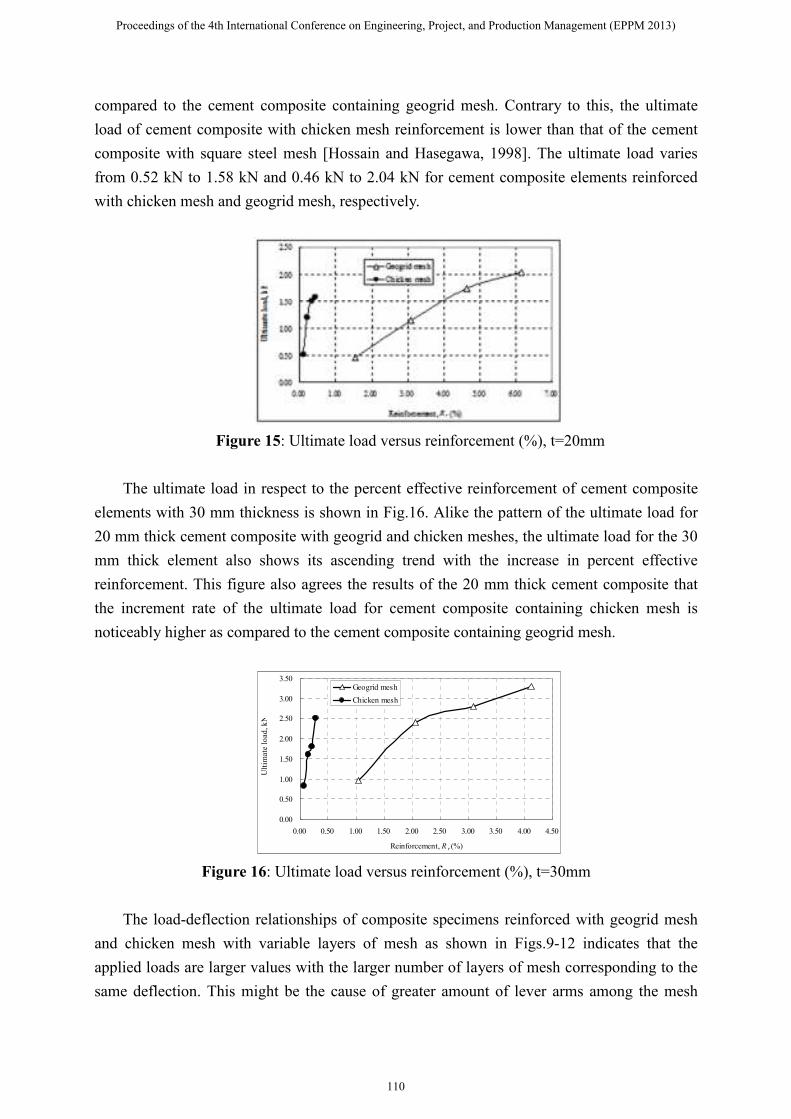
compared to the cement composite containing geogrid mesh. Contrary to this, the ultimate
load of cement composite with chicken mesh reinforcement is lower than that of the cement
composite with square steel mesh [Hossain and Hasegawa, 1998]. The ultimate load varies
from 0.52 kN to 1.58 kN and 0.46 kN to 2.04 kN for cement composite elements reinforced
with chicken mesh and geogrid mesh, respectively.
Figure 15: Ultimate load versus reinforcement (%), t=20mm
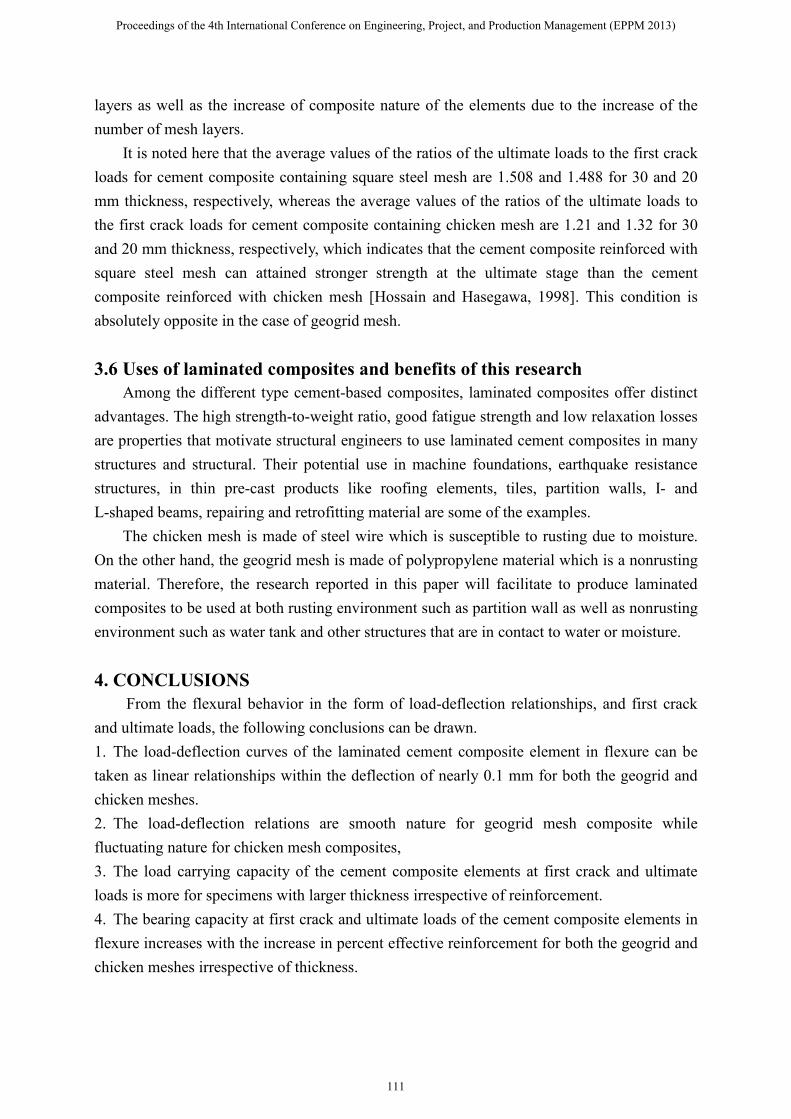
The ultimate load in respect to the percent effective reinforcement of cement composite
elements with 30 mm thickness is shown in Fig.16. Alike the pattern of the ultimate load for
20 mm thick cement composite with geogrid and chicken meshes, the ultimate load for the 30
mm thick element also shows its ascending trend with the increase in percent effective
reinforcement. This figure also agrees the results of the 20 mm thick cement composite that
the increment rate of the ultimate load for cement composite containing chicken mesh is
noticeably higher as compared to the cement composite containing geogrid mesh.
Figure 16: Ultimate load versus reinforcement (%), t=30mm
The load-deflection relationships of composite specimens reinforced with geogrid mesh
and chicken mesh with variable layers of mesh as shown in Figs.9-12 indicates that the
applied loads are larger values with the larger number of layers of mesh corresponding to the
same deflection. This might be the cause of greater amount of lever arms among the mesh
0.00
0.50
1.00
1.50
2.00
2.50
3.00
3.50
0.00 0.50 1.00 1.50 2.00 2.50 3.00 3.50 4.00 4.50
Reinforcement, R r (%)
Ult
imate
lo
ad
, k
N
Geogrid mesh
Chicken mesh
Proceedings of the 4th International Conference on Engineering, Project, and Production Management (EPPM 2013)
110
layers as well as the increase of composite nature of the elements due to the increase of the
number of mesh layers.
It is noted here that the average values of the ratios of the ultimate loads to the first crack
loads for cement composite containing square steel mesh are 1.508 and 1.488 for 30 and 20
mm thickness, respectively, whereas the average values of the ratios of the ultimate loads to
the first crack loads for cement composite containing chicken mesh are 1.21 and 1.32 for 30
and 20 mm thickness, respectively, which indicates that the cement composite reinforced with
square steel mesh can attained stronger strength at the ultimate stage than the cement
composite reinforced with chicken mesh [Hossain and Hasegawa, 1998]. This condition is
absolutely opposite in the case of geogrid mesh.
3.6 Uses of laminated composites and benefits of this research
Among the different type cement-based composites, laminated composites offer distinct
advantages. The high strength-to-weight ratio, good fatigue strength and low relaxation losses
are properties that motivate structural engineers to use laminated cement composites in many
structures and structural. Their potential use in machine foundations, earthquake resistance
structures, in thin pre-cast products like roofing elements, tiles, partition walls, I- and
L-shaped beams, repairing and retrofitting material are some of the examples.
The chicken mesh is made of steel wire which is susceptible to rusting due to moisture.
On the other hand, the geogrid mesh is made of polypropylene material which is a nonrusting
material. Therefore, the research reported in this paper will facilitate to produce laminated
composites to be used at both rusting environment such as partition wall as well as nonrusting
environment such as water tank and other structures that are in contact to water or moisture.
4. CONCLUSIONS
From the flexural behavior in the form of load-deflection relationships, and first crack
and ultimate loads, the following conclusions can be drawn.
1. The load-deflection curves of the laminated cement composite element in flexure can be
taken as linear relationships within the deflection of nearly 0.1 mm for both the geogrid and
chicken meshes.
2. The load-deflection relations are smooth nature for geogrid mesh composite while
fluctuating nature for chicken mesh composites,
3. The load carrying capacity of the cement composite elements at first crack and ultimate
loads is more for specimens with larger thickness irrespective of reinforcement.
4. The bearing capacity at first crack and ultimate loads of the cement composite elements in
flexure increases with the increase in percent effective reinforcement for both the geogrid and
chicken meshes irrespective of thickness.
Proceedings of the 4th International Conference on Engineering, Project, and Production Management (EPPM 2013)
111
ACKNOWLEDGMENT
The research reported in this paper is partly supported by the Research Grant No.
22580271 with funds from Grants-in-Aid for Scientific Research, Japan. The writer gratefully
acknowledges these supports. Any opinions, findings, and conclusions expressed in this paper
are those of the authors and do not necessarily reflect the views of the sponsor.
REFERENCES
ACI Committee 549, 1988: Guide for Design, Construction, and Repair of Ferrocement, ACI
Structural Journal, 85(1): 325-351.
Abdullah and Mansur, M.A., 2001: Effect of Mesh Orientation on Tensile Response of
Ferrocement, Journal of Ferrocement, 31(4), pp.289-298.
Austriaco, L.R., 2001: Evolution of Ferrocement, J. of Ferrocement, 31(4), pp.281-288.
El Debs M.K. and Naaman, A.E., 1995: Bending Behavior of Ferrocement Reinforced With
Steel Meshes and Polymeric Fibres, J. of Cement and Concrete Composites, 17(4), pp.
327-328.
Ghavami, K., Filho, R.D.T., and Barbosa, N.P., 1999: Behavior of Composite Soil Reinforced
with Natural Fibers, Cement and Concrete Composites, 21(1), pp.39-48.
Hossain, M.Z. and Hasegawa, T., 1997: A Study on Pre- and Post-Cracking Behavior of
Ferrocement Plates, Journal of Ferrocement, 27(2), pp.127-142.
Hossain, M.Z. and Hasegawa, T., 1998: A Comparison of the Mechanical Properties of
Ferrocement in Flexure for Square and Hexagonal Meshes, Journal of Ferrocement,
28(2), pp.111-134.
Hossain, M.Z. and Inoue, S., 2000: A Comparison of the Mechanical Properties of
Ferrocement Elements Under Compression for Square and Chicken Meshes, J. of
Ferrocement, 30(4), pp.319-343.
Hossain, M.Z. and Inoue, S., 2000: Compression Behavior and Buckling Analysis of
Ferrocement Using the Finite Element Method, J. of Ferrocement, 30(2), pp.147-166.
Johnston, C.D. and Mowat, D.N., 1974: Ferrocement - Material Behavior in Flexure, Journal
of Structural Division, ASCE, 100(10), 2053-2069
Mansur, M.A. and Kiritharan, T., 2001. Shear Strength of Ferrocement Structural Section, J.
of Ferrocement, 31(3), pp.195-211.
Naaman, A.E., 2000. Ferrocement and Laminated Cementitious Composites, Techno Press
3000, Ann Arbor, Michigan.
Naaman, A.E., 2001. Ferrocement and Thin Fiber Reinforced Cement Composites: Looking
Back, Looking Ahead. J. of Ferrocement, 31(4), pp.267-280.
Naaman, A.E. and Chandrangsu, K., 2000. Bending behavior of Laminated Cementitious
Composites Reinforced with FRP meshes. ACI Symposium on High Performance Fiber
Reinforced Thin Sheet Products, ACI SP 190, pp.97-116.
Proceedings of the 4th International Conference on Engineering, Project, and Production Management (EPPM 2013)
112