Evaluation of Feed Storage Runoff Water Quality and Recommendations on Collection System Design
41
Bunker Silage Storage Leachate and Runoff Management April 2, 2015 Waste to Worth, Seattle, WA Becky Larson, Assistant Professor and Extension Specialist, University of Wisconsin-Madison Aaron Wunderlin, Discovery Farms Eric Cooley, Discovery Farms Mike Holly, Ph.D. Student UW-Madison
-
Upload
lpe-learning-center -
Category
Education
-
view
43 -
download
1
Transcript of Evaluation of Feed Storage Runoff Water Quality and Recommendations on Collection System Design

Bunker Silage Storage Leachate and
Runoff Management
April 2, 2015
Waste to Worth, Seattle, WA
Becky Larson, Assistant Professor and Extension Specialist,
University of Wisconsin-Madison
Aaron Wunderlin, Discovery Farms
Eric Cooley, Discovery Farms
Mike Holly, Ph.D. Student UW-Madison

Bunker Silage Storage

Loading and Compaction

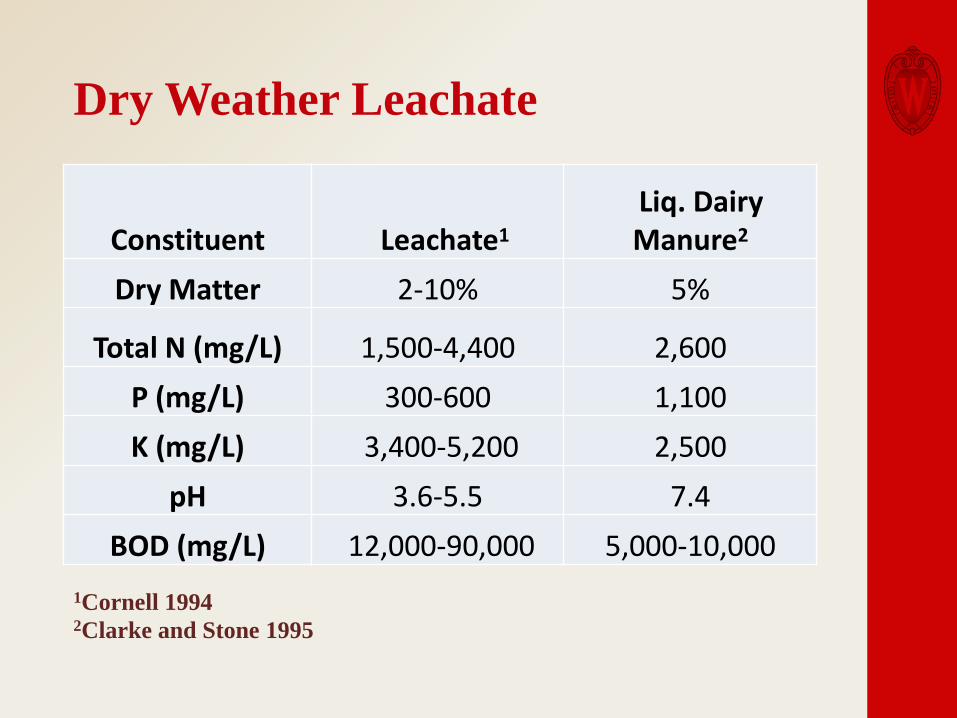
Dry Weather Leachate

Leachate Production Based on
Dry Matter Content
Bastiman (1976) and Bastiman and Altman (1985) (– - - –); Sutter (1957) (– - – -); Zimmer (1974) (– – –); Haigh (1999) (—)
(Haigh, 1999)
Recommended harvest moisture
65 - 70% Corn Silage
60 - 65% Hay Silage

Mc Donald 1981, Referencing Bastiman 1976
Timing Leachate Production
Dry Weather Leachate
Constituent Leachate1
Liq. Dairy Manure2
Dry Matter 2-10% 5%
Total N (mg/L) 1,500-4,400 2,600
P (mg/L) 300-600 1,100
K (mg/L) 3,400-5,200 2,500
pH 3.6-5.5 7.4
BOD (mg/L) 12,000-90,000 5,000-10,000
1Cornell 1994 2Clarke and Stone 1995

Dry Weather Leachate

Dry Weather Leachate

Corrosive - Concrete Erosion

Runoff

Snowmelt Runoff

Runoff Concentrations
Constituent Leachate1
Liq. Dairy Manure2 Runoff
Dry Matter 5% (2-10%) 5% 0 - 4.6%
Total N (mg/L) 1,500-4,400 2,600 20 - 1,356
P (mg/L) 300-600 1,100 8 - 659
K (mg/L) 3,400-5,200 2,500 n/a
pH 3.6-5.5 7.4 4 - 7
BOD (mg/L) 12,000-90,000 5,000-10,000 500 - 61,210

Impacts of Runoff

Impacts of Runoff

Rain Water Infiltration

Management to Minimize Silage Storage
Runoff Constituent Concentrations
• Cover
• Top
• Maintaining face (minimize exposure)
• Cover/wrap side walls
• Cover when filling if rain is forecast (minimize water additions)
• Clean pad (remove litter) particularly if rain event is forecast
• Cover spoilage and litter until removal (removal can include many options, land application, composting, digestion, among others)

Silage Storage Collection System Design
Objectives
• Minimize collection volumes• Reduce hauling requirements
• Reduce environmental impact• Collect high strength waste for storage and land
application
• Send low strength waste to treatment systems
Current System Design
• Capture the initial volume and send to storage as it has the highest concentrations
• This assumed a first flush scenario exists where the first portion of the runoff has higher strength than remaining runoff, unconfirmed
• First flush exists in urban runoff, though it would follow this pattern

Collection
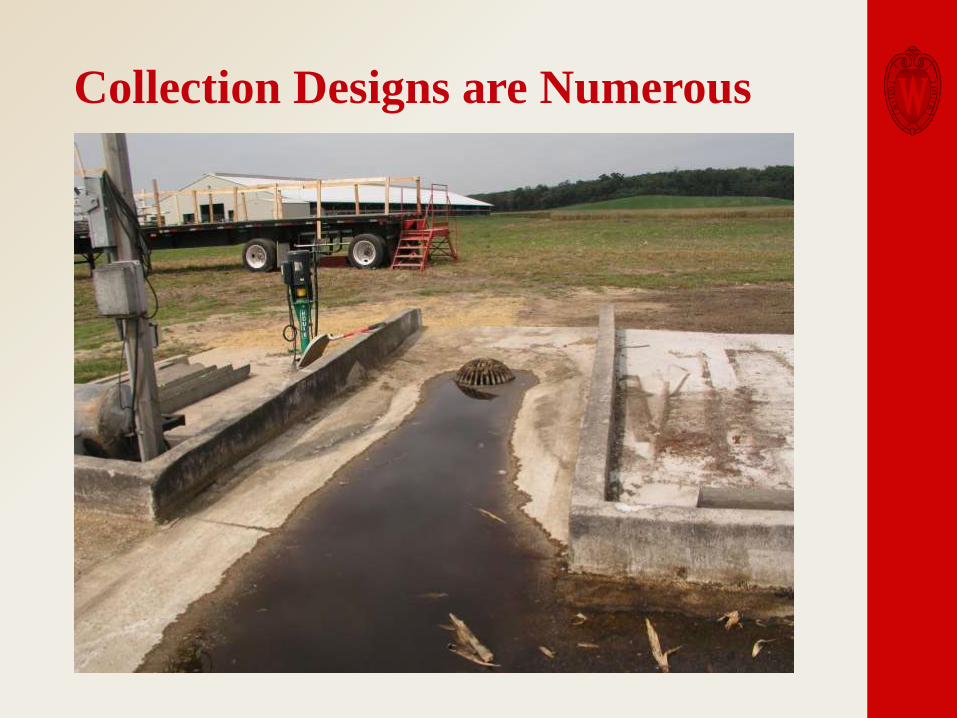
Collection Designs are Numerous

Collection Designs
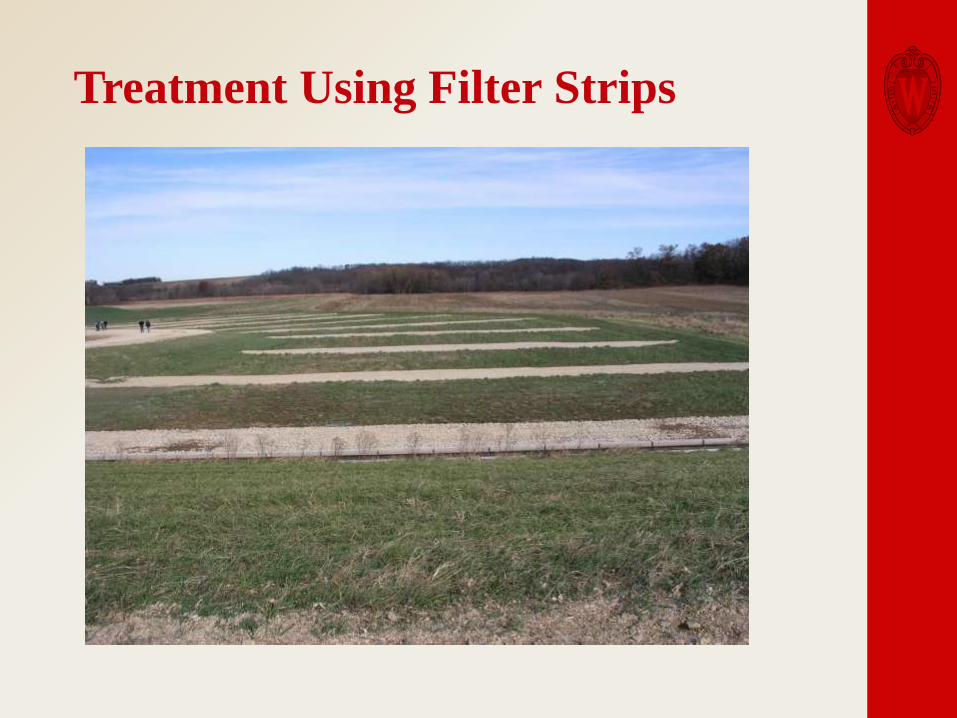
Treatment Using Filter Strips
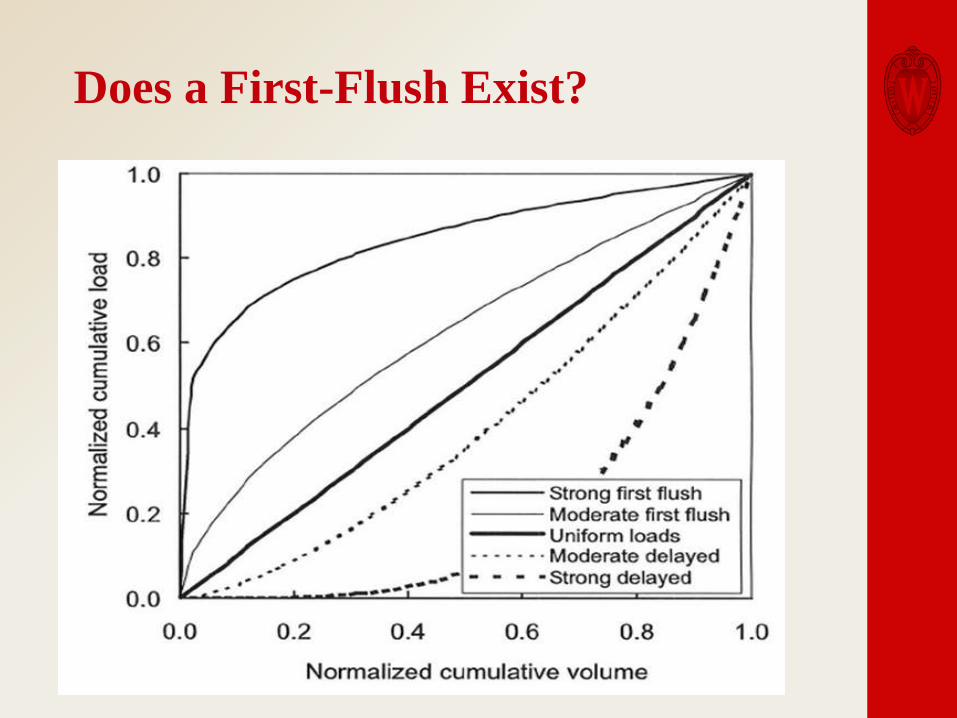
Does a First-Flush Exist?

Normalized COD Data - AARS

Normalized BOD5 Data

Normalized TKN Data – Farm A
0%
10%
20%
30%
40%
50%
60%
70%
80%
90%
100%
0% 10% 20% 30% 40% 50% 60% 70% 80% 90% 100%
% e
ven
t lo
ad
% event flow
Event Load:Flow Ratio (5%): TKN - Farm A

Normalized TKN Data – Farm C
0%
10%
20%
30%
40%
50%
60%
70%
80%
90%
100%
0% 10% 20% 30% 40% 50% 60% 70% 80% 90% 100%
% e
ven
t lo
ad
% event volume
Event Load:Flow Ratio (5%): Total Kjeldahl Nitrogen - Farm C
TKN - Farm C# % # % # % # % # %
Above 2 7% 6 21% 6 21% 3 10% --- ---
W/in 29 100% 22 76% 22 76% 25 86% 29 100%
Below --- --- 1 3% 1 3% 1 3% 0 0%
Above 8 28% 10 34% 9 31% 8 28% 2 7%
W/in 21 72% 17 59% 16 55% 18 62% 26 90%
Below 0 0% 2 7% 4 14% 3 10% 1 3%
Flow (%)
10 20 50 80 90
10%
5%

Normalized Phosphorus Data – Farm A
0%
10%
20%
30%
40%
50%
60%
70%
80%
90%
100%
0% 10% 20% 30% 40% 50% 60% 70% 80% 90% 100%
% e
ven
t lo
ad
% event flow
Event Load:Flow Ratio (5%): TP - Farm A
TP - Farm A# % # % # % # % # %
Above 0 0% 2 4% 0 0% 0 0% --- ---
W/in 51 100% 44 86% 33 65% 36 71% 39 76%
Below --- --- 5 10% 18 35% 15 29% 12 24%
Above 2 4% 3 6% 3 6% 0 0% 0 0%
W/in 46 90% 28 55% 23 45% 26 51% 31 61%
Below 3 6% 20 39% 25 49% 25 49% 20 39%
5%
10%
10 90805020
Flow (%)

Normalized Phosphorus Data – Farm C
0%
10%
20%
30%
40%
50%
60%
70%
80%
90%
100%
0% 10% 20% 30% 40% 50% 60% 70% 80% 90% 100%
% e
ven
t lo
ad
% event volume
Event Load:Flow Ratio (5%): Total Phosphorus - Farm C
TP - Farm C# % # % # % # % # %
Above 0 0% 0 0% 2 7% 0 0% --- ---
W/in 28 100% 28 100% 26 93% 28 100% 28 100%
Below --- --- 0 0% 0 0% 0 0% 0 0%
Above 2 4% 5 10% 8 16% 3 6% 0 0%
W/in 26 93% 21 75% 17 61% 23 82% 27 96%
Below 0 0% 2 4% 3 6% 2 4% 1 2%
10%
5%
Flow (%)
10 20 50 80 90

Relationship of Flow vs. Concentration

Constituent Correlations
• All constituent data (TKN, TP, TS, COD, BOD) was
statistically correlated EXCEPT pH which was
negatively correlated

Total TKN Loading
0
500
1,000
1,500
2,000
2,500
Load
(lb
s)
2013 Cummulative Total Kjeldahl Nitrogen Loading: Farm A
Collected To VTA
2007 lbs
1359 lbs

Total TKN Loading
0
500
1,000
1,500
2,000
2,500
3,000
3,500
Load
(lb
s)
2014 Cummulative Total Kjeldahl Nitrogen Loading: Farm A
Collected To VTA
2235 lbs
2901 lbs

Total TKN Loading
0
50
100
150
200
250
300
350
Load
(lb
s)
2013 Cummulative Total Kjeldahl Nitrogen Loading: Farm C
Collected To VTA
60 lbs
315 lbs

Total P Loading
0
60
120
180
240
300
360
420
480
540
Load
(lb
s)
2013 Cummulative Total Phosphorus Loading: Farm A
Collected To VTA
470 lbs
317 lbs

Total P Loading
0
100
200
300
400
500
600
700
800
900
Load
(lb
s)
2014 Cummulative Total Phosphorus Loading: Farm A
Collected To VTA
687 lbs
782 lbs

Total P Loading
0
10
20
30
40
50
60
70
80
Load
(lb
s)
2013 Cummulative Total Phosphorus Loading: Farm C
Collected To VTA
10 lbs
58 lbs

Collection Design Recommendation
• First flush does not exist so collecting initial runoff does not target collecting the greatest load per volume collected
• Recommended to collect low flows only (stop collecting during high flows)
• If the system design to shut off during high flows is not practical, collect low flows throughout the storm
• Additional collection of runoff within 2 weeks of filling will increase load collection
• Grade your pad to ensure all flows enter at one central collection point
• Check pad for cracks or other potential issues and repair
• Provide subsurface drainage to collect leachate which permeates through the pad

Low Flow Collection
• Calculations show a greater loading collected when collecting the low flow
• Low flow was calculated using 1% of the peak flowrate from a 2-year 24-hour design storm
• Peak runoff flowrates can be calculated using the Rational Method (although there are many methods which you can use to do this)
• These can be calculated by hand or using software such as HydroCAD

Conductivity Meter to Route High
Strength Runoff to Storage
0
5,000
10,000
15,000
20,000
25,000
30,000
35,000
40,000
0
100
200
300
400
500
600
700
800
0 4 8 12 16 20 24 28 32
Co
nce
ntr
atio
n (
mg/
l)
Flo
w (
gal/
min
) &
Co
nd
uct
ivit
y ((
us/
cm)/
10
)
Hours
Example Event with Conductivity: COD
Flow ConductivityMid-pt Discrete

Thank You!