Evaluation of factors affecting crystallization of ... · Evaluation of factors affecting...
12
1215 Agronomy Research 13(5), 1215–1226, 2015 Evaluation of factors affecting crystallization of disparate set of multi-flower honey samples A. Grégrová * , V. Kružík, E. Vrácovská, A. Rajchl and H. Čížková University of Chemistry and Technology, Prague, Faculty of Food and Biochemical Technology, Department of Food Preservation, Technická 5, 16628 Prague 6 – Dejvice, Czech Republic; * Correspondence: [email protected] Abstract. Honey crystallization is considered to be a natural process during its maturing and an indicator of natural honey composition. However, consumer evaluation of honey crystallization is usually negative. Crystallization depends on honey composition and it is influenced by methods and conditions of honey processing and storage (mechanical and thermal treatment). The aim of this work was to identify and evaluate general factors which can affect crystallization of blend multi-flower honeys (a disparate set of samples). The following qualitative parameters were determined: a content of 5-hydroxymethylfurfural, furfural, glucose and fructose, water and diastase activity, moisture and an absolute pollen count. A degree of honey sample crystallization was assessed by a sensory analysis. Effects of the various qualitative parameters on the crystallization degree were statistically evaluated. The honey crystallization degree was found to be a qualitative parameter positively correlated with the absolute pollen count. Using a multi- regression method (a cluster analysis) it was proven that the 5-hydroxymethylfurfural and moisture parameters were suitable characters with certain explanatory power to classify blend honey samples according to their crystallization degrees. Key words: honey crystallization, multi-flower honey, qualitative parameter. INTRODUCTION Honey crystallization is a natural occurrence in honey maturing and in some respects it can be taken as an indicator of natural honey composition (Venir et al., 2010). Unfortunately partial or entire crystallization of commercial honeys is often considered a defect (by consumers), because liquid and transparent honeys are wrongly regarded as better quality honeys. Besides causing obvious changes in sensory, mainly visual, properties, honey crystallization can have another unsatisfactory effects, such as technological and processing problems (e.g. pouring), a loss of honey homogeneity, higher water activity related to honey fermentation due to microorganisms’ development (Tosi et al., 2002). Tendency to crystallization of honeys depends mainly on the following factors: chemical composition, a degree of supersaturation, viscosity, a fructose/glucose (F/G) ratio, moisture (M) and a dextrine content, water activity (aw), micro-crystals and nucleation seeds (e.g. pollen grains) presence, age, storage temperature and thermal history (Bogdanov, 1993; Tosi et al., 2002; Tosi et al., 2004; Juszczak & Fortuna, 2006; Sudzina et al., 2009; Venir et al., 2010). Duration of an entire crystallization process
Transcript of Evaluation of factors affecting crystallization of ... · Evaluation of factors affecting...

1215
Agronomy Research 13(5), 1215–1226, 2015
Evaluation of factors affecting crystallization of disparate set of
multi-flower honey samples
A. Grégrová*, V. Kružík, E. Vrácovská, A. Rajchl and H. Čížková
University of Chemistry and Technology, Prague, Faculty of Food and Biochemical
Technology, Department of Food Preservation, Technická 5, 16628 Prague 6 – Dejvice,
Czech Republic; *Correspondence: [email protected]
Abstract. Honey crystallization is considered to be a natural process during its maturing and an
indicator of natural honey composition. However, consumer evaluation of honey crystallization
is usually negative. Crystallization depends on honey composition and it is influenced by methods
and conditions of honey processing and storage (mechanical and thermal treatment). The aim of
this work was to identify and evaluate general factors which can affect crystallization of blend
multi-flower honeys (a disparate set of samples). The following qualitative parameters were
determined: a content of 5-hydroxymethylfurfural, furfural, glucose and fructose, water and
diastase activity, moisture and an absolute pollen count. A degree of honey sample crystallization
was assessed by a sensory analysis. Effects of the various qualitative parameters on the
crystallization degree were statistically evaluated. The honey crystallization degree was found to
be a qualitative parameter positively correlated with the absolute pollen count. Using a multi-
regression method (a cluster analysis) it was proven that the 5-hydroxymethylfurfural and
moisture parameters were suitable characters with certain explanatory power to classify blend
honey samples according to their crystallization degrees.
Key words: honey crystallization, multi-flower honey, qualitative parameter.
INTRODUCTION
Honey crystallization is a natural occurrence in honey maturing and in some
respects it can be taken as an indicator of natural honey composition (Venir et al., 2010).
Unfortunately partial or entire crystallization of commercial honeys is often considered
a defect (by consumers), because liquid and transparent honeys are wrongly regarded as
better quality honeys. Besides causing obvious changes in sensory, mainly visual,
properties, honey crystallization can have another unsatisfactory effects, such as
technological and processing problems (e.g. pouring), a loss of honey homogeneity,
higher water activity related to honey fermentation due to microorganisms’ development
(Tosi et al., 2002).
Tendency to crystallization of honeys depends mainly on the following factors:
chemical composition, a degree of supersaturation, viscosity, a fructose/glucose (F/G)
ratio, moisture (M) and a dextrine content, water activity (aw), micro-crystals and
nucleation seeds (e.g. pollen grains) presence, age, storage temperature and thermal
history (Bogdanov, 1993; Tosi et al., 2002; Tosi et al., 2004; Juszczak & Fortuna, 2006;
Sudzina et al., 2009; Venir et al., 2010). Duration of an entire crystallization process

1216
varies considerably for different honey types. In most honeys, crystallization begins
within weeks or months at room temperature (Townsend, 1975; Assil et al., 1991).
Generally, blossom honeys crystallise faster due to a higher content of less soluble
glucose (a content of approx. 40–50 g 100 g–1 in dry matter Gleiter et al., 2006; Laos et
al., 2011) and pollen grains. On the contrary, crystallization proceeds more slowly in
honeydew honeys, which contain less glucose (a content of approx. 30–35 g 100 g–1 in
dry matter Gleiter et al., 2006) and more fructose, but could under some circumstances
have a significantly higher content of crystal-forming melezitose and trehalose (Dobre
et al., 2012).
Honey maturing may be impaired by exposure to high temperatures or by filtration
(removal of pollen grains). Crystallization occurs more easily when honeys are disturbed
(e.g. stirring, shaking and agitating) (Rybak-Chmielewska, 2004).
Crystallization can be controlled mainly by heating and proper temperature storage
conditions. If honey is held at 40–71°C during processing (bottling), a crystallization
degree is reduced. Crystals can be dissolved by mild heating of honey and quick heating
at 60–71°C tends to dissolve crystals and expel incorporated air (which can also
stimulate honey crystallization) (Townsend, 1975; Assil et al., 1991).
Diastase activity and a 5-HMF (5-hydroxymethylfurfural) content are used as
quality indicators of freshness or indicator of extensive heating of honey during its
processing with limits given by the EU Honey Directive (Subramanian et al., 2007).
Tosi et al. (2004) determined the effect of high-temperature short time heating of
honey on the following qualitative parameters related to honey quality and
crystallization process: a 5-HMF content, diastase activity and crystallization starting
time. Crystallization onset was proved to be delayed by 4 to 9 weeks for honeys treated
by high-temperature short-time treatment at 80°C for 60 s in the transient stage and 30 s
in the isothermal stage. 5-HMF and DN modifications recorded after the heat treatment
were for example: a) the 5-HMF content increased to 7.9 mg kg–1 and the DN decreased
to 14.4 in case of honey with a higher initial content of 5-HMF (7.5 mg kg–1) and
DN (14.6); b) both values stayed the same in case of honey with a lower initial content
of 5-HMF (5.0 mg kg–1) and DN (9.0) (Tosi et al., 2004).
Crystallization is also affected by presence and a number of crystallization centres,
mainly pollen grains. Therefore, qualitative and quantitative melissopalynological
analyses (Holdaway, 2004) of honeys mainly used to determine botanical and
geographical origin of honeys can be employed (Louveaux et al., 1978; Song et al.,
2012). Pollen grains but also plant and animal admixtures, e.g. spores and hyphae of
fungi, algae, yeasts, chitin fragments, hairs, insects etc., can be removed by filtration
(Přidal, 2003). Filtered honey has a significantly lower tendency to crystallise. Filtration
also removes small crystals of glucose and contaminants that trigger crystallization
process.
As was already mentioned, honey crystallization can be influenced by many factors
and changes can be predicted to a certain extent only in the case of monoflower honeys.
Since in the Czech Republic mainly blend honeys are processed, the aim of our study is
to verify whether it is possible to identify general factors affecting a disparate set of
multi-flower honey samples. The effects of various parameters on honey crystallization
have been statistically processed.

1217
MATERIALS AND METHODS
Honey samples
The total of 16 samples of different honeys were analysed including blend multi-
flower honeys (European (EU) and Czech honeys; 2012) (Table 1). Samples no. 1–10
were sampled at different degrees of crystallization; they came from different batches
with known thermal history (preheating at about 35°C and pasteurisation (75°C, 5 min)
was the same for all the samples and varied only with time delays in a tank at 40°C), and
were supplied directly by manufacturers. A set of samples no. 11–16 of different origin
and with unknown thermal history was purchased in the Czech market.
Table 1. Analysed samples
Sample
Number
Heating Period
in a Tank
Manufacturer/Vendor Origin
1 0 min Medokomerc, CZ EU
2 0 min Medokomerc, CZ EU
3 0 min Medokomerc, CZ EU
4 0 min Medokomerc, CZ EU
5 0 min Medokomerc, CZ EU
6 360 min Medokomerc, CZ EU
7 360 min Medokomerc, CZ EU
8 180 min Medokomerc, CZ EU
9 240 min Medokomerc, CZ EU
10 420 min Medokomerc, CZ EU
11 unknown JSG med, CZ EU
12 unknown Kaufland, CZ EU
13 unknown Local Czech Beekeeper CZ
14 unknown Medokomerc, CZ EU
15 unknown Product Bohemia, CZ CZ
16 unknown IS import-export, SK EU
Determination of qualitative parameters
The following physico-chemical, qualitative parameters were determined: a content
of 5-hydroxymethylfurfural, furfural, glucose and fructose, diastase activity, water
activity, moisture, presence and a number of crystallization centres (an absolute pollen
count).
With the exception of water activity (Chirife et al., 2006) all the other analytical
parameters were determined according to the harmonized methods for the analysis of
honey (Bogdanov, 2009).
A content of 5-HMF and furfural was determined in a filtered, aqueous honey
solution using HPLC equipped with UV detection (Thermostated Column Compartment
TCC-100: Dionex, Germany; HPLC Pump Dionex P680; HPLC Dionex Summit
ASI-100 Automated Sample Injector; UltiMate 3000, Photodiode Array Detector:
Dionex, Germany).

1218
A content of sugars (glucose and fructose) was analysed (after filtration of the
solution) by HPLC with RI detection (Thermostated Column Compartment TCC-100:
Dionex, Germany; HPLC Pump Dionex P680; HPLC Dionex Summit ASI-100
Automated Sample Injector; UltiMate 3000, RI Detector: Shodex RI – 101, Japan).
Diastase activity expressed as a diastase number (DN) was analysed using
Phadebas tablets by a photometric method (Phadebas Amylase Test: Magle AB,
Sweden) using Spectrofotometer Genesys 20 (Thermo Spectronic, USA) and water
activity was determined using an electronic dew-point water activity meter, Aqua Lab
Series 3 (Decagon Devices, USA).
Moisture was analysed by automatic digital refractometry, Refractometer RFM 340
(Bellingham + Stanley, United Kingdom). The water content was determined from the
refractic index of the honey.
A quantitative melissopalynological analysis was performed using the modified
procedure described in Přidal (2003). Pollen grains were determined microscopically
and expressed as an absolute pollen count (APC, i.e. a number of pollen grains per 10 g
of honey). Honey (10 g) were dissolved and diluted in distilled water; solution was
centrifuged in a cuvette at 3 000 rpm (3 times for 5 min). The sediment was filtered
through a microbiological filter and after drying it was illuminated by cedar oil. Pollen
grains were counted in 60 view fields (at 1,000x magnification). A Digital Laboratory
Microscope was used, Model DMBA-310 (Motic Deutschland GmbH, Germany).
Sensory evaluation
Samples were also sensorially assessed. Sensory evaluation was performed by 10
panellists from the Department of Food Preservation (University of Chemistry and
Technology, Prague) according to Piana et al. (2004). To evaluate crystallization, a
10-point scale was used (1 = liquid; 10 = entirely crystallised).
Statistical analysis
The results were presented as mean values of three repetitions for each analysed
qualitative parameter. A degree of linear relationship between the parameters was
studied using the Pearson correlation matrix. A cluster analysis was performed to group
the samples according to the studied variables. All statistical analyses were carried out
using STATISTICA 10.0 (StatSoft, USA) software.
RESULTS AND DISCUSSION
The set of honey samples at different levels of crystallization (all samples were
analysed approx. 18 month after production) and with different thermal history were
analysed. The results for all determined qualitative parameters are given in Table 2.

1219
Table 2. Comparison of the measured data
Sample
number
Moisture
(M; %)
Water
Activity
(aw)
5-HMF
(mg kg-1)
Furfural
(mg kg-1)
Glucose
(g 100 g-1)
Fructose
(g 100 g-1)
Diastase
Activity
(DN)
F/G G/M Absolute
Pollen Count
(APC × 104)
Crystallization
Degree
1 17.51 0.596 25.06 0.00 28.80 38.30 11.64 1.33 1.64 11.56 9
2 17.44 0.594 31.70 2.72 33.20 41.60 10.79 1.25 1.90 10.50 9
3 17.52 0.605 29.90 2.65 29.60 40.40 10.93 1.36 1.69 10.18 9
4 17.75 0.571 20.10 2.66 32.40 45.40 10.80 1.40 1.83 8.43 2
5 17.71 0.574 45.40 2.40 31.10 43.80 10.55 1.41 1.75 6.96 1
6 17.10 0.576 26.96 2.71 28.60 38.70 12.20 1.35 1.67 10.10 3
7 17.88 0.577 36.18 2.54 31.00 39.70 10.56 1.28 1.78 8.10 2
8 17.82 0.579 22.70 2.87 31.50 39.30 9.75 1.25 1.77 9.67 5
9 17.64 0.576 34.48 2.70 29.30 42.20 11.66 1.44 1.66 9.90 5
10 17.81 0.574 43.70 2.48 30.00 42.60 10.57 1.42 1.68 7.43 2
11 16.55 0.597 46.96 4.00 29.56 38.58 10.57 1.31 1.79 10.57 8
12 17.90 0.639 45.00 2.60 22.20 40.03 9.50 1.43 1.15 7.40 2
13 17.18 0.577 19.90 0.00 23.59 24.09 10.80 1.02 1.69 5.97 3
14 17.62 0.639 32.93 3.18 31.51 39.03 12.20 1.24 1.79 10.97 10
15 16.14 0.594 32.60 3.39 24.38 36.96 9.70 1.52 1.51 9.13 5
16 17.69 0.617 36.35 2.75 28.66 42.25 10.50 1.47 1.62 10.39 s5
DN = diastase activity expressed as diastase number; APC = number of pollen grains per 10 g of honey; crystallization degree: 10 point sensory scale
from 1 = liquid to 10 = entirely crystallised; all samples were analysed approx. 18 month after production.
1220
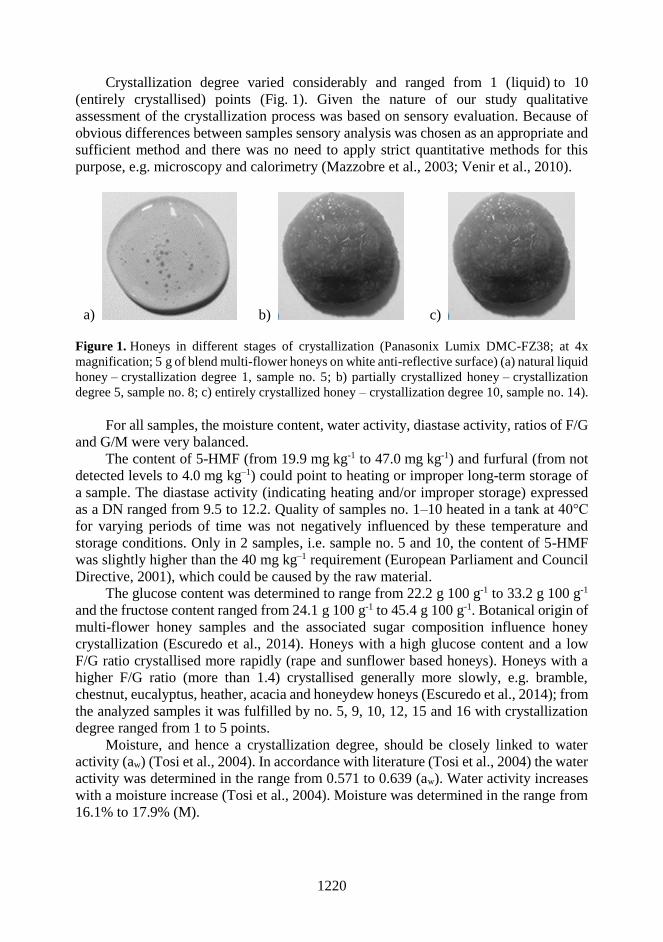
Crystallization degree varied considerably and ranged from 1 (liquid) to 10
(entirely crystallised) points (Fig. 1). Given the nature of our study qualitative
assessment of the crystallization process was based on sensory evaluation. Because of
obvious differences between samples sensory analysis was chosen as an appropriate and
sufficient method and there was no need to apply strict quantitative methods for this
purpose, e.g. microscopy and calorimetry (Mazzobre et al., 2003; Venir et al., 2010).
a) b) c)
Figure 1. Honeys in different stages of crystallization (Panasonix Lumix DMC-FZ38; at 4x
magnification; 5 g of blend multi-flower honeys on white anti-reflective surface) (a) natural liquid
honey – crystallization degree 1, sample no. 5; b) partially crystallized honey – crystallization
degree 5, sample no. 8; c) entirely crystallized honey – crystallization degree 10, sample no. 14).
For all samples, the moisture content, water activity, diastase activity, ratios of F/G
and G/M were very balanced.
The content of 5-HMF (from 19.9 mg kg-1 to 47.0 mg kg-1) and furfural (from not
detected levels to 4.0 mg kg–1) could point to heating or improper long-term storage of
a sample. The diastase activity (indicating heating and/or improper storage) expressed
as a DN ranged from 9.5 to 12.2. Quality of samples no. 1–10 heated in a tank at 40°C
for varying periods of time was not negatively influenced by these temperature and
storage conditions. Only in 2 samples, i.e. sample no. 5 and 10, the content of 5-HMF
was slightly higher than the 40 mg kg–1 requirement (European Parliament and Council
Directive, 2001), which could be caused by the raw material.
The glucose content was determined to range from 22.2 g 100 g-1 to 33.2 g 100 g-1
and the fructose content ranged from 24.1 g 100 g-1 to 45.4 g 100 g-1. Botanical origin of
multi-flower honey samples and the associated sugar composition influence honey
crystallization (Escuredo et al., 2014). Honeys with a high glucose content and a low
F/G ratio crystallised more rapidly (rape and sunflower based honeys). Honeys with a
higher F/G ratio (more than 1.4) crystallised generally more slowly, e.g. bramble,
chestnut, eucalyptus, heather, acacia and honeydew honeys (Escuredo et al., 2014); from
the analyzed samples it was fulfilled by no. 5, 9, 10, 12, 15 and 16 with crystallization
degree ranged from 1 to 5 points.
Moisture, and hence a crystallization degree, should be closely linked to water
activity (aw) (Tosi et al., 2004). In accordance with literature (Tosi et al., 2004) the water
activity was determined in the range from 0.571 to 0.639 (aw). Water activity increases
with a moisture increase (Tosi et al., 2004). Moisture was determined in the range from
16.1% to 17.9% (M).

1221
Most of the samples met the legislative requirements (European Parliament and
Council Directive, 2001) for followed physico-chemical parameters except for samples
no. 5 (5-HMF: 45.4 mg kg-1;, limit max. 40 ), 10 (5-HMF: 43.7 mg kg-1), 11 (5-HMF:
47.0 mg kg-1), 12 (5-HMF: 45.0 mg kg-1) and 13 (G+F: 47.7 weight %;, limit min. 60).In
accordance with the literature (Oddo & Piro, 2004; Song et al., 2012), the results of the
quantitative melissopalynological analysis, i.e. the absolute pollen count (the number of
pollen grains per 10 g of honey sample), varied significantly from 6.0·104 to 11.6·104.
In the study by Song et al. (2012) 4 out of the 19 analysed samples (Chinese monoflower
honeys) contained from 2.0·104 to 10.0·104 of pollen grains and 2 samples contained
> 10.0·104 of pollen grains (an absolute pollen count). Pollen grains from, for example,
rape, black locust, sunflower and dandelion were identified in the samples; these plants
are typical for Central and Eastern European countries (Oddo & Piro, 2004) (Fig. 2).
Oddo & Piro (2004) determined mean absolute pollen counts for rape (7.6·104), black
locust (0.9·104), sunflower (1.9·104) and dandelion (3.4·104) honeys.
a) b)
c) d)
Figure 2. Examples of the found pollen grains (microscopy; at 1,000x magnification) (a) rape;
b) black locust; c) sunflower; d) dandelion).
The effects of various parameters on honey crystallization were statistically
evaluated. A correlation matrix and a cluster analysis were applied to evaluate
relationships between the qualitative parameters and the properties of honey samples
(Table 3; Figs 3, 4).

1222
Table 3. Correlation matrix
Moisture aw 5-HMF Furfural Glucose Fructose DN Fructose/
Glucose
Glucose/
Moisture
APC Crystallization
Moisture 1.00
aw 0.04 1.00
5-HMF 0.00 0.28 1.00
Furfural – 0.21 0.20 0.48 1.00
Glucose 0.35 – 0.29 – 0.08 0.28 1.00
Fructose 0.40 0.01 0.37 0.54 0.59 1.00
DN 0.05 – 0.04 – 0.27 – 0.20 0.35 – 0.01 1.00
Fructose/Glucose – 0.05 0.10 0.45 0.47 – 0.05 0.71 – 0.22 1.00
Glucose/Moisture 0.02 – 0.48 – 0.30 0.07 0.83 0.11 0.40 – 0.41 1.00
APC –0.18 0.33 – 0.13 0.26 0.39 0.28 0.45 0.15 0.25 1.00
Crystallization – 0.25 0.47 – 0.14 0.07 0.25 – 0.05 0.37 – 0.20 0.28 0.82* 1.00
DN = diastase activity expressed as diastase number; APC = number of pollen grains per 10 g of honey; * the critical limit for correlation coefficient
r in the case of the 16 samples (confidence level α = 0.05) = 0.497.

1223
The results of the crystallization degree evaluation were correlated with the other
determined qualitative parameters (Table 3). In accordance with the literature (Escuredo
et al., 2014), a statistically significant correlation (α = 0.05) was demonstrated only in
the case of the absolute pollen count (r = 0.82; critical value for correlation coefficient:
0.497) for the total disparate set of honey samples (no. 1–16). On the contrary, in the
case of the samples with known thermal history and from the same producer (no. 1–10),
a statistically significant correlation (α = 0.05) was also demonstrated between the
crystallization degree and the water activity (r = 0.92; critical value for correlation
coefficient: 0.632). In accordance with the literature (Gleiter et al., 2006; Zamora and
Chirife, 2006), it was proven that aw of crystallised honeys was higher than aw of liquid
(re-dissolved) honeys, because aw increase during crystallization process is mainly
related to glucose crystallization.
Figure 3. Dendrogram of 8 qualitative parameters for honey samples characterisation.
Since the direct linear correlation (the correlation matrix) was not very
demonstrative due to the complexity of the honey crystallization process, a multivariate
statistical technique (a cluster analysis) was applied to reveal deeper structures in the
data set. This method assesses similarity of the objects based on a combination of all
measured characters.

1224
The cluster analysis was applied to prove the ability to distinguish between honeys
of a different crystallization degree. For statistical evaluation, a data matrix of the 16
honey samples including the following qualitative parameters was used: moisture, water
activity, ratios of G/F and G/M, a content of 5-HMF and furfural, diastase activity and
an absolute pollen count (Tosi et al., 2004; Escuredo et al., 2014).
Fig. 3 shows a dendrogram of the characters (for the 8 qualitative parameters),
which expresses their reciprocal similarity. Six similar characters (a sub-cluster for the
F/G and G/M, furfural and water activity characters and a sub-cluster for the diastase
activity and the absolute pollen count) create a large combined cluster (reading from the
right to the left), to which a less similar moisture character is connected. The 5-HMF
character is completely dissimilar to the others and it has been indicated as an outlying
character.
Figure 4. Dendrogram of the 16 honey samples classification (samples indication: maximal,
mean and minimal crystallization degree).
A dendrogram of the objects (Fig. 4) allowed classifying the 16 honeys into several
expectable clusters. Fig. 4 also shows the samples that were significantly different from
the others. It is obvious (reading from the right to the left) that the samples are divided
into 3 dominant clusters. The first cluster contains samples no. 1, 14, 2, 3, 9, 16, 7, 15
and 6. The second one contains honeys no. 13, 4 and 8; and the third one includes honeys
no. 11, 10, 12 and 5. The first cluster contains maximally and mean crystallised honeys.
This group of honeys is characterised by high water and diastase activity and a low
1225
content of 5-HMF. This largest cluster includes both maximally and some mean
crystallised honeys due to the similarity of the parameters analysed for these groups of
samples. The second cluster of mean crystallised honeys is characterised by the lowest
content of 5-HMF in its category. The third cluster is made up of minimally crystallised
honeys that have the highest values for moisture and 5-HMF content; the values of
absolute pollen count and diastase activity are the lowest. Because of high content of
5-HMF as a result of strong heating it should be emphasized that strongly heated honey
crystallizes differently than fresh ones. Two atypical samples, i.e. no. 7 and 11, differ
from the other samples in the group due to the following parameters (Fig. 4): F/G and
absolute pollen count for sample no. 7; moisture and diastase activity for sample no. 11.
Moisture and 5-HMF parameters could be considered as the characters with certain
explanatory power to classify samples due to their different crystallization degree.
CONCLUSIONS
Due to complexity of honey crystallization, this process is influenced by a number
of factors and conditions of processing and storage of honey. Contrary to the literature,
only the absolute pollen count was demonstrated as a qualitative parameter positively
correlated with the honey crystallization degree. Using a cluster analysis we found 2
more qualitative parameters, i.e. 5-HMF and moisture content, which influence
crystallization degree of blend multi-flower honeys. It was found that most of the
analysed multi-flower honey samples with the values of 5-HMF content around or higher
than 40.0 mg kg–1, moisture content > 17.7% and absolute pollen count < 9.0·104 stayed
in a liquid state for approx. 18 months after production.
ACKNOWLEDGEMENTS: This project was supported by the Ministry of Education and Sports,
project no. A1_FPBT_2015_002. The authors express their thanks to Dr. Havlík, MSc and to the
company Medokomerc (Čestín, Czech Republic) for the provided samples, and to Dr. Horsáková,
MSc for creating the pollen grains photos.
REFERENCES
Assil, H.I., Sterling, R. & Sporns, P. 1991. Crystal control in processed liquid honey. J. Food Sci.
56, 1034–1037.
Bogdanov, S. 1993. Liquefaction of honey. Apiacta. 28, 4–10.
Bogdanov, S. 2009. Harmonised methods of the International Honey Commission. International
Honey Commission. 1–63.
Dobre, I., Georgescu, L.A., Alexe, P., Escuredo, O. & Seijo, M.C. 2012. Rheological behavior of
different honey types from Romania. Food Res. Int. 49, 126–132.
Escuredo, O., Dobre, I., Fernandez-González, M. & Seijo, M.C. 2014. Contribution of botanical
origin and sugar composition of honeys on the crystallization phenomenon. Food Chem.
149, 84–90.
European Parliament and Council, 2001: Directive 2001/110/EC of 20 December 2001 Relating
to Honey. Official Journal of the European Communities, L 10, 12. 01. 2002, pp. 6.
Gleiter, R.A., Horn, H. & Isengard, H.D. 2006. Influence of type and state of crystallisation on
the water activity of honey. Food Chem. 96, 441–445.
Holdaway, C.A. 2004. Automation of pollen analysis using a computer microscope. Master
Thesis. Massey University, Turitea. 124 pp.

1226
Chirife, J., Zamora, M.C. & Mott, A. 2006. The correlation between water activity and %
moisture in honey: Fundamental aspects and application to Argentine honeys. J. Food Eng.
72, 287–292.
Juszczak, L. & Fortuna, T. 2006. Rheology of selected Polish honeys. J. Food Eng. 75, 43–49.
Laos, K., Kirs, E., Pall, R. & Martverk, K. 2011. The Crystallization Behaviour of Estonian
Honeys. Agron. Res. 9, 427–432.
Louveaux, J., Maurizio, A. & Vorwohl, G. 1978. Methods of Melissopalynology. Bee World 59,
139–157.
Mazzobre, M.F., Aguilera, J.M. & Buera, M.P. 2003. Microscopy and calorimetry as
complementary techniques to analyze sugar crystallization from amorphous systems.
Carbohyd. Res. 338, 541–548.
Oddo, L.P. & Piro, R. 2004. Main European unifloral honeys: descriptive sheets. Apidologie 35,
38–81.
Piana, M., Oddo, L., Bentabol, A., Bruneau, E., Bogdanov, S. & Declerck, Ch. 2004. Sensory
analysis applied to honey: state of the art. Apidologie. 35, 26–37.
Přidal, A. 2003. Včelí produkty - cvičení. Mendelova zemědělská a lesnická univerzita, Brno,
61 pp.
Rybak-Chmielewska, H. 2004. Honey. In Tomasik, P. (ed): Chemical and functional properties
of food saccharides. CRC Press LLC, Boca Raton, pp. 72–78.
Song, X.Y., Yao, Y.F. & Yang, W.D. 2012. Pollen Analysis of Natural Honeys from the Central
Region of Shanxi, North China. PLOS ONE 7, 1–11.
Subramanian, R., Hebbar, H.U & Rastogi, N.K. 2007. Processing of honey: A review. Int. J.
Food Prop. 10, 127–143.
Sudzina, M., Melich, M. & Kňazovická, V. 2009. Physicochemical characterization of natural
honeys from different regions in Slovakia. Acta U. Agr. Silvi. Mend. Brun. 57, 125–134.
Tosi, E., Caippini, M. & Lucero, E.R.H. 2002. Honey thermal treatment effects on
hydroxymethylfurfural content. Food Chem. 77, 71–74.
Tosi, E., Lucero, E.R.H. & Bulacio, L. 2004. Effect of honey high-temperature short-time heating
on parameters related to quality, crystallisation phenomena and fungal inhibition.
LWT-Food Sci. Technol. 37, 669–678.
Townsend, G.F. 1975. Processing and storing liquid honey. In Crane, E. (ed): Honey, a
comprehensive survey. Heinemann, London, pp. 269–292.
Venir, E., Spaziani, M. & Maltini, E. 2010. Crystallization in ‘Tarassaco’ Italian honey studied
by DSC. Food Chem. 122, 410–415.
Zamora, M.C. & Chirife, J. 2006. Determination of water activity change due to crystallization
in honeys from Argentina. Food Control 17, 59–64.