
Evaluation of Drainfield Absorption and Evapotranspiration ... · septic tank effluent from an...
73
Evaluation of Drainfield Absorption and Evapotranspiration Capacity By Ken Rainwater, Ph.D., P.E., DEE and Andrew Jackson, Ph.D., P.E. Texas Tech University Water Resources Center Box 41022 Lubbock, TX 79409-1022 Submitted to Texas On-Site Wastewater Treatment Research Council Texas Commission on Environmental Quality OSSF Program MC-178 P.O. Box 13087 Austin, TX 78711-3087 January 2004
Transcript of Evaluation of Drainfield Absorption and Evapotranspiration ... · septic tank effluent from an...

Evaluation of Drainfield Absorption and Evapotranspiration Capacity
By
Ken Rainwater, Ph.D., P.E., DEE and Andrew Jackson, Ph.D., P.E. Texas Tech University Water Resources Center
Box 41022 Lubbock, TX 79409-1022
Submitted to
Texas On-Site Wastewater Treatment Research Council Texas Commission on Environmental Quality
OSSF Program MC-178 P.O. Box 13087
Austin, TX 78711-3087
January 2004

i
Table of Contents
List of Tables .................................................................................................................................. ii List of Figures ............................................................................................................................... iii 1. Introduction.................................................................................................................................1 1.1 Problem Statement ........................................................................................................1 1.2 Objectives .....................................................................................................................3 2. Phase II Field Demonstration......................................................................................................5 2.1 Operation of Field Site..................................................................................................5 2.1.1 Wastewater Loading ......................................................................................5 2.1.2 Weather Data Collection................................................................................6 2.1.3 Water Quality Data Collection.......................................................................6 2.2 Results...........................................................................................................................6 2.2.1 Weather Observations....................................................................................7 2.2.2 Loading Results .............................................................................................8 2.2.3 Water Quality Data ......................................................................................12 2.2.4 Post-Treatment Investigation .......................................................................12 2.2.4.1 Extent of Vegetation .......................................................................14 2.2.4.2 Geoprobe Sampling ........................................................................16 2.2.4.3 Excavation of Trenches...................................................................25 3. Soil and Hydrologic Study........................................................................................................29 3.1 Problem Statement and Tasks......................................................................................29 3.2 Selected Counties.........................................................................................................30 3.3 Data Collection ............................................................................................................30 3.3.1 Soil Characteristics .......................................................................................30 3.3.2 Hydrologic Data............................................................................................31 3.4 Comparison of County Soil Types and ET and AB Conditions ..................................39 3.5 Comparison of Selected Counties with TTUWRC Test Site Conditions ....................50 4. Conclusions and Recommendations for ETA Trench LTARs .................................................54 5. References ................................................................................................................................56 Appendix A. Daily Flow Data ......................................................................................................59

ii
List of Tables 1.1 Long-Term Application Rates (TCEQ 2001) ...........................................................................2 1.2 Summary of Phase I Wastewater Trench Performance ............................................................3 2.1 Target Wastewater Quality (as in Phase I) ................................................................................5 2.2 Artificial Wastewater Mixture ..................................................................................................6 2.3 Monthly ET and Rainfall Totals for Phase II............................................................................8 2.4 Average Monthly Loading Rates (gpd/ft2) with 95% Confidence Intervals.............................9 2.5 Average Monthly Flow Rates (gpd) with 95% Confidence Intervals.......................................9 2.6 Phase I and II Comparison of ETAW Trenches .....................................................................11 2.7 Average and 95% Confidence Interval Values for COD, TN, and TSS.................................14 2.8 Estimated ET Radius Beyond ETA Trench ............................................................................15 2.9 Calculated Saturation Levels for Possible Porosities..............................................................22 2.10 Infiltrometer Results after 24 hr of Saturation......................................................................28 3.1 Soil Characteristics (NRCS soil surveys) ...............................................................................33 3.2 Annual Rainfall (Figure 3.3) and ET Estimates (Figure 3.4, TCEQ [2001]) .........................39 3.3 Comparison of AB and ET Area Requirements for Q=300 gpd.............................................41 3.4 Parameters for Ks Estimation (Rawls et al., 1982) .................................................................49 3.5 Class A County/Soil Combinations ........................................................................................51 3.6 Class B County/Soil Combinations ........................................................................................51 3.7 Class C County/Soil Combinations ........................................................................................52

iii
List of Figures 1.1 Site Layout for Phase I (W for wastewater application, others clean water)............................3 2.1 Daily Precipitation for Phase II.................................................................................................7 2.2 Daily Evapotranspiration for Phase II.......................................................................................7 2.3 Average Values and 95% Confidence Intervals for Loading in April-July 2002...................10 2.4 Average Values and 95% Confidence Intervals for Loading in August 2002-July 2002.......10 2.5 Observed COD Concentrations...............................................................................................13 2.6 Observed TN Concentrations..................................................................................................13 2.7 Observed TSS Concentrations ................................................................................................14 2.8 Phase I Estimated ET Area for Wastewater ETA Trenches (Rainwater et al. 2001) .............15 2.9 Geoprobe Positions Relative to Trench Centerline.................................................................16 2.10 Geoprobe Rig (ESA Enviromental, Inc)...............................................................................17 2.11 Geoprobe Sample 9-1, with Interface at Trench Bottom......................................................17 2.12 Water Contents Near Trench 4 as Compared to Controls.....................................................19 2.13 Water Contents Near Trench 7 as Compared to Controls.....................................................19 2.14 Water Contents Near Trench 9 as Compared to Controls.....................................................20 2.15 Water Contents Near Trench 14 as Compared to Controls...................................................20 2.16 Water Contents Near Trench 16 as Compared to Controls...................................................21 2.17 Volatile Solids Contents Near Trench 4 as Compared to Controls ......................................23 2.18 Volatile Solids Contents Near Trench 7 as Compared to Controls ......................................23 2.19 Volatile Solids Contents Near Trench 9 as Compared to Controls ......................................24 2.20 Volatile Solids Contents Near Trench 14 as Compared to Controls ....................................24 2.21 Volatile Solids Contents Near Trench 16 as Compared to Controls ....................................25 2.22 View of Biomat at Bottom of Trench 9 ................................................................................26 2.23 Closer View of Biological Growth at Bottom of Trench 9...................................................26 2.24 View of Double-Ring Infiltrometer in Trench 14.................................................................27 3.1 Selected Counties....................................................................................................................31 3.2 USDA Soil Textural Classification with TCEQ Soil Classes.................................................32 3.3 Contour Map of Average Annual Precipitation (source: NRCS 2002) ..................................37 3.4 Contour Map of Potential Evapotranspiration ........................................................................38

1
1. Introduction
1.1 Problem Statement
Septic tanks and associated drainfields are used throughout the United States as on-site
wastewater treatment and disposal systems for individual residences or small communities. In
many locations, drainfields are strictly dependent on soil absorption of the effluent from the
septic tanks. In Texas, on-site wastewater treatment facilities are under the regulatory authority
of the Texas Commission on Environmental Quality (TCEQ). Under TCEQ (2001) guidance,
drainfield design is based on either absorption (AB) only or evapotranspiration (ET) only. AB
drainfields, which dispose of water through gravity flow and capillary action, are preferred in
areas with permeable soils and relatively deep water tables, while ET drainfields, which lose
water only upward to the atmosphere, are required with impermeable soils or shallow water
tables. In actuality, AB fields also lose water upward due to ET, but this process is ignored in
the TCEQ (2001) guidance. The annual precipitation in Texas varies from approximately 9 in/yr
in the west to over 56 in/yr in the east. In the more arid portions of western Texas, permeable
soils allow AB drainfields; however, hydrologically speaking, neglecting the additional water
lost to ET may result in significantly over-designed drainfield installations. Potential
evaporation in the more arid regions in Texas can be three to four times greater than annual
precipitation. Septic system regulators and installers in the western half of Texas have suggested
that current TCEQ (2001) design standards for AB and ET systems result in oversized systems.
Table 1.1 shows the TCEQ (2001) values for long-term acceptance rates (LTARs) for various
soil classes. Local ET rates are based on historical annual average rates at various locations
across the state.
To address these concerns, the Texas On-Site Wastewater Treatment Research Council
(TOSWTRC) sponsored research by the Texas Tech University Water Resources Center
(TTUWRC) to demonstrate the combined contributions of ET and AB (ETA) septic system
drainfields. The primary purpose of the research was to determine whether the size of ETA
systems can be reduced due to the combined effect of ET and AB in arid and semi-arid regions
of Texas. Phase I of this work, field demonstration of hydraulic capacity of simple drainfield
trenches, was performed in 1999 to 2001 at a site at Reese Center, west of Lubbock (Rainwater
et al. 2001). The specific objectives of Phase I were to (1) quantify observed loading rates
between drainfield types and compare with current TCEQ standards, (2) evaluate weather

2
Table 1.1 Long-Term Application Rates (TCEQ 2001)
Soil Class LTAR
(gpd/ft2)Ia (gravelly sand) >0.50
Ib (sand) 0.38 II (sandy loam) 0.25
III (silt or clay loam) 0.20 IV (clayey soils) 0.10
effects on ET fields, (3) report observed water quality associated with each drainfield type, and
(4) recommend a new loading rate for combined ETA systems. The field site constructed for the
Phase I study included trenches built for absorption only (AB, unlined trench bottom and walls,
but covered to prevent upward losses), evapotranspiration only (ET, lined trench bottom and
walls), and combined evapotranspiration and absorption (ETA, unlined trench bottom and walls,
and no surface cover) trenches. Figure 1.1 shows the site layout schematic. The TOSWTRC
required that no proprietary drainfield devices were used in the field tests, so simple gravel and
local soil backfill were used in the trenches. Each trench was 20 ft long, 3 ft wide, and 2 ft deep.
The water levels in the trenches were maintained at 16 inches above the trench bottoms, which
corresponded to the top of the gravel fill. An artificial wastewater mixture was passed through a
septic tank system for a detention time of at least 3 days prior to application to the trenches. The
soils at the site were classified as types II or III, which corresponded to LTAR values of 0.25 and
0.20 gpd/ft2, respectively.
Table 1.2 summarizes the average loading rates over the final twelve months of the Phase
I tests based on three replicates for each trench type. It is apparent that the average loading
values for both the AB (2 to 3 times) and ETA (4 to 5 times) trenches significantly exceeded the
TCEQ (2001) values for type II and III soils. Based on these findings, it was possible to
recommend that the TCEQ guidance allow ETA trench systems in type II or III soils in the
Lubbock area to have LTAR values at least twice the current TCEQ (2001) AB trench guidance
for those soil types, while maintaining a reasonable factor of safety, if the trenches are spaced at
least 15 ft apart. The main concern about using the field data to change the current guidance was
that the duration of the field experiments was not long enough to represent the typical lives of
septic system drainfields. To answer this concern, a second phase of experiments was proposed.

3
Figure 1.1 Site Layout for Phase I (W for wastewater application, others clean water)
Table 1.2 Summary of Phase I Wastewater Trench Performance
Drainfield
Type
Average Loading (gpd/ft2)
95% Confidence
Interval ETW 0.11 0.01 ABW 0.64 0.24
ETAW 1.07 0.17
1.2 Objectives
The Phase II project began in January 2002 with two primary objectives. The first
objective was to perform a second set of loading tests on ETA drainfield trenches receiving
septic tank effluent from an artificial wastewater. The existing field site included six ETA
trenches, three that had received wastewater (4, 9, and 16 in Figure 1.1) and three that had briefly
received clean water (7, 14, and 15). The test duration was to be long enough to achieve the
more stable loading conditions seen in the final twelve months of the Phase I project. Water
quality parameters were monitored on a biweekly basis. The second objective was to develop of
18
4
21
Ground Slope
Weather Station Storage/Control Building
Tanks
North
ETW Units
ET Units
AB Units ETA Units
ABW Units
ETAW Units
5
678
9
67
3
10 11
12 13
14 15
16 17

4
loading rate recommendations for ETA drainfields at other locations in the State of Texas. This
hydrologic effort included evaluation of soil characteristics, precipitation, and potential ET,
which can affect the performance of ETA systems, and comparison of those values to those
found at the Lubbock test facility. The combination of the field test observations and the
hydrologic study were used to propose regional guidelines for ETA systems. This report
documents the Phase II efforts for these two objectives.
In another attempt to understand the fate of septic system effluents near ETA trenches, a
companion modeling study was carried out during Phase II. This study used a numerical
computer model that can describe unsaturated flow, MODFLOW-SURFACT, to simulate
wastewater application to an ETA trench under the same conditions observed at trench 9 during
1/15/2000 to 12/31/2000. The work and results effort were reported in a separate document by
Waghdhare et al. (2003). The findings of the modeling study indicated that, for the type II and
III soil and local climatic conditions at the Lubbock site, most of the water applied to the trench
is lost to ET from above and around the trench, rather than downward infiltration. It should be
noted that the current state of the art in unsaturated flow modeling is relatively imprecise due to
the limitations in numerical representation of the complex processes of gravity flow, capillary
suction, and ET that can simultaneously occur within a soil matrix. The findings and limitations
were presented in detail by Waghdhare et al. (2003) for the interested reader.

5
2. Phase II Field Demonstration
2.1 Operation of Field Site
2.1.1 Wastewater Loading
As reported previous, Phase II of the project was requested by the TOSWTRC to extend
observation of ETA trench behavior. The field site was shut down completely for approximately
nine months between Phases I and II. As shown in Figure 1.1, there were six total ETA trenches
at the site. Three received septic tank effluent in Phase I (4, 9, and 16), while three received
clean water for a short time (7, 14, and 15). In Phase II, all six of these trenches received septic
tank effluent under the same loading conditions as those used in Phase I. The effluent levels in
the trenches were maintained within 0.5 in of the top of the gravel envelope, and the flow to each
trench was monitored. All other operational practices were similar to those used in Phase I. The
units were brought on-line in a staggered fashion from early April into July, as the high initial
hydraulic loading rates challenged the capacity of the water well supplying the site. As seen in
Phase I, the loading rates decreased significantly after several weeks. The daily operational
procedure began with recording the flow totalizer readings for each trench and the wastewater
septic tank outlet. All readings were taken at the same time each day to provide consistent data.
Artificial wastewater was mixed once or twice daily depending on the loading demanded by the
wastewater units. The target artificial wastewater quality parameters, biochemical oxygen
demand (BOD5), chemical oxygen demand (COD), total Kjeldahl nitrogen (TKN), and total
suspended solids (TSS), are shown in Table 2.1, and the concentrations were the same as those in
Phase I. The artificial wastewater mixture, shown in Table 2.2, was also the same as that used in
Phase I, with one exception beginning in January 2003. After the beginning of Phase II, the
TOSWTRC| requested a separate addition of fats, oil, and grease (FOG) in the mixture. As of
the end of January 2003, after the flows in all trenches had been somewhat stable for a few
months, cooking oil was added to each batch for at 100 mg/L. The target FOG concentration
was typical of domestic wastewater (Qasim 1999; Tchobanoglous and Schroeder 1985).
Table 2.1 Target Wastewater Quality (as in Phase I)
Parameter
Concentration in Raw Mixture (mg/L)
BOD5 (without oil) 195 COD 502 TKN 32 TSS 87

6
Table 2.2 Artificial Wastewater Mixture
Ingredient
Concentration in Raw Mixture
Reduced Calorie Beer 2.51 mL/L Flour 53 mg/L
Kaolin-USP Grade 40 mg/L Triton X 24 mg/L
Urea 65 mg/L Cooking Oil (after January 2003) 100 mg/L
2.1.2. Weather Data Collection
An on-site weather station monitored precipitation and climatic conditions during the test
period. Daily potential free-water ET and precipitation amounts were calculated for evaluation
of the units’ responses to weather changes. The weather station was a GroWeather model
manufactured by Davis Instruments. Air temperature, humidity, and dew point were measured
using the temperature/humidity sensor. In addition, the GroWeather recorded solar radiation,
barometric pressure, precipitation, wind speed and wind direction. All weather records could be
viewed by using the keyboard unit mounted in the control building. A data logger was
connected to this unit to record weather conditions every thirty minutes and to calculate ET each
hour. ET was calculated by the software from hourly averages of solar radiation, air
temperature, vapor pressure, and wind speed using a Penman-type equation calibrated by Pruitt
and Doorenbos (1977). The data logger was downloaded daily to a computer using the
GroWeatherLink software. Backup weather data were also available from a second weather
station at Reese Center maintained by the Texas Tech University Wind Engineering Research
Center.
2.1.3 Water Quality Data Collection
Water samples were collected approximately biweekly from the wastewater header tank
and each trench. COD, total nitrogen (TN), and TSS were monitored with appropriate analytical
methods taken from APHA (1998). These water quality parameters were measured to insure that
the septic tank effluent supplied to the trenches remained similar to typical wastewater effluent.
2.2 Results
Phase II began with staggered initial loading of the six ETA trenches. The first trenches
began receiving septic tank effluent in April 2002, and by July 2002 all six trenches were under

7
loading. Each trench required several weeks for loading rates to stabilize. Trench 15 was
subject to repeated malfunctions of its flow control system in 2003, and flow to that trench was
terminated in May 2003. Loading of the remaining five trenches was terminated in on July 8,
2003. At that time, the flow control systems had been experiencing occasional flow control
problems, and complete replacement of the flow control valves and level sensors for all trenches
would have been too costly for the project funding level. In the following sections, the results
and discussion emphasize the observations after the loading rates stabilized.
2.2.1 Weather Observations
The primary weather data of interest were daily ET and precipitation. Figures 2.1 and 2.2
show the daily precipitation and free-water ET amounts, respectively, for the period of interest.
0.0
0.5
1.0
1.5
2.0
2.5
5/1/02 6/1/02 7/1/02 8/1/02 9/1/02 10/1/02 11/1/02 12/1/02 1/1/03 2/1/03 3/1/03 4/1/03 5/1/03 6/1/03 7/1/03
Date
Rai
nfal
l (in
)
Figure 2.1 Daily Precipitation for Phase II
0.0
0.1
0.2
0.3
0.4
0.5
0.6
5/1/02 6/1/02 7/1/02 8/1/02 9/1/02 10/1/02 11/1/02 12/1/02 1/1/03 2/1/03 3/1/03 4/1/03 5/1/03 6/1/03 7/1/03
Date
Evap
otra
nspi
ratio
n (in
)
Figure 2.2 Daily Evapotranspiration for Phase II

8
Table 2.3 summarizes the monthly amounts of ET and rainfall for Phase II. It should be noted
that only the first eight days of July 2003 are included. Examination of Figure 2.1 shows the
erratic nature of the precipitation events, as rainfall at the site was primarily from short-term term
convective thunderstorms rather than more persistent frontal or cyclonic storms. The greatest
monthly rainfall totals were for June 2002 and June 2003, and in both cases over half the rainfall
came on a single day. It should be noted that calendar year 2003 was the second driest on record
for the National Weather Service station at Lubbock International airport. The daily ET values,
while quite noisy from one day to the next, generally followed the expected seasonal trends with
greater ET in the summer months and lesser values in October through January.
Table 2.3 Monthly ET and Rainfall Totals for Phase II
Month ET (in) (in)5/02 8.62 0.036/02 8.69 4.267/02 8.06 0.578/02 8.39 1.409/02 6.10 0.3110/02 2.82 3.9311/02 2.86 0.3712/02 2.23 1.671/03 2.66 0.012/03 5.26 0.053/03 3.37 0.474/03 8.37 0.125/03 8.99 1.596/03 12.25 4.507/03* 3.51 0.01Total 92.16 19.29
* July 1-8 only
2.2.2 Loading Results
Tables 2.4 and 2.5 display the average monthly loading rates (gpd/ft2) and flow rates
(gpd) for the trenches, respectively. As expected, the initial loading rates for the ETA trenches
were relatively high, as the initially dry soil beneath and adjacent to the trenches accepted
significant amounts of water into the pore space. The loading rates were calculated for each day

9
Table 2.4 Average Monthly Loading Rates (gpd/ft2) with 95% Confidence Intervals
Mean Conf. Mean Conf. Mean Conf. Mean Conf. Mean Conf. Mean Conf. Mean Conf.4/02 4.17 0.87 off off off off 5.19 0.47 off off off off 4.68 0.675/02 1.65 0.24 3.06 0.32 2.56 0.74 3.08 0.47 2.84 0.58 off off 2.64 0.476/02 1.23 0.10 2.58 0.27 1.78 0.31 2.17 0.20 2.13 0.18 off off 1.98 0.217/02 1.24 0.07 1.81 0.20 1.34 0.07 1.77 0.14 1.69 0.15 3.91 1.45 1.96 0.348/02 1.08 0.06 1.32 0.10 1.09 0.06 1.89 0.26 1.42 0.14 1.81 0.15 1.43 0.139/02 0.84 0.04 0.91 0.04 0.89 0.05 1.51 0.19 1.06 0.04 1.44 0.10 1.11 0.08
10/02 0.65 0.06 0.80 0.07 0.73 0.12 1.20 0.10 0.73 0.11 1.10 0.09 0.87 0.0911/02 0.63 0.03 0.85 0.03 0.87 0.03 1.13 0.04 0.67 0.03 1.08 0.09 0.87 0.0412/02 0.65 0.06 0.83 0.07 0.81 0.09 1.04 0.09 0.64 0.05 1.03 0.08 0.83 0.071/03 0.90 0.04 0.94 0.04 0.85 0.04 1.12 0.05 0.76 0.04 1.05 0.05 0.94 0.042/03 0.95 0.08 1.11 0.10 1.04 0.17 1.23 0.11 0.94 0.08 1.26 0.18 1.09 0.123/03 0.89 0.14 1.50 0.32 0.91 0.21 1.07 0.17 0.94 0.13 1.59 0.20 1.15 0.204/03 0.83 0.13 1.15 0.15 0.80 0.12 1.17 0.19 1.00 0.14 1.25 0.18 1.03 0.155/03 0.78 0.08 1.03 0.11 0.99 0.18 1.00 0.11 0.89 0.16 1.13 0.15 0.97 0.136/03 0.61 0.07 0.93 0.11 0.75 0.12 0.81 0.11 off off 0.94 0.12 0.81 0.11
7/03* 0.44 0.12 0.70 0.23 0.51 0.22 1.03 0.83 off off 0.70 0.19 0.68 0.32
9 14 15 16Month
4 7 Overall
*July 1-8 only, 2.9 in rain in last week of June.
Table 2.5 Average Monthly Flow Rates (gpd) with 95% Confidence Intervals
Mean Conf. Mean Conf. Mean Conf. Mean Conf. Mean Conf. Mean Conf. Mean Conf.4/02 442 93 off off off off 550 50 off off off off 496 715/02 175 25 324 34 271 78 327 50 301 61 off off 280 506/02 130 10 274 28 189 33 230 21 226 20 off off 210 227/02 131 7 192 21 142 7 188 15 179 15 414 154 208 378/02 115 7 140 10 116 6 200 28 150 14 192 16 152 139/02 89 5 97 4 95 5 160 20 113 4 152 10 118 8
10/02 69 7 84 7 78 13 127 11 78 12 116 9 92 1011/02 67 4 90 3 92 3 120 4 71 3 115 10 93 412/02 69 6 87 7 86 9 110 10 67 6 109 9 88 81/03 95 4 99 4 90 4 119 5 81 4 112 5 99 52/03 101 9 118 11 111 18 130 12 99 9 134 19 115 133/03 94 14 159 34 97 22 113 18 99 14 168 22 122 214/03 88 14 122 16 85 13 124 20 106 14 133 19 110 165/03 83 8 109 12 104 19 106 11 94 17 119 15 103 146/03 64 7 99 12 79 13 86 11 off off 99 13 85 11
7/03* 47 13 74 24 54 23 109 88 off off 75 20 72 34
9 14Month
4 7 Overall15 16
* July 1-8 only, 2.9 in rain in last week of June.
by dividing that day’s flow rate in gpd by the absorption area of 106 ft2, which included the
bottom area of the trench plus 1 ft up the side walls. If any trench was subject to a malfunction
that caused zero or too much flow for a given day, that day’s flow data were removed from the
dataset prior to statistical analyses. Average values and 95% confidence intervals of loading and

10
0
1
2
3
4
5
6
4/02 5/02 6/02 7/02
Month
Load
ing
(gpd
/sq
ft)
479141516
Figure 2.3 Average Values and 95% Confidence Intervals for Loading in April-July 2002
0.0
0.5
1.0
1.5
2.0
2.5
8/02 9/02 10/02 11/02 12/02 1/03 2/03 3/03 4/03 5/03 6/03 7/03
Month
Load
ing
(gpd
/sq
ft)
479141516
Figure 2.4 Average Values and 95% Confidence Intervals for Loading in August 2002-July 2002
flow rate were calculated for each trench for each month. Figure 2.3 shows histograms of the
monthly loading averages and confidence intervals for the first four months of Phase II with the
scale on the loading axis sized to show the large initial values. Figure 2.4 is a similar plot for the
remainder of Phase II. It should be noted that only the first eight days of July 2003 three were
included in the Phase II dataset. Approximately 2.9 in of rainfall were measured at the field site

11
on the last two days of June 2003, which appeared to significantly affect the wastewater inputs to
the ETA trenches in the first week of July 2003. Had the experiment continued further through
the rest of July 2003, it is likely that the impacts of the late June storm would be dissipated over
time.
The observed loading rates at the trenches did vary somewhat after stabilizing near 1
gpd/ft2. The addition of cooking oil after January 2003 did not appear to have significant impact
on loading rates. In general, trench 4 had the lowest loading rates while trenches 7, 14, and 16
had the highest loading rates. As noted in Phase I, the soil conditions in the six trenches were
not exactly identical, and there were some variations in the results of initial double-ring
infiltrometer tests and observed loading rates. Double-ring infiltrometer tests were also
performed at the end of Phase II, and those results are presented in a later section. Table 2.6
summarizes the average loading rates for the ETA trenches that received septic tank effluent in
both Phase I and Phase II. For both phases, the last 12 months of operation were used to
represent a relatively longer-term condition after the flows had stabilized in all trenches. The
November-December 2002 period was used to compare with the lowest flow observations in
November-December 2000 in Phase I, which might be more meaningful for design
considerations. The April-May 2003 average loading rates were compared to the same two-
month period in 2001 in Phase I. Table 2.6 shows that the 12-month and November-December
averages were very close for the two experiments, while the April-May average loading rate
appeared to be somewhat higher for Phase II than Phase I. It was apparent that the average
loading rates were still much greater than the AB-only guidance of 0.20 to 0.25 gpd/ft2 set by the
TCEQ (2001) for the local soils. Before making further conclusions about those comparisons, it
was important to do post-test evaluation of the water content and infiltration measurements near
the trenches. That work is presented in a later section following the presentation of the water
quality observations.
Table 2.6 Phase I and II Comparison of ETAW Trenches
Phase I (4, 9, 16) Phase II (4, 7, 9, 14, 15, 16)
Time Period Average Load
(gpd/ft2) 95%
Confidence Average Load
(gpd/ft2) 95%
Confidence Final 12 months 1.07 0.21 1.04 0.15
November-December 0.70 0.24 0.85 0.15 April-May 0.78 0.23 1.00 0.12

12
2.2.3 Water Quality Data
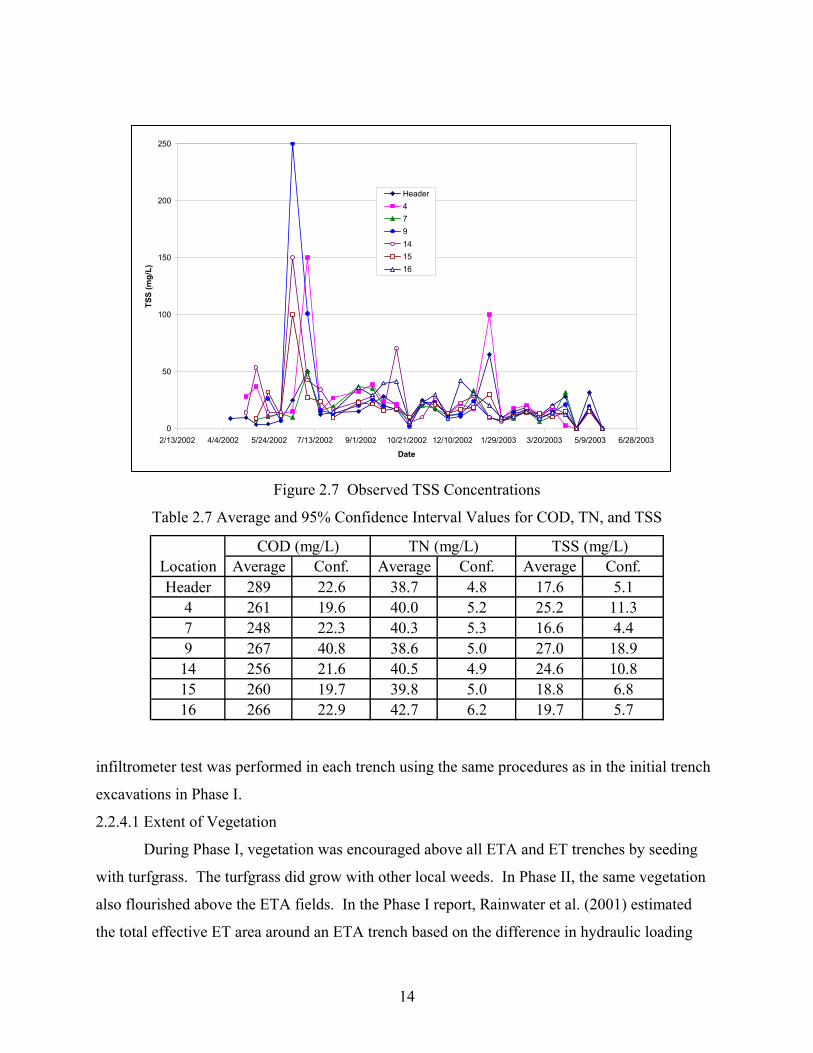
Figures 2.5, 2.6, and 2.7 display the observed concentrations of COD, TN, and TSS,
respectively for the septic tank effluent at the header tank as well as at the sampling location in
each trench. Table 2.7 summarizes the average values and 95% confidence intervals for the
three parameters for the entire Phase II. COD values were relatively stable around 260 to 280
mg/L, with only occasional outliers. TN was typically near 40 mg/L except during August to
October 2002, when concentrations were nearer 60 mg/L. TSS was typically near 25 mg/L
except for a few measurements in June 2002 and January 2003. It is not clear whether the higher
TN and TSS values were due sampling or analytical errors, or to actual differences in system
behavior. It should be noted that this project was not intended to quantify treatment in the
trenches, but rather the water quality data were to demonstrate the stability in the test conditions.
2.2.4 Post-Treatment Investigation
During July 2003, after the end of the septic tank effluent loading, three types of field
investigations were done to evaluate the hydrogeologic conditions at and near trenches 4, 7, 9,
14, and 16. Field 15 was not included as it had been taken off-line two months earlier. The
purpose of the investigations was to determine whether significant biological growth in the soil
near the trenches could be the cause of the lower long-term loading rates. One criticism of the
Phase I and II field studies could be that neither was long enough to allow significant build-up of
microorganisms or “biological mat” along the bottom and walls of the trenches, at the interface
between the gravel and native soil. A related concern was the distribution of moisture in the soil
beneath and adjacent to the trenches. In the previous report on Phase I, Rainwater et al. (2001)
proposed that the added hydraulic capacity of the ETA trenches beyond that assumed in the
guidance for AB-only trenches was due to an ET area for each trench that was much larger than
the rectangular top of the trench excavation. To evaluate these concerns, several different post-
treatment tasks were done. First, the extent of enhanced vegetation above and around each
trench was measured and recorded. Second, geoprobe samples were taken through and near the
trenches to quantify vertical and lateral variations in water content. The water contents in the
samples near the trenches were compared to those at similar depths at two control sample
locations at the field site that were never exposed to the septic system effluent. Third, a backhoe
was used to carefully excavate to the bottom of each trench and expose the presence or absence
of the “biological mat.” This task was recorded with photographs. Fourth, a double-ring

13
0
200
400
600
800
1000
2/13/2002 4/4/2002 5/24/2002 7/13/2002 9/1/2002 10/21/2002 12/10/2002 1/29/2003 3/20/2003 5/9/2003 6/28/2003
Date
CO
D (m
g/L)
Header
4
7
9
14
15
16
Figure 2.5 Observed COD Concentrations
0
20
40
60
80
100
2/13/2002 4/4/2002 5/24/2002 7/13/2002 9/1/2002 10/21/2002 12/10/2002 1/29/2003 3/20/2003 5/9/2003 6/28/2003
Date
TN (m
g/L)
Header479141516
Figure 2.6 Observed TN Concentrations
14
0
50
100
150
200
250
2/13/2002 4/4/2002 5/24/2002 7/13/2002 9/1/2002 10/21/2002 12/10/2002 1/29/2003 3/20/2003 5/9/2003 6/28/2003
Date
TSS
(mg/
L)
Header479141516
Figure 2.7 Observed TSS Concentrations
Table 2.7 Average and 95% Confidence Interval Values for COD, TN, and TSS
Location Average Conf. Average Conf. Average Conf.Header 289 22.6 38.7 4.8 17.6 5.1
4 261 19.6 40.0 5.2 25.2 11.37 248 22.3 40.3 5.3 16.6 4.49 267 40.8 38.6 5.0 27.0 18.9
14 256 21.6 40.5 4.9 24.6 10.815 260 19.7 39.8 5.0 18.8 6.816 266 22.9 42.7 6.2 19.7 5.7
COD (mg/L) TN (mg/L) TSS (mg/L)
infiltrometer test was performed in each trench using the same procedures as in the initial trench
excavations in Phase I.
2.2.4.1 Extent of Vegetation
During Phase I, vegetation was encouraged above all ETA and ET trenches by seeding
with turfgrass. The turfgrass did grow with other local weeds. In Phase II, the same vegetation
also flourished above the ETA fields. In the Phase I report, Rainwater et al. (2001) estimated
the total effective ET area around an ETA trench based on the difference in hydraulic loading

15
between the ET only, AB only, and ETA trenches. The average contributing area is shown in
Figure 2.8, with the effective ET area extending 5.8 ft beyond the rectangular trench excavations.
As part of the Phase II study, the area of flourishing vegetation around the ETA trenches was
used as an indication of the total effective ET areas. The vegetation extent measurement was
made in July 2003 after termination of loading. The distance to the end of the enhanced
vegetation was measured near each of the four corners of the ETA trench excavations, and a
single average ET radius was calculated for each trench, as shown in Table 2.8.
Drainfield Trench 3 ft by 20 ft
5.8 ft
Additional Evapotranspiration Area
Figure 2.8 Phase I Estimated ET Area for Wastewater ETA Trenches (Rainwater et al. 2001)
Table 2.8 Estimated ET Radius Beyond ETA Trench
Trench Radius (ft) 4 7.9 7 6.9 9 10.5 14 8.5 16 7.2
The values in Table 2.8 all exceeded the 5.8 ft that was estimated based on the Phase I
loading results. The average ET radius beyond the trenches was 8.2 ft. This finding helped
quantify the lateral movement of water from the ETA trenches. The current TCEQ (2001)
guidelines encourage a minimum separation of 3 ft between trenches in AB drainfields.
Recognition of the impact of ET in ETA trenches would encourage greater minimum spacing
between trenches. Based on the Phase II findings, ETA trenches in the Lubbock area with soils
similar to those at the Reese Center test site should be separated by 15 to 20 ft where possible.
This greater separation would take greater advantage of the ET mechanism for disposal of the
septic tank effluent.

16
2.2.4.2 Geoprobe Sampling
On July 15 and 17, 2003, a geoprobe rig and operator from ESA Environmental, Inc.,
were brought to the field site. The purpose was to collect 1.5-in diameter geoprobe samples to a
target depth of 12 ft at locations beneath and adjacent to fields 4, 7, 9, 14, and 16. The geoprobe
positions are shown relative to the distribution pipe in each trench in Figure 2.9. Position 1 was
sampled directly through the backfill, gravel, and native soil beneath the trench. Position 2 was
just beyond the trench wall. Positions 3 and 4 were intended to be within and just outside the ET
area, respectively. Geoprobe samples were also taken at two control locations, C-1 at 120 ft east
northeast of the control building, and C-2 at 80 ft east northeast of the control building. Figure
2.10 shows the geoprobe rig and operator. As the samples were collected, there were occasional
problems with sample compression and recovery, as is normal to geoprobe technology.
Photographs were taken immediately upon production of the samples, as the material inside the
transparent acetate sleeve was readily visible. Figure 2.11 shows the sample from trench 9 that
included the interface between the gravel bed material, heavily blackened by biological growth
(to the right in the photo), and the native soil beneath the trench bottom (to the left). It was
obvious in the samples at position 1 in each trench that biological growth in the gravel pack was
significant, coating some of the gravel and taking up some of the pore space. The soil
immediately beneath the trench also had some darkening due to moisture and biological growth,
and the biological material was no longer visible a few ft lower.
Figure 2.9 Geoprobe Positions Relative to Trench Centerline
4 ft 5 ft
20 in
1 2 3 4

17
Figure 2.10 Geoprobe Rig (ESA Enviromental, Inc)
Figure 2.11 Geoprobe Sample 9-1, with Interface at Trench Bottom

18
Soil samples were taken from the geoprobe sleeves and analyzed for gravimetric water content
and gravimetric volatile solids content (percent of dry soil weight). Water content was found by
drying 60 to 100 g of moist soil in a 104°C oven, then comparing before and after weights.
Volatile solids (VS) content was estimated by taking the oven-dried soil, firing it in a 550°C
muffle furnace, then comparing before and after weights. It is recognized that the volatile solids
can include any organic matter in the soil, such as plant material and biological growth
associated with the wastewater effluent. Figures 2.12 to 2.16 display the comparisons of the
water content measurements at trenches 4, 7, 9, 14, and 16, respectively, with the values from the
two control positions. Occasionally on the plots, single data points are shown without
connection by a line to the other datapoints. That condition occurs when one of the datapoints,
such as depth of 4 ft at geoprobe holes 4-1 and 4-2 in Figure 2.8, is missing because a soil
sample could not be accurately associated with that depth. It should be noted that the collected
soil was subject to some compression or occasional reduced recovery in the 4-ft long plastic
sleeves, such that it was sometimes impossible to have a soil mass for every depth in each hole.
It is apparent that the average water content in the controls was about 0.08 down to the
10-ft depth. At all five trenches, the water contents in geoprobe holes at positions 1, 2, and 3
were greater than the water contents in the controls for depths of 10 ft or less. At position 4,
furthest from the trench, the water content was typically closest to that in the controls at the 2 ft
depth, but was then greater than that for the controls for depths below 4 ft. For positions 2, 3,
and 4 that had samples at the 12-ft depth, the water contents often were lower at 12 ft than at 10
ft, and closer to the 12-ft value at C-2. At trenches 4 and 7, the water contents in position 1 at
depths beneath the trench bottom of 2 ft were typically relatively high, while the water contents
at the same depths in position 1 in trenches 9, 14, and 16 were similar to those at the other three
geoprobe positions. These results indicate that wastewater loading in the trenches typically at
least doubled the gravimetric water contents in the unsaturated soil nearby. It was also useful to
estimate the volumetric water saturation levels in the unsaturated soil samples. Water saturation,
S, is given by
−=
−
=
−
==w
s
s
s
w
w
s
w
w
v
w wm
m
V
m
VV
Sρρ
φφ
ρφφ
ρ
φφρ 1
11
(2.1)

19
Gravimetric water content
0.0 0.2 0.4 0.6 0.8 1.0
Dep
th (f
t)
-14
-12
-10
-8
-6
-4
-2
0
C-1C-24-14-24-34-4
Figure 2.12 Water Contents Near Trench 4 as Compared to Controls
Gravimetric water content
0.0 0.1 0.2 0.3 0.4 0.5
Dep
th (f
t)
-14
-12
-10
-8
-6
-4
-2
0
C-1C-27-17-27-37-4
Figure 2.13 Water Contents Near Trench 7 as Compared to Controls

20
Gravimetric water content
0.0 0.1 0.2 0.3 0.4 0.5
Dep
th (f
t)
-14
-12
-10
-8
-6
-4
-2
0
C-1C-29-19-29-39-4
Figure 2.14 Water Contents Near Trench 9 as Compared to Controls
Gravimetric water content
0.0 0.1 0.2 0.3 0.4 0.5
Dep
th (f
t)
-14
-12
-10
-8
-6
-4
-2
0
C-1 C-214-1 14-2 14-314-4
Figure 2.15 Water Contents Near Trench 14 as Compared to Controls

21
Gravimetric water content
0.0 0.1 0.2 0.3 0.4 0.5
Dep
th (f
t)
-14
-12
-10
-8
-6
-4
-2
0
C-1C-216-116-2 16-316-4
Figure 2.16 Water Contents Near Trench 7 as Compared to Controls
where Vw = water volume (cc), Vv = void volume (cc), mw = water mass (g), ms = soil mass (g),
ρw = water density (1.0 g/cc), ρs = soil density (2.67 g/cc), φ = porosity, and w = gravimetric
water content. The value of w, as the ratio of mw over ms, was known from the gravimetric
analysis, and the two density values were typical for water and soil particles, respectively.
Undisturbed porosities were not known for the soil samples, but typical values of 0.35, 0.40, and
0.45 were used to represent a plausible range. Equation 2.1 was then used to calculate S for each
soil sample, and Table 2.9 summarizes the average, Savg, maximum, Smax, and minimum, Smin,
values for each geoprobe sample hole.
The saturation values are directly related to the water content values, but the S values
merit some separate discussion. It is recognized that a number of the S values for samples near
the centers of trench 4 and 7 were above 1.0. Complete saturation corresponds to S = 1. Some
of the geoprobe samples were so wet that as the sample was removed from the plastic sleeve,
some of the water from surrounding soil was accidentally collected. Otherwise, the typical S for
the controls was about 0.4, 0.3, and 0.2 for the porosities of 0.35, 0.40, and 0.45, respectively.
At the sample locations near the trenches, the typical S values were about 0.8, 0.6, and 0.4 for the

22
Table 2.9 Calculated Saturation Levels for Possible Porosities
Savg Smax Smin Savg Smax Smin Savg Smax Smin
C-1 0.37 0.51 0.25 0.30 0.42 0.21 0.20 0.28 0.14C-2 0.39 0.62 0.29 0.32 0.50 0.23 0.21 0.33 0.164-1 2.05 4.60 0.99 1.66 3.72 0.80 1.11 2.48 0.544-2 0.91 1.15 0.80 0.73 0.93 0.65 0.49 0.62 0.434-3 0.73 1.17 0.30 0.59 0.94 0.24 0.39 0.63 0.164-4 0.52 0.74 0.34 0.42 0.60 0.28 0.28 0.40 0.187-1 1.31 2.14 0.74 1.06 1.73 0.60 0.70 1.15 0.407-2 0.71 0.90 0.48 0.57 0.73 0.39 0.38 0.49 0.267-3 0.60 0.83 0.25 0.48 0.67 0.20 0.32 0.45 0.137-4 0.54 0.66 0.37 0.44 0.53 0.30 0.29 0.35 0.209-1 0.65 0.79 0.40 0.52 0.64 0.32 0.35 0.43 0.229-2 0.78 0.90 0.71 0.63 0.73 0.58 0.42 0.48 0.389-3 0.69 0.77 0.46 0.56 0.62 0.37 0.37 0.41 0.259-4 0.64 0.81 0.30 0.52 0.66 0.24 0.34 0.44 0.1614-1 0.63 0.85 0.37 0.50 0.68 0.30 0.34 0.46 0.2014-2 0.72 0.87 0.49 0.58 0.70 0.39 0.39 0.47 0.2614-3 0.60 0.84 0.12 0.49 0.68 0.10 0.32 0.45 0.0714-4 0.58 0.78 0.24 0.47 0.63 0.19 0.31 0.42 0.1316-1 0.70 0.84 0.58 0.56 0.68 0.47 0.38 0.45 0.3116-2 0.76 0.96 0.35 0.61 0.77 0.28 0.41 0.52 0.1916-3 0.69 0.83 0.43 0.56 0.67 0.35 0.37 0.45 0.2316-4 0.74 1.12 0.49 0.59 0.90 0.40 0.40 0.60 0.27
Hole0.450.40.35
porosities of 0.35, 0.40, and 0.45, respectively. As seen with the gravimetric water contents, S
values near the trenches were approximately twice the values noted at the control locations. It is
most likely that the actual porosity of the field site soils ranges from about 0.40 to 0.45, based on
additional soil analyses done by Waghdhare et al. (2003) in their numerical modeling of flow in
the unsaturated soil near trench 9. In those simulations, significant water flow occurred while S
values remained in the 0.40 to 0.65 range, which compared well to the calculated S values for
porosities of 0.40 and 0.45.
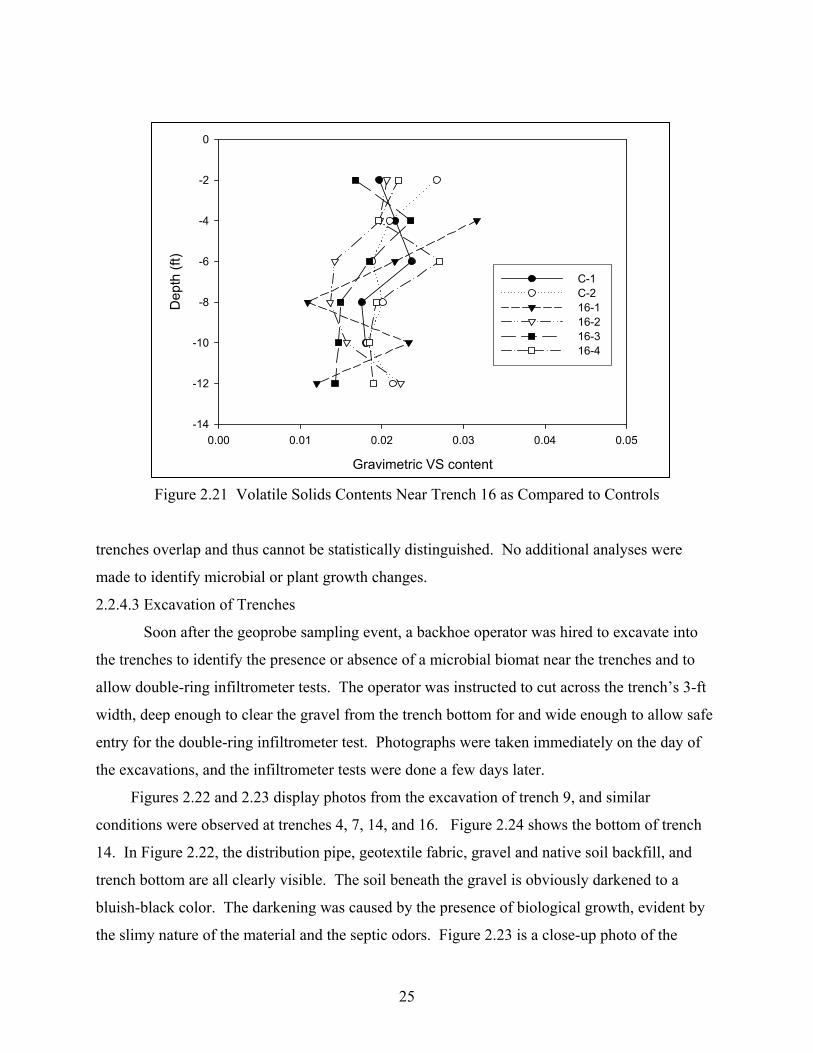
The results of the gravimetric VS analyses are shown in Figures 2.17 through 2.21.
Volatile solids that are removed during firing in a muffle furnace include any organic matter,
whether plant roots or microorganisms. It is apparent that the gravimetric VS values are
somewhat variable in each hole, but the values at both the controls and the holes near the

23
Gravimetric VS content
0.01 0.02 0.03 0.04 0.05 0.06
Dep
th (f
t)
-14
-12
-10
-8
-6
-4
-2
0
C-1C-24-14-24-34-4
Figure 2.17 Volatile Solids Contents Near Trench 4 as Compared to Controls
Gravimetric VS content
0.00 0.01 0.02 0.03 0.04 0.05
Dep
th (f
t)
-14
-12
-10
-8
-6
-4
-2
0
C-1C-27-17-27-37-4
Figure 2.18 Volatile Solids Contents Near Trench 7 as Compared to Controls

24
Gravimetric VS content
0.00 0.01 0.02 0.03 0.04 0.05
Dep
th (f
t)
-14
-12
-10
-8
-6
-4
-2
0
C-1C-29-19-29-3 9-4
Figure 2.19 Volatile Solids Contents Near Trench 9 as Compared to Controls
Gravimetric VS content
0.00 0.01 0.02 0.03 0.04 0.05
Dep
th (f
t)
-14
-12
-10
-8
-6
-4
-2
0
C-1C-214-114-214-314-4
Figure 2.20 Volatile Solids Contents Near Trench 14 as Compared to Controls
25
Gravimetric VS content
0.00 0.01 0.02 0.03 0.04 0.05
Dep
th (f
t)
-14
-12
-10
-8
-6
-4
-2
0
C-1C-2 16-1 16-216-316-4
Figure 2.21 Volatile Solids Contents Near Trench 16 as Compared to Controls
trenches overlap and thus cannot be statistically distinguished. No additional analyses were
made to identify microbial or plant growth changes.
2.2.4.3 Excavation of Trenches
Soon after the geoprobe sampling event, a backhoe operator was hired to excavate into
the trenches to identify the presence or absence of a microbial biomat near the trenches and to
allow double-ring infiltrometer tests. The operator was instructed to cut across the trench’s 3-ft
width, deep enough to clear the gravel from the trench bottom for and wide enough to allow safe
entry for the double-ring infiltrometer test. Photographs were taken immediately on the day of
the excavations, and the infiltrometer tests were done a few days later.
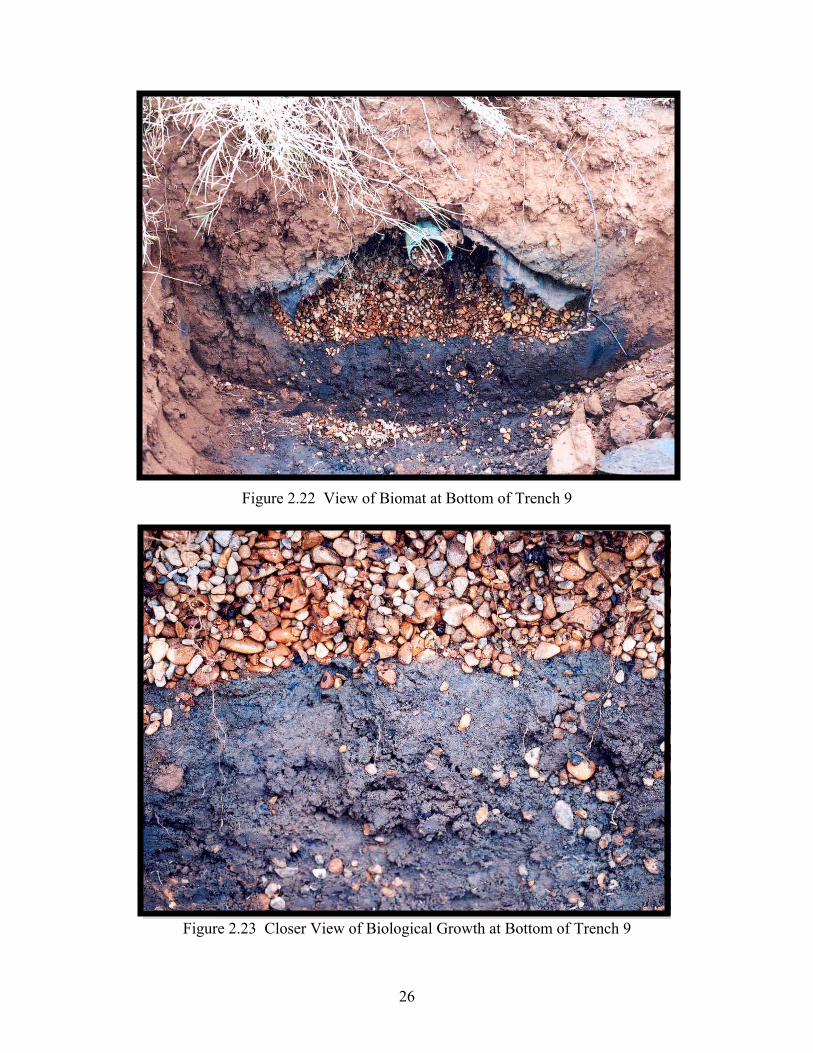
Figures 2.22 and 2.23 display photos from the excavation of trench 9, and similar
conditions were observed at trenches 4, 7, 14, and 16. Figure 2.24 shows the bottom of trench
14. In Figure 2.22, the distribution pipe, geotextile fabric, gravel and native soil backfill, and
trench bottom are all clearly visible. The soil beneath the gravel is obviously darkened to a
bluish-black color. The darkening was caused by the presence of biological growth, evident by
the slimy nature of the material and the septic odors. Figure 2.23 is a close-up photo of the
26
Figure 2.22 View of Biomat at Bottom of Trench 9
Figure 2.23 Closer View of Biological Growth at Bottom of Trench 9

27
Figure 2.24 View of Double-Ring Infiltrometer in Trench 14
interface at the bottom of the trench. These photos, with the addition observations in the
geoprobe samples through the trenches, prove that the biological growth was significant in all
five trenches.
One double-ring infiltrometer test was performed in each trench excavation by Dr.
Heyward Ramsey, the same TTUWRC researcher who carried out the initial tests at the
beginning of Phase I. The rings were installed in the floor of the excavation, and care was taken
to insure that the disturbance of the trench bottom was minimal at the test location. Table 2.10
compares the results of the 24-hr infiltration rates from Phase I (average of three tests in each
trench) and Phase II. The final infiltration rates were much lower that the initial values in all five
trenches, about one-third to one-tenth of the original values. The decrease in infiltration rate was
most likely caused by the presence of microbial growth within the pore space beneath the trench.
The infiltrometer test values compare reasonably well with the average observed loading rate of
the ETA trenches. As shown in Table 2.6, the average loading rate was approximately 1.0
gpd/ft2, which converts to 0.07 in/hr for the infiltration area of 106 ft2. These findings also
provide evidence that the loading test duration was long enough to generate significant biomat

28
Table 2.10 Infiltrometer Results after 24 hr of Saturation
Trench
Initial Infiltration Rate1 (in/hr)
Final Infiltration Rate2 (in/hr)
4 0.20 0.05 7 0.38 0.07 9 0.29 0.03 14 0.61 0.24 16 0.69 0.07
Notes: 1. Average of three tests in new trench. 2. Result of one test after Phase II.
growth beneath the ETA trenches.

29
3. Soil and Hydrologic Study
3.1 Problem Statement and Tasks
Under current TCEQ (2001) guidance, drainfield design is based on either ET only or AB
only trenches for wastewater disposal. Sites with low permeability soils and/or shallow water
tables favor ET drainfields, which lose water only upward to the atmosphere. ET drainfields are
lined, allowing only upward loss of water to plant roots or evaporation. Sites with permeable
soils and relatively deep water tables are preferred for AB drainfields, which dispose of water
through gravity flow and capillary action. Actually, AB drainfields lose water through both
gravity flow and ET, as capillary forces can move water laterally and upward in the unsaturated
soil, making the moisture available for plant roots or direct evaporation into the atmosphere.
These combined processes are ignored in the TCEQ (2001) guidance. Annual potential ET
varies from about 50 in/yr in far east Texas to over 90 in/yr in far west Texas, as stated in the
TCEQ (2001) design manual. The annual precipitation across Texas varies greatly from less
than 10 in/year in the far west to almost 60 in/year in the far east. Many different types of soils
and vegetation are encountered across this large state, with sandier soils dominating in the west
and clayey soils dominating toward the Gulf Coast. In the more arid portion of western Texas,
permeable soils and low water tables encourage AB drainfields, but neglecting the additional
water lost through ET may result in significantly over-designed drainfield installations. This
effort considered the combined effects of ET and AB (referred to as ETA when combined) that
might be sufficient to warrant significant changes in the TCEQ guidance for at least some parts
of Texas. Previous work in Phase I of the TTUWRC research (Rainwater et al. 2001) indicated
that ETA systems in the Lubbock area could be made significantly smaller than the current AB
guidance requires.
This study had four specific objectives. First, a subset of 13 of the state’s 254 counties
was selected to represent significant variations in climate, soil, and hydrologic conditions.
Second, soil, climate, and hydrologic data were collected for each of the selected counties.
Third, the data were analyzed to determine local values of annual precipitation, annual ET, and
soil hydraulic conductivity for selected dominant soils for each county. Finally, the conditions in
each county were compared to those at the TTUWRC test site with the intent of recommending
separate LTAR values for ETA systems in the selected soils and counties.

30
3.2 Selected Counties
Thirteen counties were selected to represent the variations in climate, soils, and
hydrologic conditions across the state of Texas. Figure 3.1 shows the counties by location on a
map of Texas. The counties (Texas Climate Division in parentheses) included Angelina (East
Texas), Baylor (Low Rolling Plains), Bexar (South Central), Cameron (Lower Valley), Dallas
(North Central), El Paso (Trans-Pecos), Jefferson (Upper Coast), Lubbock (High Plains), Pecos
(Trans-Pecos), Potter (High Plains), Tom Green (Edwards Plateau), Webb (Southern) , and
Wharton (Upper Coast). The counties are somewhat uniformly distributed across the state and
hopefully represent a range of conditions from arid to marine climate, sandy to clayey soils, low
to high ET, and low to high precipitation. Contour maps of ET and precipitation are shown in a
later section. The counties were all easily connected to current TCEQ (2001) ET drainfield
guidance. It should be noted that before setting any final ETA guidance by TCEQ, all 254
counties should be considered separately. This subset was used to demonstrate the procedure
and allow for critical evaluation. Any final adjusted procedure could then be applied to all 254
counties in the state.
3.3 Data Collection
3.3.1 Soil Characteristics
The TCEQ (2001) guidelines use Figure 3.2 and Table 1.1 to connect soil classification to
LTAR. Soil classification is dependent on grain-size distribution. Permeability of the soil
matrix is affected by grain-size distribution as well as the soil’s hydrologic condition, whether
tightly packed, unconsolidated, or vegetated. The information for soil description, texture, grain-
size distributions, and permeability ranges were obtained from the Natural Resources
Conservation Service (NRCS) soil surveys for each of the 13 counties. The individual citations
are shown in the reference list at the end of this report. In each county, there could be dozens of
different soils as categorized by the soil scientists. Often, many of the different named soil types
had similar or overlapping grain-size distributions and permeability ranges. To make the
datasets more manageable, only the two most abundant soil types based on their percentages of
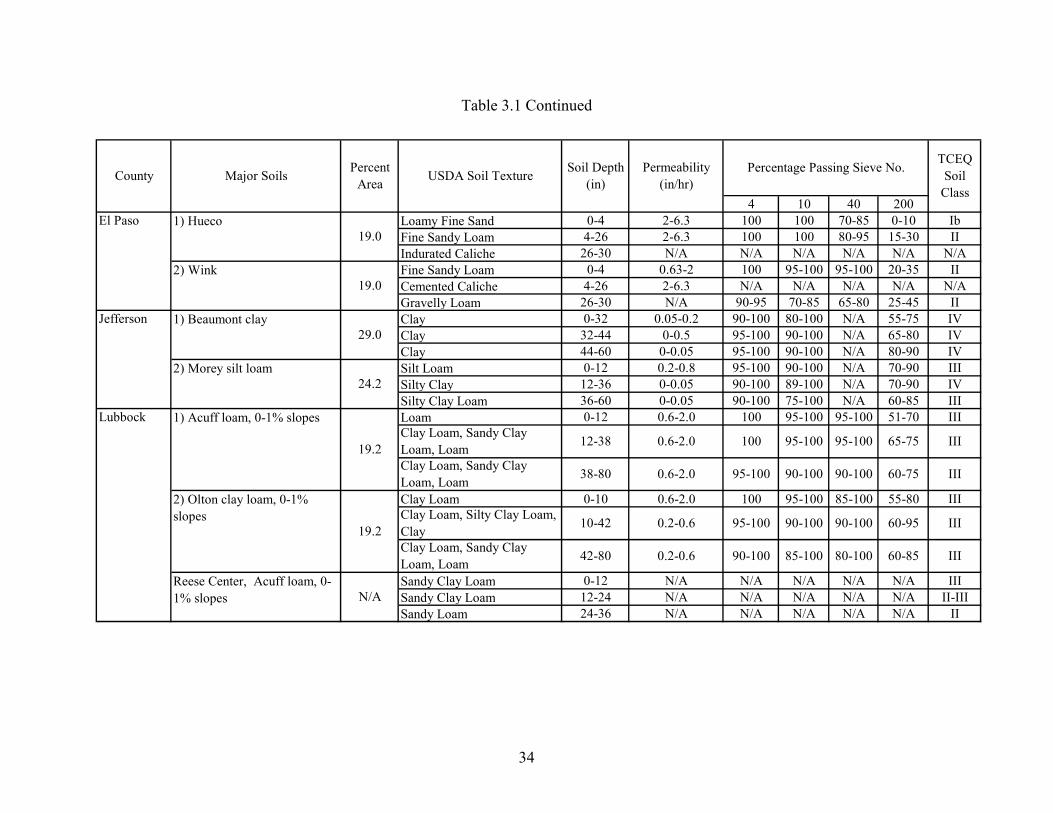
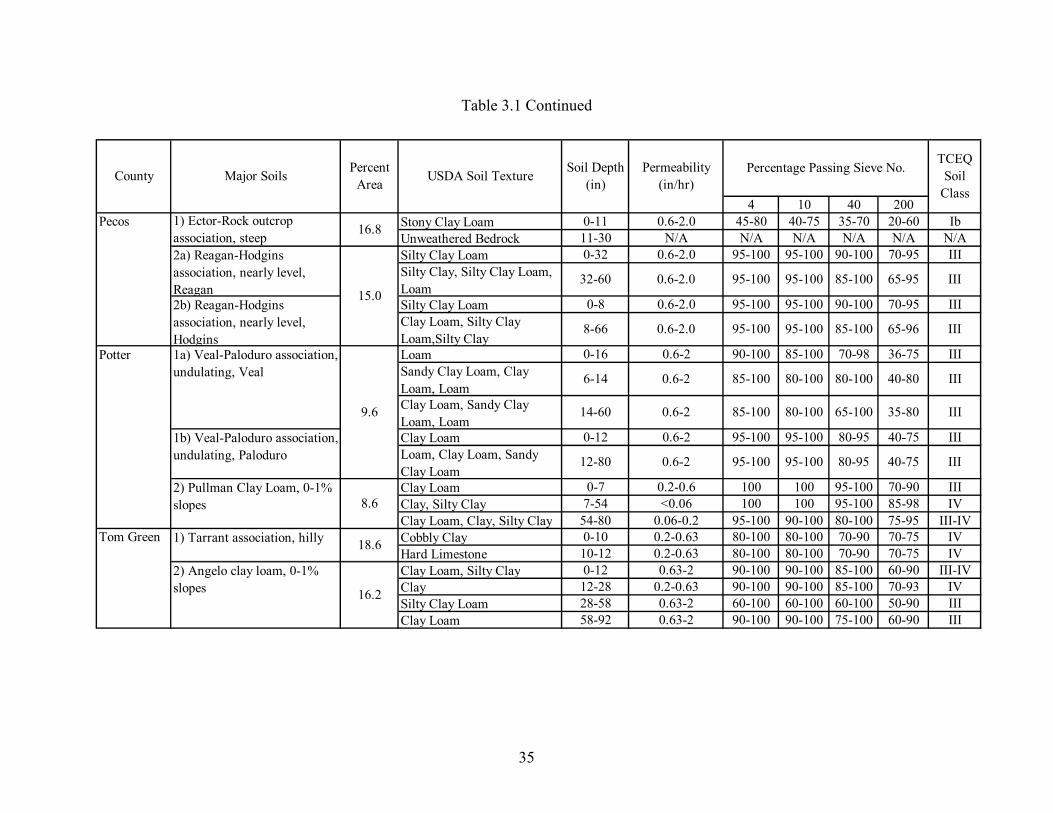
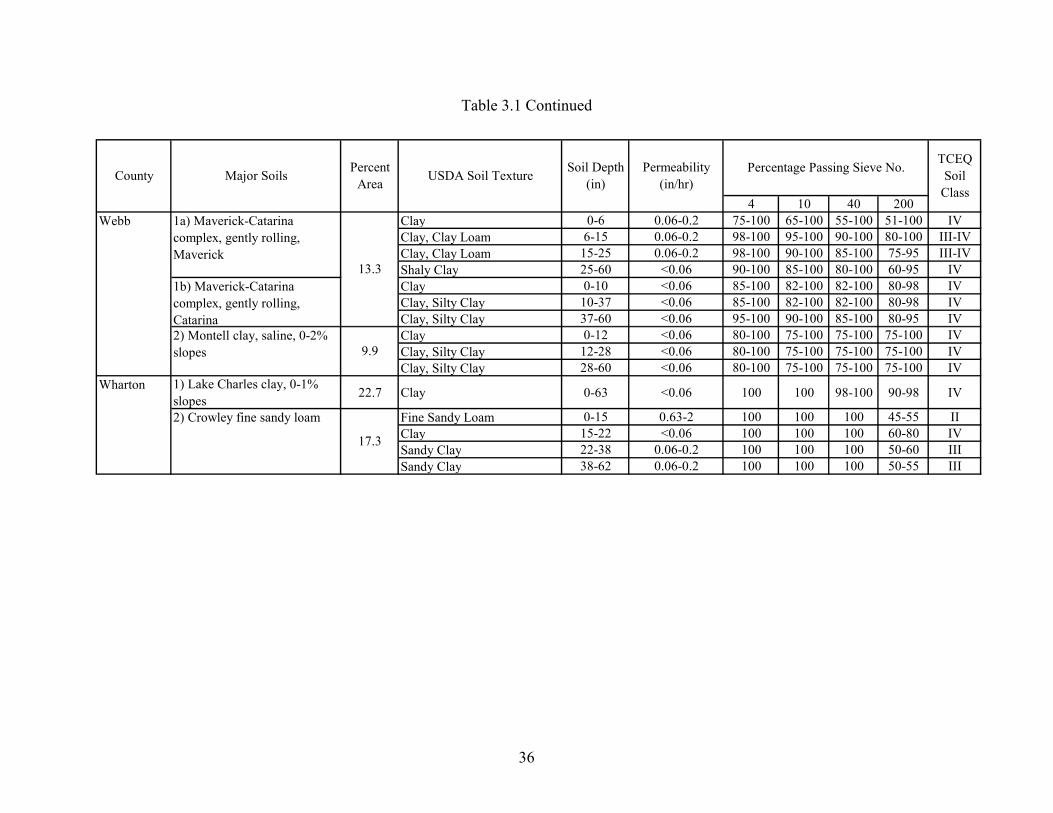
land area in the county were selected for further analyses. Table 3.1 shows the data for the
selected soils. The textural descriptions were used to assign TCEQ (2001) soil classes. The soil
depths and permeability values must be recognized as typical values, such that site-specific
values might vary significantly.

31
Figure 3.1 Selected Counties
3.3.2 Hydrologic Data
The historic average annual precipitation for Texas were obtained from the Natural
Resources Conservation Service web site as a shape file (NRCS 2002) for the years 1967
through 2001. Using this dataset, a contour map of average annual precipitation was projected
with ArcGIS™. By converting this contour layer to a grid layer, the average annual precipitation
contours were divided into five classes using natural breaks. The generated map is shown in
Figure 3.3.
Estimation of potential ET can be done in several ways, as a number of theoretical and

32
100
90 80 70 60 50 40 30 20 10 0
90
100
80
70
60
50
40
30
20
10
0
010
2030
4050
6070
8090
100
Percent Sand
Perc
ent C
lay Percent Silt
SILT
SILT LOAM
SILTY CLAYLOAM
CLAYLOAM
SANDYCLAY
SANDY CLAYLOAM
SANDY LOAM
SANDLOAMYSAND
CLAY
SILTYCLAY
Ib II
III
IV
Note: Class Ia soils contain >30% gravel, and are not shown here.
Figure 3.2. USDA Soil Textural Classification with TCEQ Soil Classes
empirical approaches are available, with debatable relative precision. For this study, monthly
values of ET were taken from Borrelli et al. (1998), who provided a manual for the Texas Water
Devleopment Board that compiles estimates of free-water evaporation and crop ET for locations
throughout Texas. The estimates are based on the Borrelli-Sharif equation, which considers
variations in solar radiation, temperature, humidity, and wind speed. The free-water ET
estimates were selected for use in this project as representing potential ET, rather than crop-
specific values, as the vegetation atop ETA drainfields would likely vary significantly across the
state. Monthly values were accumulated into typical annual ET values for 58 spatially
referenced city locations across the state, then entered into a spreadsheet and saved as dbase4 file
(.dbf file). This dataset was then manipulated in ArcMap™ as an attribute table. Next, the

33
Table 3.1 Soil Characteristics (NRCS soil surveys)
4 10 40 200Angelina Fine Sandy Loam 0-39 0.6-2.0 98-100 98-100 95-100 40-60 II
Weathered Bedrock 58-70 N/A N/A N/A N/A N/A N/AVery Fine Sandy Loam 0-16 2.0-6.0 100 96-100 90-100 51-80 IILoam, Sandy Clay Loam 16-72 0.6-2.0 100 96-100 90-100 51-85 III
Bexar 1) Tarrant association gently undulating 7.8 Clay Loam 0-10 1.0-1.2 60-95 60-90 N/A 60-85 III
Silty Clay 0-44 1.0-1.2 99 100 98 88 IVSilty Clay Loam 44-62 1.0-1.2 87 83 80 70 III
Baylor Clay 0-18 <0.06 95-100 95-100 90-100 80-95 IVShaly Clay 18-60 <0.06 90-100 85-100 80-90 55-80 IVClay 0-26 <0.06 95-100 90-100 90-100 80-95 IVShaly Clay 26-40 <0.06 90-100 85-100 65-100 65-90 IVClay 0-26 <0.06 95-100 90-100 90-100 80-95 IVShaly Clay 26-40 <0.06 90-100 85-100 65-100 65-90 IV
Cameron Silty Clay Loam 0-8 0.63-2 100 100 100 85-100 IIISilty Clay Loam, Silt Loam 8-72 0.63-2 100 100 100 70-99 IIIClay 0-11 <0.06 100 100 100 95-100 IVClay 11-35 <0.06 100 100 100 95-100 IVClay 35-71 <0.06 100 100 100 95-100 IV
Dallas Clay 0-6 <0.06 95-100 95-100 95-100 85-100 IVClay, Silty Clay 6-70 <0.06 95-100 95-100 95-100 85-100 IVClay 0-6 <0.06 95-100 95-100 95-100 85-100 IVClay, Silty Clay 6-70 <0.06 95-100 95-100 95-100 85-100 IV
Percentage Passing Sieve No.County Major Soils Percent Area USDA Soil Texture Soil Depth
(in)Permeability
(in/hr)
III
TCEQ Soil
Class
98-100 95-100 51-7539-58 <0.06 98-100
10.4
8.1
8.3
7.6
5.8
15.5
11.5
Silty Clay Loam,Clay Loam,Weathered Bedrock
1) Fuller fine sandy loam, 1-4% slopes
2) Lewisville silty clay, 0-1% slopes 1a) Owens-Vernon association, rolling, Owens1b) Owens-Vernon association, rolling, Vernon
2) Alazan very fine sandy loam, 0-4% slopes
1) Houston Black-urban land complex, 0-4% slopes2) Houston Black clay, 1-3% slopes
2) Vernon clay, 3-8% slopes
1) Laredo silty clay loam, 0-1% slopes 2) Harlingen clay
7.9
7.8
34
Table 3.1 Continued
4 10 40 200El Paso Loamy Fine Sand 0-4 2-6.3 100 100 70-85 0-10 Ib
Fine Sandy Loam 4-26 2-6.3 100 100 80-95 15-30 IIIndurated Caliche 26-30 N/A N/A N/A N/A N/A N/AFine Sandy Loam 0-4 0.63-2 100 95-100 95-100 20-35 IICemented Caliche 4-26 2-6.3 N/A N/A N/A N/A N/AGravelly Loam 26-30 N/A 90-95 70-85 65-80 25-45 II
Jefferson Clay 0-32 0.05-0.2 90-100 80-100 N/A 55-75 IVClay 32-44 0-0.5 95-100 90-100 N/A 65-80 IVClay 44-60 0-0.05 95-100 90-100 N/A 80-90 IVSilt Loam 0-12 0.2-0.8 95-100 90-100 N/A 70-90 IIISilty Clay 12-36 0-0.05 90-100 89-100 N/A 70-90 IVSilty Clay Loam 36-60 0-0.05 90-100 75-100 N/A 60-85 III
Lubbock Loam 0-12 0.6-2.0 100 95-100 95-100 51-70 III
Clay Loam 0-10 0.6-2.0 100 95-100 85-100 55-80 III
Sandy Clay Loam 0-12 N/A N/A N/A N/A N/A IIISandy Clay Loam 12-24 N/A N/A N/A N/A N/A II-IIISandy Loam 24-36 N/A N/A N/A N/A N/A II
Soil Depth (in)
Permeability (in/hr)
Percentage Passing Sieve No. TCEQ Soil
ClassCounty Major Soils Percent
Area USDA Soil Texture
19.2
19.2
N/A
III
III
III
III
19.0
19.0
29.0
24.2
1) Hueco
2) Wink
1) Beaumont clay
2) Morey silt loam
1) Acuff loam, 0-1% slopes
2) Olton clay loam, 0-1% slopes
Reese Center, Acuff loam, 0-1% slopes
80-100 60-8590-100 85-10042-80 0.2-0.6
60-75
10-42 0.2-0.6 95-100 90-100 90-100 60-95
38-80 0.6-2.0 95-100 90-100 90-100
12-38 0.6-2.0 100 95-100 95-100 65-75Clay Loam, Sandy Clay Loam, LoamClay Loam, Sandy Clay Loam, Loam
Clay Loam, Silty Clay Loam, ClayClay Loam, Sandy Clay Loam, Loam
35
Table 3.1 Continued
4 10 40 200Pecos Stony Clay Loam 0-11 0.6-2.0 45-80 40-75 35-70 20-60 Ib
Unweathered Bedrock 11-30 N/A N/A N/A N/A N/A N/ASilty Clay Loam 0-32 0.6-2.0 95-100 95-100 90-100 70-95 III
Silty Clay Loam 0-8 0.6-2.0 95-100 95-100 90-100 70-95 III
Potter Loam 0-16 0.6-2 90-100 85-100 70-98 36-75 III
Clay Loam 0-12 0.6-2 95-100 95-100 80-95 40-75 III
Clay Loam 0-7 0.2-0.6 100 100 95-100 70-90 IIIClay, Silty Clay 7-54 <0.06 100 100 95-100 85-98 IVClay Loam, Clay, Silty Clay 54-80 0.06-0.2 95-100 90-100 80-100 75-95 III-IV
Tom Green Cobbly Clay 0-10 0.2-0.63 80-100 80-100 70-90 70-75 IVHard Limestone 10-12 0.2-0.63 80-100 80-100 70-90 70-75 IVClay Loam, Silty Clay 0-12 0.63-2 90-100 90-100 85-100 60-90 III-IVClay 12-28 0.2-0.63 90-100 90-100 85-100 70-93 IVSilty Clay Loam 28-58 0.63-2 60-100 60-100 60-100 50-90 IIIClay Loam 58-92 0.63-2 90-100 90-100 75-100 60-90 III
TCEQ Soil
ClassCounty Major Soils Percent
Area USDA Soil Texture Percentage Passing Sieve No.
III
III
85-100 65-95
8-66 0.6-2.0
III80-95 40-75
1) Tarrant association, hilly
2) Angelo clay loam, 0-1% slopes
18.6
16.2
1b) Veal-Paloduro association, undulating, Paloduro
8.62) Pullman Clay Loam, 0-1% slopes
9.6
12-80 0.6-2 95-100 95-100
80-100 40-80
14-60 0.6-2 85-100 80-100 65-100 35-80
6-14 0.6-2 85-100 80-100
2a) Reagan-Hodgins association, nearly level, Reagan2b) Reagan-Hodgins association, nearly level, Hodgins
15.095-100 95-100
Sandy Clay Loam, Clay Loam, Loam
1a) Veal-Paloduro association, undulating, Veal
Clay Loam, Sandy Clay Loam, Loam
95-100 95-100 85-100 65-96
32-60 0.6-2.0
1) Ector-Rock outcrop association, steep 16.8
Soil Depth (in)
Permeability (in/hr)
Loam, Clay Loam, Sandy Clay Loam
Silty Clay, Silty Clay Loam, Loam
Clay Loam, Silty Clay Loam,Silty Clay
III
III
36
Table 3.1 Continued
4 10 40 200Webb Clay 0-6 0.06-0.2 75-100 65-100 55-100 51-100 IV
Clay, Clay Loam 6-15 0.06-0.2 98-100 95-100 90-100 80-100 III-IVClay, Clay Loam 15-25 0.06-0.2 98-100 90-100 85-100 75-95 III-IVShaly Clay 25-60 <0.06 90-100 85-100 80-100 60-95 IVClay 0-10 <0.06 85-100 82-100 82-100 80-98 IVClay, Silty Clay 10-37 <0.06 85-100 82-100 82-100 80-98 IVClay, Silty Clay 37-60 <0.06 95-100 90-100 85-100 80-95 IVClay 0-12 <0.06 80-100 75-100 75-100 75-100 IVClay, Silty Clay 12-28 <0.06 80-100 75-100 75-100 75-100 IVClay, Silty Clay 28-60 <0.06 80-100 75-100 75-100 75-100 IV
Wharton 1) Lake Charles clay, 0-1% slopes 22.7 Clay 0-63 <0.06 100 100 98-100 90-98 IV
Fine Sandy Loam 0-15 0.63-2 100 100 100 45-55 IIClay 15-22 <0.06 100 100 100 60-80 IVSandy Clay 22-38 0.06-0.2 100 100 100 50-60 IIISandy Clay 38-62 0.06-0.2 100 100 100 50-55 III
County Major Soils Percent Area USDA Soil Texture Soil Depth
(in)Permeability
(in/hr)Percentage Passing Sieve No. TCEQ
Soil Class
13.3
1a) Maverick-Catarina complex, gently rolling, Maverick
1b) Maverick-Catarina complex, gently rolling, Catarina2) Montell clay, saline, 0-2% slopes 9.9
2) Crowley fine sandy loam
17.3

37
Figure 3.3 Contour Map of Average Annual Precipitation (source: NRCS 2002)
Spatial Analyst™ in ArcMap™ was used to create a contour map. The kriging method with the
software’s default parameters was used to contour the ET data. By converting this contour map
to a grid layer, the ET data were divided into five classes using natural breaks. The resulting
map is shown in Figure 3.4.
It is recognized that different values of average annual precipitation and potential ET can
be found with different datasets or estimation procedures. The precise absolute values are not as
important to this study as the variations across the state. Table 3.2 summarizes the values for
each county location for those readers interested in specific values of annual precipitation or
potential ET for the selected counties. The annual potential ET values calculated by Borrelli et

38
Figure 3.4 Contour Map of Potential Evapotranspiration
al. (1998) were converted to in/d for comparison with the net evaporation rates assigned for the
13 locations by the TCEQ (2001) guidance. The method used to calculate the net evaporation
value, known Ret in in/d, is not clear in the TCEQ (2001) guidance. The table heading in the
TCEQ (2001) manual states that net evaporation is evaporation minus precipitation, while the
footnote on the table states that a 20 percent runoff consideration was included.

39
Table 3.2 Annual Rainfall (Figure 3.3) and ET Estimates (Figure 3.4, TCEQ [2001])
Rainfall(in/yr) Annual (in) Daily (in/d) Annual (in) Daily (in/d)
Angelina 54 58.5 0.160 21.9 0.060Baylor 27 68.3 0.187 69.4 0.190Bexar 29 64.6 0.177 54.8 0.150Cameron 25 64.5 0.177 54.8 0.150Dallas 40 65.1 0.178 51.1 0.140El Paso 10 75.5 0.207 94.9 0.260Jefferson 56 56.2 0.154 14.6 0.040Lubbock 20 72.7 0.199 76.7 0.210Pecos 16 76.6 0.210 91.3 0.250Potter 19 75.2 0.206 76.7 0.210Tom Green 22 70.4 0.193 84.0 0.230Webb 22 67.4 0.185 65.7 0.180Wharton 42 60.3 0.165 36.5 0.100
CountyBorrelli et al. (1998) ET1 TCEQ (2001) Net Evap2
Note 1. Free-water ET estimate.
2. Net evap is evaporation minus rainfall, including “20% runoff consideration.”
3.4 Comparison of County Soil Types and ET and AB Conditions
One method of data analysis was to demonstrate the impact of the soil types described for
the selected counties on current guidance for AB and ET drainfield sizing. This exercise
indicated the uncertainties in the connection between TCEQ (2001) soil classification by grain-
size distribution and USDA textural descriptions. As seen in Table 3.1, the NRCS county soil
surveys include four columns of data on percent passing number 4, 10, 40, and 200 sieves. The
material that passes number 200 sieves includes both silt and clay. The relative amounts of silt
and clay have significant influence on both the actual permeability of the soil matrix and the
TCEQ (2001) soil classification. Hydrometer tests are required to separate the silt and clay
fractions, but these test results are not usually available in the soil surveys. If the soil percent
passing the 200 sieve is large, like the 40 percent or more for the Fuller fine sandy loam in
Angelina County (first line of Table 3.1), differing amounts of silt and clay percentage can still
lead to the same total of 40 percent, while giving different TCEQ (2001) soil classes. Increasing
the clay content moves the TCEQ soil class from II to III, which then changes the LTAR for
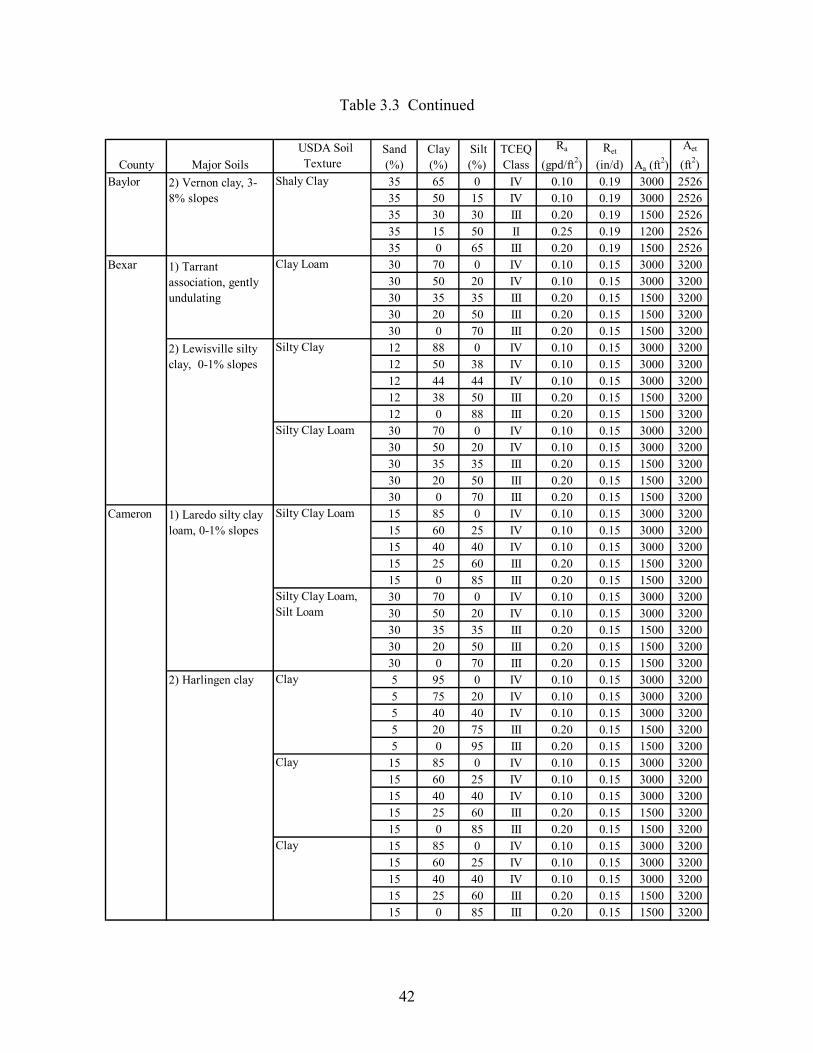
sizing of AB drainfields. Table 3.3 shows the results of this exercise for the major soil groups in
the thirteen counties. It is recognized that this same exercise could be performed for all the soils
40
in every county in Texas, but this procedure should be evaluated for its utility before considering
dozens of soils in 254 counties.
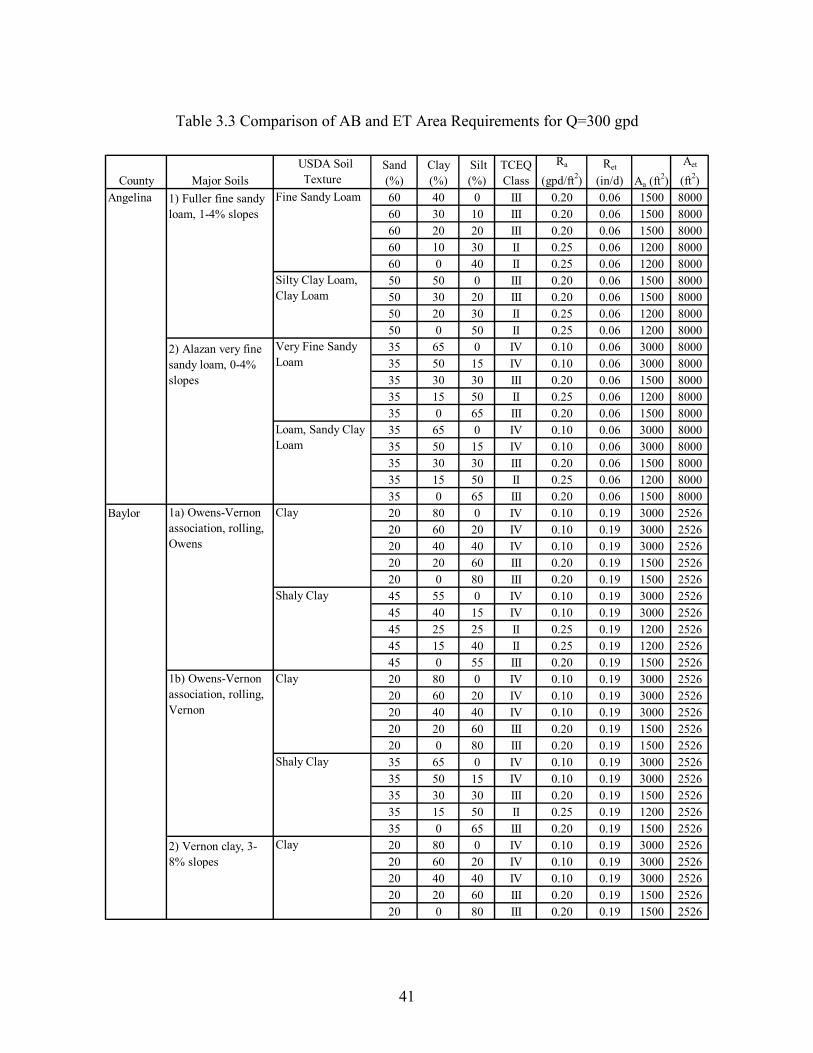
In Table 3.3, the TCEQ (2001) soil classes were identified so that the LTAR values, also
referred to as Ra in gpd/ft2, could be selected from Table 1. The area required for an absorption
drainfield, Aa, in ft2 was found by (TCEQ 2001)
a
a RQA = (3.1)
where Q = average daily sewage flow (gpd). For demonstration purposes, the calculations used a
Q of 300 gpd for a single-family, three-bedroom dwelling with less than 3,500 ft2 and no water-
saving devices (TCEQ 2001). For comparison, the area required for an ET drainfield, Aet in ft2,
was also found by (TCEQ 2001)
et
et RQA 6.1
= (3.2)
where Ret = net local evaporation rate (in/d). The net local evaporation rates were taken from
Table 3.2, which was based on Table VII in the TCEQ (2001) guidance, and are not affected by
soil type. The Ret values for Angelina, Baylor, and Wharton counties were not specified in Table
VII, so the missing values were interpolated from nearby counties for which the Ret values were
specified. Due to the simple nature of Equation 3.1, Aa is inversely proportional to Ra and
becomes smaller as the soils become coarser. Similarly, as Ret gets small, Aet gets large, such
that sites with clayey soils in the wetter parts of the state can require as much as 12,000 ft2 for
the example loading situation. For most of the soil types, at least two different TCEQ (2001) soil
classes are possible within the range of sand, silt, and clay combinations, which can increase Aa
by as much as 100 percent (III to IV). In some of the loamy soils, three different TCEQ (2001)
soil classes are possible, which can change the required Aa by as much as a factor of 2.5 (II to
IV).
The second type of data analysis was to compare different permeability estimates that can
be associated with the soil textural descriptions and grain-size distributions. The current TCEQ
(2001) guidance for LTAR values considers only Figure 3.2. Figure 3.2 includes both
sand/silt/clay percentages and textural descriptors that can be taken from NRCS county soil
41
Table 3.3 Comparison of AB and ET Area Requirements for Q=300 gpd
County Major Soils USDA Soil
TextureSand (%)
Clay (%)
Silt (%)
TCEQ Class
Ra
(gpd/ft2)Ret
(in/d) Aa (ft2)
Aet
(ft2)Angelina Fine Sandy Loam 60 40 0 III 0.20 0.06 1500 8000
60 30 10 III 0.20 0.06 1500 800060 20 20 III 0.20 0.06 1500 800060 10 30 II 0.25 0.06 1200 800060 0 40 II 0.25 0.06 1200 800050 50 0 III 0.20 0.06 1500 800050 30 20 III 0.20 0.06 1500 800050 20 30 II 0.25 0.06 1200 800050 0 50 II 0.25 0.06 1200 800035 65 0 IV 0.10 0.06 3000 800035 50 15 IV 0.10 0.06 3000 800035 30 30 III 0.20 0.06 1500 800035 15 50 II 0.25 0.06 1200 800035 0 65 III 0.20 0.06 1500 800035 65 0 IV 0.10 0.06 3000 800035 50 15 IV 0.10 0.06 3000 800035 30 30 III 0.20 0.06 1500 800035 15 50 II 0.25 0.06 1200 800035 0 65 III 0.20 0.06 1500 8000
Baylor Clay 20 80 0 IV 0.10 0.19 3000 252620 60 20 IV 0.10 0.19 3000 252620 40 40 IV 0.10 0.19 3000 252620 20 60 III 0.20 0.19 1500 252620 0 80 III 0.20 0.19 1500 2526
Shaly Clay 45 55 0 IV 0.10 0.19 3000 252645 40 15 IV 0.10 0.19 3000 252645 25 25 II 0.25 0.19 1200 252645 15 40 II 0.25 0.19 1200 252645 0 55 III 0.20 0.19 1500 2526
Clay 20 80 0 IV 0.10 0.19 3000 252620 60 20 IV 0.10 0.19 3000 252620 40 40 IV 0.10 0.19 3000 252620 20 60 III 0.20 0.19 1500 252620 0 80 III 0.20 0.19 1500 2526
Shaly Clay 35 65 0 IV 0.10 0.19 3000 252635 50 15 IV 0.10 0.19 3000 252635 30 30 III 0.20 0.19 1500 252635 15 50 II 0.25 0.19 1200 252635 0 65 III 0.20 0.19 1500 2526
Clay 20 80 0 IV 0.10 0.19 3000 252620 60 20 IV 0.10 0.19 3000 252620 40 40 IV 0.10 0.19 3000 252620 20 60 III 0.20 0.19 1500 252620 0 80 III 0.20 0.19 1500 2526
1a) Owens-Vernon association, rolling, Owens
1b) Owens-Vernon association, rolling, Vernon
2) Vernon clay, 3-8% slopes
1) Fuller fine sandy loam, 1-4% slopes
2) Alazan very fine sandy loam, 0-4% slopes
Silty Clay Loam, Clay Loam
Very Fine Sandy Loam
Loam, Sandy Clay Loam
42
Table 3.3 Continued
County Major Soils USDA Soil
TextureSand (%)
Clay (%)
Silt (%)
TCEQ Class
Ra
(gpd/ft2)Ret
(in/d) Aa (ft2)
Aet
(ft2)Baylor Shaly Clay 35 65 0 IV 0.10 0.19 3000 2526
35 50 15 IV 0.10 0.19 3000 252635 30 30 III 0.20 0.19 1500 252635 15 50 II 0.25 0.19 1200 252635 0 65 III 0.20 0.19 1500 2526
Bexar Clay Loam 30 70 0 IV 0.10 0.15 3000 320030 50 20 IV 0.10 0.15 3000 320030 35 35 III 0.20 0.15 1500 320030 20 50 III 0.20 0.15 1500 320030 0 70 III 0.20 0.15 1500 3200
Silty Clay 12 88 0 IV 0.10 0.15 3000 320012 50 38 IV 0.10 0.15 3000 320012 44 44 IV 0.10 0.15 3000 320012 38 50 III 0.20 0.15 1500 320012 0 88 III 0.20 0.15 1500 3200
Silty Clay Loam 30 70 0 IV 0.10 0.15 3000 320030 50 20 IV 0.10 0.15 3000 320030 35 35 III 0.20 0.15 1500 320030 20 50 III 0.20 0.15 1500 320030 0 70 III 0.20 0.15 1500 3200
Cameron Silty Clay Loam 15 85 0 IV 0.10 0.15 3000 320015 60 25 IV 0.10 0.15 3000 320015 40 40 IV 0.10 0.15 3000 320015 25 60 III 0.20 0.15 1500 320015 0 85 III 0.20 0.15 1500 320030 70 0 IV 0.10 0.15 3000 320030 50 20 IV 0.10 0.15 3000 320030 35 35 III 0.20 0.15 1500 320030 20 50 III 0.20 0.15 1500 320030 0 70 III 0.20 0.15 1500 3200
2) Harlingen clay Clay 5 95 0 IV 0.10 0.15 3000 32005 75 20 IV 0.10 0.15 3000 32005 40 40 IV 0.10 0.15 3000 32005 20 75 III 0.20 0.15 1500 32005 0 95 III 0.20 0.15 1500 3200
Clay 15 85 0 IV 0.10 0.15 3000 320015 60 25 IV 0.10 0.15 3000 320015 40 40 IV 0.10 0.15 3000 320015 25 60 III 0.20 0.15 1500 320015 0 85 III 0.20 0.15 1500 3200
Clay 15 85 0 IV 0.10 0.15 3000 320015 60 25 IV 0.10 0.15 3000 320015 40 40 IV 0.10 0.15 3000 320015 25 60 III 0.20 0.15 1500 320015 0 85 III 0.20 0.15 1500 3200
Silty Clay Loam, Silt Loam
2) Lewisville silty clay, 0-1% slopes
1) Laredo silty clay loam, 0-1% slopes
2) Vernon clay, 3-8% slopes
1) Tarrant association, gently undulating

43
Table 3.3 Continued
County Major Soils USDA Soil
TextureSand (%)
Clay (%)
Silt (%)
TCEQ Class
Ra
(gpd/ft2)Ret
(in/d) Aa (ft2)
Aet
(ft2)Dallas Clay 15 85 0 IV 0.10 0.14 3000 3429
15 60 25 IV 0.10 0.14 3000 342915 40 40 IV 0.10 0.14 3000 342915 25 60 III 0.20 0.14 1500 342915 0 85 III 0.20 0.14 1500 3429
Clay, Silty Clay 15 85 0 IV 0.10 0.14 3000 342915 60 25 IV 0.10 0.14 3000 342915 40 40 IV 0.10 0.14 3000 342915 25 60 III 0.20 0.14 1500 342915 0 85 III 0.20 0.14 1500 3429
Clay 15 85 0 IV 0.10 0.14 3000 342915 60 25 IV 0.10 0.14 3000 342915 40 40 IV 0.10 0.14 3000 342915 25 60 III 0.20 0.14 1500 342915 0 85 III 0.20 0.14 1500 3429
Clay, Silty Clay 15 85 0 IV 0.10 0.14 3000 342915 60 25 IV 0.10 0.14 3000 342915 40 40 IV 0.10 0.14 3000 342915 25 60 III 0.20 0.14 1500 342915 0 85 III 0.20 0.14 1500 3429
El Paso 1) Hueco Loamy Fine Sand 90 10 0 Ib 0.38 0.26 789 184690 5 5 Ib 0.38 0.26 789 184690 0 10 Ib 0.38 0.26 789 1846
Fine Sandy Loam 85 15 0 Ib 0.38 0.26 789 184685 10 5 Ib 0.38 0.26 789 184685 5 10 Ib 0.38 0.26 789 184685 0 15 Ib 0.38 0.26 789 1846
2) Wink Fine Sandy Loam 80 20 0 II 0.25 0.26 1200 184680 10 10 Ib 0.38 0.26 789 184680 0 20 Ib 0.38 0.26 789 1846
Gravelly Loam 75 25 0 II 0.25 0.26 1200 184675 15 10 II 0.25 0.26 1200 184675 10 15 II 0.25 0.26 1200 184675 0 25 Ib 0.38 0.26 789 1846
Jefferson 1) Beaumont clay Clay 45 55 0 IV 0.10 0.04 3000 1200045 40 15 IV 0.10 0.04 3000 1200045 25 25 II 0.25 0.04 1200 1200045 15 40 II 0.25 0.04 1200 1200045 0 55 III 0.20 0.04 1500 12000
Clay 35 65 0 IV 0.10 0.04 3000 1200035 50 15 IV 0.10 0.04 3000 1200035 30 30 III 0.20 0.04 1500 1200035 15 50 II 0.25 0.04 1200 1200035 0 65 III 0.20 0.04 1500 12000
1) Houston Black-urban land complex, 0-4% slopes
2) Houston Black clay, 1-3% slopes

44
Table 3.3 Continued
County Major Soils USDA Soil
TextureSand (%)
Clay (%)
Silt (%)
TCEQ Class
Ra
(gpd/ft2)Ret
(in/d) Aa (ft2)
Aet
(ft2)Jefferson 1) Beaumont clay Clay 20 80 0 IV 0.10 0.04 3000 12000
20 60 20 IV 0.10 0.04 3000 1200020 40 40 IV 0.10 0.04 3000 1200020 20 60 III 0.20 0.04 1500 1200020 0 80 III 0.20 0.04 1500 12000
2) Morey silt loam Silt Loam 30 70 0 IV 0.10 0.04 3000 1200030 50 20 IV 0.10 0.04 3000 1200030 35 35 III 0.20 0.04 1500 1200030 20 50 III 0.20 0.04 1500 1200030 0 70 III 0.20 0.04 1500 12000
Silty Clay 30 70 0 IV 0.10 0.04 3000 1200030 50 20 IV 0.10 0.04 3000 1200030 35 35 III 0.20 0.04 1500 1200030 20 50 III 0.20 0.04 1500 1200030 0 70 III 0.20 0.04 1500 12000
Silty Clay Loam 40 60 0 IV 0.10 0.04 3000 1200040 45 15 IV 0.10 0.04 3000 1200040 30 30 III 0.20 0.04 1500 1200040 15 45 II 0.25 0.04 1200 1200040 0 60 III 0.20 0.04 1500 12000
Lubbock Loam 50 50 0 III 0.20 0.21 1500 228650 30 20 III 0.20 0.21 1500 228650 20 30 II 0.25 0.21 1200 228650 0 50 II 0.25 0.21 1200 228635 65 0 IV 0.10 0.21 3000 228635 50 15 IV 0.10 0.21 3000 228635 30 30 III 0.20 0.21 1500 228635 15 50 II 0.25 0.21 1200 228635 0 65 III 0.20 0.21 1500 228640 60 0 IV 0.10 0.21 3000 228640 45 15 IV 0.10 0.21 3000 228640 30 30 III 0.20 0.21 1500 228640 15 45 II 0.25 0.21 1200 228640 0 60 III 0.20 0.21 1500 2286
Clay Loam 45 55 0 IV 0.10 0.21 3000 228645 40 15 IV 0.10 0.21 3000 228645 25 25 II 0.25 0.21 1200 228645 15 40 II 0.25 0.21 1200 228645 0 55 III 0.20 0.21 1500 228640 60 0 IV 0.10 0.21 3000 228640 45 15 IV 0.10 0.21 3000 228640 30 30 III 0.20 0.21 1500 228640 15 45 II 0.25 0.21 1200 228640 0 60 III 0.20 0.21 1500 2286
Clay Loam, Sandy Clay Loam, Loam
Clay Loam, Sandy Clay Loam, Loam
1) Acuff loam, 0-1% slopes
Clay Loam, Silty Clay Loam, Clay
2) Olton clay loam, 0-1% slopes

45
Table 3.3 Continued
County Major Soils USDA Soil
TextureSand (%)
Clay (%)
Silt (%)
TCEQ Class
Ra
(gpd/ft2)Ret
(in/d) Aa (ft2)
Aet
(ft2)Lubbock 40 60 0 IV 0.10 0.21 3000 2286
40 45 15 IV 0.10 0.21 3000 228640 30 30 III 0.20 0.21 1500 228640 15 45 II 0.25 0.21 1200 228640 0 60 III 0.20 0.21 1500 228657 22 21 III 0.20 0.21 1500 228661 20 19 II-III 0.23 0.21 1333 228678 11 11 II 0.25 0.21 1200 2286
Pecos Stony Clay Loam 80 20 0 II 0.25 0.25 1200 192080 10 10 Ib 0.38 0.25 789 192080 0 20 Ib 0.38 0.25 789 1920
Silty Clay Loam 30 70 0 IV 0.10 0.25 3000 192030 50 20 IV 0.10 0.25 3000 192030 35 35 III 0.20 0.25 1500 192030 20 50 III 0.20 0.25 1500 192030 0 70 III 0.20 0.25 1500 192035 65 0 IV 0.10 0.25 3000 192035 50 15 IV 0.10 0.25 3000 192035 30 30 III 0.20 0.25 1500 192035 15 50 II 0.25 0.25 1200 192035 0 65 III 0.20 0.25 1500 1920
Silty Clay Loam 30 70 0 IV 0.10 0.25 3000 192030 50 20 IV 0.10 0.25 3000 192030 35 35 III 0.20 0.25 1500 192030 20 50 III 0.20 0.25 1500 192030 0 70 III 0.20 0.25 1500 192035 65 0 IV 0.10 0.25 3000 192035 50 15 IV 0.10 0.25 3000 192035 30 30 III 0.20 0.25 1500 192035 15 50 II 0.25 0.25 1200 192035 0 65 III 0.20 0.25 1500 1920
Potter Loam 60 40 0 III 0.20 0.21 1500 228660 30 10 III 0.20 0.21 1500 228660 20 20 III 0.20 0.21 1500 228660 10 30 II 0.25 0.21 1200 228660 0 40 II 0.25 0.21 1200 2286
Sandy Clay 60 40 0 III 0.20 0.21 1500 228660 30 10 III 0.20 0.21 1500 228660 20 20 III 0.20 0.21 1500 228660 10 30 II 0.25 0.21 1200 228660 0 40 II 0.25 0.21 1200 228660 40 0 III 0.20 0.21 1500 228660 30 10 III 0.20 0.21 1500 228660 20 20 III 0.20 0.21 1500 228660 10 30 II 0.25 0.21 1200 228660 0 40 II 0.25 0.21 1200 2286
Silty Clay, Silty Clay Loam, Loam
Clay Loam, Sandy Clay Loam, Loam
Clay Loam, Silty Clay Loam, Silty Clay
2b) Reagan-Hodgins association, nearly level, Hodgins
1a) Veal-Paloduro association, undulating, Veal
1) Ector-Rock outcrop association, steep2a) Reagan-Hodgins association, nearly level, Reagan
2b) Reagan-Hodgins association, nearly level, Hodgins
2) Olton clay loam, 0-1% slopes
Clay Loam, Sandy Clay Loam, Loam
Reese Center, Acuff loam, 0-1% slopes

46
Table 3.3 Continued
County Major Soils USDA Soil
TextureSand (%)
Clay (%)
Silt (%)
TCEQ Class
Ra
(gpd/ft2)Ret
(in/d) Aa (ft2)
Aet
(ft2)Potter Clay Loam 60 40 0 III 0.20 0.21 1500 2286
60 30 10 III 0.20 0.21 1500 228660 20 20 III 0.20 0.21 1500 228660 10 30 II 0.25 0.21 1200 228660 0 40 II 0.25 0.21 1200 228660 40 0 III 0.20 0.21 1500 228660 30 10 III 0.20 0.21 1500 228660 20 20 III 0.20 0.21 1500 228660 10 30 II 0.25 0.21 1200 228660 0 40 II 0.25 0.21 1200 2286
Clay Loam 30 70 0 IV 0.10 0.21 3000 228630 50 20 IV 0.10 0.21 3000 228630 35 35 III 0.20 0.21 1500 228630 20 50 III 0.20 0.21 1500 228630 0 70 III 0.20 0.21 1500 2286
Clay, Silty Clay 15 85 0 IV 0.10 0.21 3000 228615 60 25 IV 0.10 0.21 3000 228615 40 40 IV 0.10 0.21 3000 228615 25 60 III 0.20 0.21 1500 228615 0 85 III 0.20 0.21 1500 228625 75 0 IV 0.10 0.21 3000 228625 45 30 IV 0.10 0.21 3000 228625 30 45 III 0.20 0.21 1500 228625 0 75 III 0.20 0.21 1500 2286
Tom Green Cobbly Clay 25 75 0 IV 0.10 0.23 3000 208725 45 30 IV 0.10 0.23 3000 208725 30 45 III 0.20 0.23 1500 208725 0 75 III 0.20 0.23 1500 2087
Hard Limestone 25 75 0 IV 0.10 0.23 3000 208725 45 30 IV 0.10 0.23 3000 208725 30 45 III 0.20 0.23 1500 208725 0 75 III 0.20 0.23 1500 2087
Clay Loam, Silty 40 60 0 IV 0.10 0.23 3000 208740 45 15 IV 0.10 0.23 3000 208740 30 30 III 0.20 0.23 1500 208740 15 45 II 0.25 0.23 1200 208740 0 60 III 0.20 0.23 1500 2087
Clay 30 70 0 IV 0.10 0.23 3000 208730 50 20 IV 0.10 0.23 3000 208730 35 35 III 0.20 0.23 1500 208730 20 50 III 0.20 0.23 1500 208730 0 70 III 0.20 0.23 1500 2087
Silty Clay Loam 50 50 0 III 0.20 0.23 1500 208750 30 20 III 0.20 0.23 1500 208750 20 30 II 0.25 0.23 1200 208750 0 50 II 0.25 0.23 1200 2087
2) Pullman clay loam, 0-1% slopes
Loam, Clay Loam, Sandy Clay Loam
1b) Veal-Paloduro association, undulating, Paloduro
1) Tarrant association, hilly
2) Angelo clay loam, 0-1% slopes
Clay Loam, Clay, Silty Clay
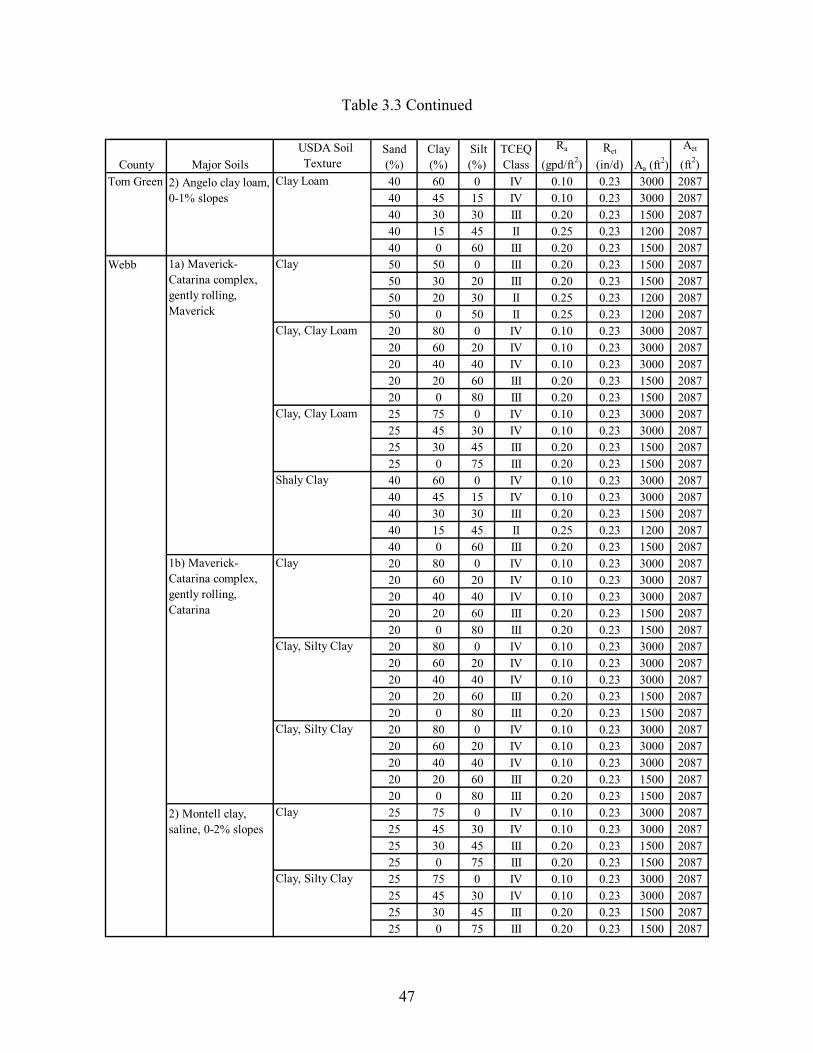
47
Table 3.3 Continued
County Major Soils USDA Soil
TextureSand (%)
Clay (%)
Silt (%)
TCEQ Class
Ra
(gpd/ft2)Ret
(in/d) Aa (ft2)
Aet
(ft2)Tom Green Clay Loam 40 60 0 IV 0.10 0.23 3000 2087
40 45 15 IV 0.10 0.23 3000 208740 30 30 III 0.20 0.23 1500 208740 15 45 II 0.25 0.23 1200 208740 0 60 III 0.20 0.23 1500 2087
Webb Clay 50 50 0 III 0.20 0.23 1500 208750 30 20 III 0.20 0.23 1500 208750 20 30 II 0.25 0.23 1200 208750 0 50 II 0.25 0.23 1200 2087
Clay, Clay Loam 20 80 0 IV 0.10 0.23 3000 208720 60 20 IV 0.10 0.23 3000 208720 40 40 IV 0.10 0.23 3000 208720 20 60 III 0.20 0.23 1500 208720 0 80 III 0.20 0.23 1500 2087
Clay, Clay Loam 25 75 0 IV 0.10 0.23 3000 208725 45 30 IV 0.10 0.23 3000 208725 30 45 III 0.20 0.23 1500 208725 0 75 III 0.20 0.23 1500 2087
Shaly Clay 40 60 0 IV 0.10 0.23 3000 208740 45 15 IV 0.10 0.23 3000 208740 30 30 III 0.20 0.23 1500 208740 15 45 II 0.25 0.23 1200 208740 0 60 III 0.20 0.23 1500 2087
Clay 20 80 0 IV 0.10 0.23 3000 208720 60 20 IV 0.10 0.23 3000 208720 40 40 IV 0.10 0.23 3000 208720 20 60 III 0.20 0.23 1500 208720 0 80 III 0.20 0.23 1500 2087
Clay, Silty Clay 20 80 0 IV 0.10 0.23 3000 208720 60 20 IV 0.10 0.23 3000 208720 40 40 IV 0.10 0.23 3000 208720 20 60 III 0.20 0.23 1500 208720 0 80 III 0.20 0.23 1500 2087
Clay, Silty Clay 20 80 0 IV 0.10 0.23 3000 208720 60 20 IV 0.10 0.23 3000 208720 40 40 IV 0.10 0.23 3000 208720 20 60 III 0.20 0.23 1500 208720 0 80 III 0.20 0.23 1500 2087
Clay 25 75 0 IV 0.10 0.23 3000 208725 45 30 IV 0.10 0.23 3000 208725 30 45 III 0.20 0.23 1500 208725 0 75 III 0.20 0.23 1500 2087
Clay, Silty Clay 25 75 0 IV 0.10 0.23 3000 208725 45 30 IV 0.10 0.23 3000 208725 30 45 III 0.20 0.23 1500 208725 0 75 III 0.20 0.23 1500 2087
2) Angelo clay loam, 0-1% slopes
2) Montell clay, saline, 0-2% slopes
1b) Maverick-Catarina complex, gently rolling, Catarina
1a) Maverick-Catarina complex, gently rolling, Maverick
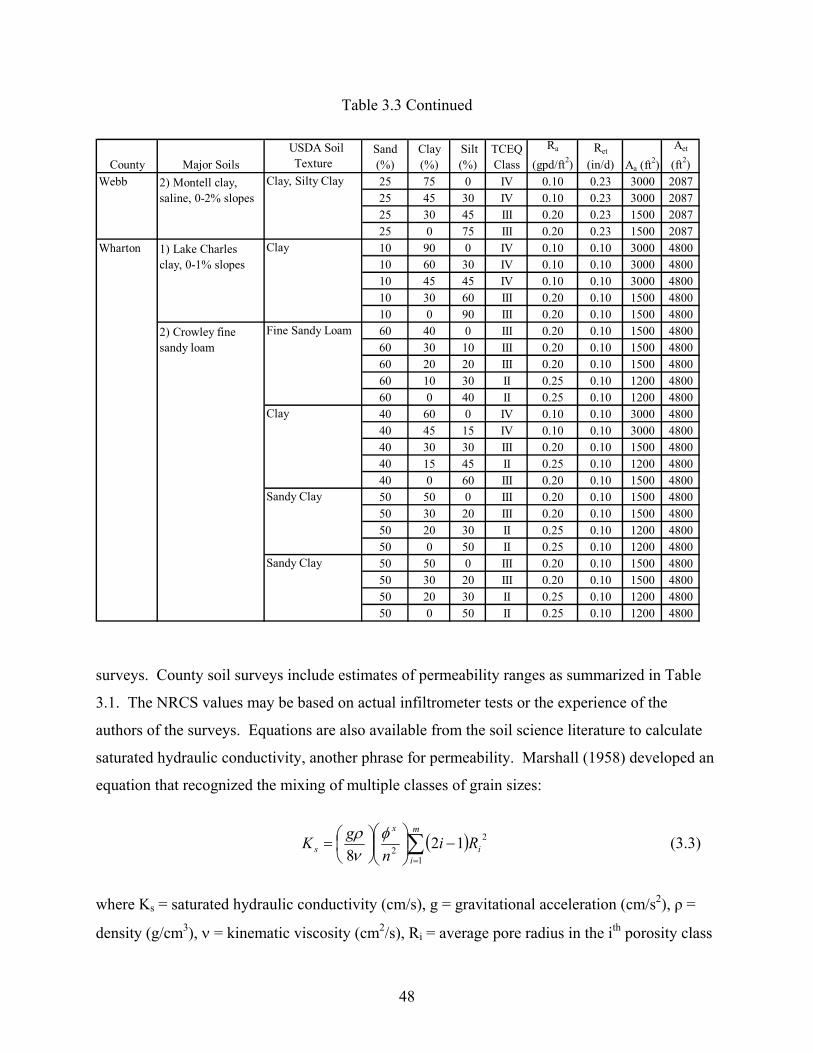
48
Table 3.3 Continued
County Major Soils USDA Soil
TextureSand (%)
Clay (%)
Silt (%)
TCEQ Class
Ra
(gpd/ft2)Ret
(in/d) Aa (ft2)
Aet
(ft2)Webb Clay, Silty Clay 25 75 0 IV 0.10 0.23 3000 2087
25 45 30 IV 0.10 0.23 3000 208725 30 45 III 0.20 0.23 1500 208725 0 75 III 0.20 0.23 1500 2087
Wharton Clay 10 90 0 IV 0.10 0.10 3000 480010 60 30 IV 0.10 0.10 3000 480010 45 45 IV 0.10 0.10 3000 480010 30 60 III 0.20 0.10 1500 480010 0 90 III 0.20 0.10 1500 4800
Fine Sandy Loam 60 40 0 III 0.20 0.10 1500 480060 30 10 III 0.20 0.10 1500 480060 20 20 III 0.20 0.10 1500 480060 10 30 II 0.25 0.10 1200 480060 0 40 II 0.25 0.10 1200 4800
Clay 40 60 0 IV 0.10 0.10 3000 480040 45 15 IV 0.10 0.10 3000 480040 30 30 III 0.20 0.10 1500 480040 15 45 II 0.25 0.10 1200 480040 0 60 III 0.20 0.10 1500 4800
Sandy Clay 50 50 0 III 0.20 0.10 1500 480050 30 20 III 0.20 0.10 1500 480050 20 30 II 0.25 0.10 1200 480050 0 50 II 0.25 0.10 1200 4800
Sandy Clay 50 50 0 III 0.20 0.10 1500 480050 30 20 III 0.20 0.10 1500 480050 20 30 II 0.25 0.10 1200 480050 0 50 II 0.25 0.10 1200 4800
1) Lake Charles clay, 0-1% slopes
2) Crowley fine sandy loam
2) Montell clay, saline, 0-2% slopes
surveys. County soil surveys include estimates of permeability ranges as summarized in Table
3.1. The NRCS values may be based on actual infiltrometer tests or the experience of the
authors of the surveys. Equations are also available from the soil science literature to calculate
saturated hydraulic conductivity, another phrase for permeability. Marshall (1958) developed an
equation that recognized the mixing of multiple classes of grain sizes:
( )∑=
−
=
m
ii
x
s Rin
gK1
22 12
8φ
νρ (3.3)
where Ks = saturated hydraulic conductivity (cm/s), g = gravitational acceleration (cm/s2), ρ =
density (g/cm3), ν = kinematic viscosity (cm2/s), Ri = average pore radius in the ith porosity class
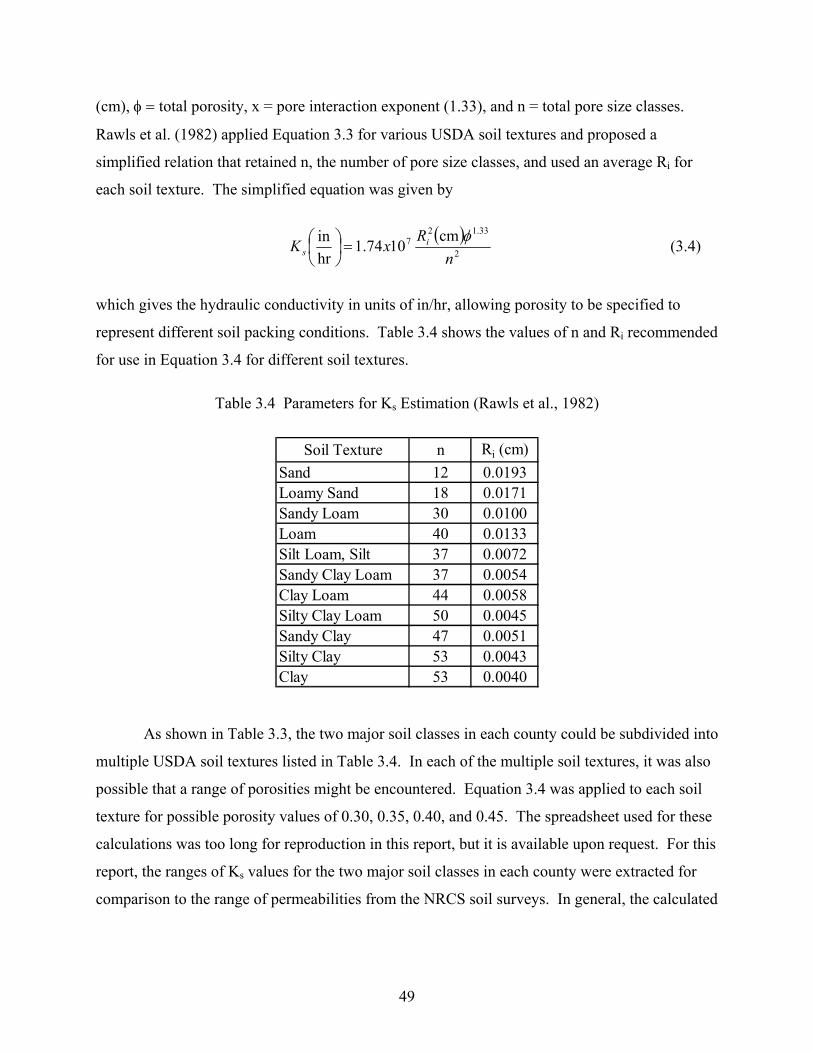
49
(cm), φ = total porosity, x = pore interaction exponent (1.33), and n = total pore size classes.
Rawls et al. (1982) applied Equation 3.3 for various USDA soil textures and proposed a
simplified relation that retained n, the number of pore size classes, and used an average Ri for
each soil texture. The simplified equation was given by
( )2
33.127 cm1074.1
hrin
nRxK i
sφ
=
(3.4)
which gives the hydraulic conductivity in units of in/hr, allowing porosity to be specified to
represent different soil packing conditions. Table 3.4 shows the values of n and Ri recommended
for use in Equation 3.4 for different soil textures.
Table 3.4 Parameters for Ks Estimation (Rawls et al., 1982)
Soil Texture n Ri (cm)Sand 12 0.0193Loamy Sand 18 0.0171Sandy Loam 30 0.0100Loam 40 0.0133Silt Loam, Silt 37 0.0072Sandy Clay Loam 37 0.0054Clay Loam 44 0.0058Silty Clay Loam 50 0.0045Sandy Clay 47 0.0051Silty Clay 53 0.0043Clay 53 0.0040
As shown in Table 3.3, the two major soil classes in each county could be subdivided into
multiple USDA soil textures listed in Table 3.4. In each of the multiple soil textures, it was also
possible that a range of porosities might be encountered. Equation 3.4 was applied to each soil
texture for possible porosity values of 0.30, 0.35, 0.40, and 0.45. The spreadsheet used for these
calculations was too long for reproduction in this report, but it is available upon request. For this
report, the ranges of Ks values for the two major soil classes in each county were extracted for
comparison to the range of permeabilities from the NRCS soil surveys. In general, the calculated
50
Ks and NRCS permeability ranges were similar. The ranges of values are shown in Tables 3.5,
3.6, and 3.7.
3.5 Comparison of Selected Counties with TTUWRC Test Site Conditions
As stated previously, the fourth task was to determine if the findings of the ETA
drainfield tests at the TTUWRC Reese Center site in Lubbock County could be applied at other
locations around the state. The field tests at Reese Center were conducted to establish the
hydraulic capacity of ETA trenches in the TCEQ (2001) type II and III soils at that site. Those
tests showed that the hydraulic capacity of ETA trenches under these conditions was over four
times the LTAR loading capacities for AB trenches for type II and III soils. The conclusion from
these field tests was that the large observed loading capacity was due to the ET losses that occur
above and adjacent to the trench, as lateral and upward movement of septic effluent was
apparently greater than downward infiltration. The combination of relatively coarse soils with
the high ET, low precipitation conditions in Lubbock County all contribute to the loading
capacity.
Based on these findings, the soil and hydrologic conditions in the twelve other counties were
compared to those in Lubbock County. Locations with similar permeable soils and high ET/low
rainfall likely have similar ETA loading capacities to that seen in Lubbock County. Locations
with low permeability soils will not have much potential for increased loading capacity for ETA
systems. Also, locations with low ET and or high rainfall conditions will not support high ETA
system performance. It was noted that the data from the thirteen counties appeared to fall into
three categories: [A] high ET/low rainfall conditions with permeable soils, [B] medium ET/high
to medium rainfall conditions, perhaps with low permeability soils, and [C] low ET/high rainfall
conditions with low permeability soils. Tables 3.5, 3.6, and 3.7 break the county/soil
combinations into these three categories. Category A locations should be appropriate for the
same ETA loading guidance as Lubbock County. The current recommendation in this report is
to allow ETA systems in type II and III soils with low groundwater tables to be up to twice the
LTARs allowed for AB systems. Category C locations do not have proper conditions to justify
greater loading rates for ETA systems. Category B locations could be amenable to somewhat
higher loading rates for ETA systems, but will not have as large a “factor of safety” as the
category A locations.
As shown in Table 3.5, all five Category A county/soil combinations have annual ET

51
Table 3.5 Class A County/Soil Combinations NRCS Permeability
(in/hr) Calculated Hydraulic Conductivity (in/hr) County
Calculated Annual ET (in)
Annual Rainfall (in/yr)
County Soil Survey Descriptions
low high low high Hueco 2 6.3 0.39 15.5
El Paso 75.5 10 Wink 0.63 2 0.07 5.42 Acuff loam, 0-1% slopes 0.6 2 0.02 0.67
Lubbock 72.7 20 Olton clay loam, 0-1% slopes 0.2 2 0.02 0.67
Ector-Rock outcrop association, steep 0.6 2 0.39 5.42
Pecos 76.6 16 Reagan-Hodgins association, nearly level 0.6 2 0.02 0.67
Veal-Paloduro association, undulating 0.6 2 0.04 1.09
Potter 75.2 19 Pullman clay loam, 0-1% slopes <0.06 0.6 0.02 0.66
Tarrant association, hilly 0.2 0.63 0.02 0.23 Tom Green 70.4 22 Angelo clay loam, 0-1%
slopes 0.2 2 0.02 0.67
Table 3.6 Class B County/Soil Combinations NRCS Permeability
(in/hr) Calculated Hydraulic Conductivity (in/hr) County
Calculated Annual ET (in)
Annual Rainfall (in/yr)
County Soil Survey Descriptions
low high low high Tarrant association, gently undulating 1.0 1.2 0.02 0.66
Bexar 64.6 29 Lewisville silty clay, 0-1% slopes 1.0 1.2 0.02 0.66
Laredo silty clay loam, 0-1% slopes 0.63 2 0.02 0.66
Cameron 64.5 25 Harlingen clay <0.06 <0.06 0.02 0.23 Maverick-Catarina complex, gently rolling <0.06 0.2 0.02 0.67
Webb 67.4 22 Montell clay, saline, 0-2% slopes <0.06 <0.06 0.02 0.23
depths greater than 70 in and annual rainfall depths of 22 in or less (rainfall depth less than one-
third of calculated ET depth). The two most prominent soil types in each county tend to be
TCEQ (2001) type II and III with “high-end” permeabilities on the order of 0.6 in/hr and higher.
All five counties are in the western third of the state. The western third of the state could be
identified by the area with ET of at least 70 in/yr, from about Tom Green County west on the ET
map in Figure 3.4. It should be noted that locations with low permeability, type IV soils in this
area would not be appropriate sites for ETA systems.

52
Table 3.7 Class C County/Soil Combinations NRCS Permeability
(in/hr) Calculated Hydraulic Conductivity (in/hr) County
Calculated Annual ET (in)
Annual Rainfall (in/yr)
County Soil Survey Descriptions
low high low high Fuller fine sandy loam, 1-4% slopes <0.06 2 0.04 0.67
Angelina 58.5 54 Alazan very fine sandy loam, 0-4% slopes 0.6 2 0.02 0.67
Owens-Vernon association, rolling <0.06 <0.06 0.02 0.67
Baylor 68.3 27 Vernon clay, 3-8% slopes <0.06 <0.06 0.02 0.67 Houston Black-urban land complex, 0-4% slopes <0.06 <0.06 0.02 0.23
Dallas 65.1 40 Houston Black clay, 1-3% slopes <0.06 <0.06 0.02 0.23
Beaumont clay <0.06 0.2 0.02 0.67 Jefferson 56.2 56
Morey silt loam <0.06 0.8 0.02 0.67 Lake Charles clay, 0-1% slopes <0.06 <0.06 0.02 0.23
Wharton 60.3 42 Crowley fine sandy loam <0.06 2 0.02 0.67
The Class C county/soil combinations shown in Table 3.7 include four (Angelina, Dallas,
Jefferson, and Wharton) that have annual rainfall depths that are greater than 60 percent of
annual calculated ET. All five have soil descriptions that include large clay fractions, leading to
small “low-end” permeabilities. The low ET/high rainfall area in the eastern quarter of the state
could be approximated by the 40-in rainfall contour on the annual precipitation map in Figure
3.3. This area has enough annual precipitation to seriously impede ETA system capacity, even at
locations with type II or III soils. The Baylor county/soil combination has lower annual rainfall,
but the two prominent soils have relatively low permeabilities as compared to the Category A
combinations. The Class C county/soil combinations do not warrant larger LTAR values for
ETA drainfields.
The three Class B county/soil combinations shown in Table 3.6 lie between the Category
A and C conditions. The Webb County combination has medium ET/low rainfall with low
permeability soils, while the Bexar and Cameron combinations have medium ET/medium
rainfall with lower to medium permeability soils. These intermediate conditions do not provide
as strong justification for larger ETA LTAR values as seen in the Category A combinations.
Recent studies by Reed et al. (2001, 2002) indicated that the most reported reason for
septic system drainfield failures in Texas was improper soil conditions. Most often, tightly

53
packed clay soils prevent proper leaching of wastewater effluent from the trenches. For effective
utilization of ETA trenches, soils should be classified as type II or III with vegetative cover that
maximizes ET, such as turfgrass.

54
4. Conclusions and Recommendations for ETA Trench LTARs
The primary objectives of this Phase II project were to (1) perform additional field
experiments for hydraulic loading capacity of ETA trenches and (2) determine the potential for
extrapolating the results from the Lubbock County site to other locations in Texas based on local
soil and hydrologic conditions. The combination of the field observations and the hydrologic
study provide sufficient evidence to recommend guidance for ETA trench LTAR values in
locations with similar soil and hydrologic situations as those found at the field site. The resulting
conclusions and recommendations can be stated as follows.
• The Phase II field experimental results for six ETA trenches receiving artificial
wastewater were similar to those seen in the Phase I experiments with three ETA
trenches. Average hydraulic loading rates for the last twelve months of the field tests
were approximately 1.0 gpd/ft2 in both experiments. Addition of cooking oil to the
artificial wastewater mix did not affect the loading rates.
• The combination of type II and III soils with annual ET ≥ 70 in and annual rainfall ≤ 22
represent the conditions at the Reese Center test site in Lubbock County and the western
third of Texas. Recommended ETA loading rates are 0.50 gpd/ft2 for type II soils and
0.40 gpd/ft2 for type III soils in these locations, double the guidance for AB trenches but
still allowing a hydraulic factor of safety of about 2. If that recommendation appears too
risky, the ETA loading rates could be set at 0.38 gpd/ft2 for type II soils and 0.30 gpd/ft2
for type III soils in these locations, 1.5 times the guidance for AB trenches but still
allowing a hydraulic factor of safety of about 3. ETA trenches must be separated by 15
to 20 ft to maximize the ET effects.
• Type IV soils can have very low permeabilities that restrict vertical and lateral movement
of moisture from the drainfield trenches. No field tests were done in type IV soils in the
TTUWRC field demonstration projects. At this time there is not sufficient justification
for making ETA LTAR values in type IV soils larger than those currently assigned by the
TCEQ (2001) for AB drainfields. It is possible that additional field tests in type IV soils
in arid areas could eventually justify adjustment for locations with type IV soils, high ET,
and low rainfall.
• Type Ib soils can have very high permeabilities due to their high sand contents, and the
nature of their porosity may mean that less lateral movement takes place by capillary

55
action than in loamy type II and III soils. Type Ib soils were not tested in the TTUWRC
field demonstrations. At this time there is not sufficient justification for making ETA
LTAR values in type Ib soils larger than those currently assigned by the TCEQ (2001) for
AB drainfields. It is possible that additional field tests in type IV soils in arid areas could
eventually justify adjustment for locations with type Ib soils, high ET, and low rainfall.
• Drainfields in eastern Texas where the local annual rainfall is ≥ 60 percent of the annual
ET do not likely experience as large a combination of ET and absorption as in the arid
western third of the state. These locations should not be assigned larger values of LTAR
beyond the current TCEQ (2001) guidance for AB drainfields.
• The central portion of Texas is characterized by intermediate values of annual ET and
annual rainfall, with varying soil conditions. At this time, there is not sufficient
justification to allow ETA LTAR values above the current TCEQ (2001) guidance for
AB drainfields. It is possible that additional field tests in the various soil types in this
region could eventually justify adjustment for locations with type II or III soils.

56
5. References
American Public Health Association, 1998. Standard Methods for the Examination of Water and Wastewater, 20th ed., APHA/AWWA/WEF, APHA Publications, Washington, DC. Blackstock, D.A., 1979. Soil Survey of Lubbock County, Texas, Natural Resources Conservation Service, United States Department of Agriculture, 105 p. Borrelli, J., Fedler, C.B., and Gregory, J.M., 1998. Mean Crop Consumptive Use and Free-Water Evaporation for Texas, Report to Texas Water Development Board, Austin, Texas. Coffee, D.R., Hill, R.H., and Ressel, D.D., 1980. Soil Survey of Dallas County, Texas, Natural Resources Conservation Service, United States Department of Agriculture, 153 p. Crout, J.C., Symmank, D.G., and Peterson, G.A., 1965. Soil Survey of Jefferson County, Texas, Natural Resources Conservation Service, United States Department of Agriculture, 73 p. Dolezel, R. 1988. Soil Survey of Angelina County, Texas, Natural Resources Conservation Service, United States Department of Agriculture, 203 p. Environmental Protection Agency, 1980. Design Manual – On-site Wastewater Treatment and Disposal Systems, EPA625/1-80-012, U.S. Environmental Protection Agency, Municipal Environmental Research Laboratory, Cincinnati, Ohio. Ingram, W. W., 2000. Evaluation of Septic System Drainfields, Master’s Thesis, Department of Civil Engineering, Texas Tech University, Lubbock, Texas, 183 p. Jaco, H.B., 1971. Soil Survey of Angelina County, Texas, Natural Resources Conservation Service, United States Department of Agriculture, 60 p.
Johnson, R. W., Brasfield, J.F., and Beville, B., 1974. Using Soil Survey Information to Plan Home Sewage Disposal Systems, in Home Sewage Disposal, Proceedings of the National Home Sewage Disposal Symposium, ASAE Publication Proc–175. American Society of Agriculture Engineers, St. Joseph, Michigan, pp. 210-214.
Marshall, T.J. 1958. A Relationship Between Permeability and Size Distribution of Pores, Journal of Soil Science, Vol. 9, pp. 1-8. McEwen, H.F. and Crout, J., 1974. Soil Survey of Webb County, Texas, Natural Resources Conservation Service, United States Department of Agriculture, 43 p. Natural Resources Conservation Service, 2002. Texas Precipitation Data/Maps, National Cartography and Geospatial Center, United States Department of Agriculture, website http://www.ncgc.nrcs.usda.gov/branch/gdb/products/climate/data/precipitation-state/tx.html, last accessed December 2003.

57
Otis, R. J., Converse, J. C., Carlile, B. L., and Witty, J. E., 1977. Effluent Distribution, in Home Sewage Treatment, Proceedings of the Second National Home Sewage Treatment Symposium, ASAE Publication 5-77, American Society of Agricultural Engineers, St. Joseph, Michigan, pp. 61-85. Penman, H.L., 1948. Natural Evaporation from Open Water, Bare Soil and Grass, Proceedings of the Royal Society of London, Vol. A193, pp. 129-145. Pringle, F.B., 1980. Soil Survey of Potter County, Texas, Natural Resources Conservation Service, United States Department of Agriculture, 139 p. Rainwater, K.A., Jackson, W.A., Ingram, W., Lee, C.Y., Thompson, D.B., Mollhagen, T.R., Ramsey, R.H., and Urban, L.V., 2001. Effects of Combining Absorbic and Evaporative Disposal Methods on Drainfield Sizing in Arid and Semiarid Areas, Final Report to Texas On-Site Wastewater Disposal Research Council, Texas Natural Resource Conservation Commission, Austin, Texas, 119 p. Rawls, W.J., D.L. Brakensiek, and S.D. Logsdon, 1982. Predicting Saturated Hydraulic Conductivity Utilizing Fractal Principles. Soil Science Society of America Journal, Vol. 57 pp. 1193-1197. Reed, Stowe & Yanke, LLC, 2001. Study to Determine the Magnitude of, and Reasons for, Chronically Malfunctioning On-Site Sewage Facility Systems in Texas, Final Report to Texas On-Site Wastewater Disposal Research Council, Texas Natural Resource Conservation Commission, Austin, Texas, 115 p. Reed, Stowe & Yanke, LLC, 2002. Study to Conduct Further Research Regarding the Magnitude of, and Reasons for, Chronically Malfunctioning On-Site Sewage Facility Systems in South Texas, Final Report to Texas On-Site Wastewater Disposal Research Council, Texas Natural Resource Conservation Commission, Austin, Texas, 37 p. Rives, J.L., 1980. Soil Survey of Pecos County, Texas, Natural Resources Conservation Service, United States Department of Agriculture, 97 p. Rogers, C.A., Passmore, G.D., and Risinger, W.M., 1976. Soil Survey of Baylor County, Texas, Natural Resources Conservation Service, United States Department of Agriculture, 70 p. Sanders, R.R and Gabriel, W.J., 1985. Soil Survey of Webb County, Texas, Natural Resources Conservation Service, United States Department of Agriculture, 145 p. Taylor, R.B., Hailey, R.B., and Richmond, D.L. 1991. Soil Survey of Bexar County, Texas, Natural Resources Conservation Service, United States Department of Agriculture, 126 p. Texas Commission for Environmental Quality, 2001. On-Site Sewage Facilities. Title 30 Texas Annotated Code Chapter 285. Texas Register, Austin, Texas.

58
Waghdhare, N., Rainwater, K.A., and Jackson, W.A., 2003. Numerical Simulation of Flow Near a Septic System Drainfield, Final Report to Texas On-Site Wastewater Treatment Research Council, Texas Commission on Environmental Quality, Austin, Texas, 306 p. Wiedenfeld, C.C. and Flores, P.H., 1976. Soil Survey of Tom Green County, Texas, Natural Resources Conservation Service, United States Department of Agriculture, 59 p. Williams, D., Thompson, C.M., and Jacobs, J.L., 1977. Soil Survey of Cameron County, Texas, Natural Resources Conservation Service, United States Department of Agriculture, 94 p.

59
Appendix A. Daily Flow Data

60
Date 4 7 9 14 15 164/5/20024/6/2002 606.7 494.54/7/2002 837.5 644.94/8/2002 392.0 365.74/9/2002 488.8 578.5
4/10/2002 571.5 683.34/11/2002 582.3 733.14/12/2002 185.6 273.14/13/2002 582.3 733.14/14/2002 398.5 645.44/15/2002 330.5 840.94/16/2002 630.54/17/2002 656.4 583.04/18/2002 40.6 579.44/19/2002 533.2 #4 level problems4/20/2002 531.7 #4 level problems4/21/2002 645.3 431.24/22/2002 445.2 521.94/23/2002 528.6 #4 level problems4/24/2002 607.6 647.54/25/2002 385.9 419.14/26/2002 157.3 443.04/27/2002 239.1 424.04/28/2002 248.3 496.04/29/2002 509.0 #4, level rod fell off4/30/2002 483.7 #4, level rod fell off
5/1/2002 242.0 #4, level rod fell off5/2/2002 501.0 668.6 614.95/3/2002 142.6 601.8 560.7 955.25/4/2002 282.5 368.7 217.4 511.75/5/2002 198.0 391.5 0.6 454.65/6/2002 213.4 388.2 788.0 427.45/7/2002 105.3 225.1 263.1 69.05/8/2002 191.4 270.6 477.0 0.05/9/2002 210.3 348.4 524.4 527.3 1.9
5/10/2002 144.0 248.6 1027.6 244.7 183.35/11/2002 167.6 293.7 510.9 299.4 322.85/12/2002 196.0 333.4 349.6 350.2 378.55/13/2002 191.2 323.9 269.4 339.6 365.45/14/2002 103.4 194.6 150.5 194.6 213.15/15/2002 167.1 280.8 213.0 294.8 310.35/16/2002 157.0 275.7 204.4 290.3 295.75/17/2002 146.4 255.8 196.6 265.1 272.55/18/2002 161.2 300.6 218.8 306.3 306.85/19/2002 155.3 286.6 202.9 290.6 284.75/20/2002 169.4 300.5 214.7 306.1 294.35/21/2002 198.5 364.0 251.2 372.2 348.25/22/2002 163.1 299.9 202.5 306.6 283.35/23/2002 155.4 299.0 198.0 300.0 281.6
Flow (gpd)Table A.1 Daily Flow Data
Comments

61
Date 4 7 9 14 15 165/24/2002 153.5 296.3 192.9 296.7 276.35/25/2002 139.6 302.7 197.7 283.5 279.75/26/2002 122.8 273.9 175.5 264.4 248.45/27/2002 153.9 315.1 188.5 298.6 283.45/28/2002 140.8 311.8 193.2 285.2 274.05/29/2002 127.8 279.2 175.8 260.7 247.25/30/2002 143.8 307.0 181.2 288.8 268.55/31/2002 151.9 318.5 195.0 303.5 277.4
6/1/2002 145.5 319.0 196.2 306.4 277.36/2/2002 151.1 300.9 179.9 294.6 263.56/3/2002 156.2 317.4 194.9 308.1 274.66/4/2002 65.8 155.8 93.9 145.0 134.16/5/2002 85.6 206.2 606.1 137.3 140.56/6/2002 198.3 489.3 361.4 405.0 390.76/7/2002 123.3 317.3 204.2 274.4 257.86/8/2002 118.4 280.5 181.3 237.5 227.56/9/2002 85.5 256.7 157.9 197.0 188.0
6/10/2002 89.6 202.9 121.0 167.2 161.66/11/2002 149.8 340.7 214.4 150.4 275.66/12/2002 129.3 325.6 199.6 264.8 262.46/13/2002 115.7 284.4 175.1 216.9 229.76/14/2002 109.2 277.6 169.6 240.5 224.26/15/2002 139.5 352.5 209.8 265.4 283.96/16/2002 136.0 319.2 203.1 273.9 259.06/17/2002 114.2 252.7 152.8 204.2 200.96/18/2002 135.2 298.7 186.5 226.4 240.66/19/2002 141.9 305.8 189.3 237.4 248.76/20/2002 106.8 210.6 132.8 170.3 170.96/21/2002 156.9 308.8 194.4 243.5 248.46/22/2002 182.2 349.7 224.4 276.2 287.36/23/2002 126.0 224.1 135.9 190.2 183.26/24/2002 139.6 244.9 150.6 215.9 195.16/25/2002 158.0 279.8 173.6 243.6 221.96/26/2002 123.1 127.9 132.1 187.2 172.76/27/2002 102.4 126.0 167.2 165.3 #7 relay problem6/28/2002 138.6 150.0 218.6 200.4 #7 relay problem6/29/2002 162.5 166.2 160.6 247.2 234.56/30/2002 115.5 147.2 98.1 174.7 163.0
7/1/2002 169.6 319.0 206.8 247.7 255.97/2/2002 135.5 235.1 143.5 198.2 201.77/3/2002 132.0 221.0 138.1 190.0 198.17/4/2002 173.0 21.3 188.2 242.6 250.07/5/2002 118.2 5.1 139.7 171.2 181.97/6/2002 105.3 106.3 133.1 166.6 172.97/7/2002 132.1 223.8 157.3 156.7 190.97/8/2002 137.8 222.3 154.4 183.2 188.67/9/2002 133.4 218.7 147.5 99.8 183.6
7/10/2002 184.0 217.6 149.6 149.0 182.17/11/2002 83.7 218.4 148.4 135.3 183.0
Table A.1 ContinuedFlow (gpd)
Comments
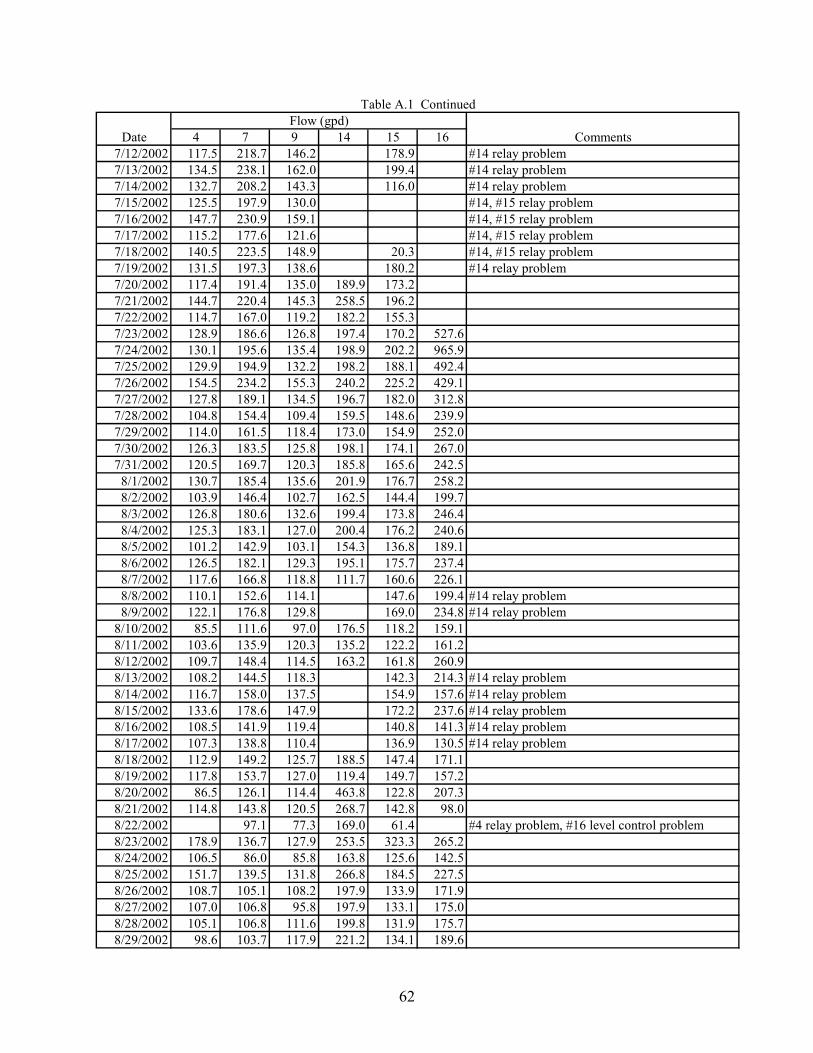
62
Date 4 7 9 14 15 167/12/2002 117.5 218.7 146.2 178.9 #14 relay problem7/13/2002 134.5 238.1 162.0 199.4 #14 relay problem7/14/2002 132.7 208.2 143.3 116.0 #14 relay problem7/15/2002 125.5 197.9 130.0 #14, #15 relay problem7/16/2002 147.7 230.9 159.1 #14, #15 relay problem7/17/2002 115.2 177.6 121.6 #14, #15 relay problem7/18/2002 140.5 223.5 148.9 20.3 #14, #15 relay problem7/19/2002 131.5 197.3 138.6 180.2 #14 relay problem7/20/2002 117.4 191.4 135.0 189.9 173.27/21/2002 144.7 220.4 145.3 258.5 196.27/22/2002 114.7 167.0 119.2 182.2 155.37/23/2002 128.9 186.6 126.8 197.4 170.2 527.67/24/2002 130.1 195.6 135.4 198.9 202.2 965.97/25/2002 129.9 194.9 132.2 198.2 188.1 492.47/26/2002 154.5 234.2 155.3 240.2 225.2 429.17/27/2002 127.8 189.1 134.5 196.7 182.0 312.87/28/2002 104.8 154.4 109.4 159.5 148.6 239.97/29/2002 114.0 161.5 118.4 173.0 154.9 252.07/30/2002 126.3 183.5 125.8 198.1 174.1 267.07/31/2002 120.5 169.7 120.3 185.8 165.6 242.5
8/1/2002 130.7 185.4 135.6 201.9 176.7 258.28/2/2002 103.9 146.4 102.7 162.5 144.4 199.78/3/2002 126.8 180.6 132.6 199.4 173.8 246.48/4/2002 125.3 183.1 127.0 200.4 176.2 240.68/5/2002 101.2 142.9 103.1 154.3 136.8 189.18/6/2002 126.5 182.1 129.3 195.1 175.7 237.48/7/2002 117.6 166.8 118.8 111.7 160.6 226.18/8/2002 110.1 152.6 114.1 147.6 199.4 #14 relay problem8/9/2002 122.1 176.8 129.8 169.0 234.8 #14 relay problem
8/10/2002 85.5 111.6 97.0 176.5 118.2 159.18/11/2002 103.6 135.9 120.3 135.2 122.2 161.28/12/2002 109.7 148.4 114.5 163.2 161.8 260.98/13/2002 108.2 144.5 118.3 142.3 214.3 #14 relay problem8/14/2002 116.7 158.0 137.5 154.9 157.6 #14 relay problem8/15/2002 133.6 178.6 147.9 172.2 237.6 #14 relay problem8/16/2002 108.5 141.9 119.4 140.8 141.3 #14 relay problem8/17/2002 107.3 138.8 110.4 136.9 130.5 #14 relay problem8/18/2002 112.9 149.2 125.7 188.5 147.4 171.18/19/2002 117.8 153.7 127.0 119.4 149.7 157.28/20/2002 86.5 126.1 114.4 463.8 122.8 207.38/21/2002 114.8 143.8 120.5 268.7 142.8 98.08/22/2002 97.1 77.3 169.0 61.4 #4 relay problem, #16 level control problem8/23/2002 178.9 136.7 127.9 253.5 323.3 265.28/24/2002 106.5 86.0 85.8 163.8 125.6 142.58/25/2002 151.7 139.5 131.8 266.8 184.5 227.58/26/2002 108.7 105.1 108.2 197.9 133.9 171.98/27/2002 107.0 106.8 95.8 197.9 133.1 175.08/28/2002 105.1 106.8 111.6 199.8 131.9 175.78/29/2002 98.6 103.7 117.9 221.2 134.1 189.6
Table A.1 ContinuedFlow (gpd)
Comments
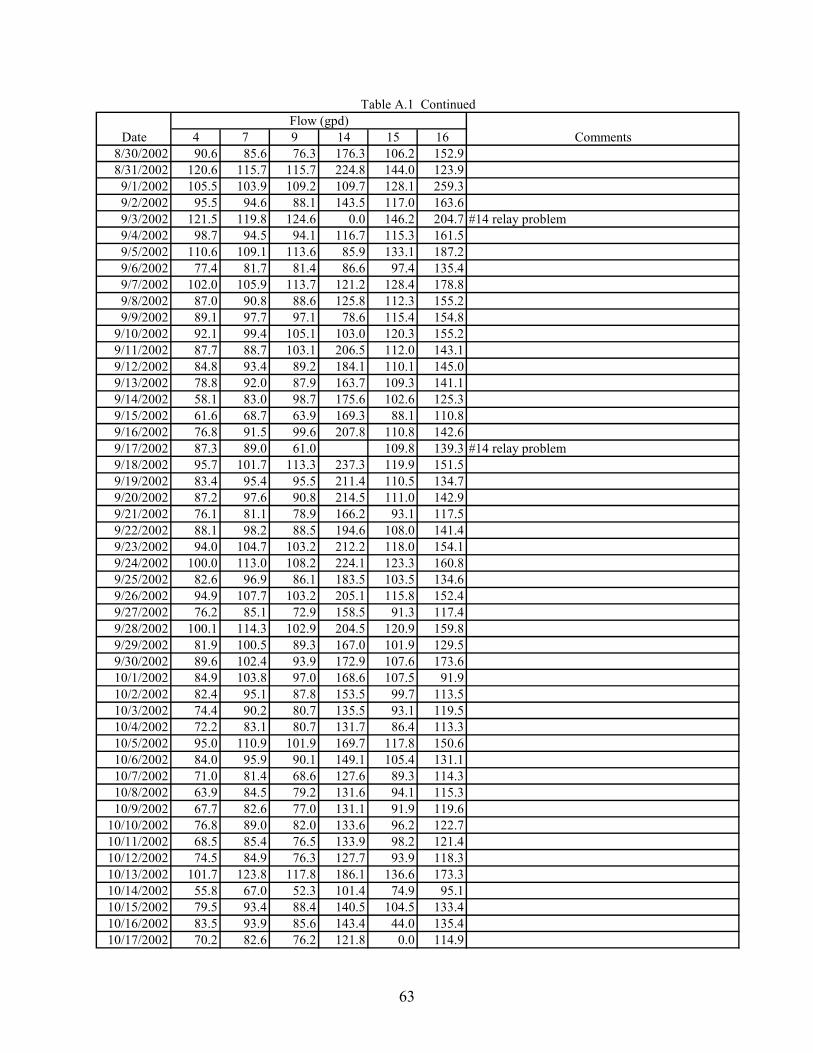
63
Date 4 7 9 14 15 168/30/2002 90.6 85.6 76.3 176.3 106.2 152.98/31/2002 120.6 115.7 115.7 224.8 144.0 123.9
9/1/2002 105.5 103.9 109.2 109.7 128.1 259.39/2/2002 95.5 94.6 88.1 143.5 117.0 163.69/3/2002 121.5 119.8 124.6 0.0 146.2 204.7 #14 relay problem9/4/2002 98.7 94.5 94.1 116.7 115.3 161.59/5/2002 110.6 109.1 113.6 85.9 133.1 187.29/6/2002 77.4 81.7 81.4 86.6 97.4 135.49/7/2002 102.0 105.9 113.7 121.2 128.4 178.89/8/2002 87.0 90.8 88.6 125.8 112.3 155.29/9/2002 89.1 97.7 97.1 78.6 115.4 154.8
9/10/2002 92.1 99.4 105.1 103.0 120.3 155.29/11/2002 87.7 88.7 103.1 206.5 112.0 143.19/12/2002 84.8 93.4 89.2 184.1 110.1 145.09/13/2002 78.8 92.0 87.9 163.7 109.3 141.19/14/2002 58.1 83.0 98.7 175.6 102.6 125.39/15/2002 61.6 68.7 63.9 169.3 88.1 110.89/16/2002 76.8 91.5 99.6 207.8 110.8 142.69/17/2002 87.3 89.0 61.0 109.8 139.3 #14 relay problem9/18/2002 95.7 101.7 113.3 237.3 119.9 151.59/19/2002 83.4 95.4 95.5 211.4 110.5 134.79/20/2002 87.2 97.6 90.8 214.5 111.0 142.99/21/2002 76.1 81.1 78.9 166.2 93.1 117.59/22/2002 88.1 98.2 88.5 194.6 108.0 141.49/23/2002 94.0 104.7 103.2 212.2 118.0 154.19/24/2002 100.0 113.0 108.2 224.1 123.3 160.89/25/2002 82.6 96.9 86.1 183.5 103.5 134.69/26/2002 94.9 107.7 103.2 205.1 115.8 152.49/27/2002 76.2 85.1 72.9 158.5 91.3 117.49/28/2002 100.1 114.3 102.9 204.5 120.9 159.89/29/2002 81.9 100.5 89.3 167.0 101.9 129.59/30/2002 89.6 102.4 93.9 172.9 107.6 173.610/1/2002 84.9 103.8 97.0 168.6 107.5 91.910/2/2002 82.4 95.1 87.8 153.5 99.7 113.510/3/2002 74.4 90.2 80.7 135.5 93.1 119.510/4/2002 72.2 83.1 80.7 131.7 86.4 113.310/5/2002 95.0 110.9 101.9 169.7 117.8 150.610/6/2002 84.0 95.9 90.1 149.1 105.4 131.110/7/2002 71.0 81.4 68.6 127.6 89.3 114.310/8/2002 63.9 84.5 79.2 131.6 94.1 115.310/9/2002 67.7 82.6 77.0 131.1 91.9 119.6
10/10/2002 76.8 89.0 82.0 133.6 96.2 122.710/11/2002 68.5 85.4 76.5 133.9 98.2 121.410/12/2002 74.5 84.9 76.3 127.7 93.9 118.310/13/2002 101.7 123.8 117.8 186.1 136.6 173.310/14/2002 55.8 67.0 52.3 101.4 74.9 95.110/15/2002 79.5 93.4 88.4 140.5 104.5 133.410/16/2002 83.5 93.9 85.6 143.4 44.0 135.410/17/2002 70.2 82.6 76.2 121.8 0.0 114.9
Table A.1 ContinuedFlow (gpd)
Comments

64
Date 4 7 9 14 15 1610/18/2002 55.1 71.4 67.6 100.1 5.5 92.410/19/2002 76.1 85.0 73.4 129.5 66.6 124.110/20/2002 69.4 83.2 76.2 121.4 69.1 118.410/21/2002 75.5 88.6 77.7 129.6 76.9 127.910/22/2002 61.8 76.7 81.1 109.7 62.2 109.310/23/2002 Septic tank problems10/24/2002 Septic tank problems10/25/2002 Septic tank problems10/26/2002 62.5 87.6 168.8 139.3 71.1 123.310/27/2002 50.4 64.8 36.3 99.4 58.4 108.110/28/2002 24.1 49.2 0.0 67.3 42.0 67.0 #14 relay problem10/29/2002 42.5 54.1 0.0 89.6 47.5 99.9 #14 relay problem10/30/2002 87.1 116.8 140.4 141.2 107.1 152.210/31/2002 26.6 36.1 40.7 46.0 30.4 46.4
11/1/2002 49.1 91.1 88.2 108.4 71.5 110.511/2/2002 58.4 95.4 86.2 118.0 74.1 121.611/3/2002 65.2 96.9 84.9 125.7 77.3 127.311/4/2002 53.6 87.4 85.4 103.9 66.7 104.011/5/2002 66.6 103.8 103.7 136.2 81.2 40.711/6/2002 57.2 83.3 89.5 111.0 67.7 216.311/7/2002 84.8 113.7 117.7 154.8 95.5 161.711/8/2002 65.4 91.0 90.6 120.0 73.4 123.211/9/2002 73.9 95.6 96.3 131.6 81.8 131.2
11/10/2002 67.2 84.5 87.6 116.6 71.1 114.211/11/2002 70.3 90.9 93.3 123.0 74.6 118.211/12/2002 81.2 103.2 106.6 138.6 85.1 131.211/13/2002 59.9 77.4 85.6 108.5 64.2 98.511/14/2002 81.9 102.2 103.6 139.1 82.2 126.011/15/2002 37.6 86.4 90.1 110.0 66.1 97.111/16/2002 79.3 93.0 97.3 118.6 66.5 105.211/17/2002 63.9 84.9 85.1 112.0 62.7 100.411/18/2002 64.2 83.9 85.3 113.5 64.4 100.811/19/2002 81.0 102.4 113.6 138.6 77.9 120.311/20/2002 65.9 86.8 88.2 115.1 65.1 100.611/21/2002 74.7 94.6 99.7 126.1 72.3 109.911/22/2002 63.7 80.8 77.8 108.8 64.4 100.711/23/2002 66.7 84.2 95.0 111.3 65.2 107.711/24/2002 73.2 88.9 86.9 122.5 70.8 119.511/25/2002 64.6 82.7 81.0 104.7 61.1 101.311/26/2002 71.3 89.2 92.4 118.7 68.3 115.811/27/2002 68.5 85.5 89.9 112.2 65.4 110.411/28/2002 72.6 90.0 96.5 121.0 69.0 121.511/29/2002 64.9 77.4 84.2 104.7 60.8 102.011/30/2002 70.3 81.9 86.0 112.1 64.9 111.4
12/1/2002 64.3 80.0 83.7 106.3 63.0 105.812/2/2002 76.1 87.1 95.9 118.2 70.0 126.612/3/2002 33.6 59.7 76.7 68.3 45.0 65.212/4/2002 56.6 68.8 77.2 98.1 49.7 88.912/5/2002 70.9 81.4 90.6 109.4 61.0 96.9
Table A.1 ContinuedFlow (gpd)
Comments

65
Date 4 7 9 14 15 1612/6/2002 65.6 88.8 93.0 116.0 67.1 109.212/7/2002 66.6 89.3 88.3 116.4 68.8 113.712/8/2002 62.9 92.7 99.2 119.8 70.0 107.312/9/2002 116.9 151.9 166.4 198.4 117.3 182.9
12/10/2002 64.8 87.6 93.7 114.4 68.3 98.812/11/2002 20.0 29.7 27.6 34.8 21.2 39.6 Heavy rain12/12/2002 73.7 101.3 105.3 125.8 74.8 126.212/13/2002 62.4 84.6 56.8 106.1 63.4 101.112/14/2002 69.8 94.4 85.3 117.8 70.6 112.512/15/2002 70.9 77.0 114.7 78.2 82.0 134.412/16/2002 61.0 95.5 20.0 140.7 51.6 76.312/17/2002 62.1 79.3 72.1 102.6 63.4 114.012/18/2002 69.8 85.0 85.2 114.7 70.6 117.312/19/2002 80.8 99.8 104.0 129.5 81.3 126.212/20/2002 54.3 68.5 59.6 84.2 53.1 90.312/21/2002 73.6 89.1 81.8 113.3 72.2 123.112/22/2002 94.1 111.8 108.2 143.6 90.5 146.012/23/2002 56.5 78.1 79.9 86.2 59.3 90.112/24/2002 79.5 98.6 88.4 117.0 75.3 120.012/25/2002 53.4 64.1 60.9 77.2 50.3 79.512/26/2002 89.7 106.6 108.8 130.5 84.4 125.812/27/2002 73.9 89.1 89.8 106.6 68.6 116.012/28/2002 74.8 90.5 82.0 107.0 68.6 104.112/29/2002 74.4 91.7 94.6 107.9 69.5 112.012/30/2002 75.1 97.6 86.2 107.8 68.7 119.012/31/2002 79.4 92.7 88.1 111.0 72.2 114.9
1/1/2003 78.6 88.0 87.8 106.2 68.5 109.71/2/2003 75.7 80.2 79.2 96.0 63.0 91.91/3/2003 93.2 100.5 93.9 119.2 72.7 118.51/4/2003 94.6 97.2 95.7 116.0 71.8 113.71/5/2003 70.7 67.5 65.0 90.3 54.4 96.51/6/2003 104.0 102.3 95.1 123.1 78.1 109.31/7/2003 104.4 103.2 97.6 125.6 79.7 130.31/8/2003 76.6 80.6 72.7 92.6 59.0 82.81/9/2003 111.5 105.6 108.3 134.1 86.1 122.5
1/10/2003 86.6 90.4 76.6 104.9 68.7 95.61/11/2003 114.8 116.7 107.0 139.2 89.8 132.21/12/2003 86.3 86.8 75.9 103.4 67.8 108.91/13/2003 108.4 117.1 100.5 130.7 86.1 119.41/14/2003 90.3 88.3 76.4 105.0 69.3 97.21/15/2003 108.0 112.7 102.4 134.0 90.2 127.81/16/2003 95.6 101.9 83.5 121.5 82.5 118.81/17/2003 93.4 97.8 88.0 115.3 81.8 102.91/18/2003 79.0 89.2 106.9 120.2 70.9 102.11/19/2003 106.8 109.2 70.1 112.2 92.0 120.31/20/2003 96.9 105.6 89.8 123.8 87.0 105.51/21/2003 102.7 108.6 98.4 133.7 92.0 134.61/22/2003 80.8 90.6 77.8 106.3 74.7 86.51/23/2003 115.2 122.9 109.3 145.3 104.8 135.1
Table A.1 ContinuedFlow (gpd)
Comments

66
Date 4 7 9 14 15 161/24/2003 87.3 92.6 86.4 111.2 81.6 99.41/25/2003 109.3 111.8 96.2 134.9 100.1 127.11/26/2003 100.9 107.6 96.5 127.2 91.3 116.41/27/2003 99.6 103.6 86.0 125.7 90.9 110.61/28/2003 99.3 103.2 90.1 126.4 92.0 124.61/29/2003 101.7 108.0 97.6 129.0 93.3 114.81/30/2003 99.6 103.8 94.0 125.0 91.9 109.61/31/2003 86.4 90.6 72.5 111.0 79.8 101.4
2/1/2003 121.7 129.4 109.6 156.4 115.1 137.12/2/2003 98.4 106.1 97.0 126.4 91.8 117.92/3/2003 108.7 115.9 105.2 140.1 103.4 124.22/4/2003 100.0 108.2 97.8 128.8 97.6 98.52/5/2003 108.7 120.2 104.4 135.4 103.7 #16 flow control problem2/6/2003 96.8 108.7 93.8 122.6 93.4 #16 flow control problem2/7/2003 99.7 113.1 96.8 127.4 97.5 #16 flow control problem2/8/2003 117.4 129.5 52.9 146.4 112.2 #16 flow control problem2/9/2003 108.8 115.0 161.1 131.7 100.4 #16 flow control problem
2/10/2003 113.1 121.6 105.9 143.5 107.7 #16 flow control problem2/11/2003 80.7 93.0 76.4 101.3 77.6 #16 flow control problem2/12/2003 111.6 127.6 99.3 139.5 106.8 #16 flow control problem2/13/2003 119.4 139.6 113.6 149.5 115.8 #16 flow control problem2/14/2003 80.5 91.2 76.8 102.8 77.1 #16 flow control problem2/15/2003 120.7 139.4 112.2 157.3 116.7 146.22/16/2003 111.9 134.0 105.4 148.3 113.2 157.12/17/2003 111.8 133.9 105.5 148.3 113.2 157.12/18/2003 106.8 127.5 102.5 144.0 110.6 154.02/19/2003 120.4 143.5 162.0 125.4 166.1 #9 water level lead problem2/20/2003 110.2 132.6 144.5 115.9 161.1 #9 water level lead problem2/21/2003 46.4 57.6 60.4 48.7 68.6 #9 water level lead problem2/22/2003 91.6 115.1 55.6 88.6 73.5 130.12/23/2003 77.3 95.3 89.4 124.1 86.8 110.72/24/2003 113.0 152.1 112.3 149.1 117.6 180.52/25/2003 79.6 99.8 288.8 101.3 78.6 110.32/26/2003 110.3 149.3 150.8 150.8 117.2 172.92/27/2003 23.7 28.3 26.4 20.7 24.3 #9 water level lead problem2/28/2003 128.2 176.5 142.6 179.7 136.9 190.1
3/1/2003 102.3 130.0 285.7 135.7 106.7 148.63/2/2003 34.4 52.7 50.9 38.5 76.2 #9 water level lead problem3/3/2003 58.9 74.4 8.2 0.9 52.9 78.63/4/2003 73.7 109.8 72.5 134.8 95.2 158.63/5/2003 114.2 170.4 132.2 163.9 130.1 230.63/6/2003 81.9 118.8 97.8 113.7 87.9 167.43/7/2003 92.1 126.0 122.3 94.3 174.1 #9 water level lead problem3/8/2003 92.6 142.7 135.4 136.0 107.6 198.73/9/2003 Bad data all fields
3/10/2003 65.4 104.7 33.6 52.1 36.3 113.03/11/2003 110.7 155.9 86.5 148.5 95.5 191.23/12/2003 136.5 181.2 130.3 165.9 143.7 255.03/13/2003 46.1 76.7 54.3 62.7 63.7 97.4
Comments
Table A.1 ContinuedFlow (gpd)

67
Date 4 7 9 14 15 163/14/2003 110.4 164.1 69.7 94.8 81.2 174.93/15/2003 122.5 178.5 132.1 164.2 141.2 226.13/16/2003 77.1 231.1 89.3 113.9 112.5 174.63/17/2003 145.0 505.5 139.5 147.3 116.0 216.53/18/2003 99.3 69.4 135.4 167.9 110.1 206.63/19/2003 35.6 260.9 58.8 78.1 82.2 119.13/20/2003 178.1 218.4 111.0 114.4 139.3 207.43/21/2003 113.8 190.2 116.8 141.4 127.5 209.83/22/2003 107.7 191.1 120.2 136.1 121.3 195.13/23/2003 20.8 35.8 19.6 26.0 22.8 35.0 Problems in control building, no flow3/24/2003 82.6 121.7 35.1 79.6 74.6 132.63/25/2003 45.6 90.4 21.9 41.4 58.6 88.33/26/2003 133.6 210.0 97.7 162.7 158.3 234.23/27/2003 129.2 191.0 113.3 154.1 144.4 225.93/28/2003 124.9 179.4 126.0 149.5 136.1 204.13/29/2003 Problems in control building, no flow3/30/2003 Problems in control building, no flow3/31/2003 Problems in control building, no flow
4/1/2003 Problems in control building, no flow4/2/2003 178.9 130.9 122.7 26.7 165.1 114.64/3/2003 11.7 156.8 18.5 232.3 42.7 135.34/4/2003 91.7 146.4 81.4 151.5 119.0 165.64/5/2003 57.0 78.0 59.8 78.2 62.0 86.34/6/2003 49.8 56.2 7.7 1.0 30.8 58.04/7/2003 82.5 135.2 70.3 141.4 109.0 143.54/8/2003 102.0 143.2 100.3 144.2 116.4 171.54/9/2003 59.9 88.0 86.5 70.0 94.4 #9 water level lead problem
4/10/2003 105.4 150.5 109.6 163.8 116.4 165.14/11/2003 98.7 113.5 90.0 137.0 119.6 136.54/12/2003 88.4 148.5 107.6 129.5 91.2 150.34/13/2003 92.1 131.5 98.4 142.5 112.1 139.64/14/2003 97.0 125.3 99.6 143.2 112.6 146.54/15/2003 32.3 43.3 30.9 47.1 38.2 44.84/16/2003 32.3 43.3 30.8 47.1 38.2 44.84/17/2003 143.0 211.5 104.6 179.0 130.5 211.44/18/2003 53.9 69.4 25.9 81.7 55.6 86.94/19/2003 102.8 120.1 146.7 197.0 140.0 188.74/20/2003 142.2 180.0 70.0 132.5 133.2 154.74/21/2003 115.8 142.3 106.1 148.9 129.1 158.24/22/2003 103.8 124.8 95.3 136.5 116.0 139.14/23/2003 101.5 128.6 92.4 135.3 114.0 148.74/24/2003 119.9 148.3 106.2 160.7 136.5 170.64/25/2003 111.9 139.4 101.7 151.0 127.3 158.54/26/2003 106.1 143.0 96.0 120.4 138.1 149.74/27/2003 100.9 117.5 95.8 158.8 96.2 150.84/28/2003 89.1 136.6 104.2 152.6 176.5 108.34/29/2003 12.8 24.0 25.6 0.0 #9 water level lead problem4/30/2003 61.5 163.4 110.8 154.0 140.4 233.4
5/1/2003 108.4 141.5 119.4 140.6 128.8 165.1
Table A.1 ContinuedFlow (gpd)
Comments
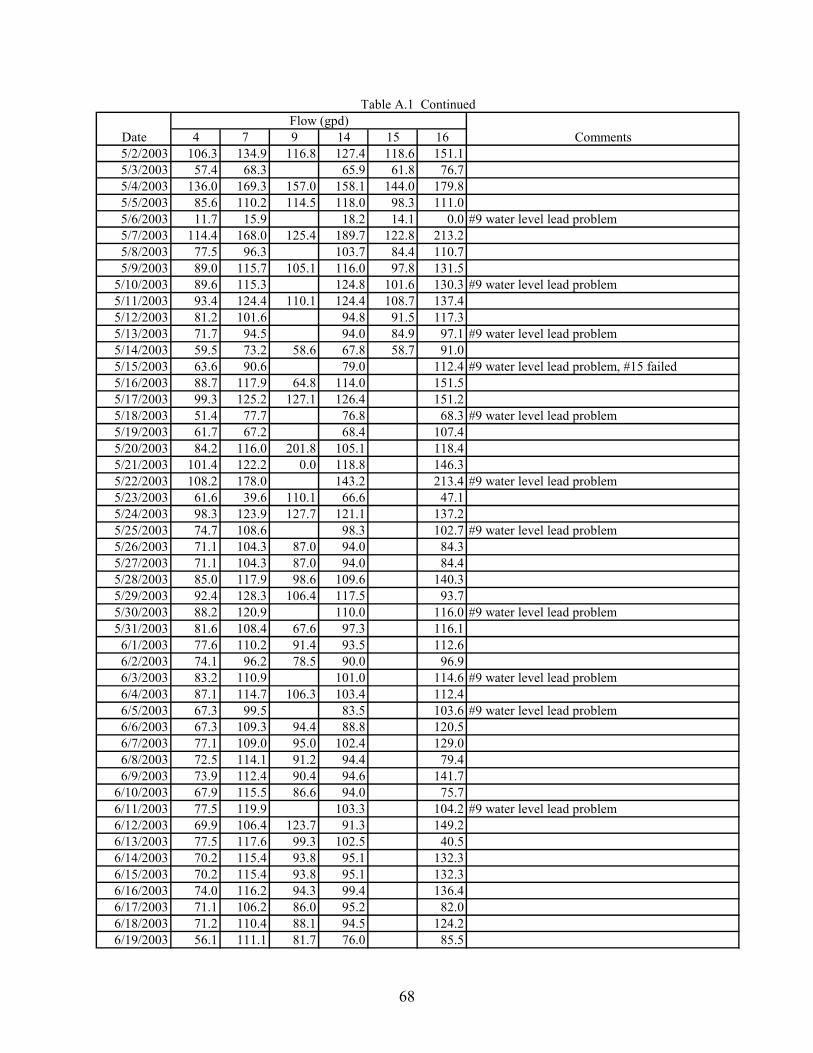
68
Date 4 7 9 14 15 165/2/2003 106.3 134.9 116.8 127.4 118.6 151.15/3/2003 57.4 68.3 65.9 61.8 76.75/4/2003 136.0 169.3 157.0 158.1 144.0 179.85/5/2003 85.6 110.2 114.5 118.0 98.3 111.05/6/2003 11.7 15.9 18.2 14.1 0.0 #9 water level lead problem5/7/2003 114.4 168.0 125.4 189.7 122.8 213.25/8/2003 77.5 96.3 103.7 84.4 110.75/9/2003 89.0 115.7 105.1 116.0 97.8 131.5
5/10/2003 89.6 115.3 124.8 101.6 130.3 #9 water level lead problem5/11/2003 93.4 124.4 110.1 124.4 108.7 137.45/12/2003 81.2 101.6 94.8 91.5 117.35/13/2003 71.7 94.5 94.0 84.9 97.1 #9 water level lead problem5/14/2003 59.5 73.2 58.6 67.8 58.7 91.05/15/2003 63.6 90.6 79.0 112.4 #9 water level lead problem, #15 failed5/16/2003 88.7 117.9 64.8 114.0 151.55/17/2003 99.3 125.2 127.1 126.4 151.25/18/2003 51.4 77.7 76.8 68.3 #9 water level lead problem5/19/2003 61.7 67.2 68.4 107.45/20/2003 84.2 116.0 201.8 105.1 118.45/21/2003 101.4 122.2 0.0 118.8 146.35/22/2003 108.2 178.0 143.2 213.4 #9 water level lead problem5/23/2003 61.6 39.6 110.1 66.6 47.15/24/2003 98.3 123.9 127.7 121.1 137.25/25/2003 74.7 108.6 98.3 102.7 #9 water level lead problem5/26/2003 71.1 104.3 87.0 94.0 84.35/27/2003 71.1 104.3 87.0 94.0 84.45/28/2003 85.0 117.9 98.6 109.6 140.35/29/2003 92.4 128.3 106.4 117.5 93.75/30/2003 88.2 120.9 110.0 116.0 #9 water level lead problem5/31/2003 81.6 108.4 67.6 97.3 116.1
6/1/2003 77.6 110.2 91.4 93.5 112.66/2/2003 74.1 96.2 78.5 90.0 96.96/3/2003 83.2 110.9 101.0 114.6 #9 water level lead problem6/4/2003 87.1 114.7 106.3 103.4 112.46/5/2003 67.3 99.5 83.5 103.6 #9 water level lead problem6/6/2003 67.3 109.3 94.4 88.8 120.56/7/2003 77.1 109.0 95.0 102.4 129.06/8/2003 72.5 114.1 91.2 94.4 79.46/9/2003 73.9 112.4 90.4 94.6 141.7
6/10/2003 67.9 115.5 86.6 94.0 75.76/11/2003 77.5 119.9 103.3 104.2 #9 water level lead problem6/12/2003 69.9 106.4 123.7 91.3 149.26/13/2003 77.5 117.6 99.3 102.5 40.56/14/2003 70.2 115.4 93.8 95.1 132.36/15/2003 70.2 115.4 93.8 95.1 132.36/16/2003 74.0 116.2 94.3 99.4 136.46/17/2003 71.1 106.2 86.0 95.2 82.06/18/2003 71.2 110.4 88.1 94.5 124.26/19/2003 56.1 111.1 81.7 76.0 85.5
Comments
Table A.1 ContinuedFlow (gpd)

69
Date 4 7 9 14 15 166/20/2003 75.7 135.0 99.7 104.6 100.26/21/2003 68.0 108.8 83.9 95.1 114.66/22/2003 64.5 103.9 80.0 94.4 129.66/23/2003 64.5 103.9 80.0 94.4 129.66/24/2003 84.9 133.6 103.9 130.1 89.66/25/2003 32.2 52.3 65.6 110.1 #9 water level lead problem6/26/2003 Bad data all fields6/27/2003 17.4 28.0 15.5 23.5 #14 flow problem6/28/2003 29.9 39.7 1.8 6.2 45.06/29/2003 19.1 44.4 11.1 8.1 62.86/30/2003 18.0 0.0 9.2 0.1 2.0
7/1/2003 26.4 29.2 0.3 0.1 33.17/2/2003 31.8 43.6 31.8 215.1 54.67/3/2003 31.8 43.5 31.8 215.0 54.67/4/2003 69.8 117.9 91.3 80.4 97.97/5/2003 75.5 125.9 100.9 36.5 121.77/6/2003 53.6 89.8 71.1 92.3 #14 flow problem7/7/2003 43.5 71.6 53.7 71.0 #14 flow problem7/8/2003 43.4 71.6 53.7 71.0 #14 flow problem
Table A.1 ContinuedFlow (gpd)
Comments