Evaluation of current deck design practices
111
Graduate Theses, Dissertations, and Problem Reports 2008 Evaluation of current deck design practices Evaluation of current deck design practices Jeremy M. Meadway West Virginia University Follow this and additional works at: https://researchrepository.wvu.edu/etd Recommended Citation Recommended Citation Meadway, Jeremy M., "Evaluation of current deck design practices" (2008). Graduate Theses, Dissertations, and Problem Reports. 1911. https://researchrepository.wvu.edu/etd/1911 This Thesis is protected by copyright and/or related rights. It has been brought to you by the The Research Repository @ WVU with permission from the rights-holder(s). You are free to use this Thesis in any way that is permitted by the copyright and related rights legislation that applies to your use. For other uses you must obtain permission from the rights-holder(s) directly, unless additional rights are indicated by a Creative Commons license in the record and/ or on the work itself. This Thesis has been accepted for inclusion in WVU Graduate Theses, Dissertations, and Problem Reports collection by an authorized administrator of The Research Repository @ WVU. For more information, please contact [email protected].
Transcript of Evaluation of current deck design practices
Graduate Theses, Dissertations, and Problem Reports
2008
Evaluation of current deck design practices Evaluation of current deck design practices
Jeremy M. Meadway West Virginia University
Follow this and additional works at: https://researchrepository.wvu.edu/etd
Recommended Citation Recommended Citation Meadway, Jeremy M., "Evaluation of current deck design practices" (2008). Graduate Theses, Dissertations, and Problem Reports. 1911. https://researchrepository.wvu.edu/etd/1911
This Thesis is protected by copyright and/or related rights. It has been brought to you by the The Research Repository @ WVU with permission from the rights-holder(s). You are free to use this Thesis in any way that is permitted by the copyright and related rights legislation that applies to your use. For other uses you must obtain permission from the rights-holder(s) directly, unless additional rights are indicated by a Creative Commons license in the record and/ or on the work itself. This Thesis has been accepted for inclusion in WVU Graduate Theses, Dissertations, and Problem Reports collection by an authorized administrator of The Research Repository @ WVU. For more information, please contact [email protected].

Evaluation of Current Deck Design Practices
Jeremy M. Meadway
Thesis submitted to the College of Engineering and Mineral Resources
at West Virginia University
in partial fulfillment of the requirements for the degree of
Master of Science in
Civil Engineering
Karl E. Barth, Ph.D., Chair Samuel Bonasso
David Martinelli, Ph. D.
Department of Civil and Environmental Engineering
Morgantown, WV 2008
Keywords: Empirical Deck Design, Compressive Membrane Action, Internal Arching

Abstract
Evaluation of Current Deck Design Practices
Jeremy M. Meadway Recent changes in the design code, spurred by previous laboratory studies, have allowed many state agencies to adopt an empirical method for bridge deck design. The empirical method for design takes into account in plane stresses generated by applying load to the deck. These in plane forces, which in traditional design are ignored, act to strengthen the overall response of the deck.
This design procedure has been adopted and employed by the WVDOH as well as many other state agencies. Recent decking issues, specifically extensive full depth cracking, have led to concerns about other bridges in the inventory and future ones to be constructed. Thus, this project was initiated with the goals of assessing the current design practices of WVDOH bridge decks.
This thesis focuses on evaluating the current empirical deck design used by the WVDOH. This objective is achieved by conducting laboratory test on four full scale models. These models were designed and constructed to WVDOH standards and tested to failure. During the testing data was collected, analyzed and used for benchmark purposes in a Finite Element Analysis (FEA) parametric study. The FEA parametric study allowed a broader range of specimens to be analyzed by changing span length and deck thickness. From the results future recommendations were made on based off of the current design practices.

iii
Acknowledgements
I would like to thank Dr. Karl Barth for his knowledge and guidance during my two years
of work towards obtaining my master’s degree at West Virginia University.
Also, I want to thank Samuel Bonasso and Dr. David Martinelli for their participation as
members of my graduate committee.
iv
Table of Contents ABSTRACT ................................................................................................................................... ii
ACKNOWLEDGEMENTS ............................................................................................................ iii
1. INTRODUCTION ...................................................................................................................... 1
1.1 BACKGROUND .............................................................................................................................1 1.2 PROBLEM STATEMENT AND OBJECTIVES ......................................................................................3
1.2.1 Problem Statement ............................................................................................................ 3 1.2.2 Objectives ......................................................................................................................... 3
1.3. THESIS ORGANIZATION ...............................................................................................................4
2. LITERATURE REVIEW ........................................................................................................... 6
2.1 BACKGROUND ON EMPIRICAL DESIGN ..........................................................................................6 2.2 BRIDGE DECK BEHAVIOR UNDER CONCENTRATED LOADS ............................................................8 2.3 SUMMARY OF EMPIRICAL BRIDGE DECK DESIGN SPECIFICATIONS ..............................................16 2.4 OVERVIEW OF PREVIOUS TESTING .............................................................................................20 2.5 CONCLUSIONS ...........................................................................................................................38
3 EXPERIMENTAL TESTING..................................................................................................... 39
3.1 SCOPE AND GOALS OF EXPERIMENTAL TESTING PROGRAM........................................................39 3.2 INSTRUMENTATION AND TESTING METHODS ...............................................................................40
3.2.1 Instrumentation Overview ................................................................................................. 40 3.2.2 LVDT’s ........................................................................................................................... 42 3.3.3 Load Cells ....................................................................................................................... 43 3.3.4 Strain Gages.................................................................................................................... 44 3.3.5 Testing Method ................................................................................................................ 46 3.4 Specimen Construction ................................................................................................... 47
3.6 SPECIMEN GEOMETRIES ............................................................................................................54 3.6.1 Specimen 1 (SP1) ............................................................................................................. 54 3.6.2 Specimen 2 ( SP2) ............................................................................................................ 55 3.6.3 Specimen ( SP3)............................................................................................................... 57 3.6.4 Specimen (SP4)................................................................................................................ 58
3.7 TEST RESULTS ..........................................................................................................................60 3.7.1 Specimen 1 (SP1) ............................................................................................................. 60 3.7.2 Specimen (SP2)................................................................................................................ 65 3.7.3 Specimen (SP3)................................................................................................................ 70 3.7.4 Specimen (SP4)................................................................................................................ 75
4. NONLINEAR FINITE ELEMENT MODELING ....................................................................... 79
4.1 INTRODUCTION ..........................................................................................................................79 4.2 NONLINEAR FINITE ELEMENT TECHNIQUES.................................................................................79 4.3 OVERVIEW OF ELEMENTS/MESH ................................................................................................79
4.3.1 Material Modeling ........................................................................................................... 82 4.3.2 Loading Technique.......................................................................................................... 84
4.3 FEA VERIFICATION STUDY........................................................................................................85

v
4.5 PARAMETRIC STUDY ..................................................................................................................87 4.6 FEA PARAMETRIC STUDY RESULTS ...........................................................................................88
5. RESULTS AND CONCLUSIONS .......................................................................................... 97
5.1 INTRODUCTION .........................................................................................................................97 5.2 COMPARISON AND ANALYSIS OF RESULTS..................................................................................97
5.2.1 Experimental Testing........................................................................................................ 97 5.2.2 FEA Results..................................................................................................................... 98
5.3 KEY FINDINGS AND FUTURE RECOMMENDATIONS.................................................................... 101
REFERENCES ......................................................................................................................... 102
1
1. INTRODUCTION
1.1 Background One of the most common decking systems used in bridges is the steel reinforced concrete
slab. The traditional design method for this type of deck is a rigorous procedure that requires
extensive analysis. Recently many federal and state agencies have begun to adopt an empirical
design method, which is a simplified design process that yields an adequate level of strength.
The empirical design method was brought about through research to better understand the
internal load carrying methods of reinforced concrete deck slabs. It was found that the slab takes
advantage of in-plane forces which in previous design methods were ignored. These in-plane
forces create an arching effect that can considerably enhance the overall capacity of the slab.
Taking advantage of a higher than expected capacity, designers can reduce the steel
reinforcement required to carry a given load, which in turn considerably lowers costs. This
reduction in steel also provides less chance of corrosion and can extend the deck life.
The West Virginia Department of Highways (WVDOH) has adopted the empirical deck
design method based on the AASHTO LRFD Specifications. They have also incorporated a deck
system that uses an empirical design coupled with a specialized concrete overlay (SCO). This
deck system consists of two parts: a 6 ½ inch reinforced concrete deck and 2 inch latex modified
concrete substrate. The resulting 8 ½ inch deck is assumed to act as a fully composite system.
2
Recent bridges in the WVDOH bridge inventory designed with the 6 ½ inch deck
thickness have been experiencing substantial cracking at various stages of deck life. This cracking
has appeared both in the curing stage, specifically along the flange tips running in a longitudinal
direction and after the SCO has been applied. Core bores have revealed that these cracks
penetrate the entire depth of the slab, and are of major concern. One such bridge, the Lower
Buffalo bridge, was constructed in 2003 and has experienced severe full depth cracking of the
deck and deboning of the SCO. Currently the re-decking process is underway at this location.
Another example, the Man Bridge, a 2,300 foot bridge has experienced extensive
cracking of the deck during the curing period. As stated above the core borings of this bridge
have reveled cracks penetrating the full depth of the 6 ½ inch concrete deck. These cracks
primarily ran in the longitudinal direction and were observed to follow a path running parallel
with flange tips. In most cases the areas of cracking corresponded where clip angles for the Stay
in place (SIP) formwork were located. It has been determined that the cracks are detrimental to
the overall capacity of the deck, and will most likely lead to a re-decking process sometime in the
near future.
Due to these two costly cases, the WVDOH is re-evaluating their current practice of a
two layer deck coupled with empirical design. Because of the problems experienced with the 6 ½
inch reinforced deck topped with the 2 inch overlay, the WVDOH has since raised the minimum
substrate thickness from 6 ½ inches to 7 ½ inches. Further efforts are underway to better
understand the current specifications and the long term implications of applying the empirical
design process.

3
1.2 Problem Statement and Objectives
1.2.1 Problem Statement This research is focused on understanding the behavior and strength characteristics of
both the homogeneous empirical deck and the two layer empirical deck system currently used by
the WVDOH. Specifically, the impact of the reduced thickness substrate in WVDOH’s two layer
deck system coupled with the reduced steel reinforcing of the Empirical Design method and its
affect on overall deck capacity.
1.2.2 Objectives Large scale laboratory tests coupled with 3-D finite element parametric studies will be
used to evaluate the current deck system in use throughout the state. Results from the testing, and
subsequent parametric studies will be used to analyze key parameters that affect the performance
of the deck slabs. These parameters can then used for comparison and use in future work relating
to bridge decks.
The research plan consists of four tasks:
• A comprehensive literature review will be completed, compiling pertinent information
regarding the issue of empirical decks. This will consist of domestic and foreign archival
publications, design codes, and dissertations or university reports.
• Large scale laboratory testing will be carried out on four full scale bridge deck models to
investigate the behavior of empirically designed decks and the key parameters that effect
the ultimate capacity.
• Refined Finite Element Analysis (FEA) will be used to create a model that accurately
represents the behavior of the deck system tested in the laboratory. This model will then
be used in a parametric study by modifying various parameters that are deemed key in
evaluating the slab response.
4
• Results from the experimental tests and the FEA will be compiled and deck capacity will
be analyzed. From these results future recommendations can be made.
1.3. Thesis Organization
Literature Review
Chapter 2 contains the comprehensive literature review. To better understand both the
behavior of empirically designed slabs and the current specifications, a comprehensive literature
review will be carried out. This literature review will include publications of past research that led
to the acceptance of the empirical design method as well as the current design specifications for
various agencies.
Experimental Testing
Experimental laboratory testing is covered in Chapter 3. Physical testing will be
conducted on four full scale bridge deck sections. Two different girder spacings will be used for
the four tests, two tests at 6 feet and two tests conducted at 9 feet. One test at 6 feet will be
compromised of an 8 inch deck made composite with the supporting girders, the other being the 6
½ inch deck with the 2 inch Specialized Concrete Overlay (SCO) made composite with the
girders. The 9 foot girder spacing will have one test with the 8 ½ inch composite deck and the
other consisting of a 6 ½ inch deck supported by SIP formwork.
Finite Element Analysis
Chapter 4 focuses on refined finite element modeling used to conduct parametric studies.
A refined three-dimensional finite element model will be used to carry out a parametric study
containing models with varying deck thicknesses and girder spacing. These models will be
developed using the commercially available computer program ABAQUS, version 8.3. The deck
5
will consist of an reduced integration shell element (S4R). The rebar will be smeared in the shell
element that represents the concrete deck. The supporting girders will be modeled as general shell
elements with reduced integration (S4R). The deck and girders will be made composite by
modeling the shear connectors as rigid MPC beam elements. The finite element models will be
used to verify the experimental testing, and then conduct the parametric study.
Analysis of Results
Lastly, Chapter 5 compares results from both the experimental tests and the FEA
parametric study. These results will show the key parameters affecting the performance and also
ultimate capacities off empirically designed decks.. From these results, recommendations will be
made.
6
2. LITERATURE REVIEW
2.1 Background on Empirical Design
Historically, reinforced concrete bridge deck design has been conducted using an
equivalent strip method (AASHTO 1996). This procedure defines an assumed section, with
specified width, to carry the live-load bending moment, and is determined based on the
directionality of the primary reinforcing steel. Loading is then assigned using the specified
design vehicles, and the deck is assumed to be a continuous beam across the supporting girders.
Primary flexural reinforcement, in the transverse direction, is then selected based on traditional
procedures for the design of one-way reinforced concrete slabs. Additional steel reinforcement is
placed to assist in load transfer to the primary reinforcement for shrinkage control, and steel is
also placed to satisfy serviceability limits such as deflection requirements. Special procedures are
used for the design of deck overhangs. These are based on both vehicular live-load and dynamic
impact loading of the parapet. The specifications also detail the placing of additional
reinforcement in the negative bending regions of continuous spans.
Numerous tests previously conducted have led to the understanding that traditional
design methods tend to be conservative. This leads to an unnecessarily high amount of
reinforcement in the design (Batchelor et al. 1978, Fang et al. 1986, Elling et al. 1986, Fang et al.
1990a, Fang et al. 1990b, ). One of the main factors for the overdesign of slabs can be attributed
to the presence of an internal “arching action” that can significantly enhance the overall strength.
The “arching action” occurs due to the restraint of the slab in the transverse direction. Restraint is
provided by the bridge girders and by other parts of the bridge system. The added strength gained
from this “arching action” allows for a reduction in reinforcing steel requirements. More
recently, research (Graddy et al. 2002, Rankin and Long 1997, Bakht et al. 1997) has focused
primarily on how to make deck design more efficient. This is done by more precisely modeling
the actual load carrying mechanisms of a reinforced concrete deck slab. The internal arching load
7
carrying mechanism allows decks to be designed with similar predicted strength capacities to that
of a deck being designed by traditional methods, but with significantly reduced reinforcement
requirements. This reduction in steel not only reduces material costs by removing steel,
especially in the top reinforcing mat, but it also reduces the vulnerability of the deck to steel
corrosion that can lead to spalling.
Current AASHTO LRFD specifications (AASHTO LRFD 2005) permit the use of the
Canadian based deck design method referred to as “empirical deck design”. This design
procedure takes advantage of compressive membrane forces, otherwise referred to as internal
arching action, which cause an increase in slab capacities. For slabs to be designed using the
empirical method they must first satisfy the limits specified in Article 9.7.2.4 of the AASHTO
LRFD specifications. These governing limits have been verified by nonlinear finite element
analysis parametric studies (Hewitt and Batchelor 1975, Batchelor 1987, and Fang et al. 1990a).
Reinforcement requirements for slabs designed based on the empirical deck procedures are
substantially reduced from those provided in a traditional design. A reduction of reinforcing steel
of up to 40% can be achieved using the empirical design method. It should be noted that the
empirical design method does not apply to overhang sections. These are to be design using the
traditional method of design.
Empirical deck design procedures come about from the method in which the reinforced
concrete deck slab transmits its loading to support elements. This was assumed previously to be
through flexural action, as is assumed in traditional deck design, but has been found to be a more
complex method that involves in plane compressive membrane action. In theory, as the deck
deflects under a given load the bottom transverse reinforcement acts as a tensile tie, similar to a
tie in an arch, that supports compressive struts in the slab. The action of the concrete carrying
some of the load through these compressive struts allows for a reduced amount of primary
reinforcement.
8
With the AASHTO LRFD specifications adopting the empirical design method, many
states have also begun to include the use of a reduced reinforcement design as the primary
reinforced concrete deck for use in new construction. The WVDOH has adopted the use of
empirically designed deck systems. The following two types of deck systems, used by the
WVDOH, are based off of the empirical design method; a full depth deck with 2 ½ inches of
cover to the top mat of reinforcement and 1 inch of cover to the bottom mat. The other deck
design is a dual layer 8 ½ inch deck comprised of a 6 ½ inch reinforced concrete substrate with a
2” SCO. The dual system has a 3” cover to the top mat of reinforcement and 1” cover to the
bottom reinforcing mat.
2.2 Bridge Deck Behavior Under Concentrated Loads
The traditional design process assumes the deck directly supports the wheel loads,
transferring them transversely to the adjacent girders. The traditional deck design
method is also based on the assumption that slab-on-girder deck sections behave as one-
way slabs acting in the transverse direction; the deck is then designed as a continuous
beam supported by rigid girders (Csagoly and Lybas 1989, Cao et al. 1996). The deck
slab is designed to carry loads through flexural strength only, the assumption being that
the resulting shear capacity is adequate. The effects of any in-plane forces are thus
neglected (Cope 1988).
As reported by Hewitt (1972), as early as 1945, it was observed that the magnitudes of
loads that cause failure in deck slabs were several times larger than the predicted failure loads.
The discrepancy between the predicted and failure loads is much more than can be attributed to
errors in bending analysis. It was recognized that in-plane forces can have considerable effects
9
Cracked Slab
Girder
ReinforcementReinforcement
Girder
CompressiveMembrane
Force
on slab behavior. Specifically, when these forces are compressive, they have been shown to
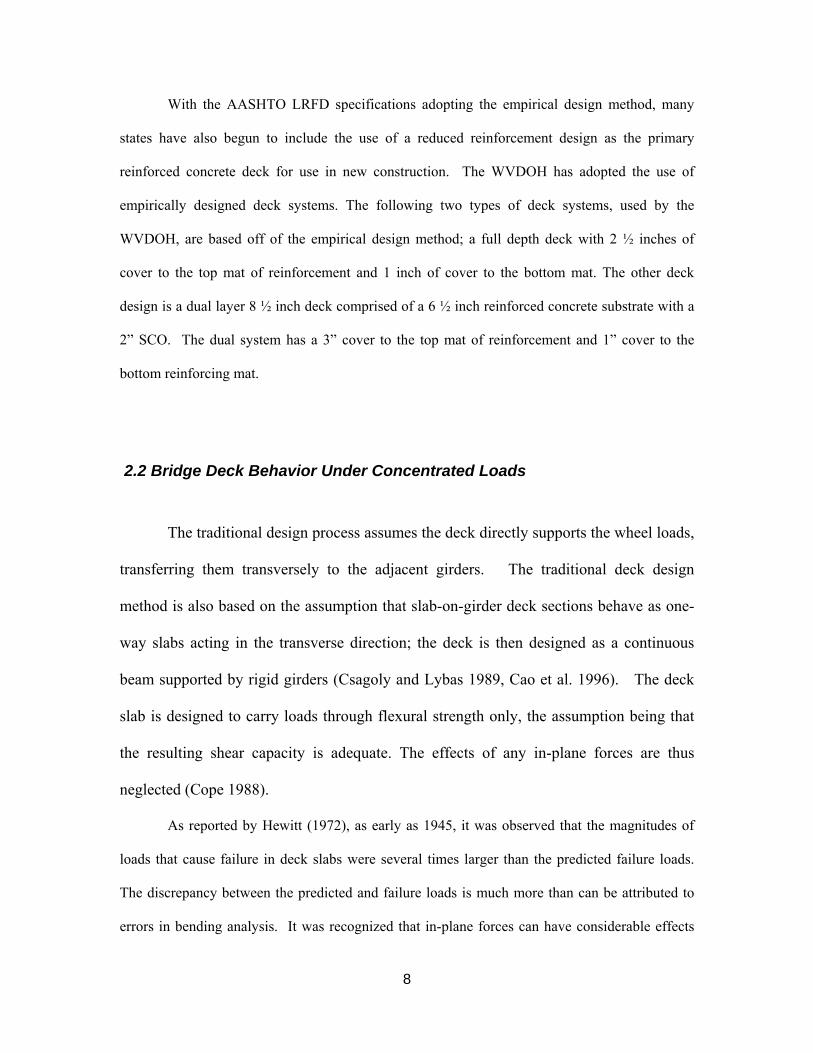
cause increased slab capacity (Batchelor 1987). The effect of in-plane compressive forces in the
slab is referred to as compressive membrane action or “arching action” as shown in Figure 2.1.
This “arching action” is the main reason why bridge slabs designed for bending usually fail in the
punching shear mode when subjected to concentrated loads.
Figure 2.1: Arching action in cracked slab (Fang et al. 1990a)
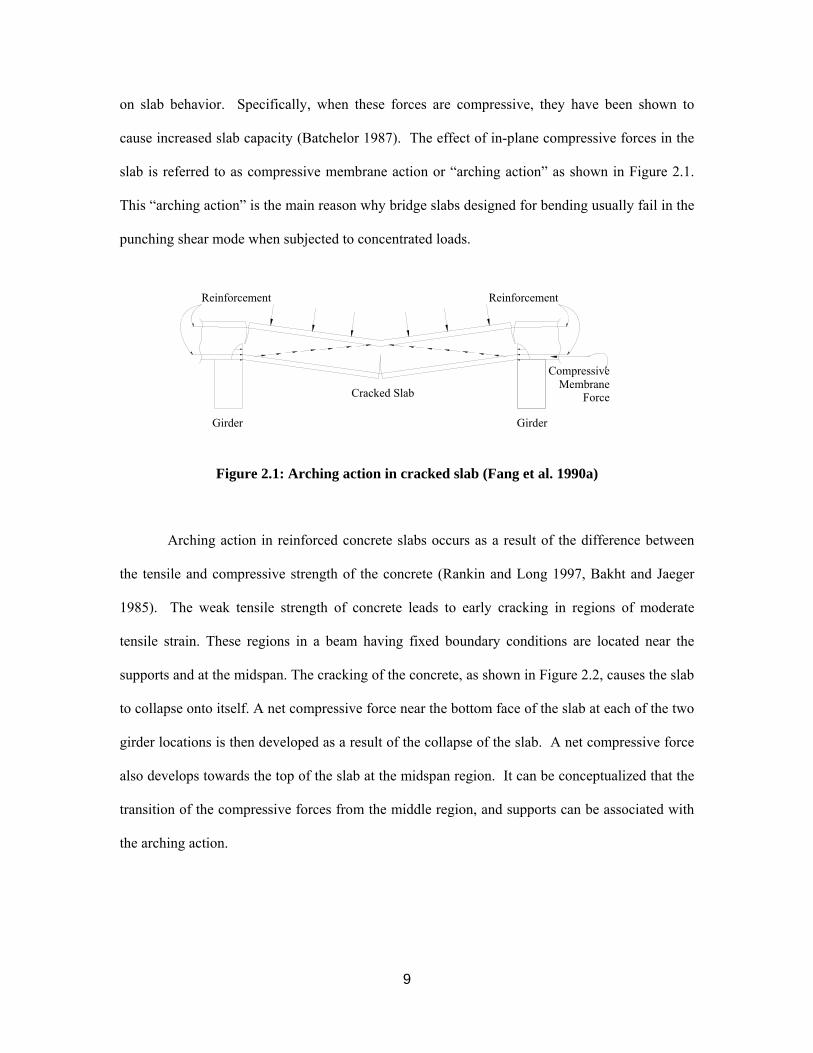
Arching action in reinforced concrete slabs occurs as a result of the difference between
the tensile and compressive strength of the concrete (Rankin and Long 1997, Bakht and Jaeger
1985). The weak tensile strength of concrete leads to early cracking in regions of moderate
tensile strain. These regions in a beam having fixed boundary conditions are located near the
supports and at the midspan. The cracking of the concrete, as shown in Figure 2.2, causes the slab
to collapse onto itself. A net compressive force near the bottom face of the slab at each of the two
girder locations is then developed as a result of the collapse of the slab. A net compressive force
also develops towards the top of the slab at the midspan region. It can be conceptualized that the
transition of the compressive forces from the middle region, and supports can be associated with
the arching action.
10
Figure 2.2: Development of compressive membrane action (Batchelor 1987)
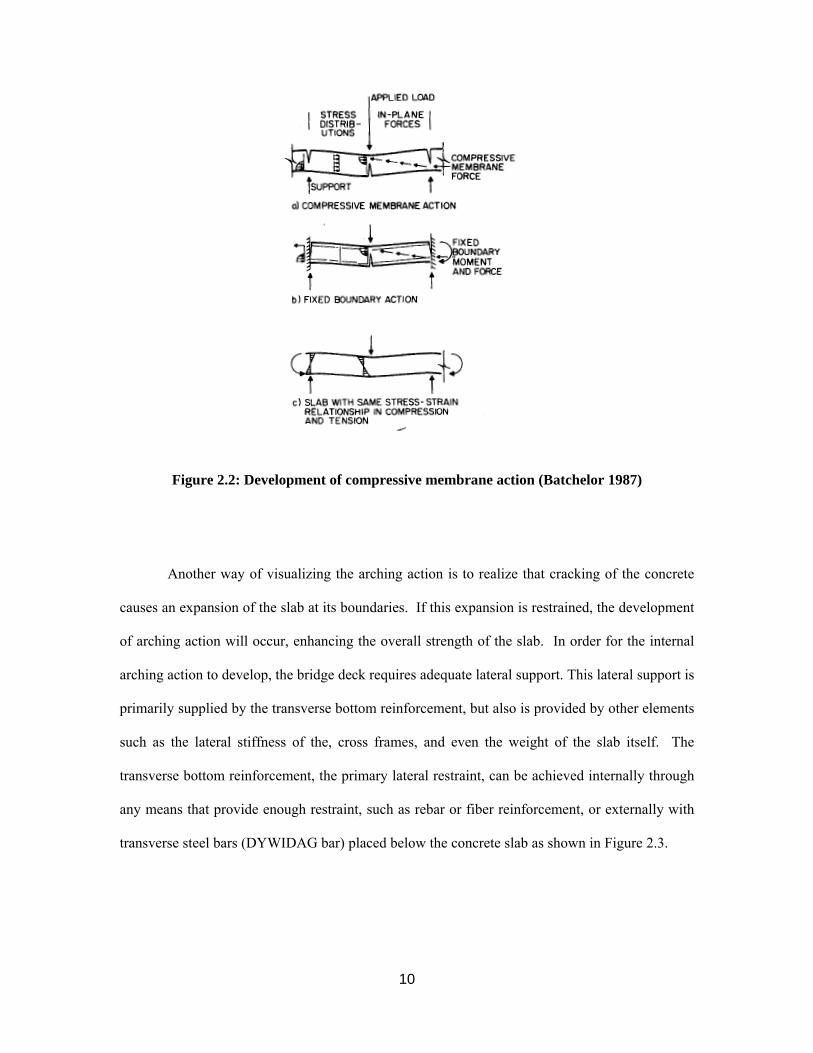
Another way of visualizing the arching action is to realize that cracking of the concrete
causes an expansion of the slab at its boundaries. If this expansion is restrained, the development
of arching action will occur, enhancing the overall strength of the slab. In order for the internal
arching action to develop, the bridge deck requires adequate lateral support. This lateral support is
primarily supplied by the transverse bottom reinforcement, but also is provided by other elements
such as the lateral stiffness of the, cross frames, and even the weight of the slab itself. The
transverse bottom reinforcement, the primary lateral restraint, can be achieved internally through
any means that provide enough restraint, such as rebar or fiber reinforcement, or externally with
transverse steel bars (DYWIDAG bar) placed below the concrete slab as shown in Figure 2.3.
11
Figure 2.3: Transverse bottom reinforcement (Bakht 1996):
Internal reinforcement (b) External reinforcement
It should be noted that the arching action alone cannot support the full wheel load. There
remains a small flexural component, which the specified minimum amount of isotropic
reinforcement is more than adequate to account for. The reinforcement serves a dual role: it
provides for both local flexural resistance and the necessary global restraint required to develop
arching action as previously discussed (Fang 1985, Holowka et al. 1980).
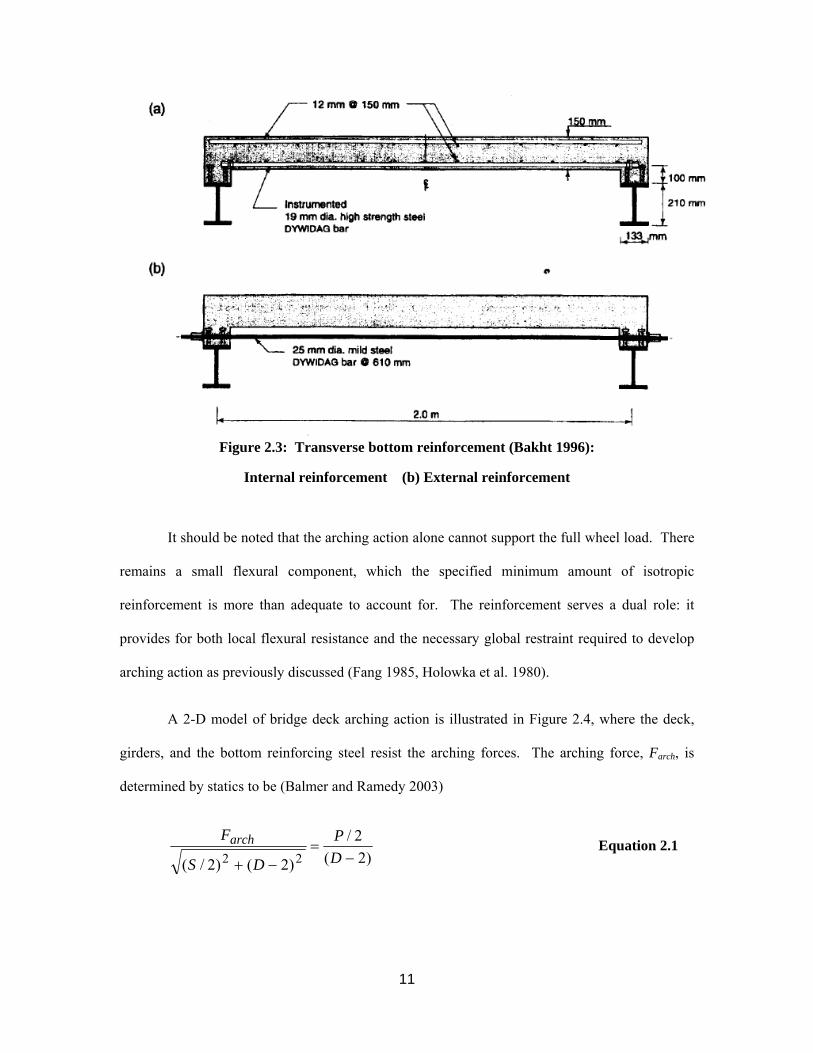
A 2-D model of bridge deck arching action is illustrated in Figure 2.4, where the deck,
girders, and the bottom reinforcing steel resist the arching forces. The arching force, Farch, is
determined by statics to be (Balmer and Ramedy 2003)
)2(2/
)2()2/( 22 −=
−+ DP
DS
Farch Equation 2.1
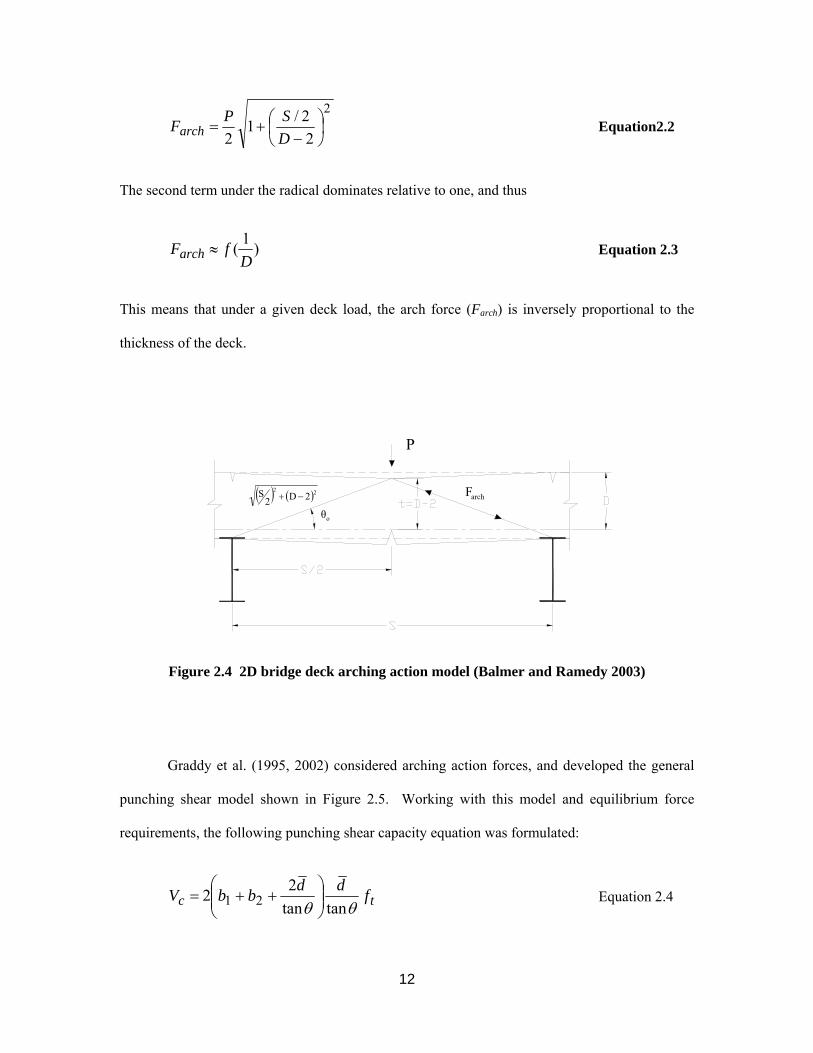
12
( ) ( )222D2
S −+
oθ
archF
P
2
22/1
2⎟⎠⎞
⎜⎝⎛
−+=
DSPFarch Equation2.2
The second term under the radical dominates relative to one, and thus
)1(D
fFarch ≈ Equation 2.3
This means that under a given deck load, the arch force (Farch) is inversely proportional to the
thickness of the deck.
Figure 2.4 2D bridge deck arching action model (Balmer and Ramedy 2003)
Graddy et al. (1995, 2002) considered arching action forces, and developed the general
punching shear model shown in Figure 2.5. Working with this model and equilibrium force
requirements, the following punching shear capacity equation was formulated:
tc fddbbVθθ tantan
22 21 ⎟⎟⎠
⎞⎜⎜⎝
⎛++= Equation 2.4
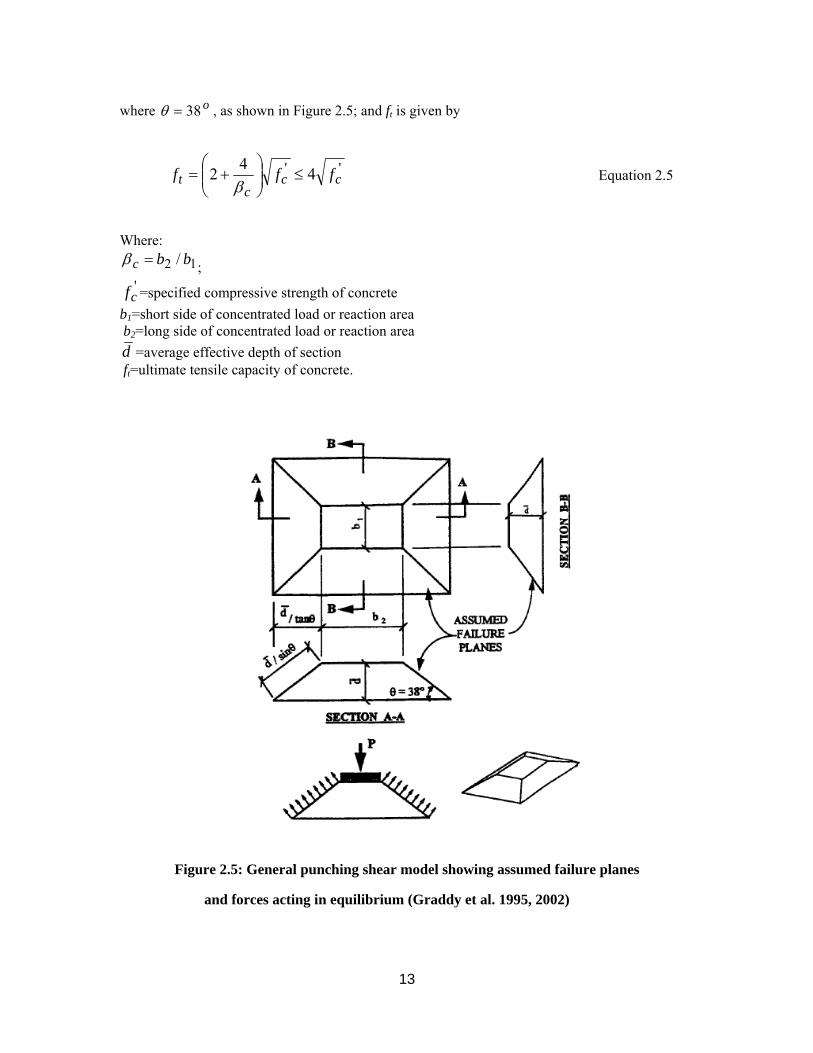
13
where o38=θ , as shown in Figure 2.5; and ft is given by
'' 442 ccc
t fff ≤⎟⎟⎠
⎞⎜⎜⎝
⎛+=β
Equation 2.5
Where: 12 / bbc =β ;
'cf =specified compressive strength of concrete
b1=short side of concentrated load or reaction area b2=long side of concentrated load or reaction area d =average effective depth of section ft=ultimate tensile capacity of concrete.
Figure 2.5: General punching shear model showing assumed failure planes
and forces acting in equilibrium (Graddy et al. 1995, 2002)

14
Hewitt and Batchelor (1975) developed a punching shear model that takes into account
the effects of boundary restraints. A restraint factor, which can be found from experimental tests,
was proposed to predict the punching strength of slabs whose specific boundary restrains are
unkown. The geometry of slab displacement at failure, and the resultant maximum boundary
stresses and forces, are shown in Figure 2.6. The maximum force, Tb, in the tensile reinforcement
is as follows:
yb fahT ρ)( −= Equation 2.5
Where: ρ is the reinforcement ratio Cb, is the maximum compressive force in the concrete is:
⎟⎠⎞
⎜⎝⎛ −=
42maxδhkfCb Equation 2.6
in which k, the ratio of the average stress to the maximum stress fmax, depends on the stress
distribution. An assumed parabolic distribution is used as seen in Figure 2.6, giving a value of
2/3 for k. The maximum allowable compressive stress, fmax , is taken to be 0.85 'cf . From these
values the maximum possible boundary restraints are as follows:
( ) ⎟⎠⎞
⎜⎝⎛ −−−−= ahCahTM bbb δ
323
1632(max) Equation 2.7
and
bbb TCF −=(max) Equation 2.8
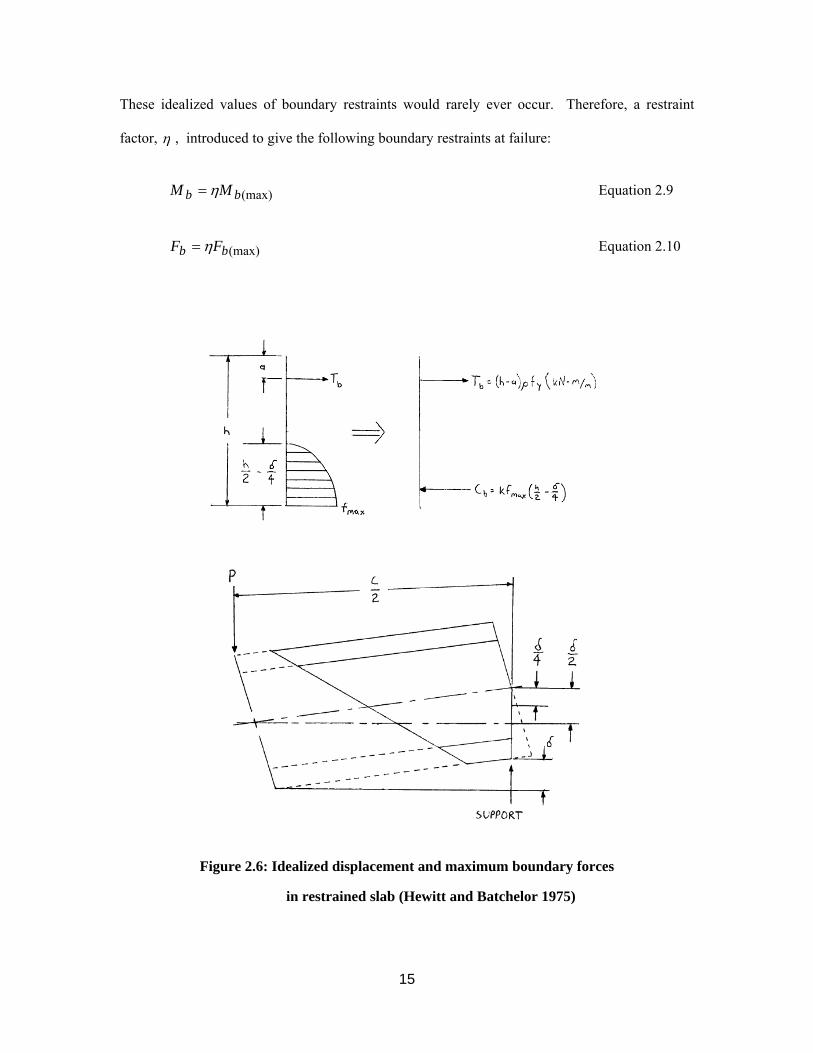
15
These idealized values of boundary restraints would rarely ever occur. Therefore, a restraint
factor, η , introduced to give the following boundary restraints at failure:
(max)bb MM η= Equation 2.9
(max)bb FF η= Equation 2.10
Figure 2.6: Idealized displacement and maximum boundary forces
in restrained slab (Hewitt and Batchelor 1975)

16
The restraint factor, η , varies from zero for simply supported slabs to unity for slabs
with the idealized restraint. The value of η is dependent on the properties of the slab, and the
slab restraining structure, and can be determined empirically.
If a range of values of η for any particular form of restrained slab can be established,
then the lower limit of the factor can be used in determining punching loads for design. If η is
known, the punching load of restrained slabs can be determined using the following steps (Hewitt
and Batchelor 1975): (1) select a value forδ ; (2) calculate Tb and Ccb from Eqs. 4 and 5,
respectively; (3) calculate Mb and Fb from Eqs. 8 and 9, respectively; (4) calculate the theoretical
punching load, P, without correction for dowel and tensile membrane effects, and δ from angle
of rotation of the slab outside shear crack, ψ (Hewitt and Batchelor 1975); (5) calculate Cb from
Eq. 5 using the calculated value forδ ; and (6) if the values of Cb from steps 2 and 5 differ
significantly, recalculate from at step 2, using the calculated value forδ . If the values of Cb are
sufficiently similar, the theoretical punching load is determined.
2.3 Summary of Empirical Bridge Deck Design Specifications
The enhancement in slab strength due to internal arching action has been
incorporated into design standards, including Ontario Highway Bridge Design Code
(OHBDC) (1991), Canadian Highway Bridge Design Code (CSA) (2000), and the
AASHTO LRFD Bridge Design Specifications (1998, 2000).
There is no analysis involved in the empirical design method; deck slabs are
presumed to have met crack control requirements, and to have adequate shear resistance.

17
Reinforcement in the deck is specified in terms of a required area of steel per foot for the
top and bottom layers, both transversely and longitudinally. The empirical design
method is by far the simplest method, provided that the bridge geometry, materials, and
construction techniques satisfy the given criteria. If the configuration allows the
empirical method to be used, only a few simple equations are calculated to determine the
required reinforcement (BridgeSight Software 1999).
All available test data indicate that the factor of safety of a deck designed by the flexural
method specified in the 16th edition of the AASHTO Standard Specifications, working stress
design, is at least 10.0 (AASHTO LRFD 1998, 2000). Tests indicate a comparable factor of
safety of about 8.0 for an empirical design. Therefore, even the empirical design method
possesses a large amount of reserve strength.
Physical tests and analytical investigations indicate that the most important parameter
affecting the resistance of concrete slabs to wheel loads is the ratio between the effective length
and the depth of the slab (AASHTO LRFD 2000, Csagoly and Lybas 1989). Failure loads
increase as this ratio decreases. Here, the effective length of slab is taken as:
(a) for slabs monolithic with walls or beams: the face-to-face distance; and
(b) for slabs supported on steel or concrete girders: the distance between flange tips, plus the flange overhang, taken as the distance from the extreme flange tip to the face of the web, disregarding any fillets
In the case of non-uniform spacing of supporting components, the effective length,
Seffective, is taken as the larger of the deck lengths at the two locations shown in Figure 2.7. No
supporting data exists for effective lengths exceeding 13.5 ft. The minimum depth of the slab is
not less than 7.0 inches, excluding a sacrificial wearing surface where applicable. The 7.0 inch
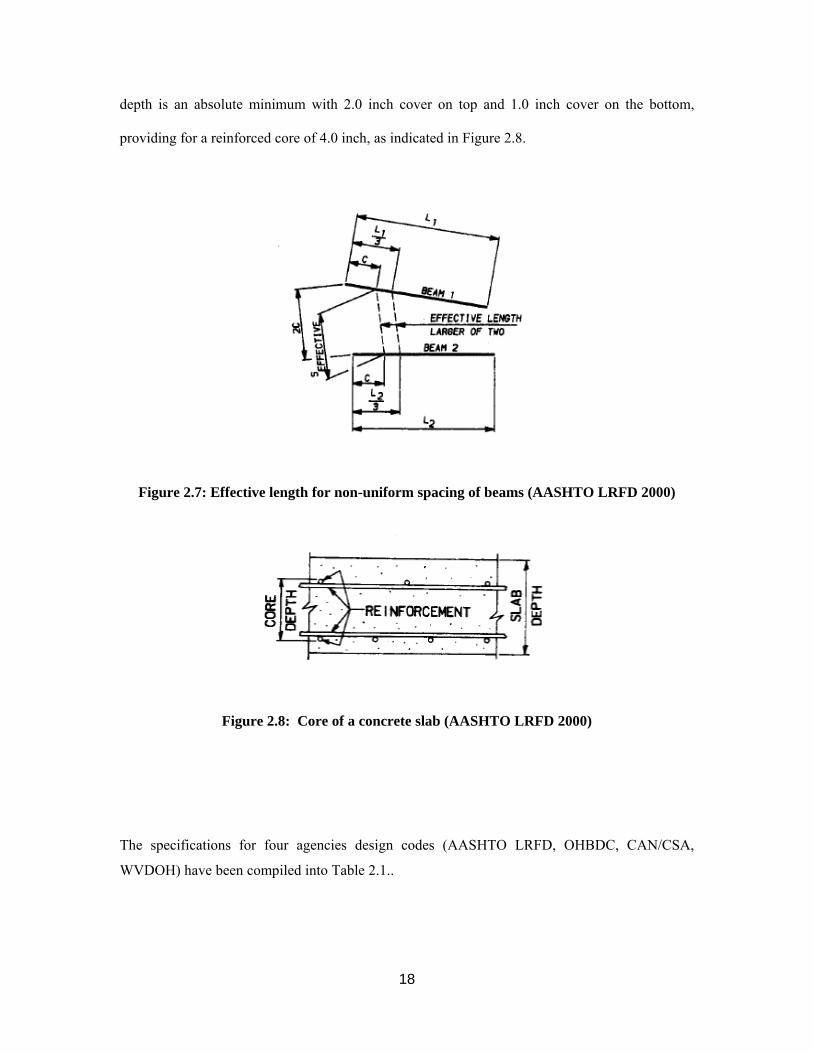
18
depth is an absolute minimum with 2.0 inch cover on top and 1.0 inch cover on the bottom,
providing for a reinforced core of 4.0 inch, as indicated in Figure 2.8.
Figure 2.7: Effective length for non-uniform spacing of beams (AASHTO LRFD 2000)
Figure 2.8: Core of a concrete slab (AASHTO LRFD 2000)
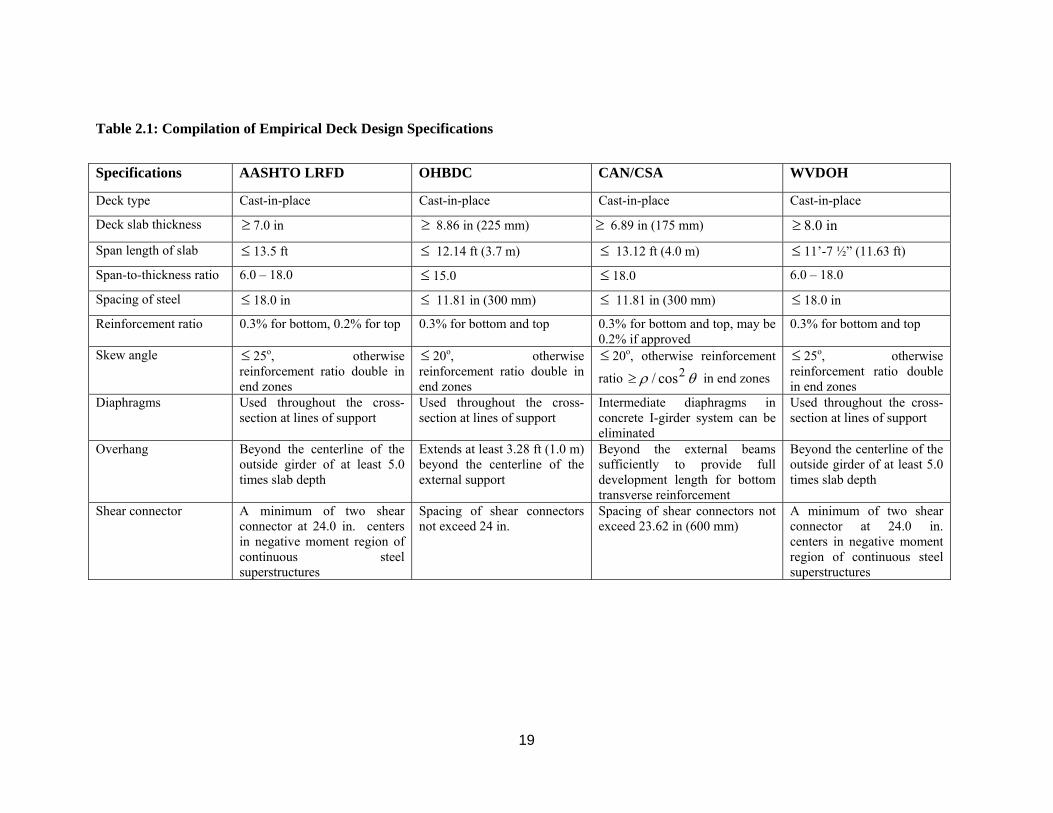
The specifications for four agencies design codes (AASHTO LRFD, OHBDC, CAN/CSA,
WVDOH) have been compiled into Table 2.1..
19
Table 2.1: Compilation of Empirical Deck Design Specifications
Specifications AASHTO LRFD OHBDC CAN/CSA WVDOH
Deck type Cast-in-place Cast-in-place Cast-in-place Cast-in-place
Deck slab thickness ≥ 7.0 in ≥ 8.86 in (225 mm) ≥ 6.89 in (175 mm) ≥ 8.0 in
Span length of slab ≤ 13.5 ft ≤ 12.14 ft (3.7 m) ≤ 13.12 ft (4.0 m) ≤ 11’-7 ½” (11.63 ft) Span-to-thickness ratio 6.0 – 18.0 ≤ 15.0 ≤ 18.0 6.0 – 18.0
Spacing of steel ≤ 18.0 in ≤ 11.81 in (300 mm) ≤ 11.81 in (300 mm) ≤ 18.0 in
Reinforcement ratio 0.3% for bottom, 0.2% for top 0.3% for bottom and top 0.3% for bottom and top, may be 0.2% if approved
0.3% for bottom and top
Skew angle ≤ 25o, otherwise reinforcement ratio double in end zones
≤ 20o, otherwise reinforcement ratio double in end zones
≤ 20o, otherwise reinforcement
ratio θρ 2cos/≥ in end zones
≤ 25o, otherwise reinforcement ratio double in end zones
Diaphragms Used throughout the cross-section at lines of support
Used throughout the cross-section at lines of support
Intermediate diaphragms in concrete I-girder system can be eliminated
Used throughout the cross-section at lines of support
Overhang Beyond the centerline of the outside girder of at least 5.0 times slab depth
Extends at least 3.28 ft (1.0 m) beyond the centerline of the external support
Beyond the external beams sufficiently to provide full development length for bottom transverse reinforcement
Beyond the centerline of the outside girder of at least 5.0 times slab depth
Shear connector A minimum of two shear connector at 24.0 in. centers in negative moment region of continuous steel superstructures
Spacing of shear connectors not exceed 24 in.
Spacing of shear connectors not exceed 23.62 in (600 mm)
A minimum of two shear connector at 24.0 in. centers in negative moment region of continuous steel superstructures

20
2.4 Overview of Previous Testing
Advanced Design Method for Concrete Bridge Deck Slabs
(Csagoly and Lybas, 1989)
Testing was not performed specifically for this publication, rather a collection of relevant testing
was gathered, analyzed and applied to deck design methods. The paper gives descriptions and results of
tests done in Canada, New York, and Florida. All of these tests were geared towards understanding
arching action enough to incorporate the extra strength gained into future codes.
Canadian Testing
Early tests in Canada were carried out on over 40 existing bridges. Trailer vehicles able to apply a
100,000 pound concentrated load, over two 10-inch square neoprene pads spaced 3 inches apart. These
pads simulated a wheel assembly of two tires. Deflections were measured by LVDT’s, which were also
attached to a 12 foot bar that stretched from girder to girder. Of the bridges tested only two failures were
reported, both on the same bridge. Upon further investigation these were attributed to severe deterioration
of the concrete bridge deck. The deck had undergone extensive exposure to de-icing chemicals,
corrosion, and freeze thaw action. The other bridges all withstood the 100,000 pound load without any
significant damage.
Model Testing was also carried out by Canadian scientists. A total of 14, 1/8 scale I-beam bridge
slab models were constructed that consisted of a four beam bridge having a 10 foot span. The deck slabs
were made up of isotropic, orthotropic, and unreinforced slabs all subdivided into single testing panels.
Each panel was then tested individually by applying a concentrated load through a steel bearing plate
resting on a neoprene pad. Of the 68 tests performed on the panels, all but one of the reinforced panels
21
failed due to punching shear. Many of the unreinforced slabs demonstrated the punching shear failure, but
not enough to be conclusive.
Since fatigue strength of decks designed empirically had not been extensively studied, five of the
nine model bridges were subjected to a simulated fatigue load. For fatigue tests the panel’s reinforcement
distribution, loading apparatus, and overall layout of the model remained the same. The crack patterns
demonstrated by the fatigue loading matched the patterns from the static loading. The cracks were
observed to widen and spread as the number of cycles was increased. These cracks always remained
inside the boundaries of the panel being tested. From the tests, the fatigue loading was found to be 40% of
the static strength. This was deemed acceptable since the static load was approximately three times the
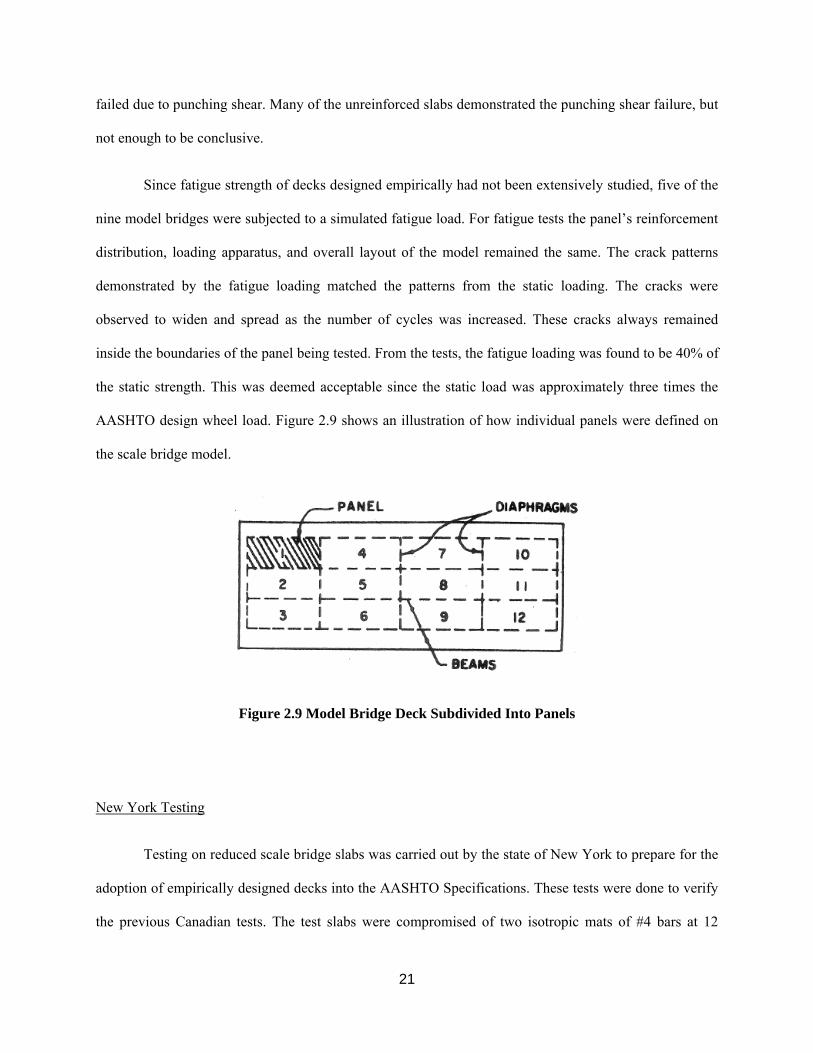
AASHTO design wheel load. Figure 2.9 shows an illustration of how individual panels were defined on
the scale bridge model.
Figure 2.9 Model Bridge Deck Subdivided Into Panels
New York Testing
Testing on reduced scale bridge slabs was carried out by the state of New York to prepare for the
adoption of empirically designed decks into the AASHTO Specifications. These tests were done to verify
the previous Canadian tests. The test slabs were compromised of two isotropic mats of #4 bars at 12
22
inches on center, which is approximately 0.3% reinforcement. Tests were carried out with a similar
procedure to the model testing conducted in Canada. The results were similar to previous efforts with
slabs failing due to punching shear at approximately six times the current design wheel load.
Texas Testing
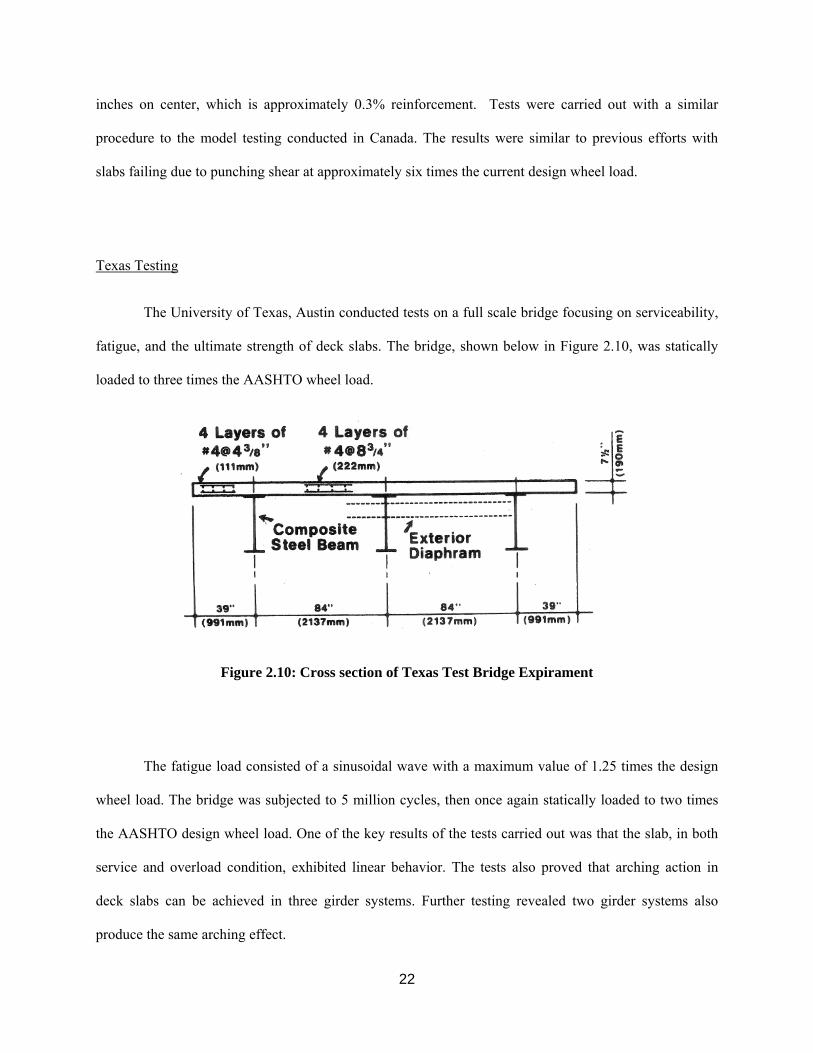
The University of Texas, Austin conducted tests on a full scale bridge focusing on serviceability,
fatigue, and the ultimate strength of deck slabs. The bridge, shown below in Figure 2.10, was statically
loaded to three times the AASHTO wheel load.
Figure 2.10: Cross section of Texas Test Bridge Expirament
The fatigue load consisted of a sinusoidal wave with a maximum value of 1.25 times the design
wheel load. The bridge was subjected to 5 million cycles, then once again statically loaded to two times
the AASHTO design wheel load. One of the key results of the tests carried out was that the slab, in both
service and overload condition, exhibited linear behavior. The tests also proved that arching action in
deck slabs can be achieved in three girder systems. Further testing revealed two girder systems also
produce the same arching effect.
23
Florida Testing
Testing was carried out in Florida to determine whether a thinner concrete deck, compared to
Canada’s provisions, could be used. Florida’s climate, free from winter weather, provides an ideal
location for the implementation of reduced thickness deck slabs. The tests also focused on concrete
girders, known as bulbed tees. These girders proved to be problematic when calculating effective length
and slab thickness ratios. The last focus of the testing was the application of loads on overhang portions
of the deck. Previously there were no efforts in analyzing loads applied to overhang portions and their
effect on the reduced reinforcement slabs.
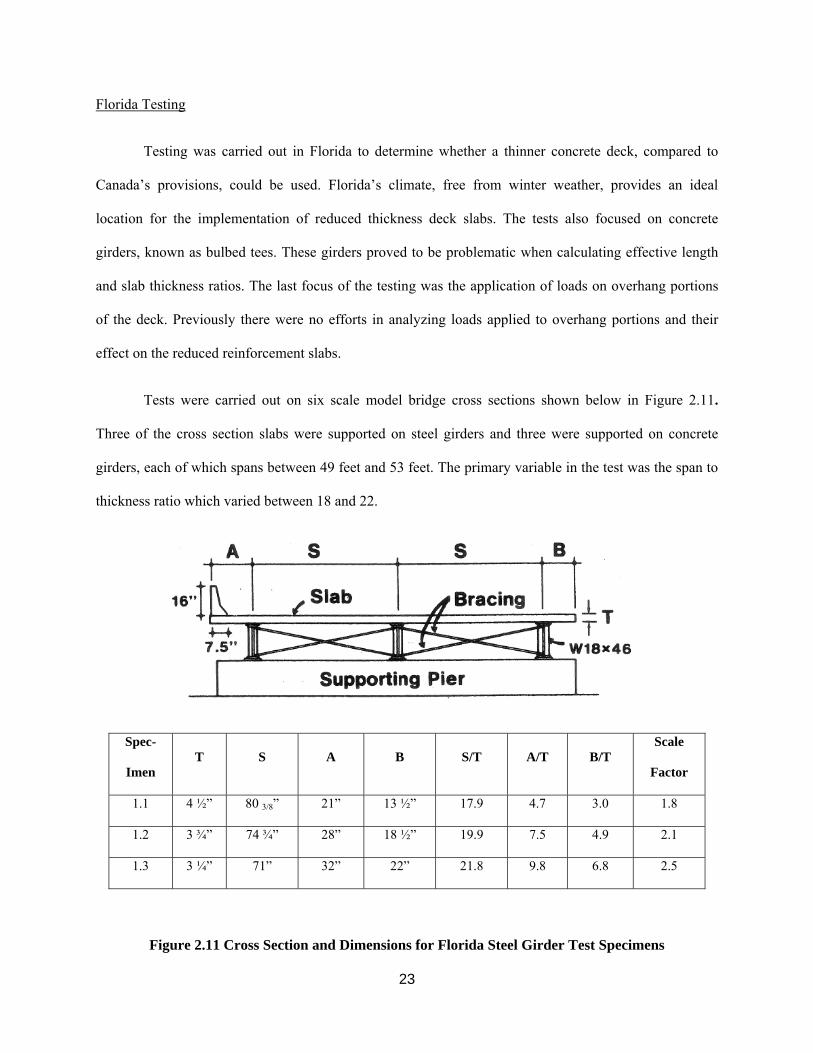
Tests were carried out on six scale model bridge cross sections shown below in Figure 2.11.
Three of the cross section slabs were supported on steel girders and three were supported on concrete
girders, each of which spans between 49 feet and 53 feet. The primary variable in the test was the span to
thickness ratio which varied between 18 and 22.
Spec-
Imen T S A B S/T A/T B/T
Scale
Factor
1.1 4 ½” 80 3/8” 21” 13 ½” 17.9 4.7 3.0 1.8
1.2 3 ¾” 74 ¾” 28” 18 ½” 19.9 7.5 4.9 2.1
1.3 3 ¼” 71” 32” 22” 21.8 9.8 6.8 2.5
Figure 2.11 Cross Section and Dimensions for Florida Steel Girder Test Specimens

24
The specimens were loaded statically until failure using a concentrated load meant to model dual
tires. Deflections were recorded during loading at 15 random points to form a deflection surface that
could later be analyzed in order to obtain the degree of edge restraint. The results of some of the tests,
especially tests done on the concrete girders are still pending. The load tests that had been completed
along the edges showed that there is substantial strength when loaded in this manner, and that the parapet
interacts heavily with the slab.
The True Behavior of Thin Concrete Bridge Slabs
(Csagoly, Holowka, and Dorton 1978)
Tests were carried out by the Ministry of Transportation in Ontario, Canada to validate the
previous research on arching effects in deck slabs. The authors wanted to verify the punching shear
failure mechanism in the overload situation. Another goal was to determine the different parameters
affecting the edge restrain factor. From these parameters lower bound values of the restraint factors could
then be formulated
Testing were carried out on 40 existing bridges that were selected based upon parameters such as
span, slab thickness, age, deterioration, bridge type, and reinforcing ratio. A database was then compiled
that placed each bridge into one of the four categories shown below.
Type
A Non-composite steel girder and concrete slab
B Composite steel girder and concrete slab
C Concrete beam and slab (monolithic)
D Composite AASHTO girders and concrete slab

25
The application of loads was carried out by a test vehicle capable of delivering a 100 kip load.
The contact area of the load was two-10 inch squares spaced 3 inches apart; this simulated a dual wheel
assembly. Deflections were measured by mounting LVDT’s on an aluminum bar that spanned the width
of the traffic lane. Concrete cores were also sampled at, or near, the point of loading to obtain the actual
strength of the deck.
All but two of the tests carried out withstood the 100 kip concentrated loads. In both cases the
concrete was so deteriorated that core samples could not be taken. During and after the load application
no serious cracking was observed, although hairline cracks appeared under the point of application but
disappeared after unloading.
By comparing actual to theoretical deflections, the restraint factor was obtained. The actual
deflections were compared to those obtained from using a restraint factor of 0.0, 0.25, 0.50, and 0.75. For
each bridge, the restraint factor was found and then averaged together with bridges of similar type, the
results are shown below in Table 2.2.
Table 2.2 Observed Restraint Factors of Existing Bridges
Type A – Non-composite
steel girder and concrete
slab
Type B – Composite steel
girder and concrete slab
Type C – Composite
concrete beam and slab
Type D – AASHTO girder
and slab – composite
0.41 0.93 0.78 0.83
The authors selected lower bound values to match the results of the average restraint values. A general
conclusion was made that values of 0.25 for non composite decks and 0.50 for composite decks could be

26
assumed for design purposes. It was also noted that 0.2% reinforcement would provide enough strength
but 0.3% reinforcement should be used for better crack control. A final comparison of restraint factors,
reinforcement amounts, and overall factor of safety was then compiled and shown below in Table 2.3.
Table 2.3: Factor of Safety for Various Decks
Behavior of Isotropic R/C Bridge Decks on Steel Girders
(Fang, Worley, Burns, and Klingner 1990)
And
Fatigue Behavior of Cast-in-Place and Precast Panel Bridge Decks With Isotropic Reinforcement
(Fang, Tsui, Burns, and Klingner 1990)
The effects of fatigue both for cast-in-place (CIP) decks and precast panel decks is an issue that
has been unexplored through full-scale testing. Most of the previous fatigue tests were carried out on
small-scale models or isolated panels, and their effects on actual bridges is unknown. The main focus of
the testing was to investigate the fatigue behavior, both pre- and post-, of both types of decking systems
using a large scale bridge deck with realistic support conditions. From that testing, an analytical model
was to be formed to compare models to full scale bridges. Once the model was developed, a parametric
study was preformed that investigated the effect of diaphragm spacing on the internal arching action.
27
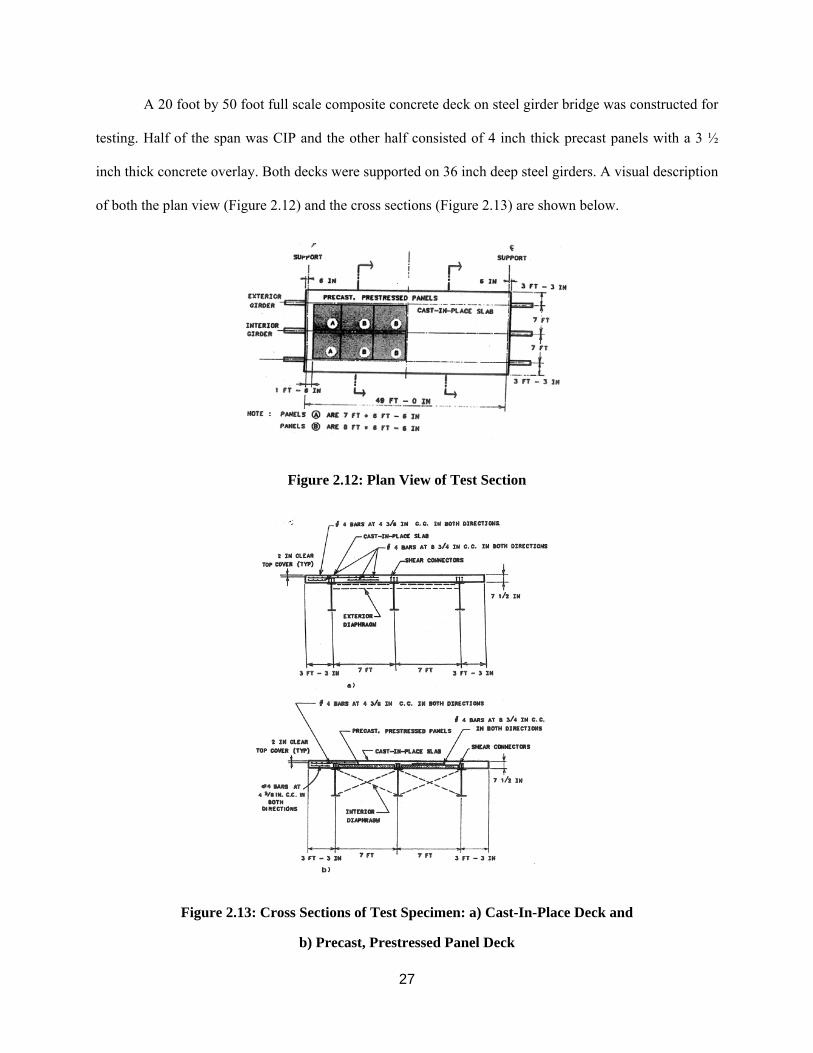
A 20 foot by 50 foot full scale composite concrete deck on steel girder bridge was constructed for
testing. Half of the span was CIP and the other half consisted of 4 inch thick precast panels with a 3 ½
inch thick concrete overlay. Both decks were supported on 36 inch deep steel girders. A visual description
of both the plan view (Figure 2.12) and the cross sections (Figure 2.13) are shown below.
Figure 2.12: Plan View of Test Section
Figure 2.13: Cross Sections of Test Specimen: a) Cast-In-Place Deck and
b) Precast, Prestressed Panel Deck
28
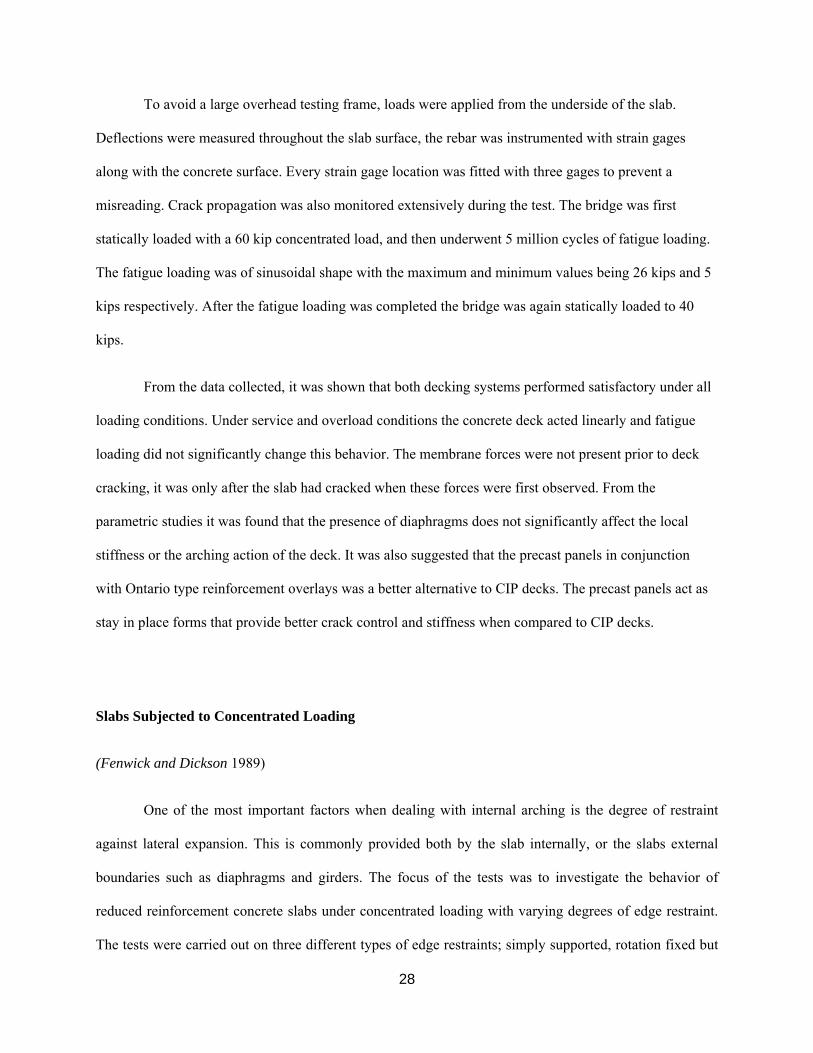
To avoid a large overhead testing frame, loads were applied from the underside of the slab.
Deflections were measured throughout the slab surface, the rebar was instrumented with strain gages
along with the concrete surface. Every strain gage location was fitted with three gages to prevent a
misreading. Crack propagation was also monitored extensively during the test. The bridge was first
statically loaded with a 60 kip concentrated load, and then underwent 5 million cycles of fatigue loading.
The fatigue loading was of sinusoidal shape with the maximum and minimum values being 26 kips and 5
kips respectively. After the fatigue loading was completed the bridge was again statically loaded to 40
kips.
From the data collected, it was shown that both decking systems performed satisfactory under all
loading conditions. Under service and overload conditions the concrete deck acted linearly and fatigue
loading did not significantly change this behavior. The membrane forces were not present prior to deck
cracking, it was only after the slab had cracked when these forces were first observed. From the
parametric studies it was found that the presence of diaphragms does not significantly affect the local
stiffness or the arching action of the deck. It was also suggested that the precast panels in conjunction
with Ontario type reinforcement overlays was a better alternative to CIP decks. The precast panels act as
stay in place forms that provide better crack control and stiffness when compared to CIP decks.
Slabs Subjected to Concentrated Loading
(Fenwick and Dickson 1989)
One of the most important factors when dealing with internal arching is the degree of restraint
against lateral expansion. This is commonly provided both by the slab internally, or the slabs external
boundaries such as diaphragms and girders. The focus of the tests was to investigate the behavior of
reduced reinforcement concrete slabs under concentrated loading with varying degrees of edge restraint.
The tests were carried out on three different types of edge restraints; simply supported, rotation fixed but
29
free to undergo lateral displacement, and fully fixed with both rotation and lateral displacement
prohibited.
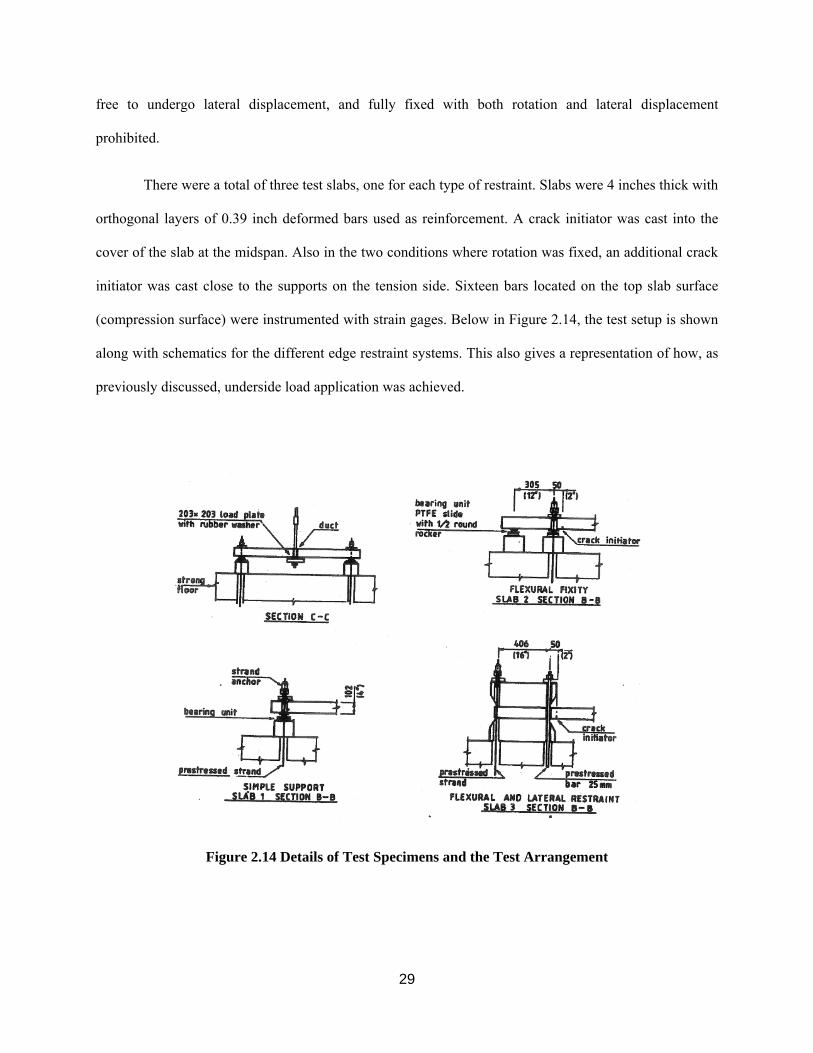
There were a total of three test slabs, one for each type of restraint. Slabs were 4 inches thick with
orthogonal layers of 0.39 inch deformed bars used as reinforcement. A crack initiator was cast into the
cover of the slab at the midspan. Also in the two conditions where rotation was fixed, an additional crack
initiator was cast close to the supports on the tension side. Sixteen bars located on the top slab surface
(compression surface) were instrumented with strain gages. Below in Figure 2.14, the test setup is shown
along with schematics for the different edge restraint systems. This also gives a representation of how, as
previously discussed, underside load application was achieved.
Figure 2.14 Details of Test Specimens and the Test Arrangement
30
The slab was loaded in a manner that promoted a state of uniform cracking. The first load was
applied at the center of the span along the centerline of the deck. The load was then moved 24 inches to
either side along the centerline for positions two and three. After loading at these positions the full load
was applied at the first position and the slab was tested to failure. The punching shear failure loads were
then compared to the theoretical values obtained using ACI-318 punching shear strength equation and
yield line analysis. Table 2.4 shows the results of both the testing and theoretical analysis.
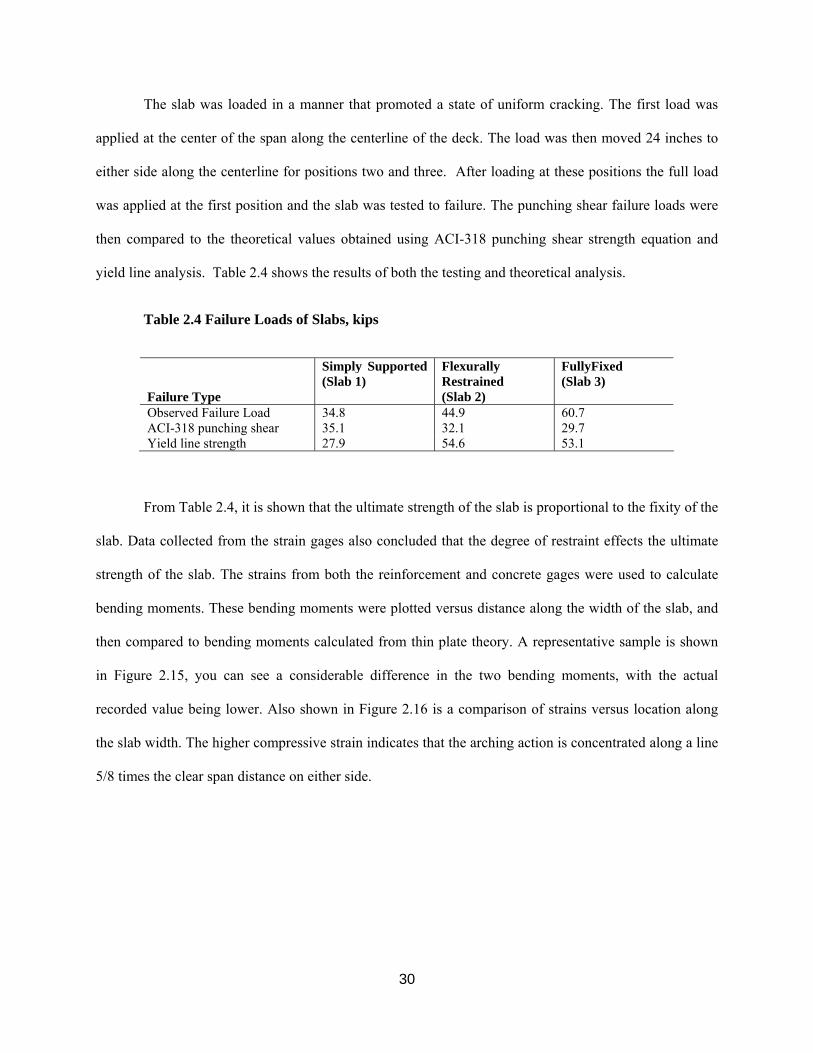
Table 2.4 Failure Loads of Slabs, kips
Failure Type
Simply Supported (Slab 1)
Flexurally Restrained (Slab 2)
FullyFixed (Slab 3)
Observed Failure Load 34.8 44.9 60.7 ACI-318 punching shear 35.1 32.1 29.7 Yield line strength 27.9 54.6 53.1
From Table 2.4, it is shown that the ultimate strength of the slab is proportional to the fixity of the
slab. Data collected from the strain gages also concluded that the degree of restraint effects the ultimate
strength of the slab. The strains from both the reinforcement and concrete gages were used to calculate
bending moments. These bending moments were plotted versus distance along the width of the slab, and
then compared to bending moments calculated from thin plate theory. A representative sample is shown
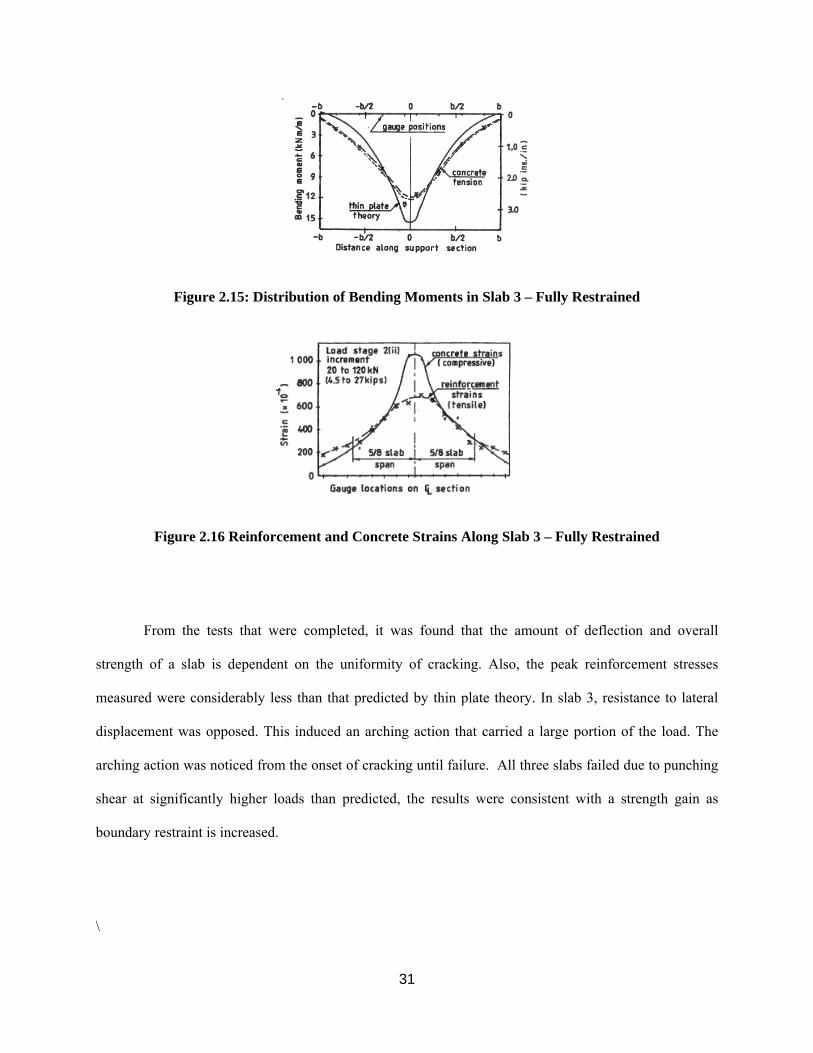
in Figure 2.15, you can see a considerable difference in the two bending moments, with the actual
recorded value being lower. Also shown in Figure 2.16 is a comparison of strains versus location along
the slab width. The higher compressive strain indicates that the arching action is concentrated along a line
5/8 times the clear span distance on either side.
31
Figure 2.15: Distribution of Bending Moments in Slab 3 – Fully Restrained
Figure 2.16 Reinforcement and Concrete Strains Along Slab 3 – Fully Restrained
From the tests that were completed, it was found that the amount of deflection and overall
strength of a slab is dependent on the uniformity of cracking. Also, the peak reinforcement stresses
measured were considerably less than that predicted by thin plate theory. In slab 3, resistance to lateral
displacement was opposed. This induced an arching action that carried a large portion of the load. The
arching action was noticed from the onset of cracking until failure. All three slabs failed due to punching
shear at significantly higher loads than predicted, the results were consistent with a strength gain as
boundary restraint is increased.
\

32
Testing of a Trapezoidal Box Girder Bridge
(Holowka 1981)
The Ontario Ministry of Transportation investigated the behavior of a full scale trapezoidal box
girder bridge under construction loads, live loads, and also monitored the effect of temperature changes.
While not the primary focus of the testing, the behavior of Ontario style decks was monitored. Another
key focus of this test was the evaluation of bonds between two concrete lifts that comprised the deck.
The superstructure of the bridge consisted of two steel trapezoidal box girders and a composite
deck slab. The deck was 8 inches thick, consisting of a 6 inch base lift and 2 inch overlay bonded together
by a cement/sand slurry mix. The two-layer deck construction used is very similar to the WVDOH two
lift deck made up of 6 ½ inch and 2 inch lifts. Reinforcement was provided by #4 bars at 10 inches on
center, this reinforcement was contained entirely in the 6 inch bottom lift. An effective depth of 6 ½
inches provided a reinforcement ratio of four isotropic layers each at 0.3%. Stay in place (SIP) metal
forms were used for areas inside the box girders and the overhangs were poured using removable
plywood forms.
To implement strain gages on the reinforcement, the bars had to first be ground smooth in areas
where the strain gage would contact the steel. The grinding resulted in a non uniform cross section
requiring each bar to be tested individually before placing them in the deck. In areas of particular
interests, bond indicators were also placed in the positive and negative moment regions. Core drillings
were first removed from the cured, two lift deck. A core of the same size as the one removed from the
deck was then casted, but was done so in one lift. The replacement core was then instrumented with strain
gages and placed back into the deck. The theory is that if there is no bond the solid replacement core will
shear and strain gages will stop recording data. If data is being recorded it means that the bond is intact.
This is a fairly inexpensive, and reliable method for measuring bonding between two layers of concrete.
To apply the concentrated loads needed for the test special trailers with hydraulic rams were used. The
33
hydraulic rams delivered a maximum of 100 kip force concentrated in a 10 inch square. This load was
placed at 14 different locations that varied along both the span length and slab width.
The only significant values of reinforcing steel strains occurred in the transverse bars that were
located underneath the concentrated loads. Even though the concentrated load was 4.8 times greater than
the AASHTO wheel load, all measured stresses in the reinforcement were less than the limiting values`
for working stress design according to those set by AASHTO Specifications. In total there were 10 places
that bond indicators were used, and no failure between the two layers was indicated under the
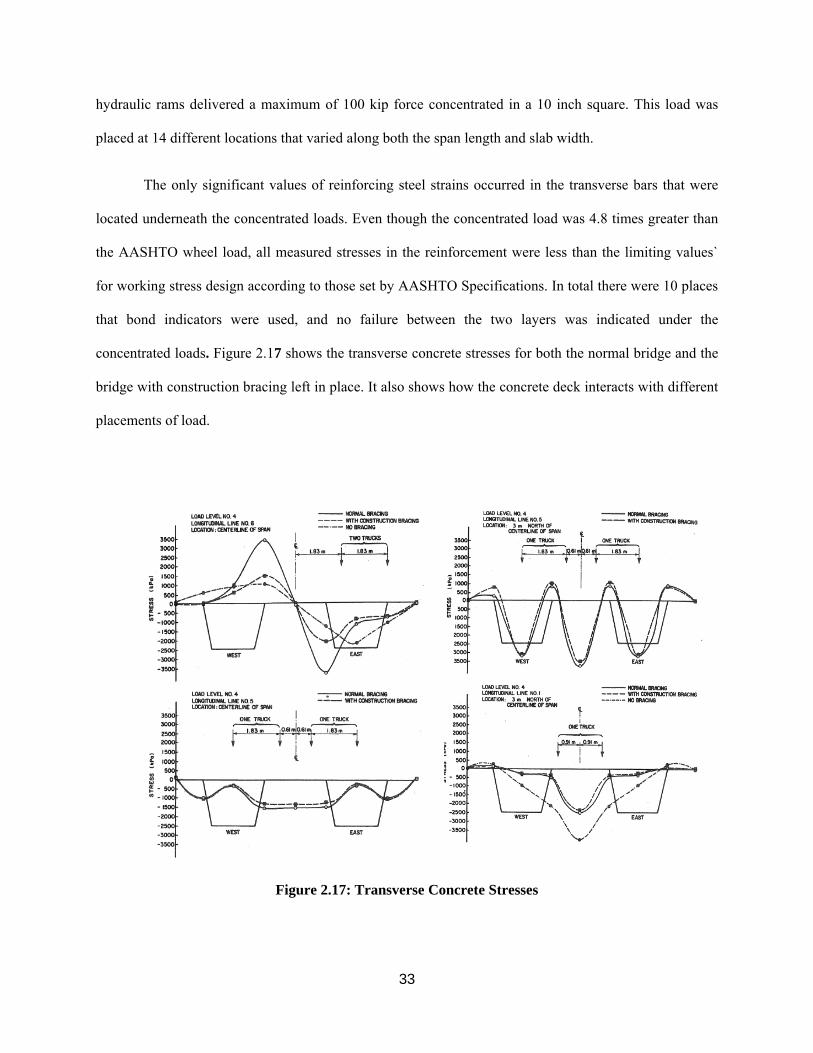
concentrated loads. Figure 2.17 shows the transverse concrete stresses for both the normal bridge and the
bridge with construction bracing left in place. It also shows how the concrete deck interacts with different
placements of load.
Figure 2.17: Transverse Concrete Stresses
34
Form the tests it was found that the bond between the two layers is adequate to withstand the
design loads that are currently specified. The deck which contains 0.3% reinforcement proved to
withstand the load but did exhibit some longitudinal cracking along the interior of the top flanges. This
can be overcome keeping construction bracing in place permanently.
Testing of Prestressed Concrete AASHTO Girder Bridges
(Holowka 1980)
Arching action is a well documented phenomenon with adequately restrained slabs. Previous tests
have all been carried out on systems that contain diaphragms which add to the lateral restraint of the slab.
There have been little, or no, previous efforts to investigate the behavior of slabs without the presence of
diaphragms. Tests were carried out on slabs unsupported by cross frames, with the primary focus to
document reduced reinforcement decks response due to concentrated loads. Instrumentation was also used
to verify the presence of internal arching, and its effect on slab strength.
The tests were carried out on a full scale concrete girder bridge with three main spans of 60 feet,
70 feet, and 60 feet, respectivley. The concrete deck was 7 ½ inches thick with a 3 inch protective layer of
asphalt. For the reinforcement, #4 bars spaced at 11 inches on center were used in the longitudinal and
transverse directions for both the top and bottom surfaces.
Instrumentation on the bridge consisted of strain gages attached to the reinforcing steel and
sensors to monitor vertical displacement of the bridge. The strain gages used with the steel reinforcing
consisted of two T-rosettes on opposite sides of the bar. This was done to be sure that only axial forces
were being measured. These strain gages were placed on transverse bars at midspan between the girders
in both the positive and negative moment regions. Vertical displacements were monitored at nine
different locations across the bridge.
35
A concentrated load of 100 kips was applied by a specialized testing vehicle similar to those
previously discussed. The 10 inch square concentrated load was gradually applied by the actuator. A
small cycle of load was used until deflections stabilized, or no further displacement had occurred.
From these tests, even in the absence of diaphragms, enough lateral restraint was developed to
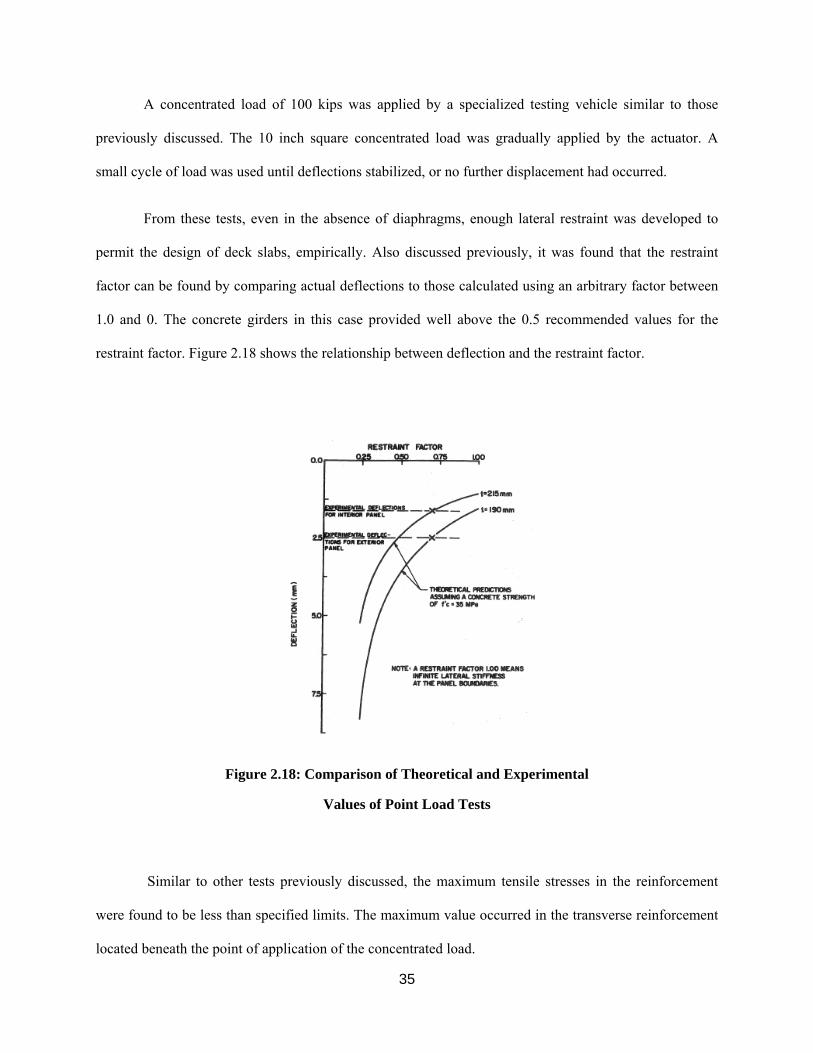
permit the design of deck slabs, empirically. Also discussed previously, it was found that the restraint
factor can be found by comparing actual deflections to those calculated using an arbitrary factor between
1.0 and 0. The concrete girders in this case provided well above the 0.5 recommended values for the
restraint factor. Figure 2.18 shows the relationship between deflection and the restraint factor.
Figure 2.18: Comparison of Theoretical and Experimental
Values of Point Load Tests
Similar to other tests previously discussed, the maximum tensile stresses in the reinforcement
were found to be less than specified limits. The maximum value occurred in the transverse reinforcement
located beneath the point of application of the concentrated load.

36
The Conesogo River Bridge – Design and Testing
(Dorton and Holowka 1977)
In order for Canada to adopt an empirical procedure for their design code, tests on a full scale
bridge were carried out to verify that internal arching provided an adequate strength increase with reduced
reinforcement ratios. The entire bridge served as a testing platform for other projects, such as studies into
shear connectors and load distribution. There were also laboratory testing completed on deck slabs during
the design and construction phases of the bridge.
The bridge was a three span bridge, with each span having lengths of 114 feet, 145 feet, and 114
feet, respectively. The deck slab varied between 7 inches and 8 inches in thickness along the span of the
bridge and was composite with the steel girders. There was longitudinal deck prestressing was present to
prevent cracking in the negative moment region. One half of the bridge contained 12 test panels with
different thicknesses 7 inches, 7 ½ inches, and 8 inches. For each slab thickness, a test slab was prepared
with each of the following reinforcement ratios: 0.95%, 0.6%, 0.3%, and 0.2%.
Lab experiments were carried out on test slabs to validate the design assumption for the restraint
factor equal to 0.5. The slabs tested were circular, 22 ½ inches in diameter, with similar span-to- thickness
ratio as the bridge panels. Three different reinforcement ratios, 1.0%, 0.3%, and 0.2%, were tested. The
tests all validated the assumption that 0.5 was a safe design value and tests were carried out on full scale
models. A variety of 28 slabs were tested, and it was found that the minimum restraint factor value was
0.75, far greater than 0.5.
The tests carried out on the full scale bridge deck showed that all of the panels tested withstood a
95 kip concentrated load. By cycling the test load it was also shown that the concrete deck remained
elastic in behavior. The deflections were calculated and compared to theoretical deflections using a
restraint factor of 0.5. The results were graphed below in Figure 2.19. Note that in the graph, the actual
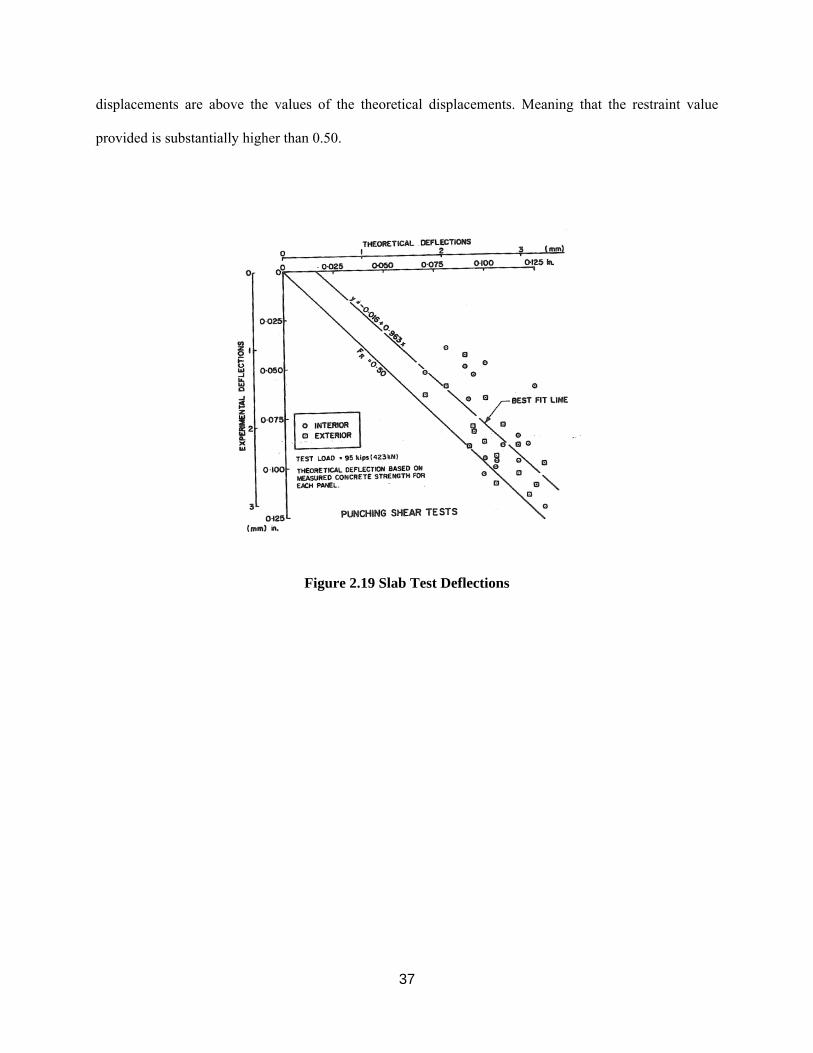
37
displacements are above the values of the theoretical displacements. Meaning that the restraint value
provided is substantially higher than 0.50.
Figure 2.19 Slab Test Deflections

38
2.5 Conclusions
From previous research it has been shown that the empirically designed slabs exhibit overall
capacity exceeding their analytical capacity. These reduced reinforcement deck slabs, when compared
with slabs designed by the traditional method, can offer savings in material costs and reduction in the
susceptibility to corrosion. The phenomenon of internal arching has been widely accepted through these
research efforts and is now finding its way into many agencies design codes.
The research presented in this literature review was chosen from previous work done in the area
compressive membrane action. The papers represented in this chapter focus on testing that were
conducted on large scale bridge cross sections. From these archival papers a comprehensive testing plan
was formulated to better understand the capacities of WVDOH Empirically Designed concrete bridge
decks.
39
3 Experimental Testing
3.1 Scope and Goals of Experimental Testing Program
The laboratory testing phase of this project consisted of four full scale deck specimens. The decks
were cast in place at West Virginia University Structures Laboratory in Morgantown West Virginia. Once
cast the decks were subjected to an arrangement of monotonic and cyclic loadings.
Testing configuration was determined by assessing previous experiments done regarding “arching
action”, WVDOH Design Specifications, and restrictions of laboratory facilities. Previous testing,
focusing on full scale bridge cross sections, gave insight into testing procedures and configurations. Four
full size deck specimens where chosen to represent the upper and lower bounds of span to depth ratio.
The slab thicknesses and configurations were set by the WVDOH Design specifications. Two separate
girder spacing’s were chosen to represent the upper and lower bounds of actual bridge cross sections.
However the laboratory conditions did not allow for girder spacing over 9 ½ feet.
Instrumentation setup was also driven by previous research, covered in the Literature Review.
The testing done on “arching action” concluded that to sustain the compressive membrane forces,
adequate transverse support had to be provided. Transverse rebar in the slab is the primary load carrying
mechanism in a traditional reinforced concrete deck. To monitor the extent of “arching action” axial
strains in the transverse rebar are recorded. For this reason, the testing setup in this experiment focused
primarily on axial strains in transverse rebar.
Testing was conducted to access the overall capacity of the current WVDOH empirically
designed deck and overlay deck systems. Test data was also used as a benchmark to verify the finite
element analysis and subsequent parametric study. Lastly, the testing provided unbiased information on
the overlay process currently in use by the WVDOH.
40
3.2 Instrumentation and Testing Methods
3.2.1 Instrumentation Overview
The four tests conducted are labeled SP1, SP2, SP3, and SP4. These tests were all conducted in
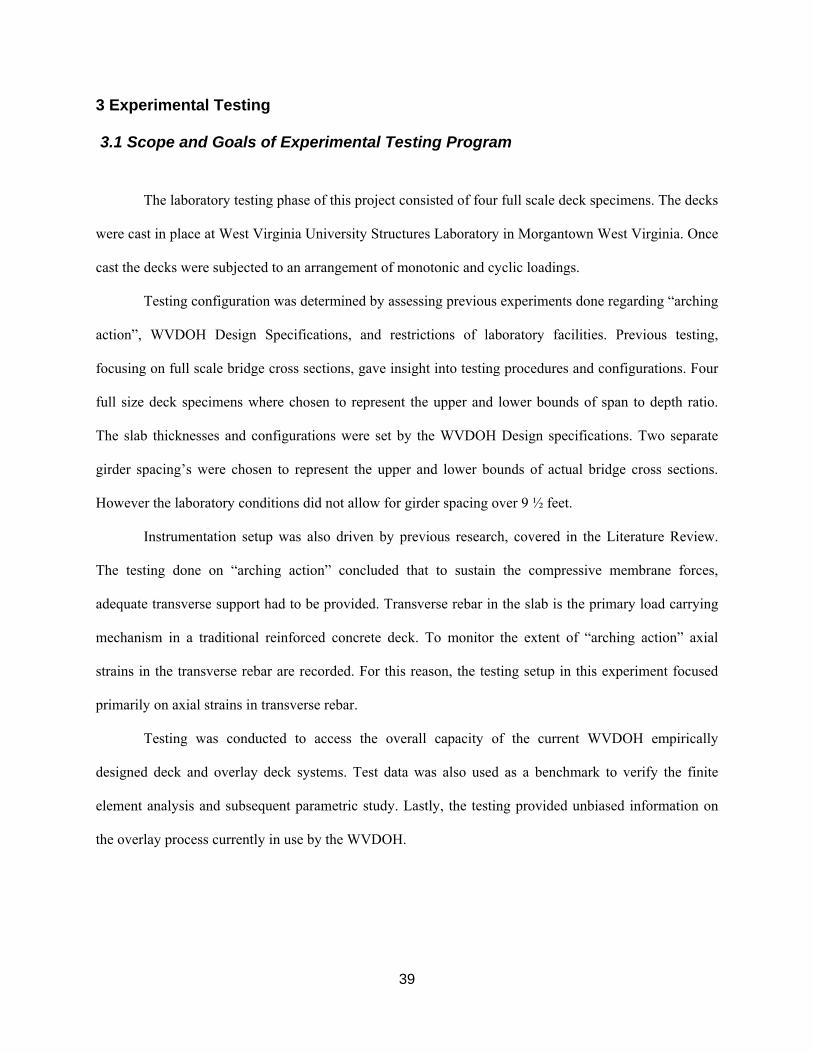
the West Virginia University Structures Laboratory, under the 330 kip loading bay as shown in Figure
3.1.
Figure 3.1: Loading bay used in testing
Using this loading bay allowed the specimens to be up to 9’-6” in width and 25’-0 long. The load
delivering system used in this testing is a combination of a MTS 3330 kip hydraulic actuator and the MTS
Teststar II controller system. This system was able to provide both the monotonic loading and the cyclic
loading patterns.
41
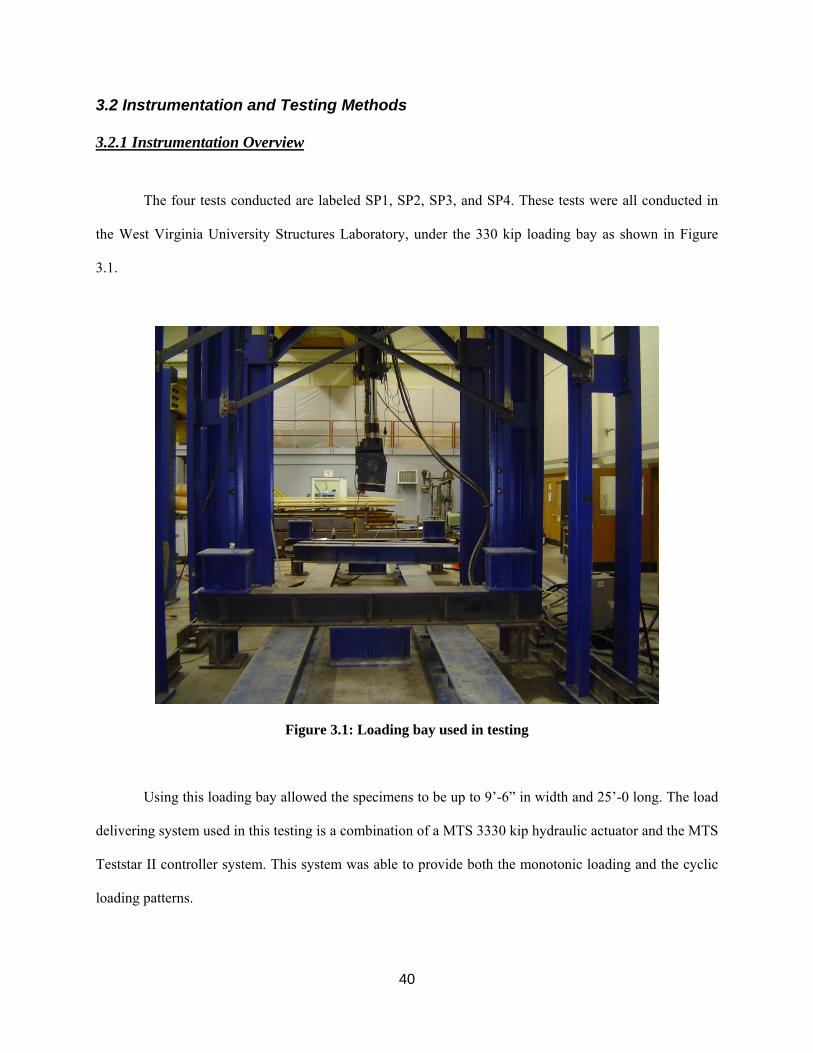
Each test was outfitted with various precise instruments placed at strategic locations to maximize
the effectiveness of the data. Data was collected using Micro Measurements System 5000 data acquisition
modules and Strain Smart software. As shown in Figure 3.2 the instrumentation setup for the first three
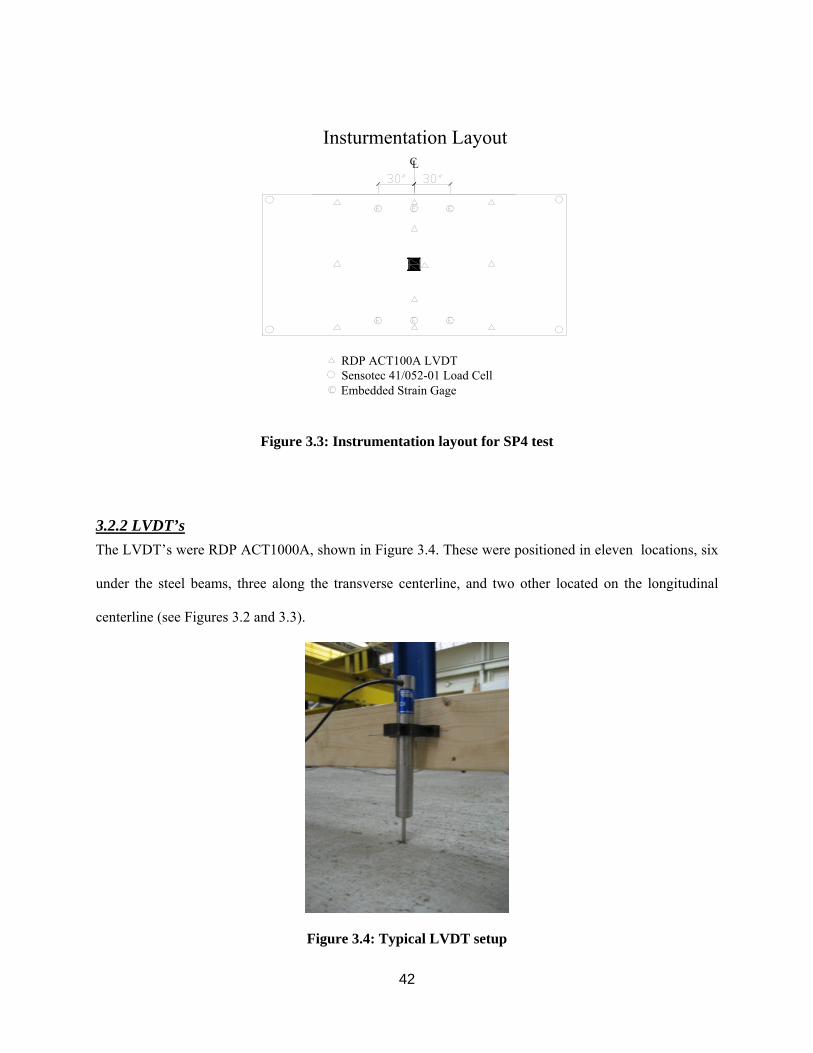
tests SP1, SP2, and SP3 remained the same. The layout for SP4 is shown in Figure 3.3.
RDP ACT100A LVDTSensotec 41/052-01 Load Cell
Type B Insturmented Rebar (See rebar insturmentation details)
Type A Insturmented Rebar (See rebar insturmentation details)
C
24"40" 24"
L
16"16"
Figure 3.2: Typical instrumentation Layout for SP1, SP2, and SP3
42
RDP ACT100A LVDTSensotec 41/052-01 Load Cell
CL
Insturmentation Layout
Embedded Strain Gage
Figure 3.3: Instrumentation layout for SP4 test
3.2.2 LVDT’s The LVDT’s were RDP ACT1000A, shown in Figure 3.4. These were positioned in eleven locations, six
under the steel beams, three along the transverse centerline, and two other located on the longitudinal
centerline (see Figures 3.2 and 3.3).
Figure 3.4: Typical LVDT setup
43
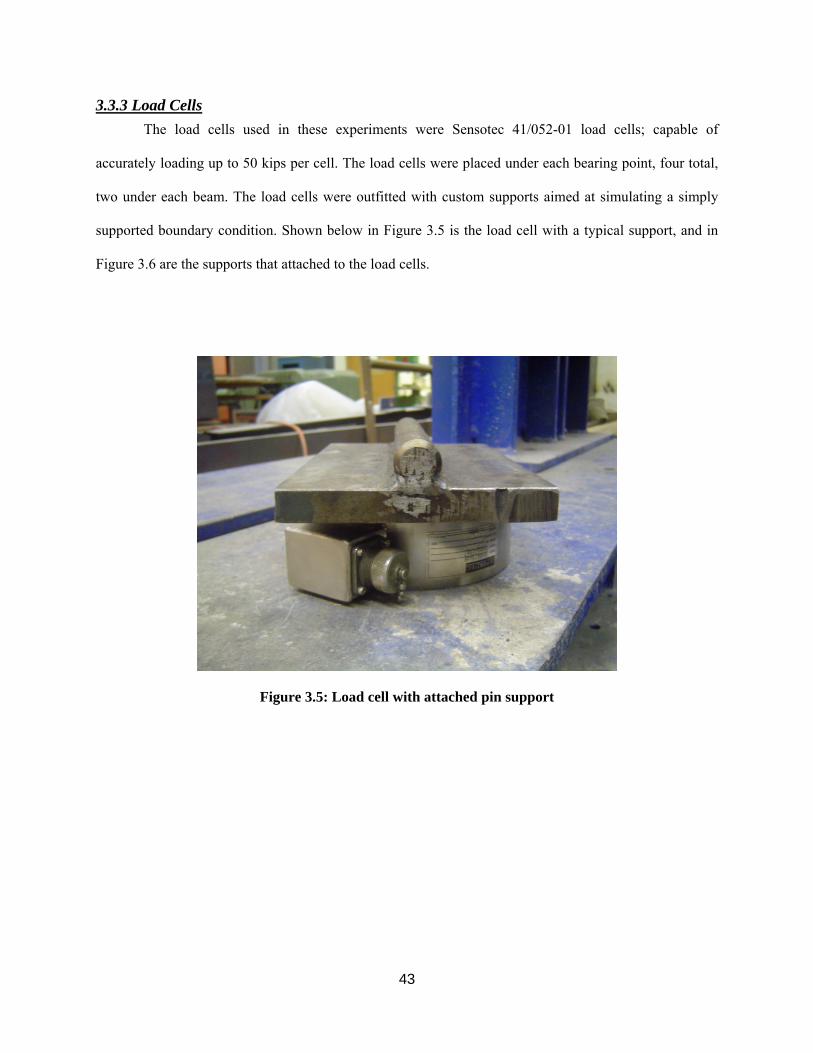
3.3.3 Load Cells The load cells used in these experiments were Sensotec 41/052-01 load cells; capable of
accurately loading up to 50 kips per cell. The load cells were placed under each bearing point, four total,
two under each beam. The load cells were outfitted with custom supports aimed at simulating a simply
supported boundary condition. Shown below in Figure 3.5 is the load cell with a typical support, and in
Figure 3.6 are the supports that attached to the load cells.
Figure 3.5: Load cell with attached pin support
44
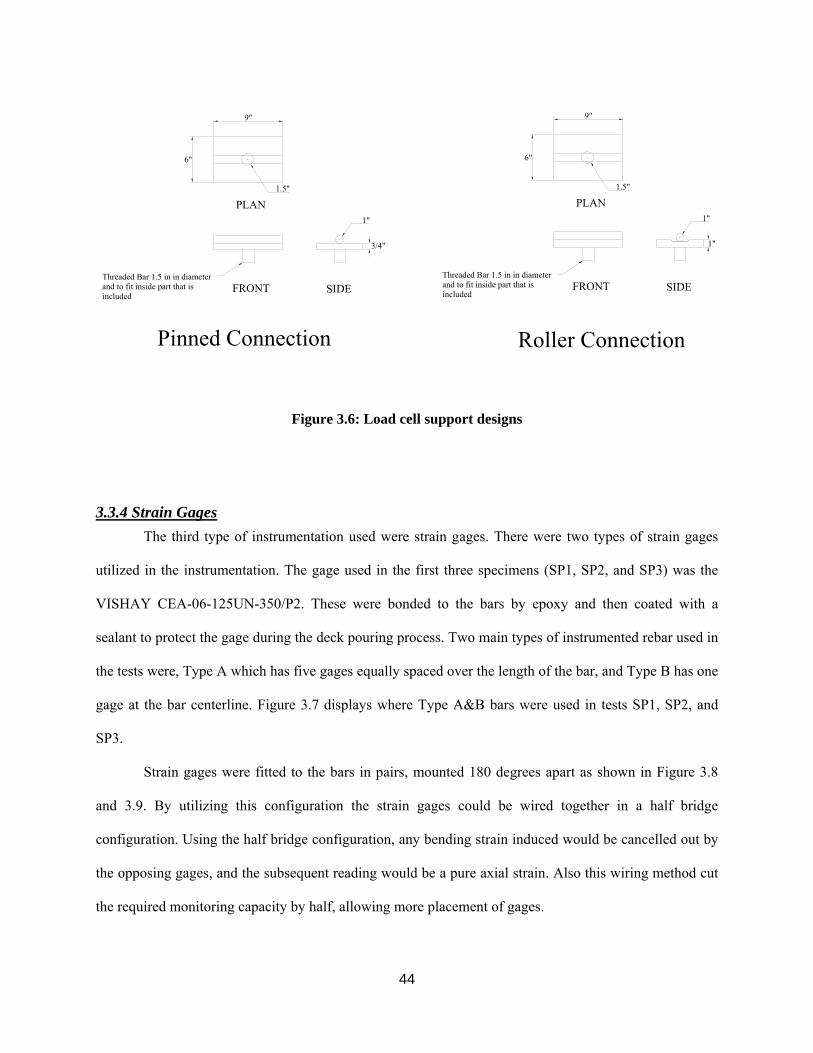
1"
6"
9"
Threaded Bar 1.5 in in diameter and to fit inside part that is included
PLAN
FRONT SIDE
1.5"
3/4"
1"
6"
9"
Threaded Bar 1.5 in in diameter and to fit inside part that is included
PLAN
FRONT SIDE
1.5"
1"
Pinned Connection Roller Connection
Figure 3.6: Load cell support designs
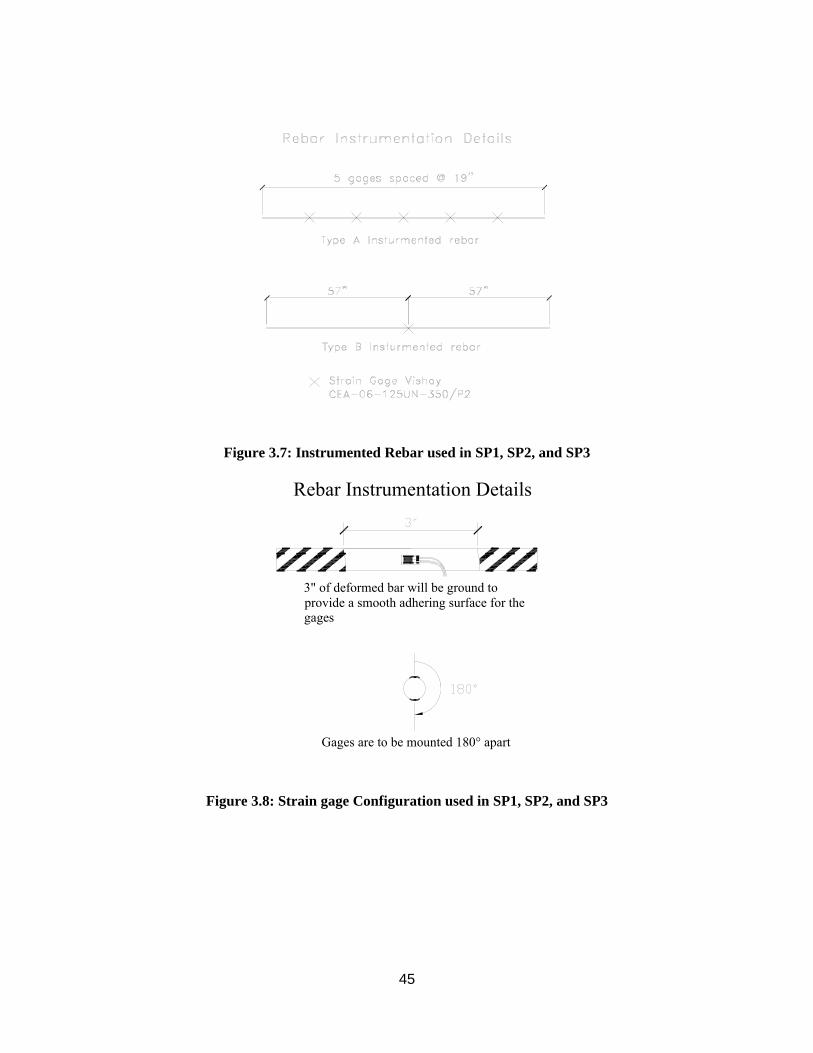
3.3.4 Strain Gages The third type of instrumentation used were strain gages. There were two types of strain gages
utilized in the instrumentation. The gage used in the first three specimens (SP1, SP2, and SP3) was the
VISHAY CEA-06-125UN-350/P2. These were bonded to the bars by epoxy and then coated with a
sealant to protect the gage during the deck pouring process. Two main types of instrumented rebar used in
the tests were, Type A which has five gages equally spaced over the length of the bar, and Type B has one
gage at the bar centerline. Figure 3.7 displays where Type A&B bars were used in tests SP1, SP2, and
SP3.
Strain gages were fitted to the bars in pairs, mounted 180 degrees apart as shown in Figure 3.8
and 3.9. By utilizing this configuration the strain gages could be wired together in a half bridge
configuration. Using the half bridge configuration, any bending strain induced would be cancelled out by
the opposing gages, and the subsequent reading would be a pure axial strain. Also this wiring method cut
the required monitoring capacity by half, allowing more placement of gages.
45
Figure 3.7: Instrumented Rebar used in SP1, SP2, and SP3
3" of deformed bar will be ground to provide a smooth adhering surface for the gages
Gages are to be mounted 180° apart
Rebar Instrumentation Details
Figure 3.8: Strain gage Configuration used in SP1, SP2, and SP3
46
Figure 3.9: Strain gage attached to instrumented bar used for SP1, SP2, and SP3
The second type of second type of strain gage used was the Vishay embedded concrete gage.
They were used to measure concrete strain at the location of the embedded gage. The gages were situated
transversely in the deck just outside the edge of the girder flange as detailed in Figure3.3. Embedded
gages were only used in test specimen 4 (SP4).
3.3.5 Testing Method Load was applied at the horizontal and transverse centerline using the 330 kip hydraulic actuator.
The actuator has an internal load cell that was cross referenced with four other load cells at the bearing
points to verify loads. Load was distributed using a 10 inch by 10 inch punch that was attached to
actuator. This punch simulated the loading area of a tire and permitted the deck to fail by a punching
shear manner.
Each specimen was loaded using force control monotonic loading at a rate of 1 kip/min. After
reaching 100 kips the loading was switched to manual stroke control for safety reasons and the 1 kip/min

47
loading rate was still maintained. The loading rate allowed the specimen to be continuously subjected to
increasing load while not inducing any unwanted dynamic impact effects.
The data was collected continuously using the System5000 data acquisition system. These
measurements were taken each second over the duration of the test. Also, during the loading process the
specimen was visually monitored for cracks, unusual deflections, and other abnormalities.
3.4 Specimen Construction All of the specimens were supported using a W24X80 rolled beam fabricated from 50 ksi. steel.
The beam was chosen to represent a typical bridge girder while fitting into size constraints, and its ability
to support the load expected to be generated without significantly affecting the results. These beams were
outfitted with 5 inch nelson studs spaced 9 inches on center. to develop composite action between the
deck and supporting girders. The beam also had ½ inch stiffeners welded at support locations and the
centerline. These stiffeners were used to counteract any unforeseen deformations due to load and also
allowed for the cross frame connections. The beams were 21 feet in total length with 20 feet between the
centerlines of bearing supports. This girder design was utilized in all four specimen tests as shown in
figure 3.10.
48
Figure 3.10: Typical girder design
Formwork used in the construction of SP1, SP2, and SP3 consisted of a plywood forms supported
by 2 inch by 4 inch, 2 inch by 6 inch, and 2 inch by 10 inch lumber used in various positions. The typical
setup for the first three tests (SP1, SP2, and SP3) is shown below in Figures 3.11 and 3.12
Figure 3.11: Formwork construction used for SP1, SP2, and SP3
49
Figure 3.12: Formwork supports used for all tests
The rebar used for all tests was 60 ksi., epoxy coated #4 rebar (1/2 inch diameter). This rebar was
arranged according to WVDOH. These specifications are discussed more specifically in Chapter 2. The
rebar was placed in two distinct layers, each layer consisted of bars placed parallel and perpendicular to
the girders spaced 8 inches on center. The two layers were kept off of the wood forms by AZTEC plastic
rebar seats both 1 inch and 4 ½” in height were used , see Figures 3.13 and 3.14. Bars were tied at any
intersection with other bars and also to the rebar seats.
Figure 3.13: Typical bottom layer of rebar
50
Figure 3.14: Typical top layer of rebar
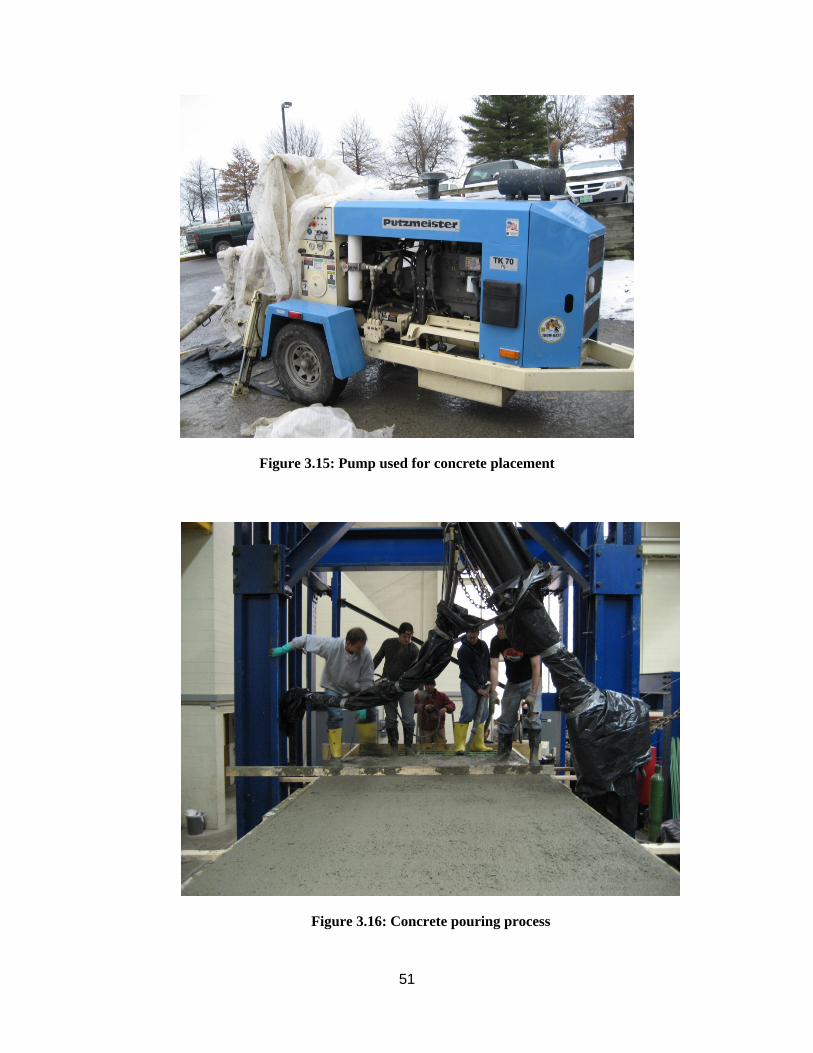
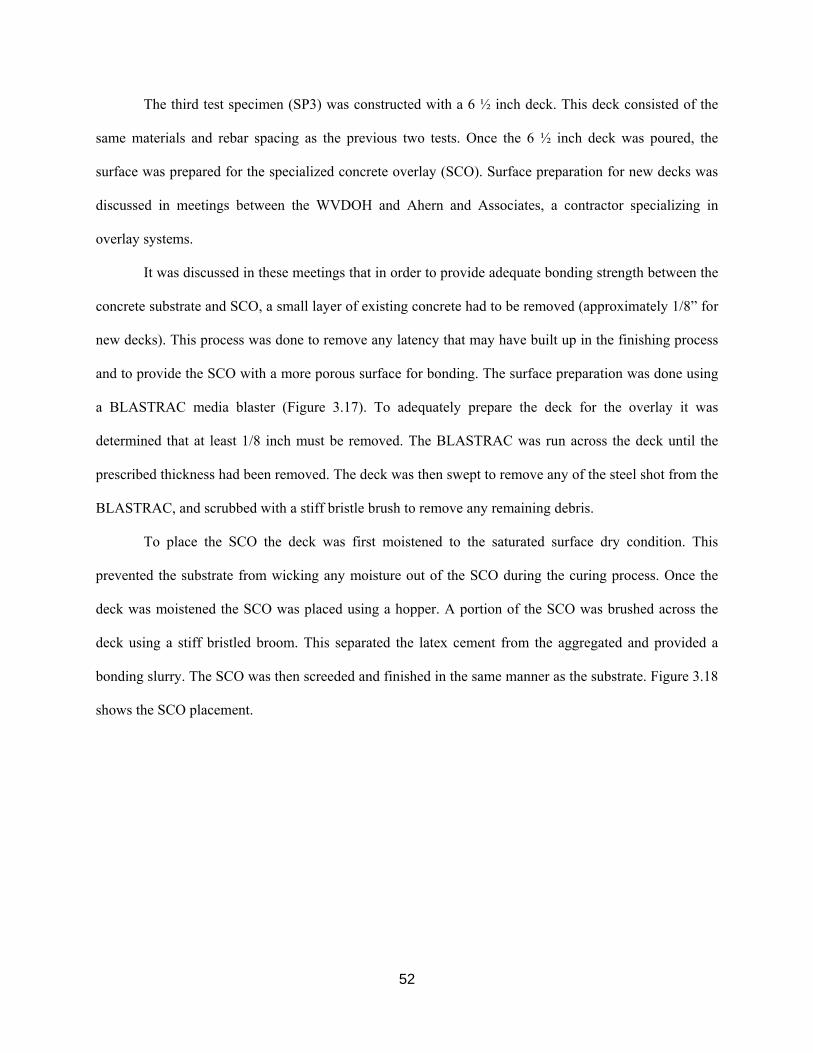
After placement of the reinforcing the deck could be poured. Due to space requirements in the
laboratory, the pour required the use of a concrete pump. The pump, shown in Figure 3.15, used a 2 inch
diameter line, 150 feet in length. The concrete used was a 4000 psi, Type K concrete. No. 4 aggregate was
used in the mix design instead of No. 57 aggregate. This was to allow the concrete to flow through the 2
inch pump line. The concrete had a specified slump of 4 inches, also a function of the pumping process.
Once the concrete was poured, it was vibrated into place and then screeded to set the deck elevation, see
Figure 3.16. The deck was then struck with a trowel and broom finished.
51
Figure 3.15: Pump used for concrete placement
Figure 3.16: Concrete pouring process
52
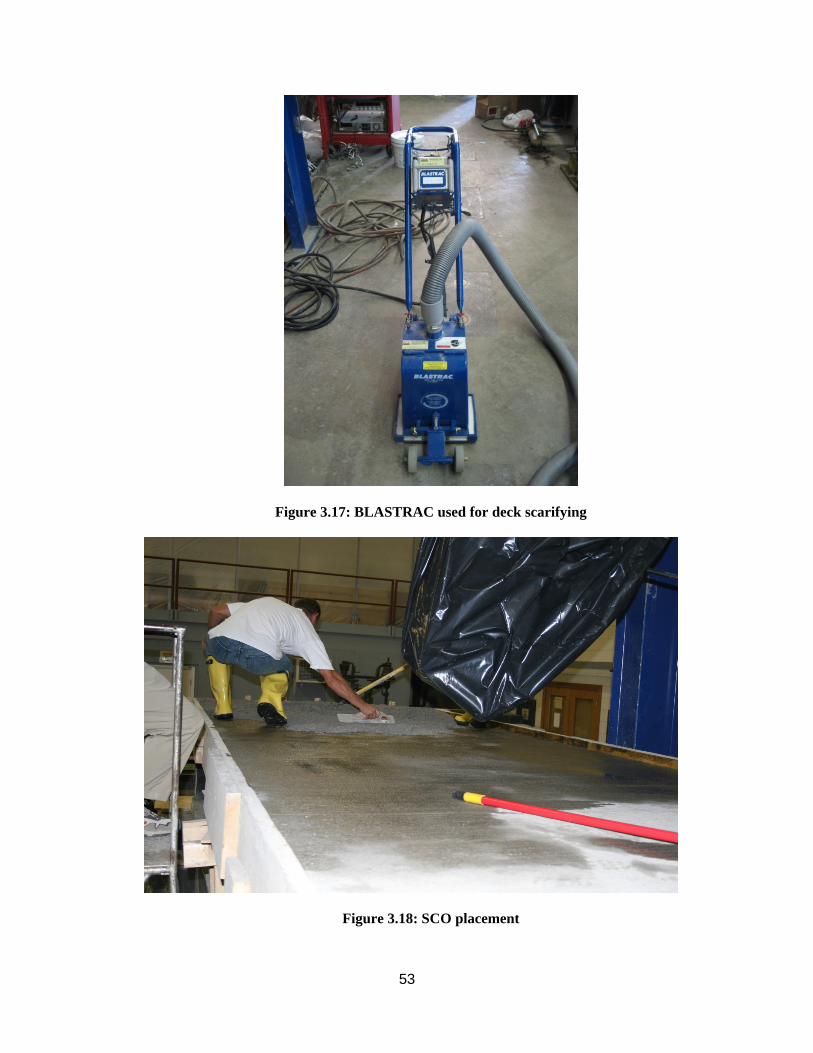
The third test specimen (SP3) was constructed with a 6 ½ inch deck. This deck consisted of the
same materials and rebar spacing as the previous two tests. Once the 6 ½ inch deck was poured, the
surface was prepared for the specialized concrete overlay (SCO). Surface preparation for new decks was
discussed in meetings between the WVDOH and Ahern and Associates, a contractor specializing in
overlay systems.
It was discussed in these meetings that in order to provide adequate bonding strength between the
concrete substrate and SCO, a small layer of existing concrete had to be removed (approximately 1/8” for
new decks). This process was done to remove any latency that may have built up in the finishing process
and to provide the SCO with a more porous surface for bonding. The surface preparation was done using
a BLASTRAC media blaster (Figure 3.17). To adequately prepare the deck for the overlay it was
determined that at least 1/8 inch must be removed. The BLASTRAC was run across the deck until the
prescribed thickness had been removed. The deck was then swept to remove any of the steel shot from the
BLASTRAC, and scrubbed with a stiff bristle brush to remove any remaining debris.
To place the SCO the deck was first moistened to the saturated surface dry condition. This
prevented the substrate from wicking any moisture out of the SCO during the curing process. Once the
deck was moistened the SCO was placed using a hopper. A portion of the SCO was brushed across the
deck using a stiff bristled broom. This separated the latex cement from the aggregated and provided a
bonding slurry. The SCO was then screeded and finished in the same manner as the substrate. Figure 3.18
shows the SCO placement.
53
Figure 3.17: BLASTRAC used for deck scarifying
Figure 3.18: SCO placement
54
3.6 Specimen Geometries
3.6.1 Specimen 1 (SP1)
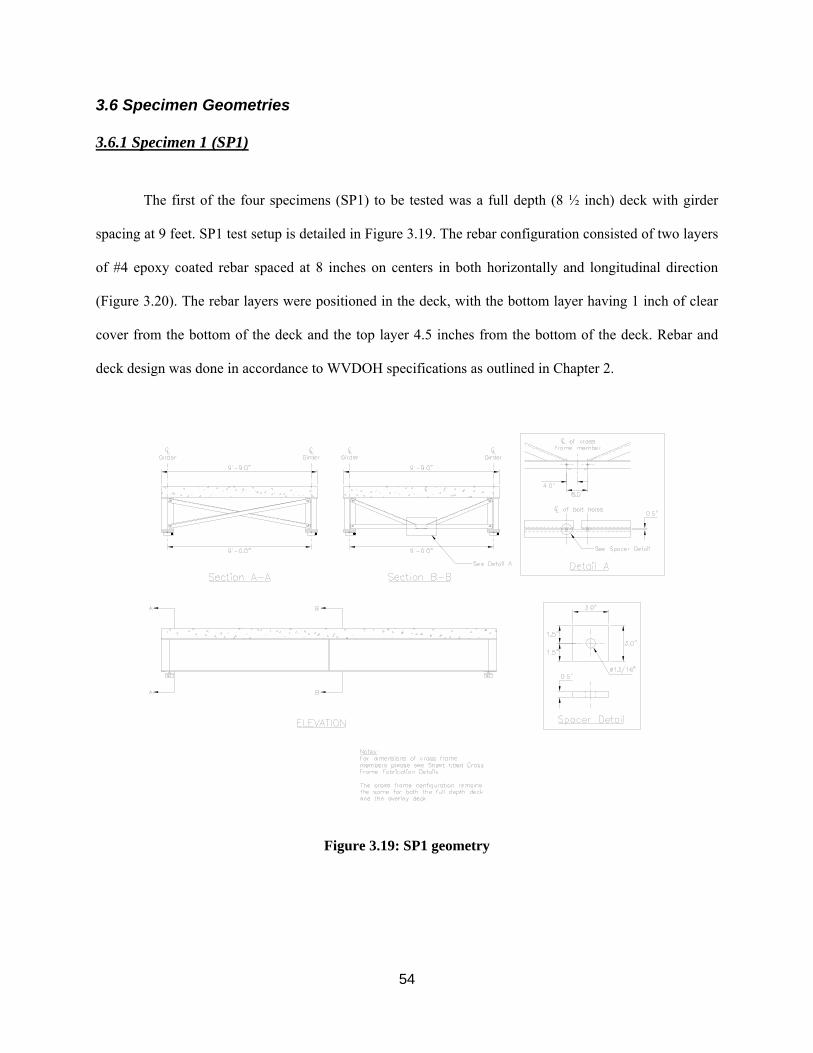
The first of the four specimens (SP1) to be tested was a full depth (8 ½ inch) deck with girder
spacing at 9 feet. SP1 test setup is detailed in Figure 3.19. The rebar configuration consisted of two layers
of #4 epoxy coated rebar spaced at 8 inches on centers in both horizontally and longitudinal direction
(Figure 3.20). The rebar layers were positioned in the deck, with the bottom layer having 1 inch of clear
cover from the bottom of the deck and the top layer 4.5 inches from the bottom of the deck. Rebar and
deck design was done in accordance to WVDOH specifications as outlined in Chapter 2.
Figure 3.19: SP1 geometry

55
Figure 3.20: SP1 rebar design
3.6.2 Specimen 2 ( SP2)
The second of the four specimens (SP2) to be tested was a full depth (8.5 inch) deck with girder
spacing at 6 feet. The test setup is detailed below in figure 3.21. The rebar configuration consisted of two
layers of #4 epoxy coated rebar spaced at 8 inches on centers in both horizontally and longitudinal
direction(Figure 3.22). The rebar layers were positioned in the deck, with the bottom layer having 1 inch
of clear cover from the bottom of the deck and the top layer 4.5 inches from the bottom of the deck.
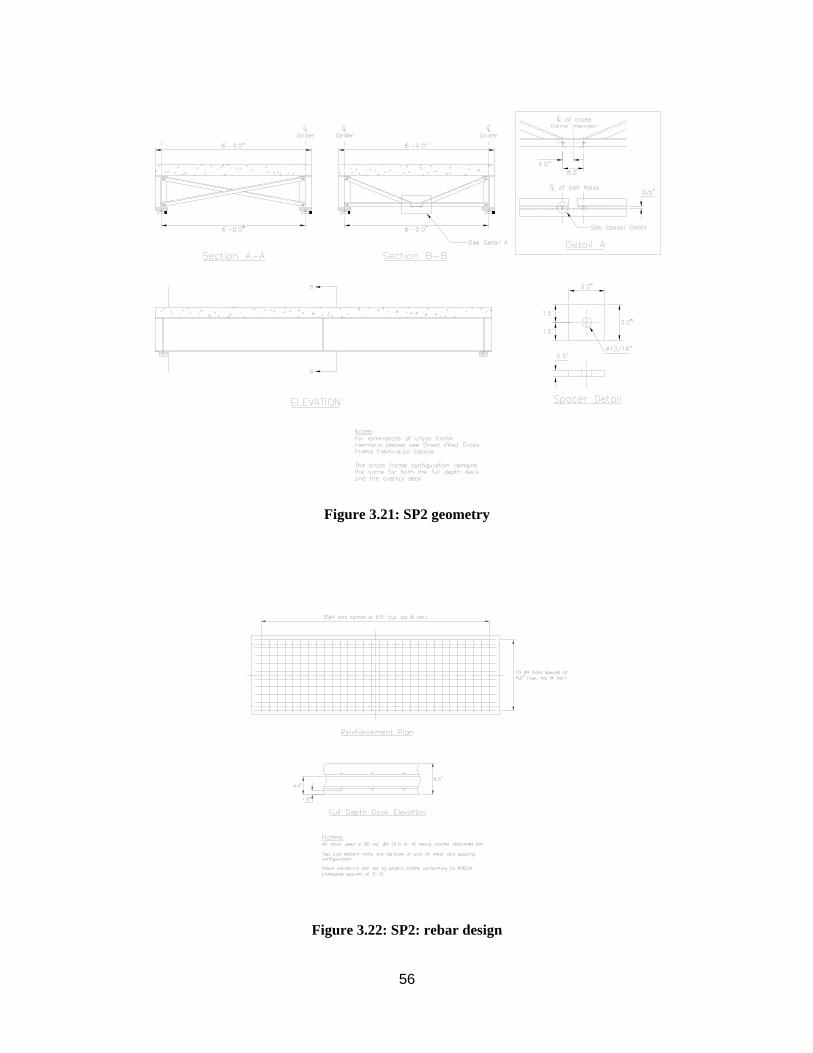
56
Figure 3.21: SP2 geometry
Figure 3.22: SP2: rebar design
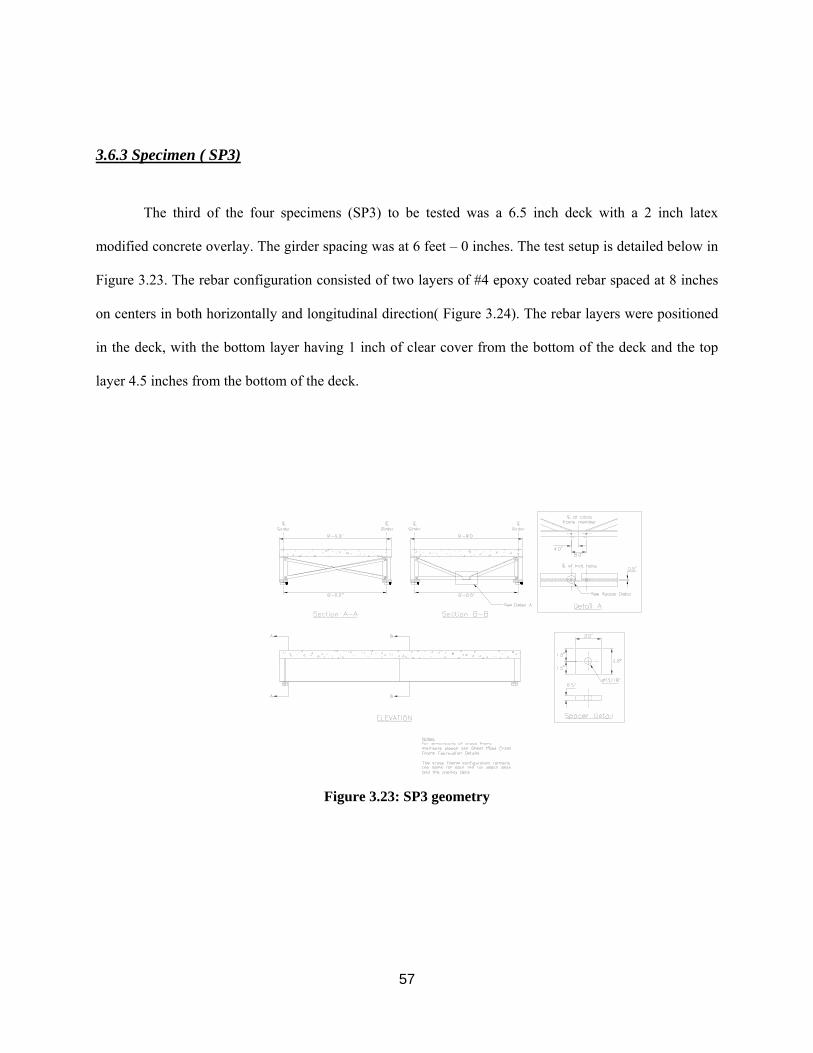
57
3.6.3 Specimen ( SP3)
The third of the four specimens (SP3) to be tested was a 6.5 inch deck with a 2 inch latex
modified concrete overlay. The girder spacing was at 6 feet – 0 inches. The test setup is detailed below in
Figure 3.23. The rebar configuration consisted of two layers of #4 epoxy coated rebar spaced at 8 inches
on centers in both horizontally and longitudinal direction( Figure 3.24). The rebar layers were positioned
in the deck, with the bottom layer having 1 inch of clear cover from the bottom of the deck and the top
layer 4.5 inches from the bottom of the deck.
Figure 3.23: SP3 geometry

58
Figure 3.24: SP3 rebar design
3.6.4 Specimen (SP4) The last specimen (SP4) to be tested was a 6.5 inch deck supported by Stay in Place (SIP) metal
formwork. The girder spacing was at 9 feet center to center. To support the SIP forms 10 gage 3 inch by 3
inch angle was used. This angle was oriented in two different ways, the first with a leg pointed upward
and the second was with the leg pointed downward. These two different angle orientations represent field
conditions where changing the orientation of supporting angle is used to compensate for elevation
differences. The test setup is detailed below in Figure 3.25. The rebar configuration consisted of two
layers of #4 epoxy coated rebar spaced at 8 inches on centers in both horizontally and longitudinal
direction( Figure 3.24). The rebar layers were positioned in the deck, with the bottom layer having 1 inch
of clear cover from the bottom of the deck and the top layer 4.5 inches from the bottom of the deck.
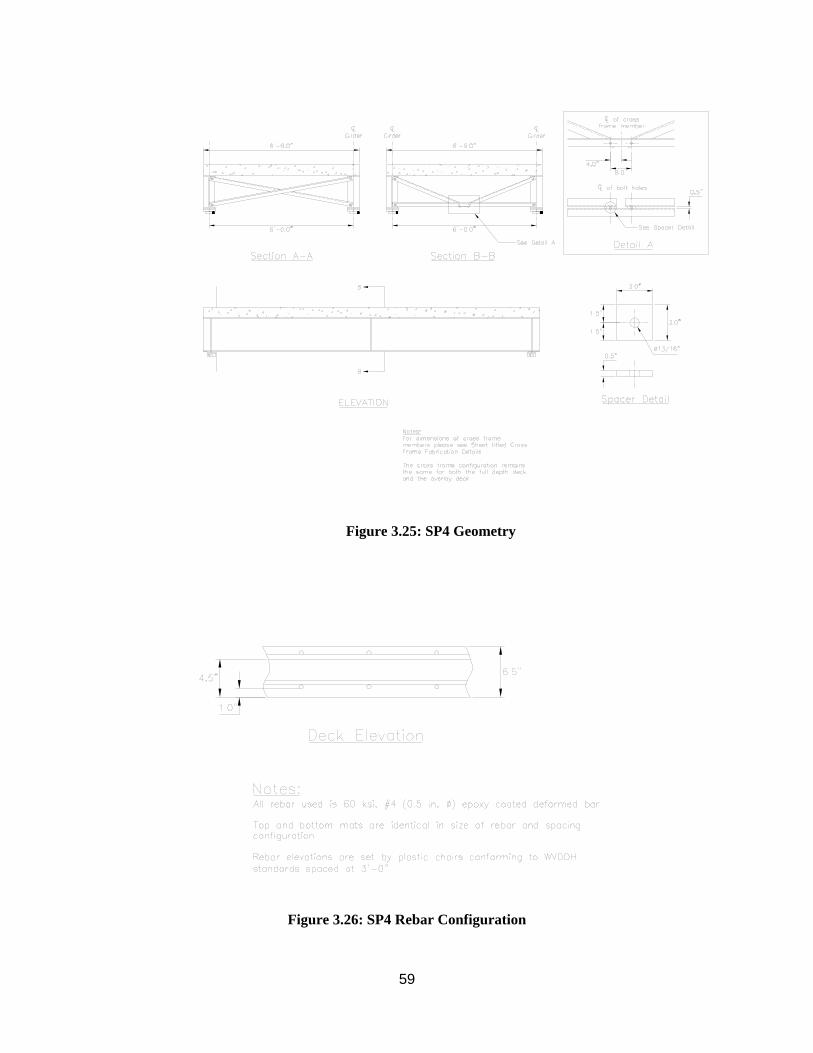
59
Figure 3.25: SP4 Geometry
Figure 3.26: SP4 Rebar Configuration

60
3.7 Test Results
This section covers the testing of the laboratory specimens. Each test is summarized and test
results are provided.
3.7.1 Specimen 1 (SP1)
Specimen 1 (SP1) was tested under monotonic loading only. The specimen failed in a punching
shear manner, with sudden decompression resulting from the actuator punching through the deck at a load
of 122 kips. Cracking was visually detected at 80 kips. This cracking occurred along the top flanges of the
girders near the transverse centerline. Also cracking was notice on the bottom of the slab along the
longitudinal centerline.
Concrete used in the test was tested for compressive strength the results are located in Figure
3.27. Figure 3.28 below shows the load-midpoint deflection plot for this test. Figures 3.29-3.31 contains
deflection plots for various stages of loading along the transverse centerline, longitudinal centerline, and
one of the supporting girders. Figures 3.32-3.34 show strain values for the instrumented bars during
various stages of loading. The bars are noted as +/- 4inch and +/- 20 inch, these bars can be identified
from Figure 3.3, the instrumentation layout.
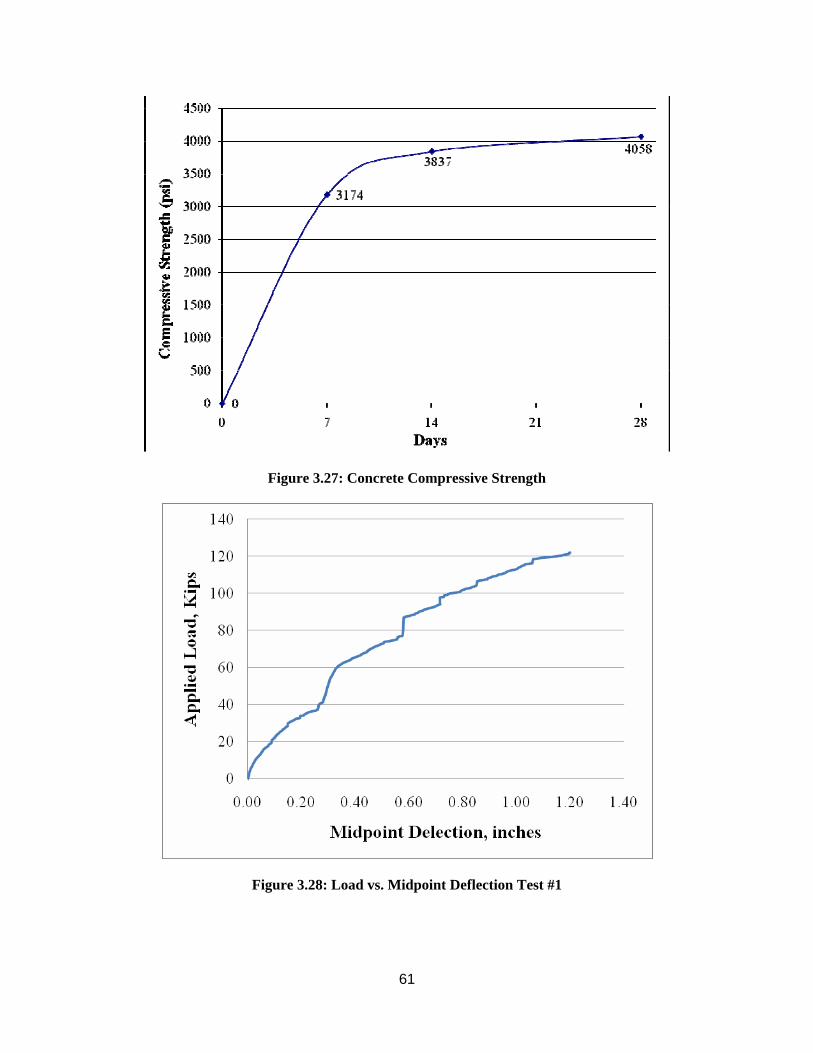
61
Figure 3.27: Concrete Compressive Strength
Figure 3.28: Load vs. Midpoint Deflection Test #1
62
Figure 3.29: Transverse Centerline Deflection Test #1
Figure 3.30: Deflection along longitudinal centerline Test #1
63
Figure 3.31: Deflection along supporting girder Test#1
Figure 3.32: Strain on Centerline +/-4 inch insturmented bar Test #1
64
Figure 3.33: Strain on centerline +/-20 inch insturment bar Test #1
Figure 3.34: Strain along longitudinal centerline Test #1
65
3.7.2 Specimen (SP2)
Specimen 2 (SP2) was tested under monotonic loading only. The specimen failed in a punching shear
manner, with sudden decompression resulting from the actuator punching through the deck at a load of
143.3 kips. Cracking was visually detected at 85 kips. These cracks were noticed in two locations; along
the girder flanges near the transverse centerline and on the bottom of the slab along the longitudianal
centerline.
Concrete used in the test was tested for compressive strength the results are shown in Figure
3.35. The ultimate load reached was 122 kips. Figure 3.36 shows the load-midpoint deflection plot for
this test. Figures 3.37-3.39 contains deflection plots for various stages of loading along the transverse
centerline, longitudinal centerline, and one of the supporting girders. Figures 3.40-3.42 show strain values
for the instrumented bars during various stages of loading. The bars are noted as +/- 4inch and +/- 20
inch, these bars can be identified from Figure 3.3, the instrumentation layout.
Figure 3.35: Concrete compressive strength test #2
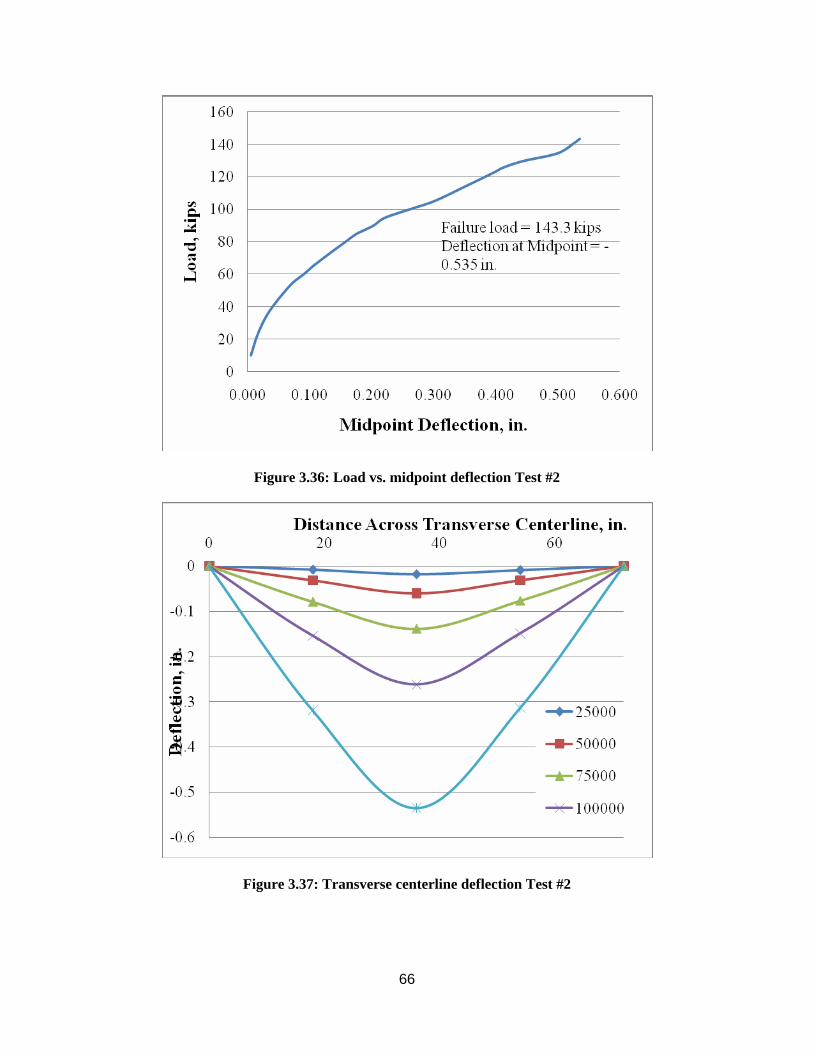
66
Figure 3.36: Load vs. midpoint deflection Test #2
Figure 3.37: Transverse centerline deflection Test #2
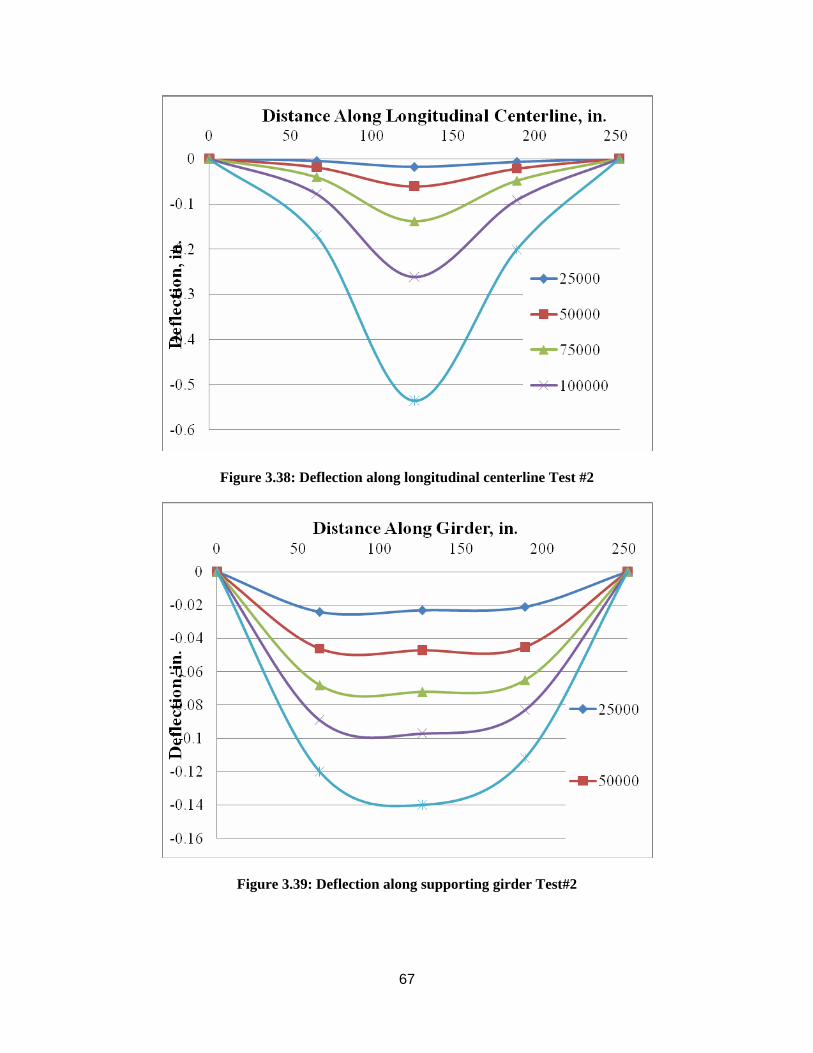
67
Figure 3.38: Deflection along longitudinal centerline Test #2
Figure 3.39: Deflection along supporting girder Test#2
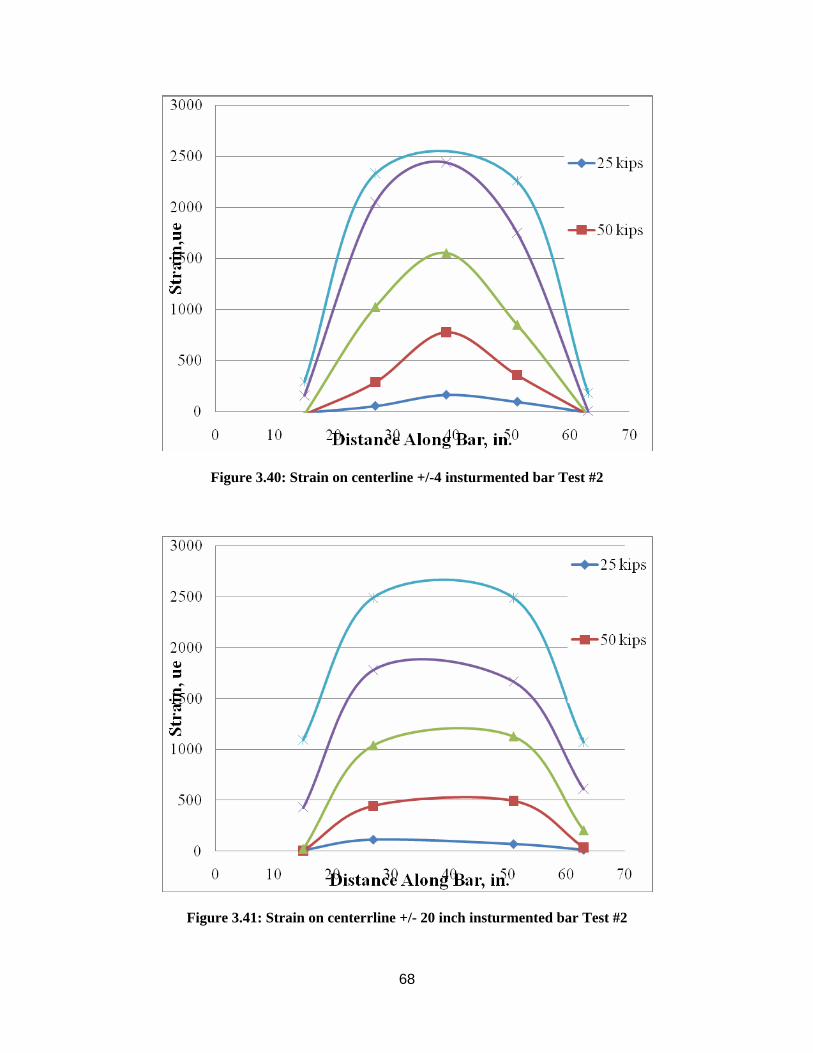
68
Figure 3.40: Strain on centerline +/-4 insturmented bar Test #2
Figure 3.41: Strain on centerrline +/- 20 inch insturmented bar Test #2
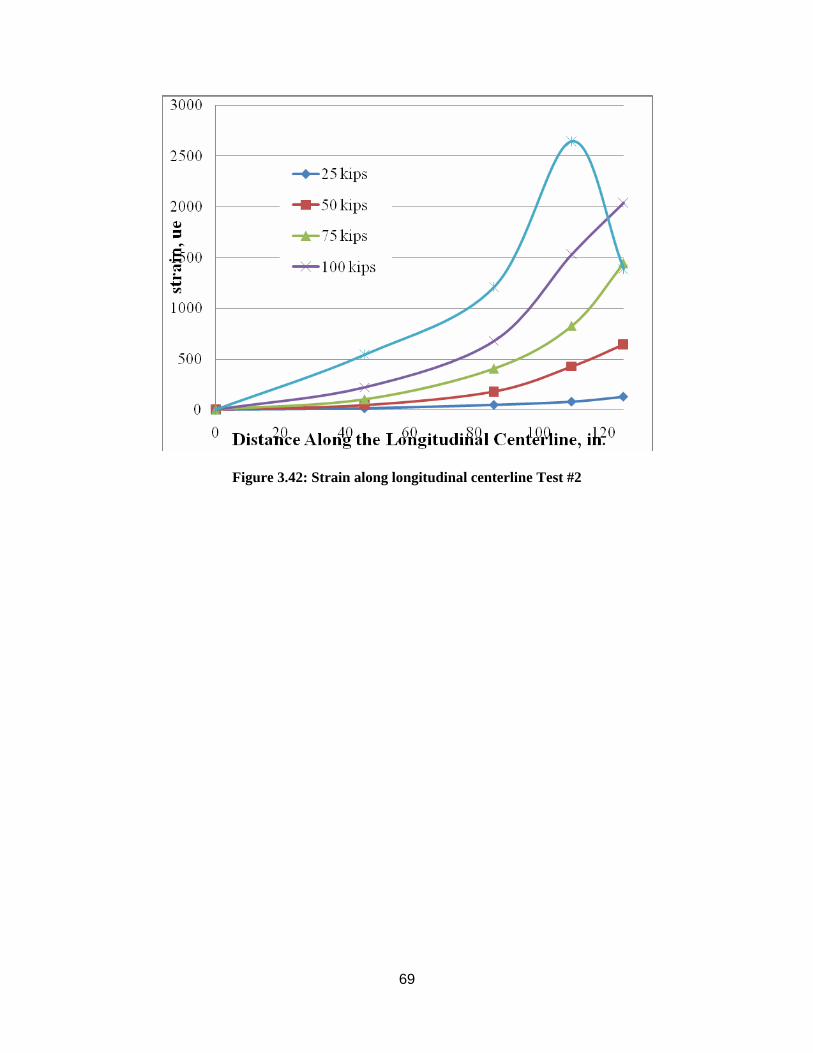
69
Figure 3.42: Strain along longitudinal centerline Test #2
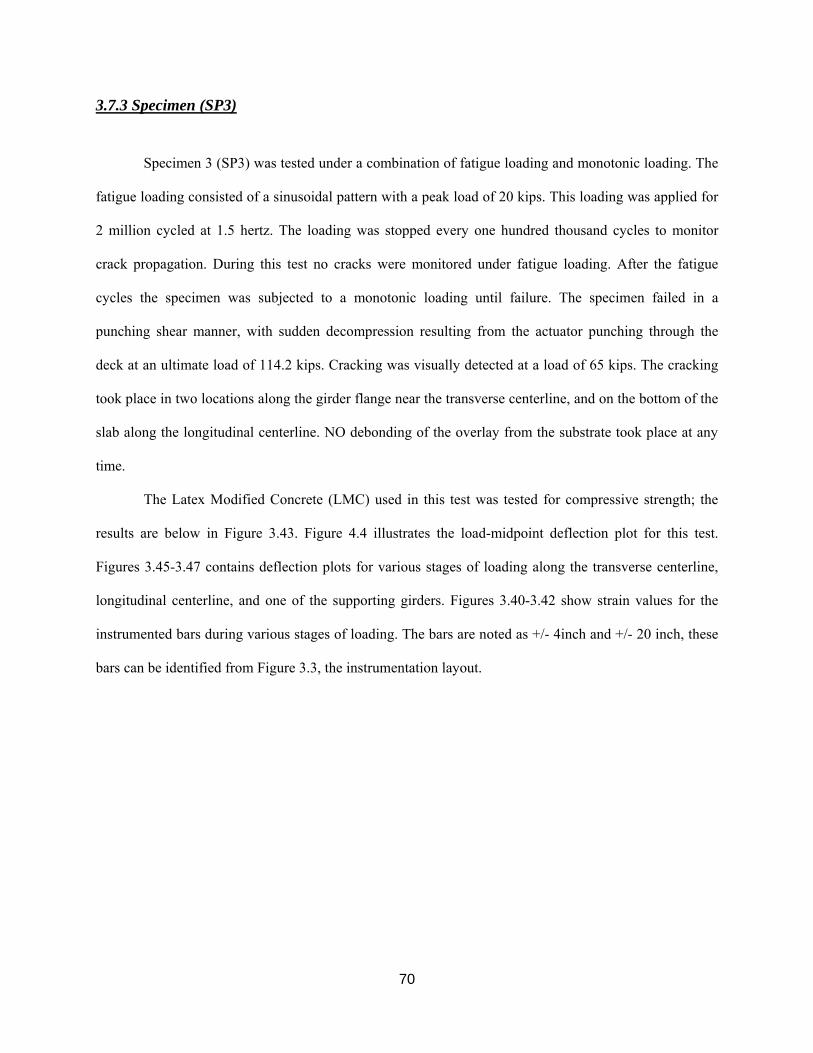
70
3.7.3 Specimen (SP3)
Specimen 3 (SP3) was tested under a combination of fatigue loading and monotonic loading. The
fatigue loading consisted of a sinusoidal pattern with a peak load of 20 kips. This loading was applied for
2 million cycled at 1.5 hertz. The loading was stopped every one hundred thousand cycles to monitor
crack propagation. During this test no cracks were monitored under fatigue loading. After the fatigue
cycles the specimen was subjected to a monotonic loading until failure. The specimen failed in a
punching shear manner, with sudden decompression resulting from the actuator punching through the
deck at an ultimate load of 114.2 kips. Cracking was visually detected at a load of 65 kips. The cracking
took place in two locations along the girder flange near the transverse centerline, and on the bottom of the
slab along the longitudinal centerline. NO debonding of the overlay from the substrate took place at any
time.
The Latex Modified Concrete (LMC) used in this test was tested for compressive strength; the
results are below in Figure 3.43. Figure 4.4 illustrates the load-midpoint deflection plot for this test.
Figures 3.45-3.47 contains deflection plots for various stages of loading along the transverse centerline,
longitudinal centerline, and one of the supporting girders. Figures 3.40-3.42 show strain values for the
instrumented bars during various stages of loading. The bars are noted as +/- 4inch and +/- 20 inch, these
bars can be identified from Figure 3.3, the instrumentation layout.
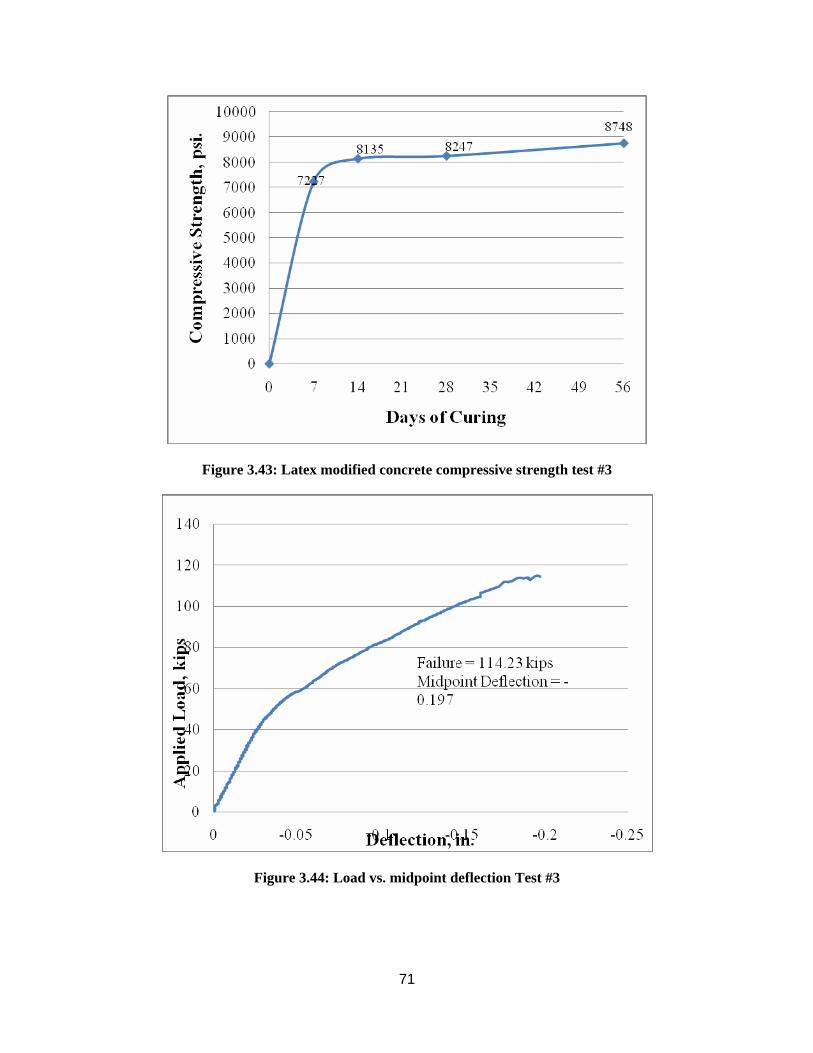
71
Figure 3.43: Latex modified concrete compressive strength test #3
Figure 3.44: Load vs. midpoint deflection Test #3
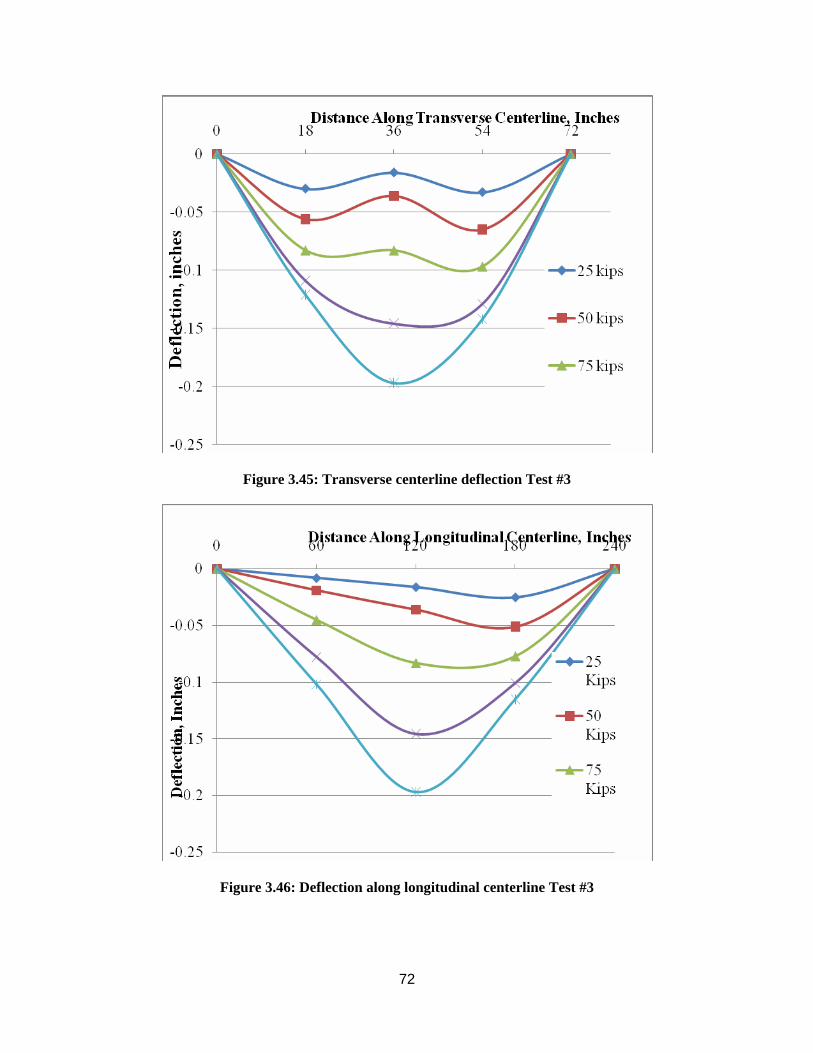
72
Figure 3.45: Transverse centerline deflection Test #3
Figure 3.46: Deflection along longitudinal centerline Test #3
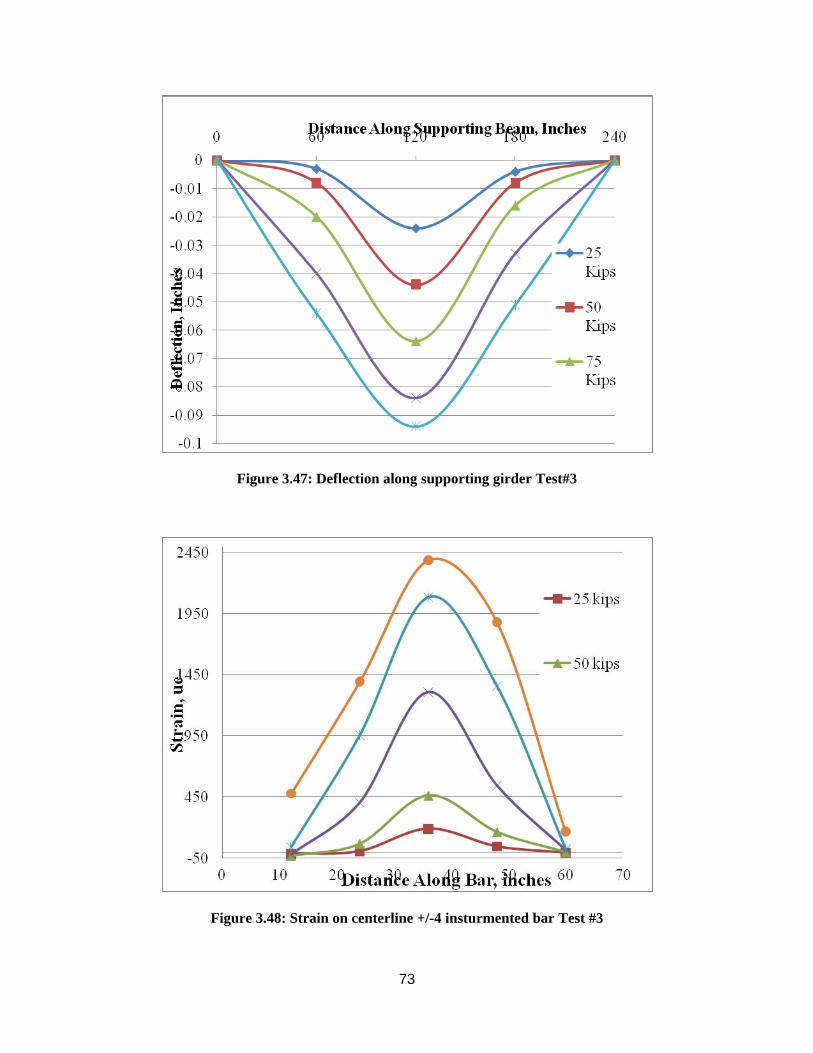
73
Figure 3.47: Deflection along supporting girder Test#3
Figure 3.48: Strain on centerline +/-4 insturmented bar Test #3
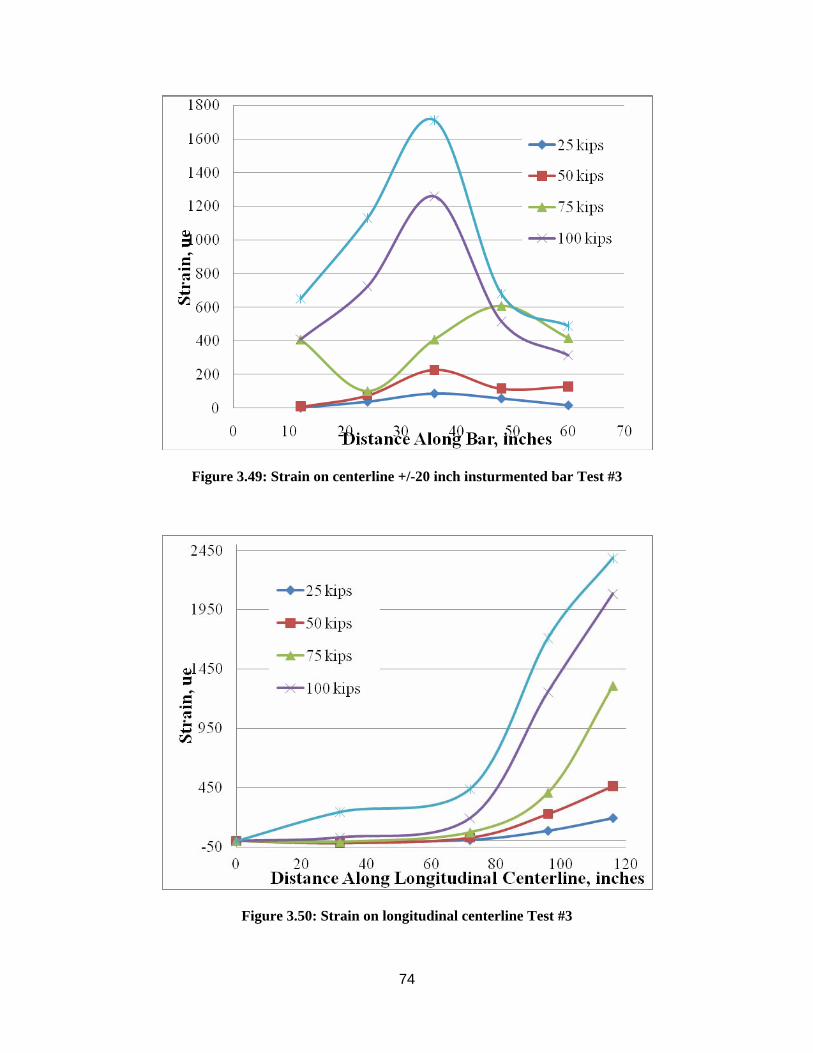
74
Figure 3.49: Strain on centerline +/-20 inch insturmented bar Test #3
Figure 3.50: Strain on longitudinal centerline Test #3

75
3.7.4 Specimen (SP4)
Specimen 4 (SP4) was tested under a combination of fatigue loading and monotonic loading. The
fatigue loading consisted of a sinusoidal pattern with a peak load of 20 kips. This loading was applied for
2 million cycled at 1.5 hertz. The fatigue loading was stopped every on hundred thousand cylcles to
monitor crack growth. Crackin was evident after the first one hundred thousand cylces and continused to
propagate throught the deck. This cracking however, propagated in a random pattern. Thes specimen was
then subjected to a monotonic load until failure. The specimen failed in a punching shear manner, with
sudden decompression resulting from the actuator punching through the deck at a load of 114.9 kips.
Figure 3.51 below shows the load-midpoint deflection plot for this test. Figures 3.52-3.54
contains deflection plots for various stages of loading along the transverse centerline, longitudinal
centerline, and one of the supporting girders. Figures 3.55 and 3.56 show strain values the embedded
gages located along the girders. For the detailed layout see Figure 3.4.
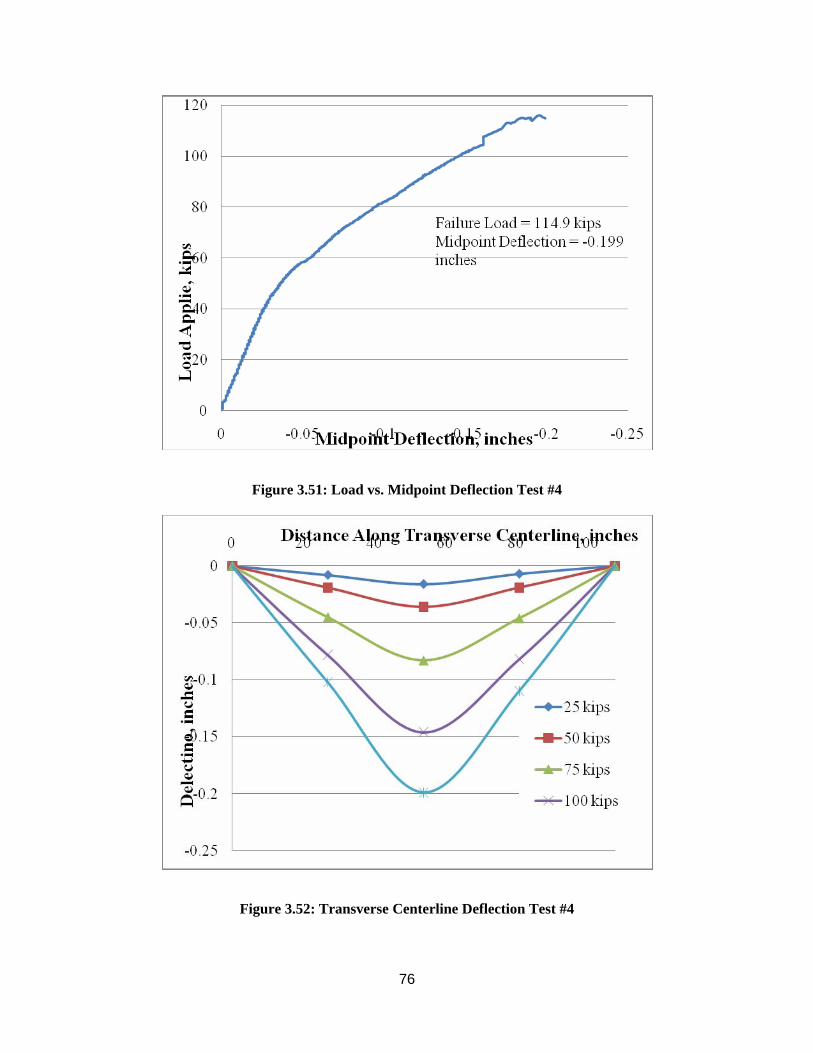
76
Figure 3.51: Load vs. Midpoint Deflection Test #4
Figure 3.52: Transverse Centerline Deflection Test #4
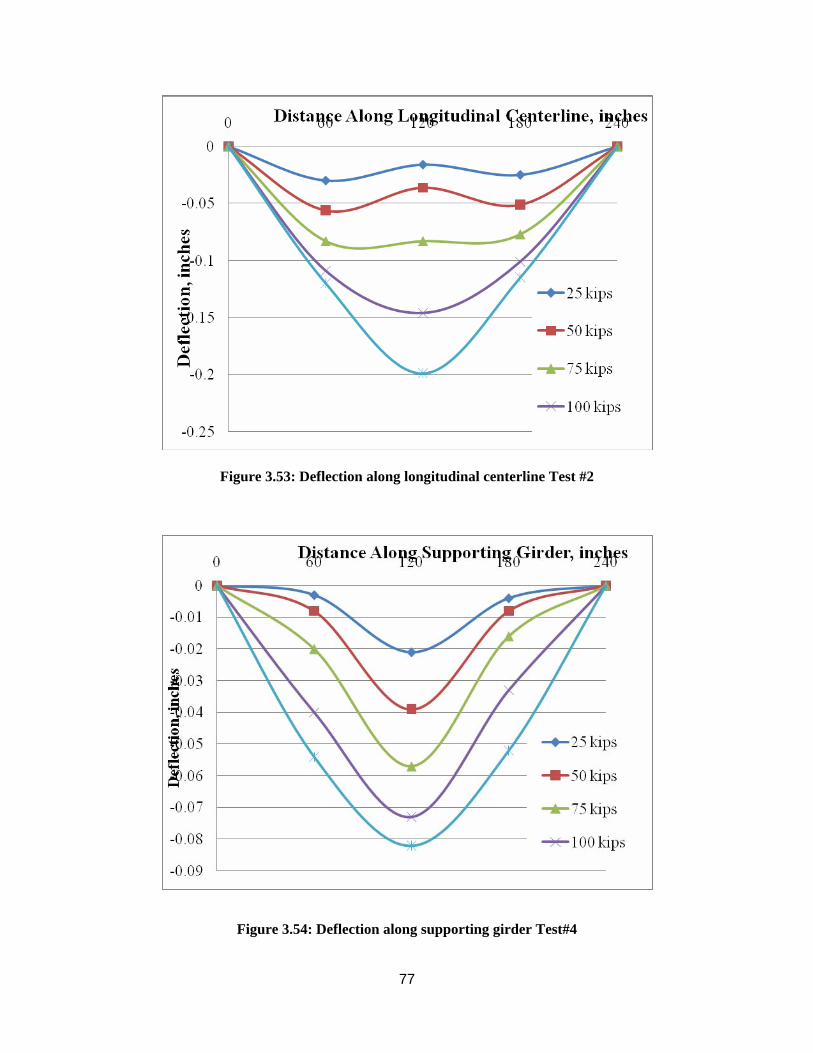
77
Figure 3.53: Deflection along longitudinal centerline Test #2
Figure 3.54: Deflection along supporting girder Test#4
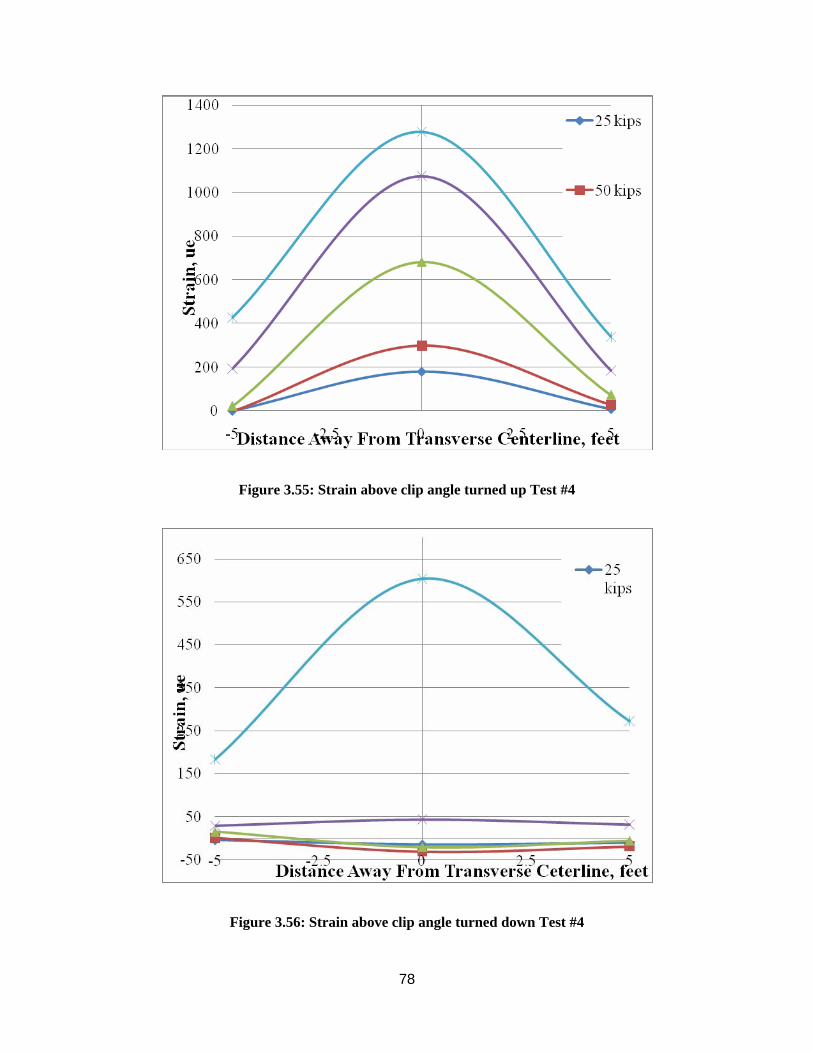
78
Figure 3.55: Strain above clip angle turned up Test #4
Figure 3.56: Strain above clip angle turned down Test #4

79
4. NONLINEAR FINITE ELEMENT MODELING
4.1 Introduction This chapter will outline the nonlinear finite element modeling that was performed. The modeling
will be calibrated using past experimental data, and the full scale models tested in the lab. The finite
element analysis (FEA) was conducted using two commercially available programs FEMAP (version 8.3)
and ABAQUS (version 6.3). Modeling was conducted to provide a parametric study of hypothetical deck
specimens ranging in thickness and span.
4.2 Nonlinear Finite Element Techniques FEA was conducted in a two part process, the model geometry, basic material properties, and
nodes were assigned using the FEMAP program. Once the models were created the information was
exported into a input file compatible with ABAQUS. Once in the ABAQUS format the material
properties are able to be refined along with the loading analysis technique. This modification of the input
file is done to more accurately represent the materials used in the FEA model.
4.3 Overview of Elements/Mesh A S4R shell element was utilized to model both the girders, stiffeners, and the concrete deck.
This S4R shell is defined by ABAQUS as a general purpose shell element relying on Kirchoff theory for
thin shells and Mindlin theory as the thickness increases. In this application The S4R shell uses with
reduced integration, providing an element with only one integration point. The main advantage to using
reduced integration is the softer response the model exhibits. In general FEA results provide a stiffer
result than a laboratory model, using the reduced integration allowed for greater accuracy.
The deck was made composite using MPC beam connectors at locations where node alignment
between the deck shell and the top flange were present. These connectors are essentially a rigid link that
acts as the shear studs do in the laboratory tests, assuming in both cases the deck is 100% composite with
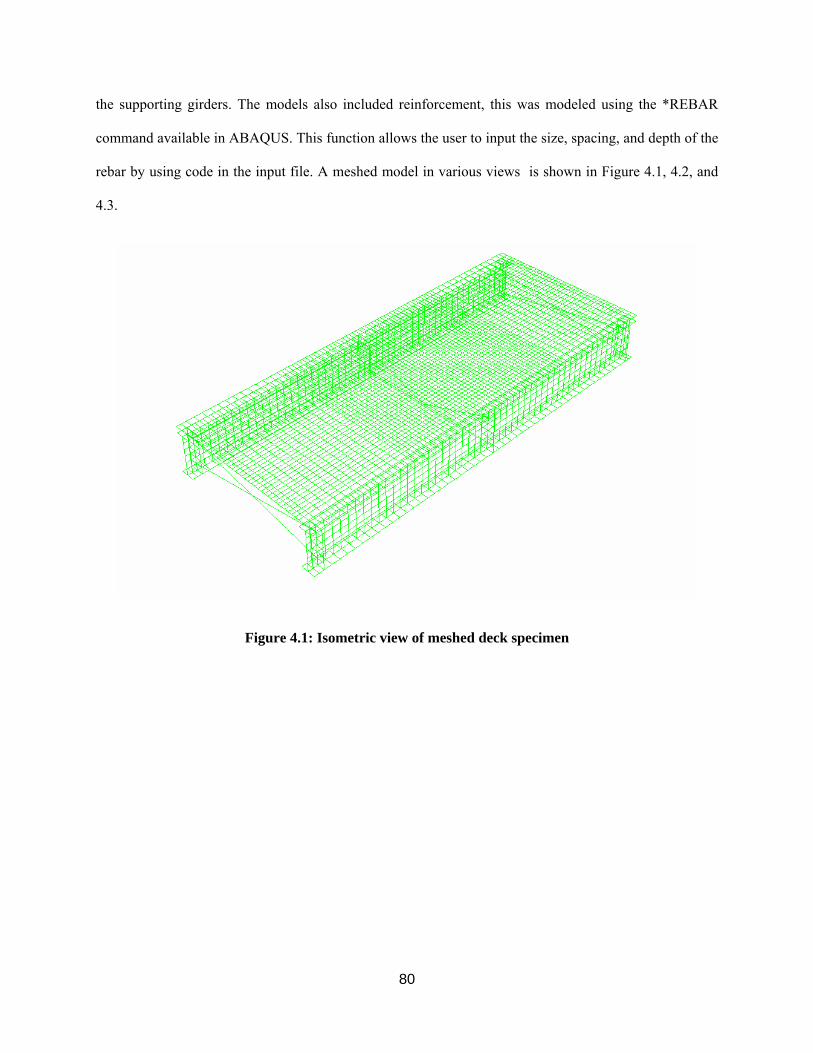
80
the supporting girders. The models also included reinforcement, this was modeled using the *REBAR
command available in ABAQUS. This function allows the user to input the size, spacing, and depth of the
rebar by using code in the input file. A meshed model in various views is shown in Figure 4.1, 4.2, and
4.3.
Figure 4.1: Isometric view of meshed deck specimen
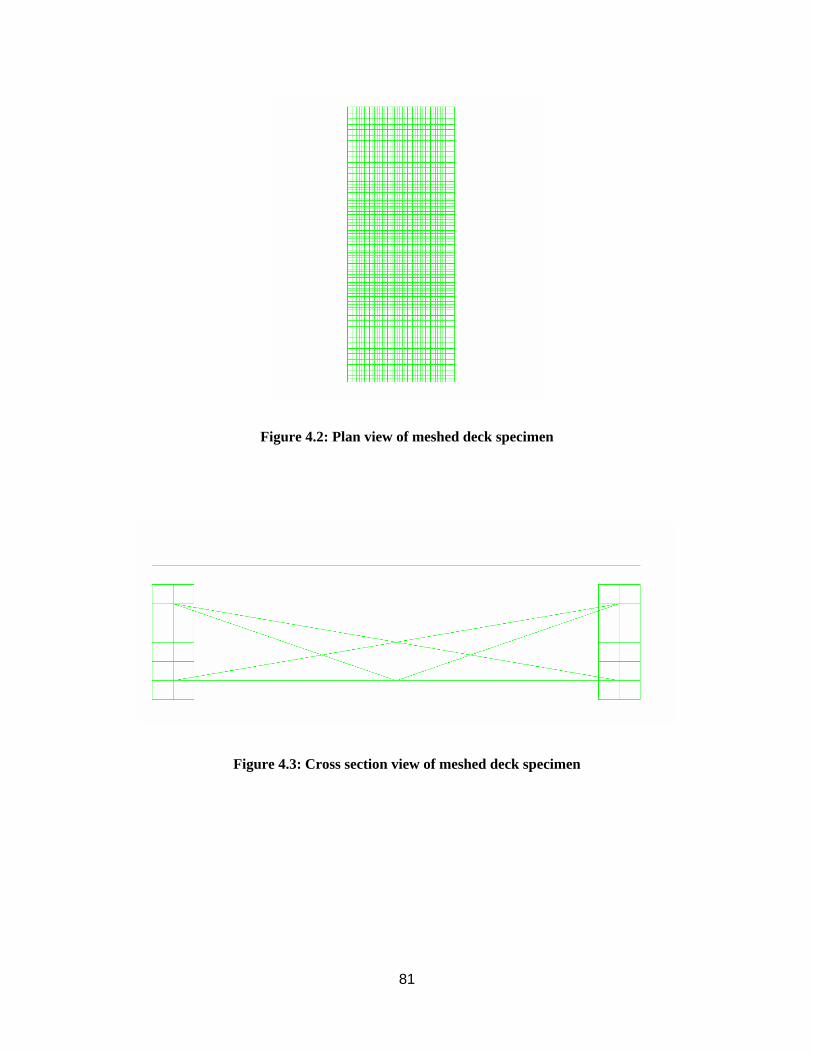
81
Figure 4.2: Plan view of meshed deck specimen
Figure 4.3: Cross section view of meshed deck specimen

82
4.3.1 Material Modeling Previous research conducted at West Virginia University regarding FEA of composite steel and
concrete sections was used as a benchmark for the material properties utilized in the finite modeling of
this experimental testing. These material properties are outlined in the following section.
4.3.1.1 Concrete Properties To accurately model concrete the Comité Européen du Béton (CEB) model was chosen. The CEB
model includes tension by utilizing the bi-linear constitutive model. Equation 4.1, shown below, was used
in conjunction with Excel to formulate a graph that (Figure 4.4) that shows both the tension and
compression portion of concrete strain. For the purposes of these models the crushing strain was taken to
be 0.003 inches/inch. Tension stiffening values were also input into the concrete properties to introduce
effects present at the concrete/rebar interface.
( )c
ccc ε 1
ε ε 206,000a0.85fb+
−= (4.1)
Where: fc= Stress in concrete, ksi fc’= Compressive strength of concrete, ksi εc= Crushing strain of concrete, in./in. a= ( ) 953.105.1'85.06.6193 −+cf
b= ( ) 850450.1'85.01.8074 085.1 −+ −cf
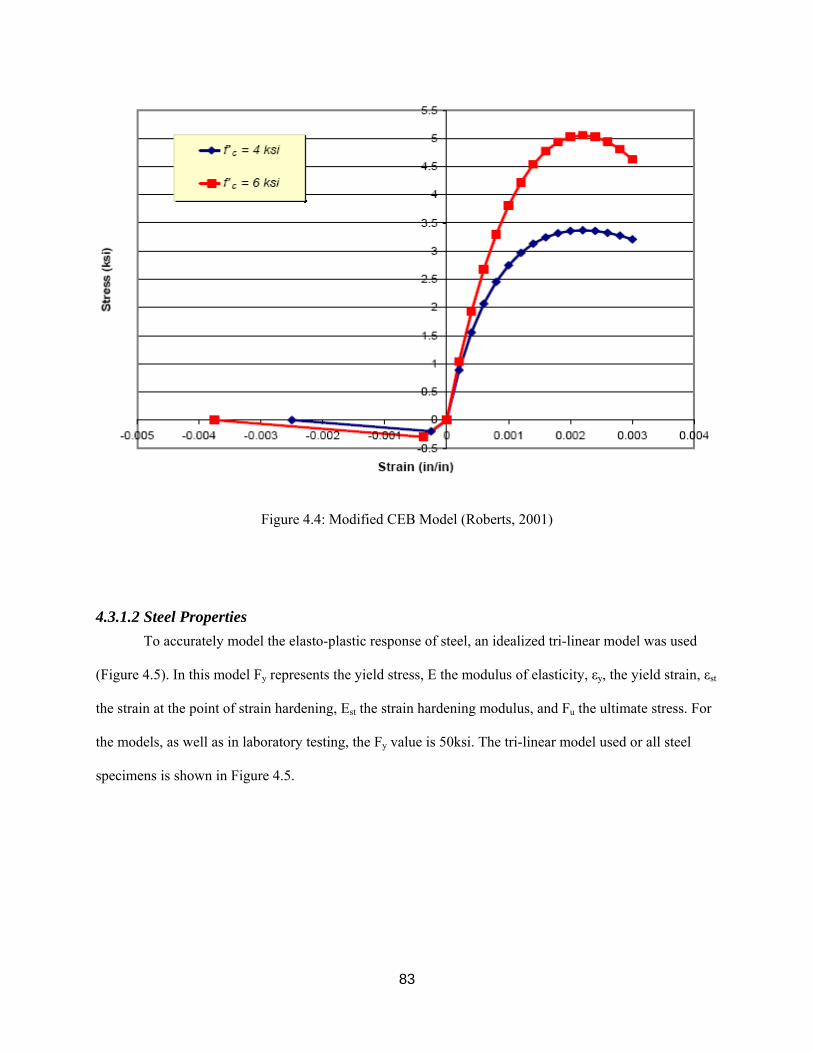
83
Figure 4.4: Modified CEB Model (Roberts, 2001)
4.3.1.2 Steel Properties To accurately model the elasto-plastic response of steel, an idealized tri-linear model was used
(Figure 4.5). In this model Fy represents the yield stress, E the modulus of elasticity, εy, the yield strain, εst
the strain at the point of strain hardening, Est the strain hardening modulus, and Fu the ultimate stress. For
the models, as well as in laboratory testing, the Fy value is 50ksi. The tri-linear model used or all steel
specimens is shown in Figure 4.5.
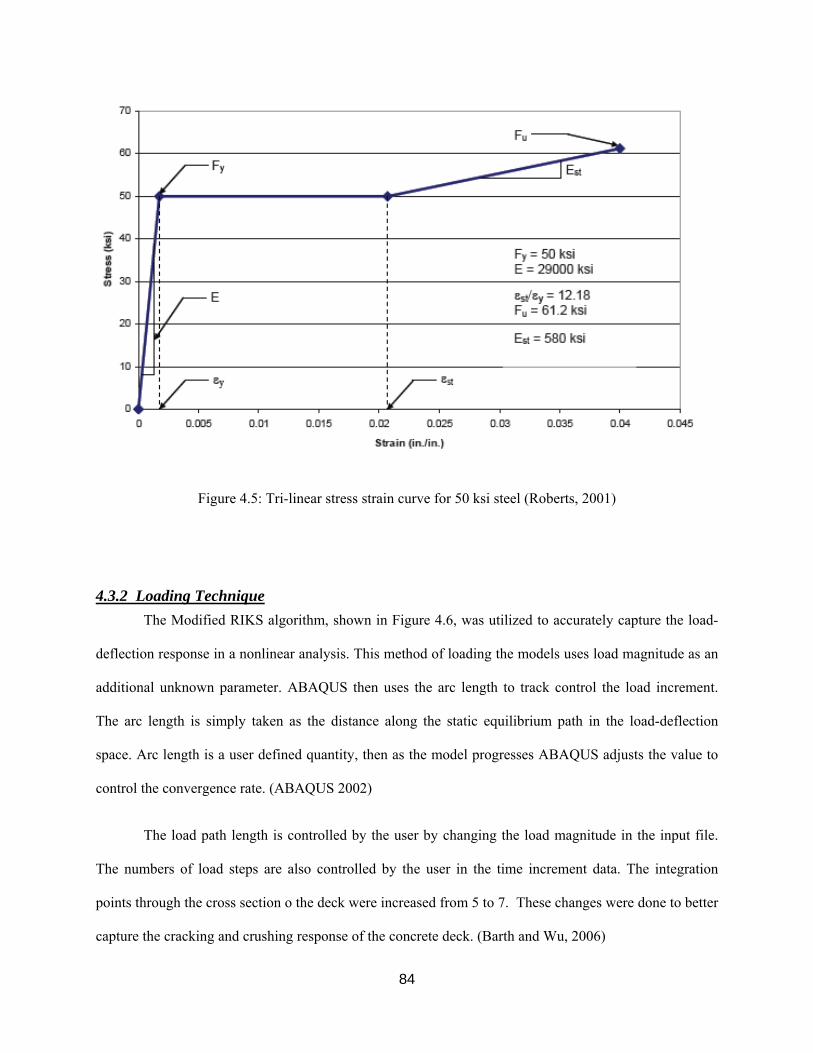
84
Figure 4.5: Tri-linear stress strain curve for 50 ksi steel (Roberts, 2001)
4.3.2 Loading Technique The Modified RIKS algorithm, shown in Figure 4.6, was utilized to accurately capture the load-
deflection response in a nonlinear analysis. This method of loading the models uses load magnitude as an
additional unknown parameter. ABAQUS then uses the arc length to track control the load increment.
The arc length is simply taken as the distance along the static equilibrium path in the load-deflection
space. Arc length is a user defined quantity, then as the model progresses ABAQUS adjusts the value to
control the convergence rate. (ABAQUS 2002)
The load path length is controlled by the user by changing the load magnitude in the input file.
The numbers of load steps are also controlled by the user in the time increment data. The integration
points through the cross section o the deck were increased from 5 to 7. These changes were done to better
capture the cracking and crushing response of the concrete deck. (Barth and Wu, 2006)
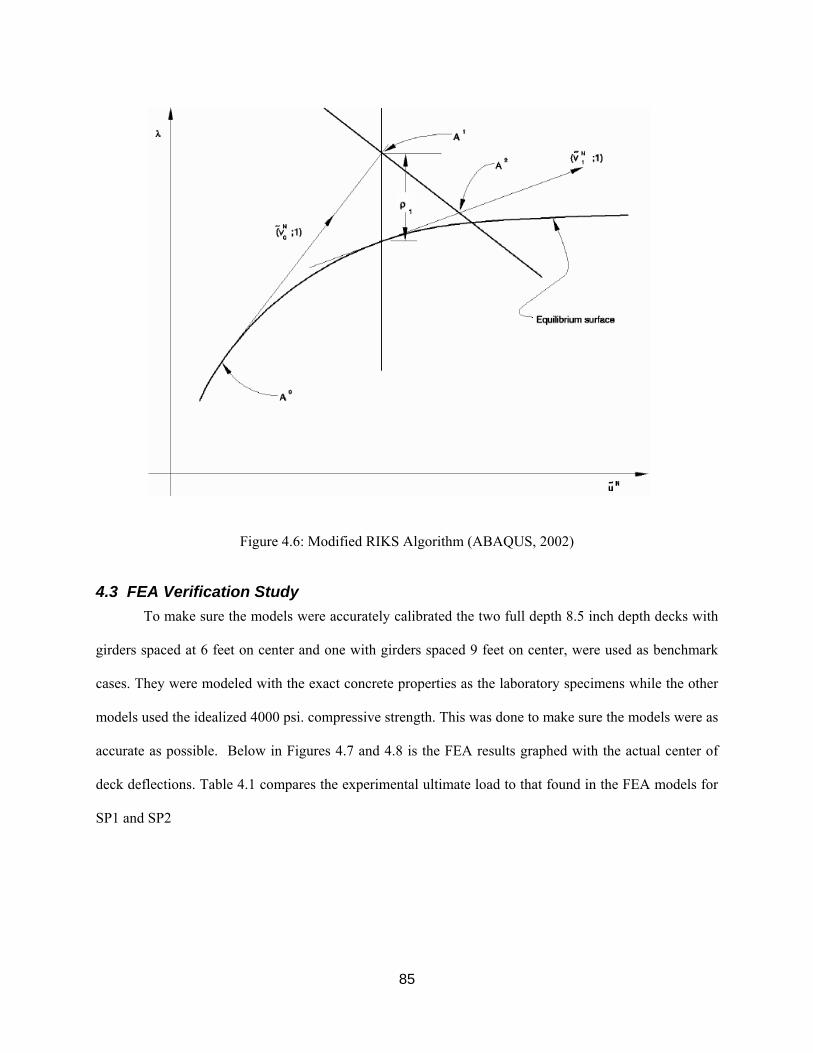
85
Figure 4.6: Modified RIKS Algorithm (ABAQUS, 2002)
4.3 FEA Verification Study To make sure the models were accurately calibrated the two full depth 8.5 inch depth decks with
girders spaced at 6 feet on center and one with girders spaced 9 feet on center, were used as benchmark
cases. They were modeled with the exact concrete properties as the laboratory specimens while the other
models used the idealized 4000 psi. compressive strength. This was done to make sure the models were as
accurate as possible. Below in Figures 4.7 and 4.8 is the FEA results graphed with the actual center of
deck deflections. Table 4.1 compares the experimental ultimate load to that found in the FEA models for
SP1 and SP2
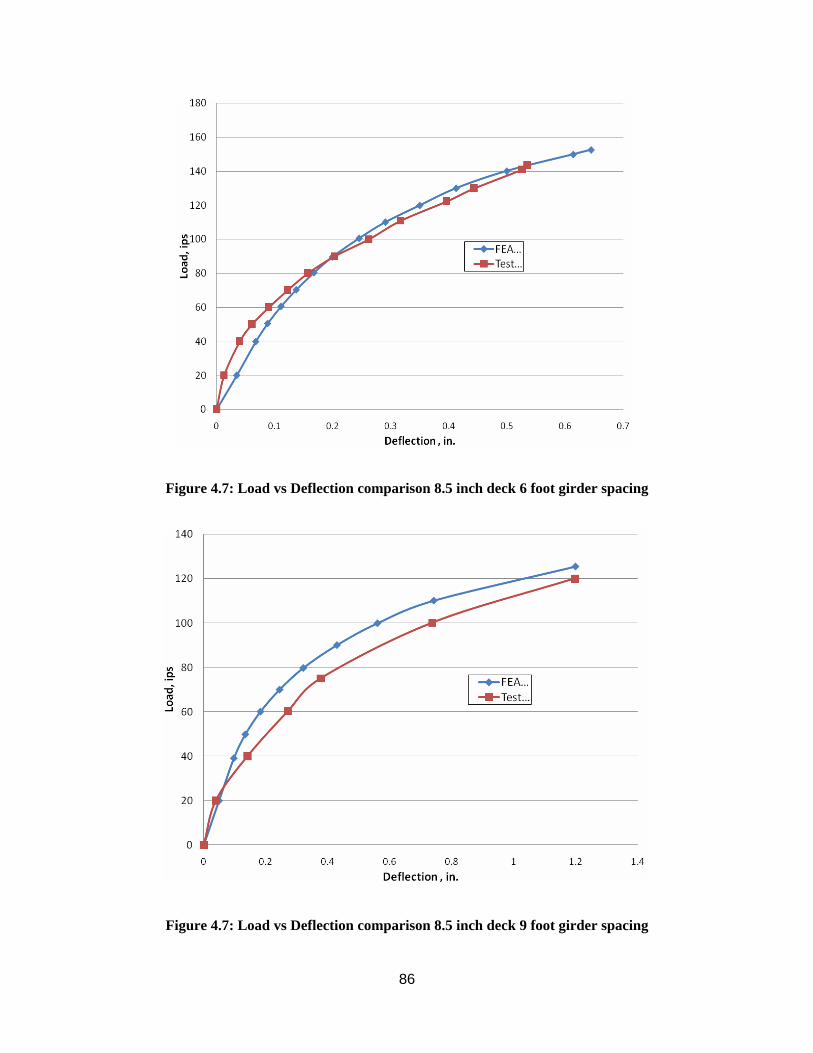
86
Figure 4.7: Load vs Deflection comparison 8.5 inch deck 6 foot girder spacing
Figure 4.7: Load vs Deflection comparison 8.5 inch deck 9 foot girder spacing
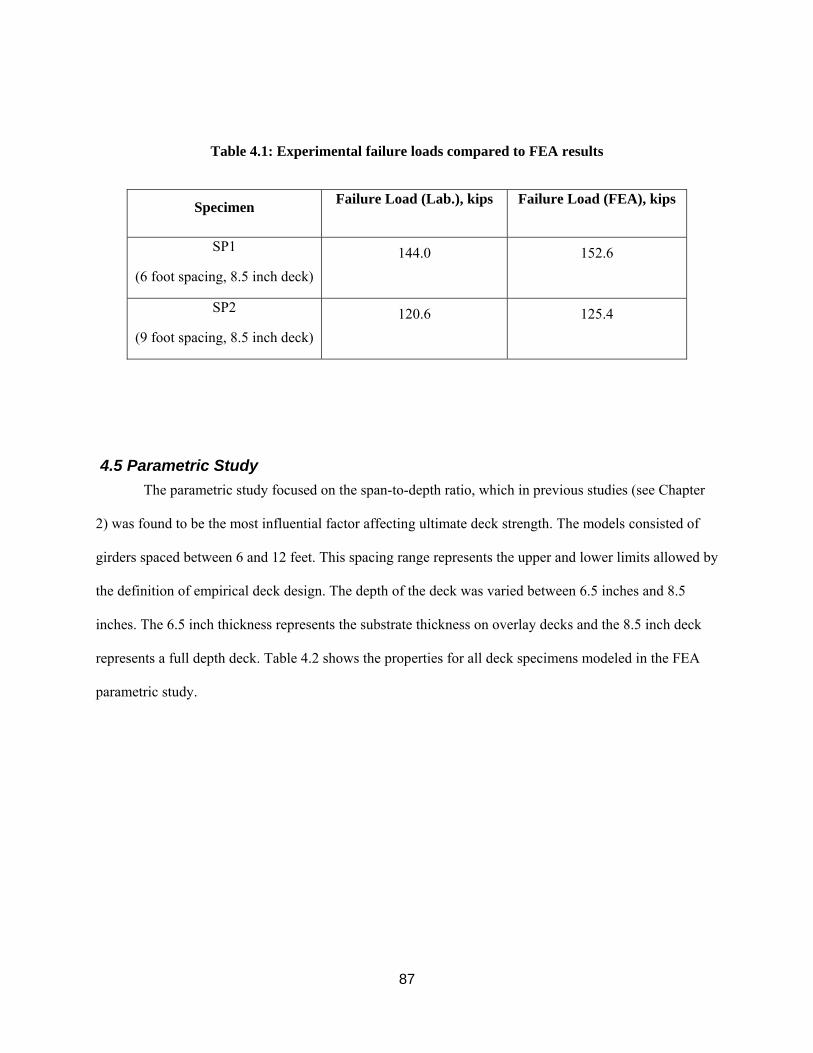
87
Table 4.1: Experimental failure loads compared to FEA results
Specimen Failure Load (Lab.), kips Failure Load (FEA), kips
SP1
(6 foot spacing, 8.5 inch deck) 144.0 152.6
SP2
(9 foot spacing, 8.5 inch deck) 120.6 125.4
4.5 Parametric Study The parametric study focused on the span-to-depth ratio, which in previous studies (see Chapter
2) was found to be the most influential factor affecting ultimate deck strength. The models consisted of
girders spaced between 6 and 12 feet. This spacing range represents the upper and lower limits allowed by
the definition of empirical deck design. The depth of the deck was varied between 6.5 inches and 8.5
inches. The 6.5 inch thickness represents the substrate thickness on overlay decks and the 8.5 inch deck
represents a full depth deck. Table 4.2 shows the properties for all deck specimens modeled in the FEA
parametric study.
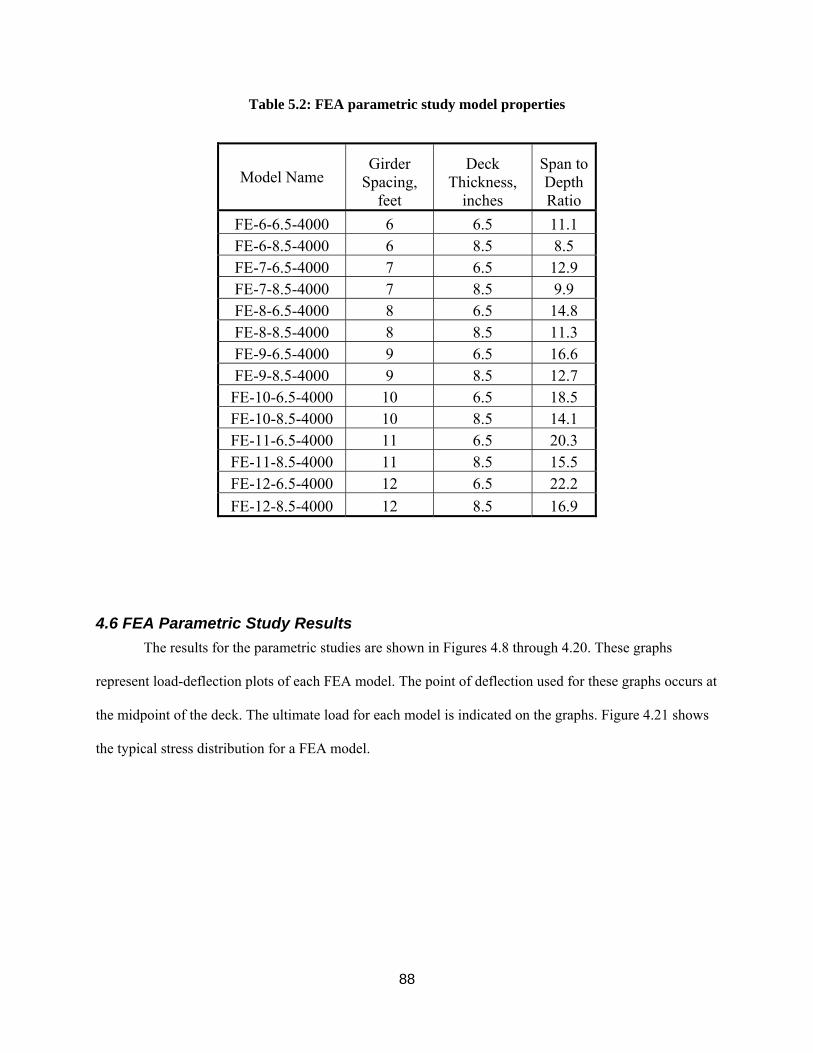
88
Table 5.2: FEA parametric study model properties
Model Name Girder
Spacing, feet
Deck Thickness,
inches
Span to Depth Ratio
FE-6-6.5-4000 6 6.5 11.1 FE-6-8.5-4000 6 8.5 8.5 FE-7-6.5-4000 7 6.5 12.9 FE-7-8.5-4000 7 8.5 9.9 FE-8-6.5-4000 8 6.5 14.8 FE-8-8.5-4000 8 8.5 11.3 FE-9-6.5-4000 9 6.5 16.6 FE-9-8.5-4000 9 8.5 12.7 FE-10-6.5-4000 10 6.5 18.5 FE-10-8.5-4000 10 8.5 14.1 FE-11-6.5-4000 11 6.5 20.3 FE-11-8.5-4000 11 8.5 15.5 FE-12-6.5-4000 12 6.5 22.2 FE-12-8.5-4000 12 8.5 16.9
4.6 FEA Parametric Study Results The results for the parametric studies are shown in Figures 4.8 through 4.20. These graphs
represent load-deflection plots of each FEA model. The point of deflection used for these graphs occurs at
the midpoint of the deck. The ultimate load for each model is indicated on the graphs. Figure 4.21 shows
the typical stress distribution for a FEA model.
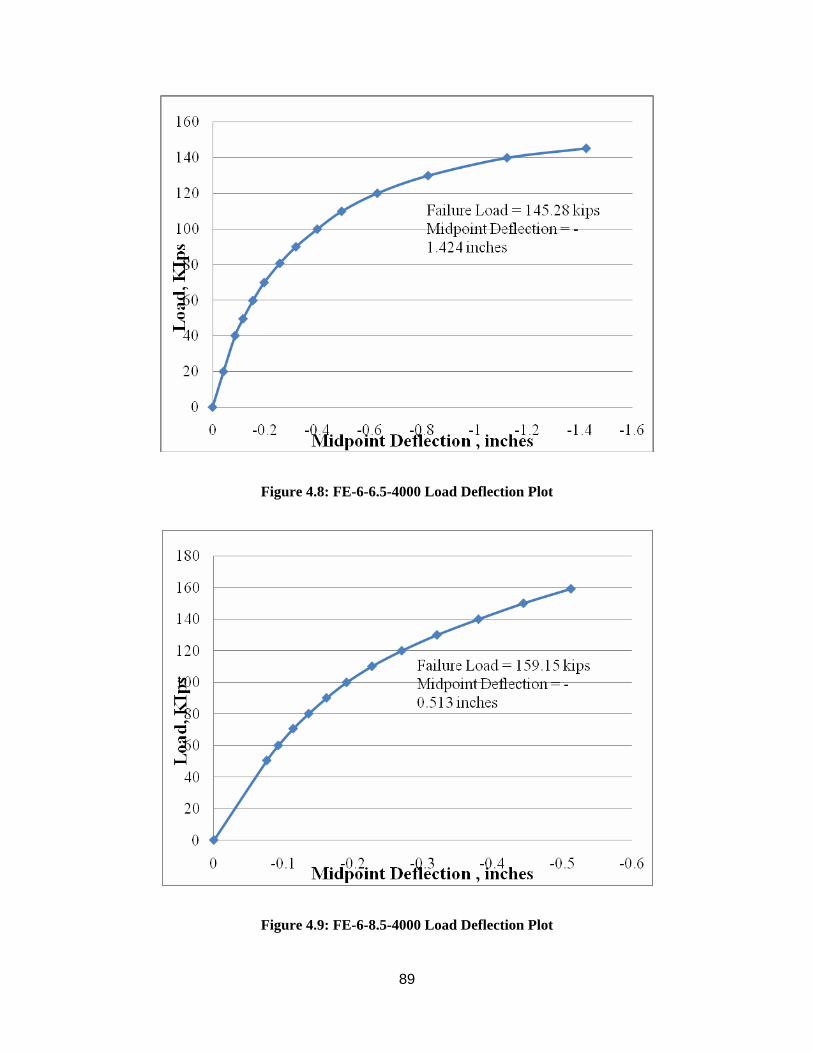
89
Figure 4.8: FE-6-6.5-4000 Load Deflection Plot
Figure 4.9: FE-6-8.5-4000 Load Deflection Plot
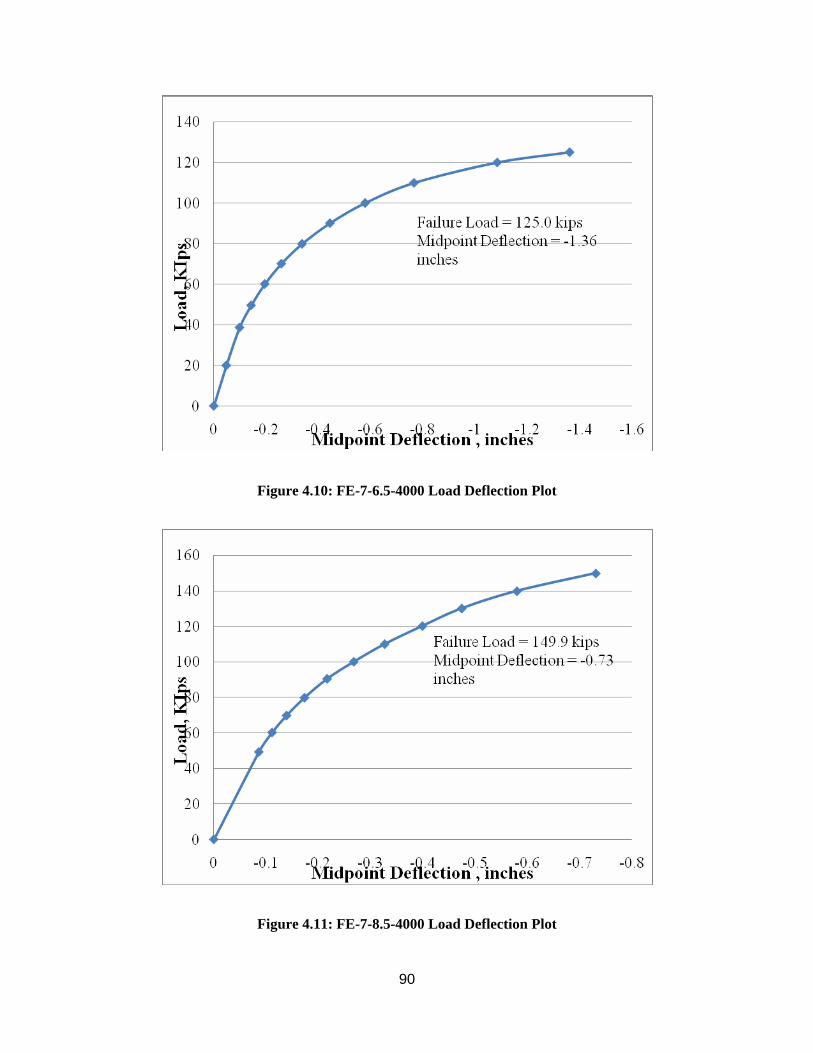
90
Figure 4.10: FE-7-6.5-4000 Load Deflection Plot
Figure 4.11: FE-7-8.5-4000 Load Deflection Plot
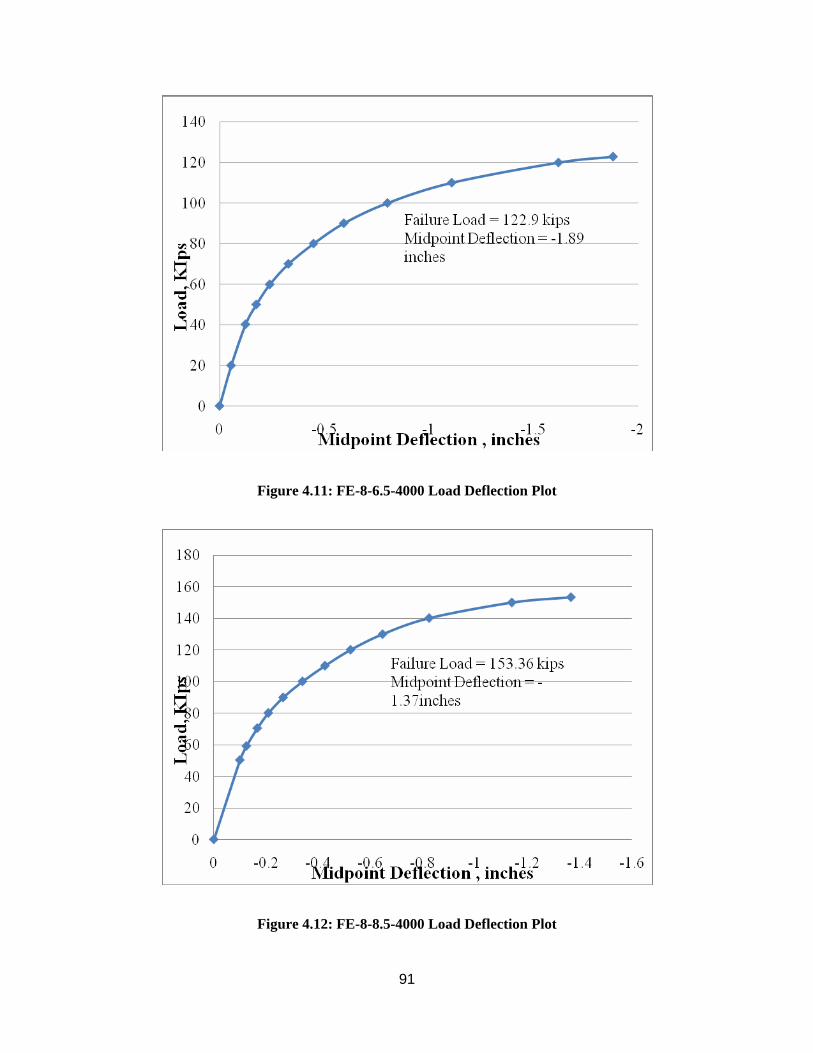
91
Figure 4.11: FE-8-6.5-4000 Load Deflection Plot
Figure 4.12: FE-8-8.5-4000 Load Deflection Plot
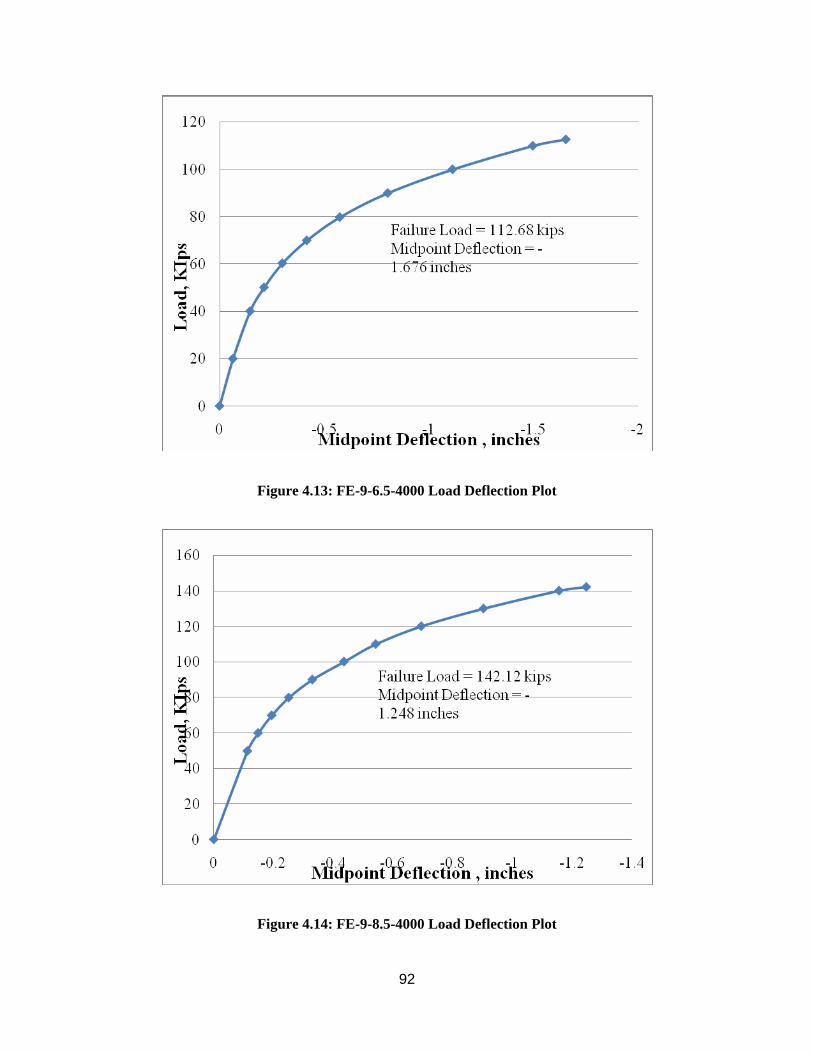
92
Figure 4.13: FE-9-6.5-4000 Load Deflection Plot
Figure 4.14: FE-9-8.5-4000 Load Deflection Plot
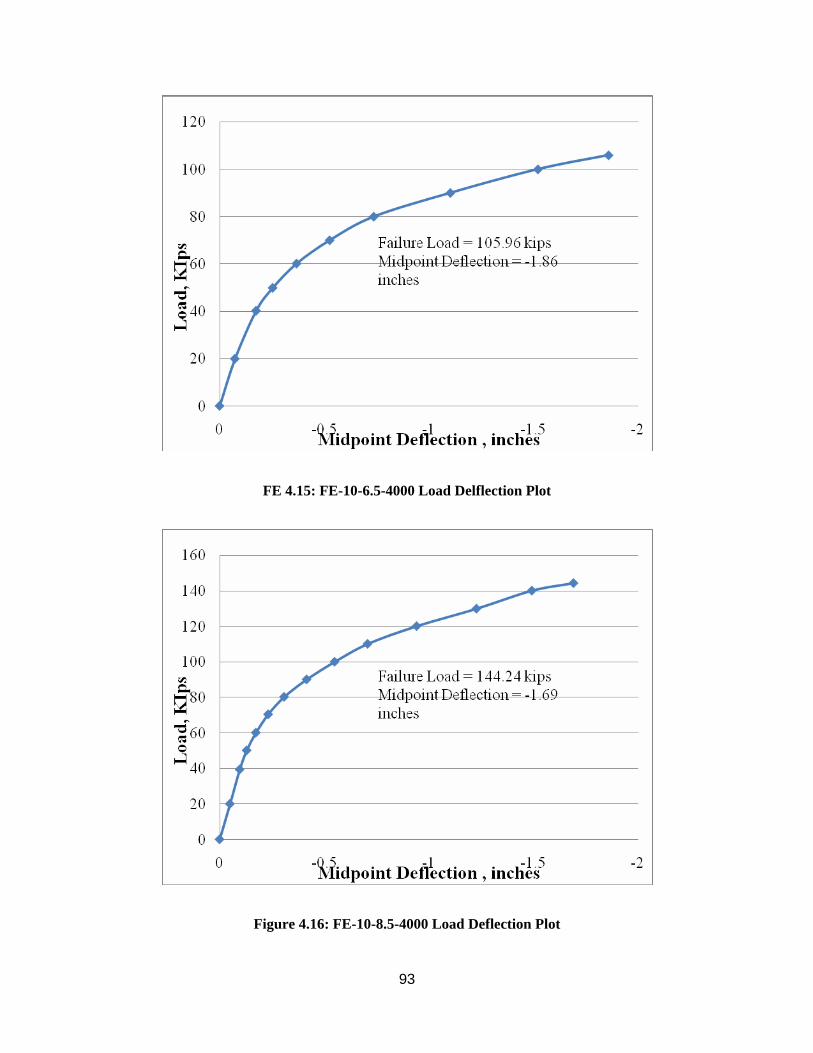
93
FE 4.15: FE-10-6.5-4000 Load Delflection Plot
Figure 4.16: FE-10-8.5-4000 Load Deflection Plot
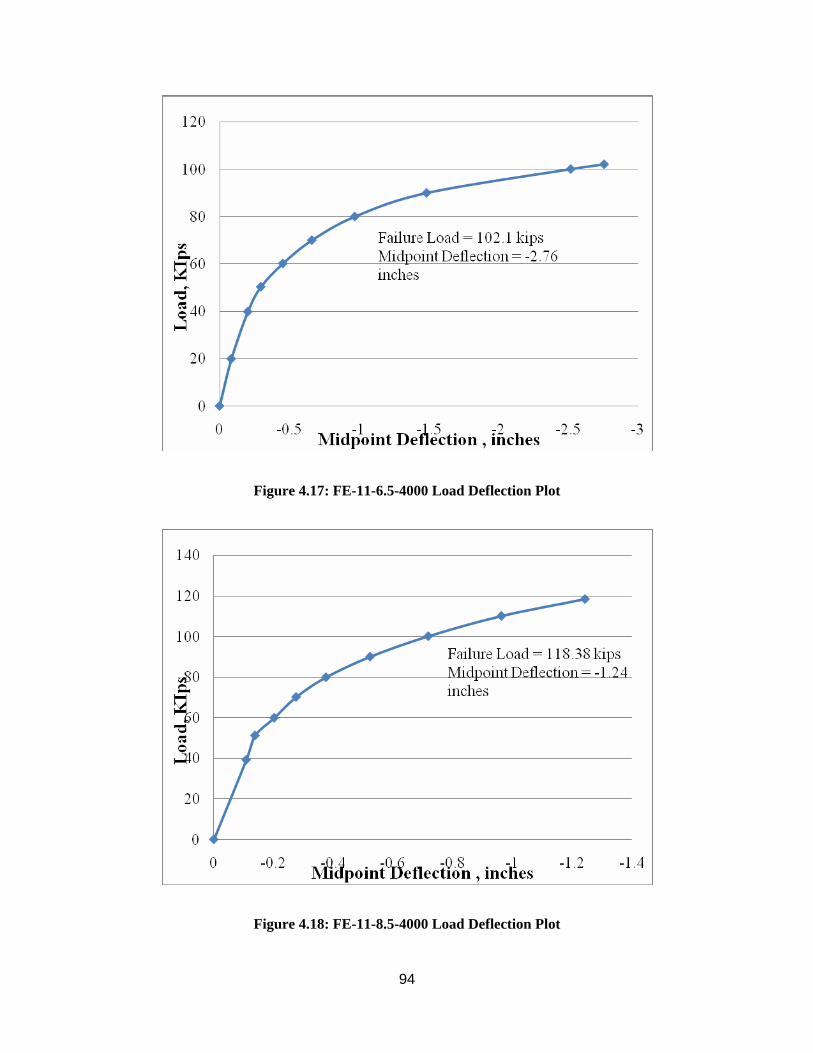
94
Figure 4.17: FE-11-6.5-4000 Load Deflection Plot
Figure 4.18: FE-11-8.5-4000 Load Deflection Plot
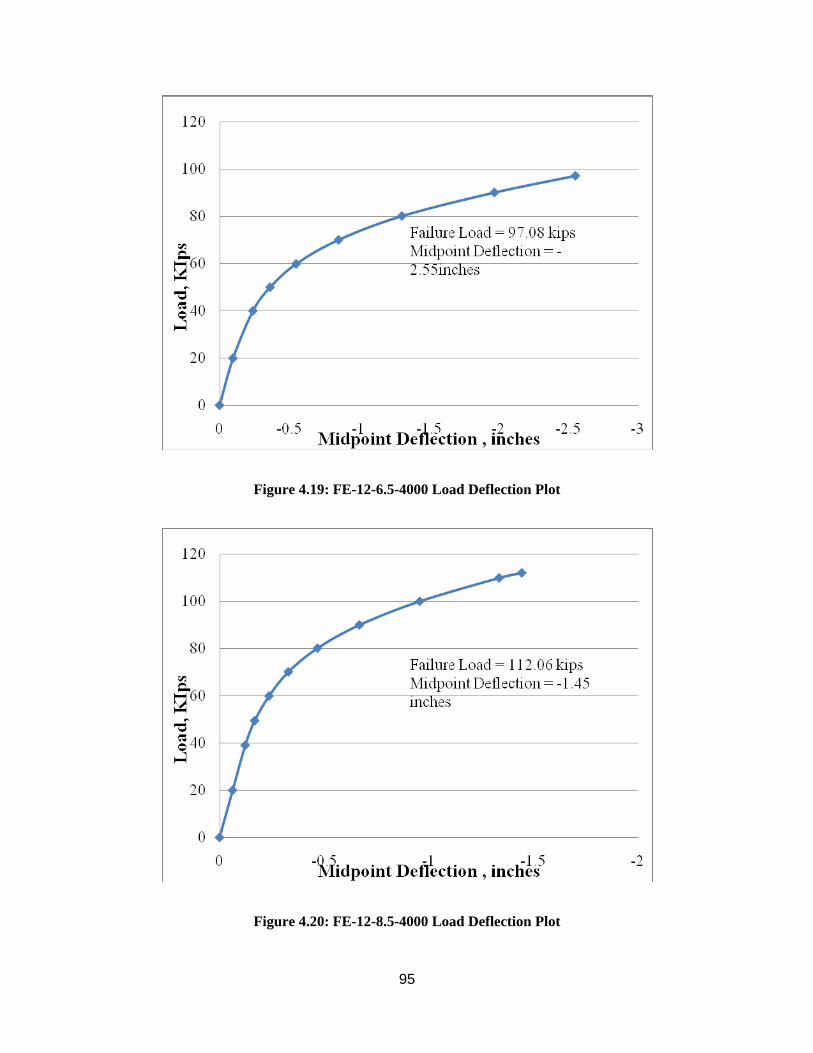
95
Figure 4.19: FE-12-6.5-4000 Load Deflection Plot
Figure 4.20: FE-12-8.5-4000 Load Deflection Plot
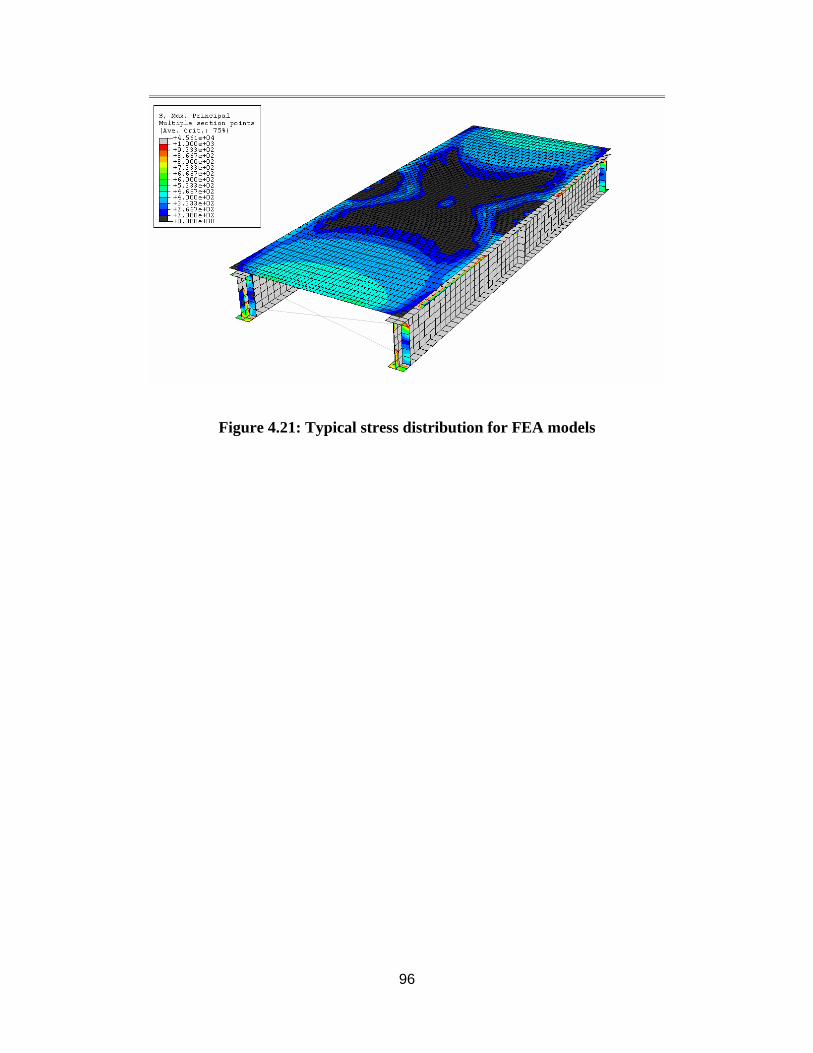
96
Figure 4.21: Typical stress distribution for FEA models
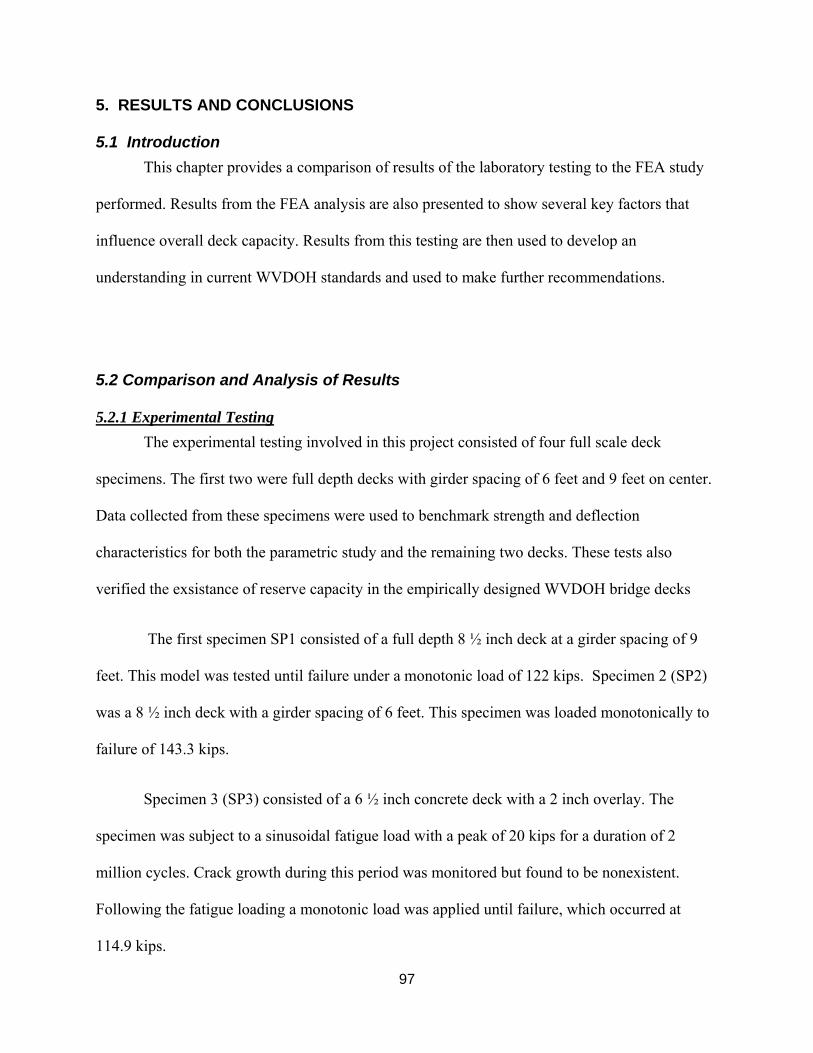
97
5. RESULTS AND CONCLUSIONS
5.1 Introduction This chapter provides a comparison of results of the laboratory testing to the FEA study
performed. Results from the FEA analysis are also presented to show several key factors that
influence overall deck capacity. Results from this testing are then used to develop an
understanding in current WVDOH standards and used to make further recommendations.
5.2 Comparison and Analysis of Results
5.2.1 Experimental Testing The experimental testing involved in this project consisted of four full scale deck
specimens. The first two were full depth decks with girder spacing of 6 feet and 9 feet on center.
Data collected from these specimens were used to benchmark strength and deflection
characteristics for both the parametric study and the remaining two decks. These tests also
verified the exsistance of reserve capacity in the empirically designed WVDOH bridge decks
The first specimen SP1 consisted of a full depth 8 ½ inch deck at a girder spacing of 9
feet. This model was tested until failure under a monotonic load of 122 kips. Specimen 2 (SP2)
was a 8 ½ inch deck with a girder spacing of 6 feet. This specimen was loaded monotonically to
failure of 143.3 kips.
Specimen 3 (SP3) consisted of a 6 ½ inch concrete deck with a 2 inch overlay. The
specimen was subject to a sinusoidal fatigue load with a peak of 20 kips for a duration of 2
million cycles. Crack growth during this period was monitored but found to be nonexistent.
Following the fatigue loading a monotonic load was applied until failure, which occurred at
114.9 kips.

98
The last specimen to be tested SP4 consisted of a 6 ½ inch deck supported by SIP forms.
These forms were constructed using WVDOH standards and were supported by 10 gage angle
attached to each girder. The specimen was subject to a sinusoidal fatigue load with a peak of 20
kips for 2 million cycles. During the fatigue loading crack growth was found to be extensive
throughout the specimen, this growth however followed no specific pattern. At the end of the
fatigue load a monotonic loading was applied to failure, which occurred at 114.9 kips. Strains
taken from above both girder flanges showed that the supporting angle orientation with the leg
pointing upward yields higher strain than the angle with the downward point leg (Figures 3.55
and 3.56).
All four test specimens failed by punching shear. This type of failure has sudden
decompression and leaves a distinct wedge-like block separated from the deck. Each of the four
test specimens exhibited adequate strength under the simulated wheel load and far surpassed the
design wheel load of 16 kips (AASHTO, 2003).
5.2.2 FEA Results In the verification study, See section 4.3, the results from SP1 and SP2 were compared to
the corresponding FEA models. These were the full depth deck specimens and were primarily
used for benchmarking FEA performance. The remaining two test specimens SP3 and SP4 are
compare to corresponding FEA results in figures 5.1 and 5.2.
The FEA parametric study was conducted to asses contributing factors in empirical deck
strength. From previous testing (See Chapter 2) it was found that the most important parameter
affecting strength is the span-to-depth (S/D) ratio. In Figure 5.3 the failure load is plotted versus
the S/D ratio to show how this factor affects overall deck strength. From this plot it is shown that
as the S/D ratio increases the failure load dramatically decreases. Three of the FEA models
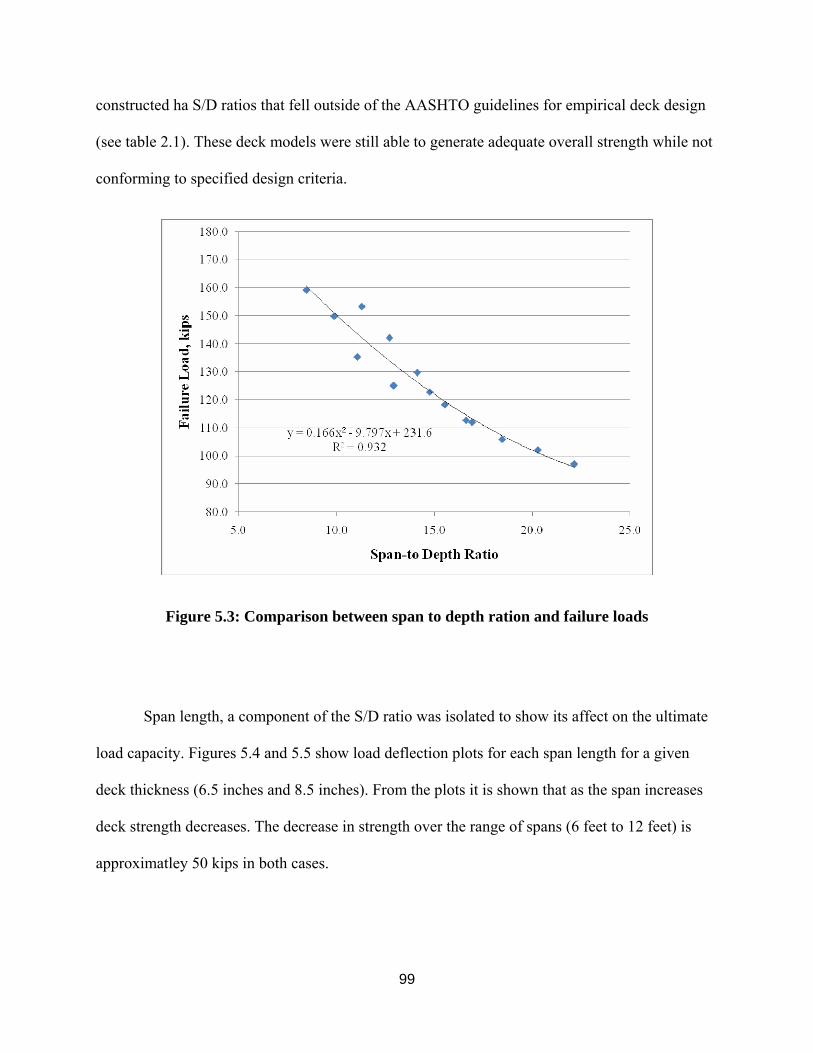
99
constructed ha S/D ratios that fell outside of the AASHTO guidelines for empirical deck design
(see table 2.1). These deck models were still able to generate adequate overall strength while not
conforming to specified design criteria.
Figure 5.3: Comparison between span to depth ration and failure loads
Span length, a component of the S/D ratio was isolated to show its affect on the ultimate
load capacity. Figures 5.4 and 5.5 show load deflection plots for each span length for a given
deck thickness (6.5 inches and 8.5 inches). From the plots it is shown that as the span increases
deck strength decreases. The decrease in strength over the range of spans (6 feet to 12 feet) is
approximatley 50 kips in both cases.
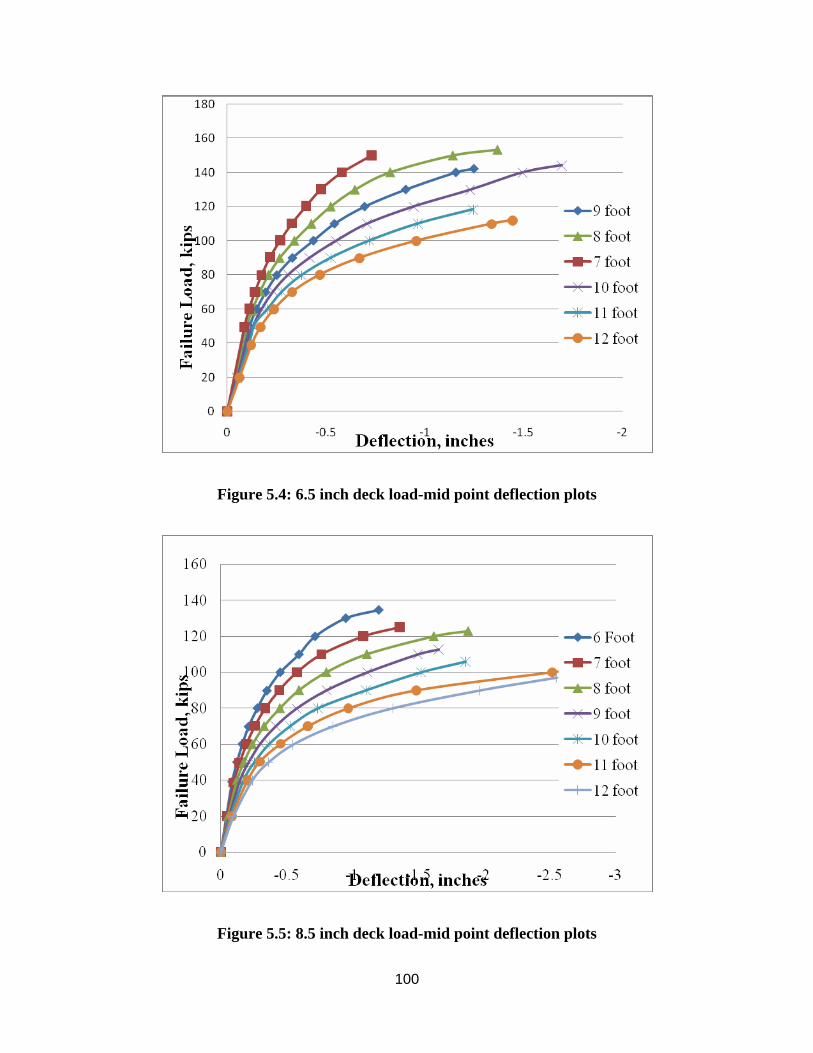
100
Figure 5.4: 6.5 inch deck load-mid point deflection plots
Figure 5.5: 8.5 inch deck load-mid point deflection plots

101
5.3 Key Findings and Future Recommendations The full scale laboratory testing and subsequent parametric study that was performed
yield valuable data that allows a better understanding into the performance of empirically
designed decks. Below are recommendations current the current design of empirically designed
decks and future studies to be undertaken:
- Longitudinal cracking above girder flanges could be attributed to construction
practices. Laboratory specimen did not exhibit any cracking during the curing stage,
but experienced extensive cracking when subjected to a simulated wheel load. Further
research dealing specifically with SIP forms is necessary
- While deck strength is sufficient to support design wheel loads, the issue of cracking
has lead to the increase of the substrate from 6 ½ inches to 7 ½ inches in the overlay
deck system. The design of these overlay deck systems should not rely on the overlay
to have full composite action with the concrete substrate.
102
References
AASHTO LRFD Bridge Design Specifications, 3 rd Edition (2004). American Association of State
Highway and Transportation Officials, Washington, D.C.
ABAQUS (2002). ABAQUS/Standar User’s Manual, Version 6.3, Hibbit, Karlsson & Sorensen, Inc.
Aly A., Bakht B., and Schaefer J. (1997). Design and Construction of a Steel-Free Deck Slab in Ontario,
Proceedings of the Canadian Society for Civil Engineering, Annual Conference, pp. 81-90.
Bakht B. (1996). Revisiting Arching in Deck Slabs, Canadian Journal of Civil Engineering, 23(4):
973-981.
Bakht B. and Jaeger L.G. (1985). Bridge Analysis Simplified, McGraw Hill Book Co.,
New York, 1985.
Bakht B. and Mufti A.A. (1997). Stay-in-place Concrete Formwork for Deck Slabs of Girder Bridges.
Journal of the Institution of Engineer (India), Vol. 78, November, pp.129-135.
Barth, K.E. and Wu, H. (2006. “Efficient Nonlinear Finite Element Modeling of Composite Steel Bridge
Girders.” Journal of Finite Elements in Analysis and Design, 42(14-15): 1304-1313
Batchelor B.deV, Hewitt B.E., and Csagoly P. (1978).An Investigation of the Fatigue Strength of
Deck Slabs of Composite Steel/Concrete Bridges, Transportation Research Record No. 664, pp.
153-161.
Batchelor B.deV. (1987). Membrane Enhancement in Top Slabs of Concrete Bridges-Chapter 6,

103
Concrete Bridge Engineering: Performance and Advances. Elsevier Applied Science Publishers
Ltd., Barking, Essex, England.
Bridge Design Manual (2004). West Virginia Department of Transportation, Division of Highways.
BridgeSight Software (1999). Reinforced Concrete Slab Design Using the Empirical Method,
http://www.bridgesite.com/bridgesightsol/files/empiricalslabdesign.pdf.
CSA International (2000). CAN/CSA-S6-00 Canadian Highway Bridge Design Code: A National
Standard of Canada.
Csagoly P.F. and Lybas J.M. (1989). Advanced Design Method for Concrete Bridge Deck Slabs,
Concrete International, May, 1989, 11(5):53-63.
Csagoly P.F., Holowka M., and Dorton R.A. (1978). The True Behaviour of Thin Concrete Deck
Slabs, TRR Record No 664, Washington DC, pp. 171-179.
Dorton R.A., Holowka M., and King J.P.C. (1977). The Connestogo River Bridge-Design and
Testing. Canadian Journal of Civil Engineering, Vol. 4, No. 1, pp.18-39.
Fang I.K. (1985). Behavior of Ontario-Type Bridge Deck on Steel Girders, Ph.D. Dissertation,
University of Texas at Austin.
Fang I.K., Tsui C.K.T, Burns N.H., and Klinger R.E. (1990b). Fatigue Behavior of Cast-in-Place and
Precast Panel Bridge Decks with Isotropic Reinforcement, PCI Journal, 35(3): 28-39.

104
Fang I.K., Tsui C.K.T, Burns, N.H., and Klingner R.E. (1990). Load Capacity of Isotropically
Reinforced, Cast-in-Place and Precast Panel Bridge Decks, PCI Journal, 35(4): 104-114.
Fenwick R.C. and Dickson A.R. (1989). Slabs Subjected to Concentrated Loading, ACI Structural
Journal, Nov-Dec. 1989, pp.672-678.
Graddy J.C., Kim J., Whitt J.H., Burns N.H., and Klingner R.E. (2002). Puching-Shear Behavior of
Bridge Decks under Fatigue Loading, Structural Journal, 99(3): 257-266.
Hewitt B.E. (1972). An Investigation of the Punching Strength of Restrained Slabs with Particular
Reference to the Deck Slabs of Composite I-Beam Bridges. PhD Thesis, Queen’s University at
Kingston, Ontario, Canada.
Hewitt B.E. and Batchelor B.deV. (1975). Punching Shear Strength of Restrained Slabs. Journal of
the Structural Division, ASCE, Vol. 101, No. ST9, Proc. Paper 1154 B, pp.1837-1853.
Holowka M. (1980). Testing of Composite Prestressed Concrete AASHTO Girder Bridge, RR222,
Ministry of Transportation, Downsview, Ontario.
Holowka M. (1981). Testing of a Trapezoidal Box Girder Bridge. RR221, Ministry of
Transportation, Downsview, Ontario.
Holowka M., Dorton R.A., and Csagoly P.F. (1980). Punching Shear Strength of Restrained Circular
Slabs, Ministry of Transportation and Communication, Downsview, Ontario, Canada.

105
Memorandum: Standard Cast-in-Place Concrete Bridge Decks (2005), West Virginia Department of
Transportation, Division of Highways.
Mufti A.A. and Bakht B. (1999). Steel Free Fibre Reinforced Concrete Bridge Decks: New
Construction and Replacement, APWA International Public Works Congress, NRCC/CPWA
Seminar Series “Innovations in Urban Infrastructure”, 63-71.
Mufti A.A., Jaeger L.G., Bakht B., and Wegner L.D. (1993). Experimental Investigation of Fibre-
reinforced Concrete Deck Slabs without Internal Steel Reinforcement. Canadian Journal of Civil
Engineering, 20(3): 398-406.
Ontario Highway Bridge Design Code (1991), 3rd edition, Ministry of Transportation, Ontario.
Rankin G.I.B. and Long A.E. (1997). Arching Action Strength Enhancement in Laterally-Restrained
Slab Strips, Proceedings of Institution of Civil Engineers Structures & Buildings 122, Nov. 1997,
461-467.