Evaluation of Coarse Aggregate Angularity Properties and ...docs.trb.org/prp/11-2904.pdf ·...
19
Bennert, Cooley, Ericson, and Zavery TRB Paper No. 11-2904 1 Title: Evaluation of Coarse Aggregate Angularity Properties and Its Relationship to Permanent Deformation for New York State Gravel Aggregates Authors: Thomas Bennert, Ph.D.* Senior Research Engineer Rutgers University Center for Advanced Infrastructure and Transportation (CAIT) 100 Brett Road Piscataway, NJ, 08854 [email protected] L. Allen Cooley, Ph.D. Principal and Senior Pavements/Materials Engineer Burns Cooley Dennis, Inc. 278 Commerce Park Drive Ridgeland, MS 39157 [email protected] Christopher Ericson Graduate Student/Research Assistant Rutgers University Department of Civil and Environmental Engineering 623 Bowser Road Piscataway, NJ 08854 [email protected] Zoeb Zavery, P.E. New York State Department of Transportation (NYSDOT) Materials Bureau, POD 34 50 Wolf Road Albany, NY 12232 [email protected] *Corresponding Author: Thomas Bennert Word Count: Text = 5,738, Tables = 5, Figures = 2 ; Total = 7,488 Paper Submitted for Presentation and Publication to the 90 th Annual Meeting of the Transportation Research Board January 23 th to 27 th , 2011 Washington, D.C. TRB 2011 Annual Meeting Paper revised from original submittal.
Transcript of Evaluation of Coarse Aggregate Angularity Properties and ...docs.trb.org/prp/11-2904.pdf ·...
Bennert, Cooley, Ericson, and Zavery TRB Paper No. 11-2904
1
Title: Evaluation of Coarse Aggregate Angularity Properties and Its Relationship to Permanent Deformation for New York State Gravel Aggregates
Authors: Thomas Bennert, Ph.D.*
Senior Research Engineer Rutgers University Center for Advanced Infrastructure and Transportation (CAIT) 100 Brett Road Piscataway, NJ, 08854 [email protected] L. Allen Cooley, Ph.D. Principal and Senior Pavements/Materials Engineer Burns Cooley Dennis, Inc. 278 Commerce Park Drive Ridgeland, MS 39157 [email protected] Christopher Ericson Graduate Student/Research Assistant Rutgers University Department of Civil and Environmental Engineering 623 Bowser Road Piscataway, NJ 08854 [email protected] Zoeb Zavery, P.E. New York State Department of Transportation (NYSDOT) Materials Bureau, POD 34 50 Wolf Road Albany, NY 12232 [email protected]
*Corresponding Author: Thomas Bennert Word Count: Text = 5,738, Tables = 5, Figures = 2 ; Total = 7,488
Paper Submitted for Presentation and Publication to the 90th Annual Meeting of the Transportation Research Board
January 23th to 27th, 2011 Washington, D.C.
TRB 2011 Annual Meeting Paper revised from original submittal.
Bennert, Cooley, Ericson, and Zavery TRB Paper No. 11-2904
2
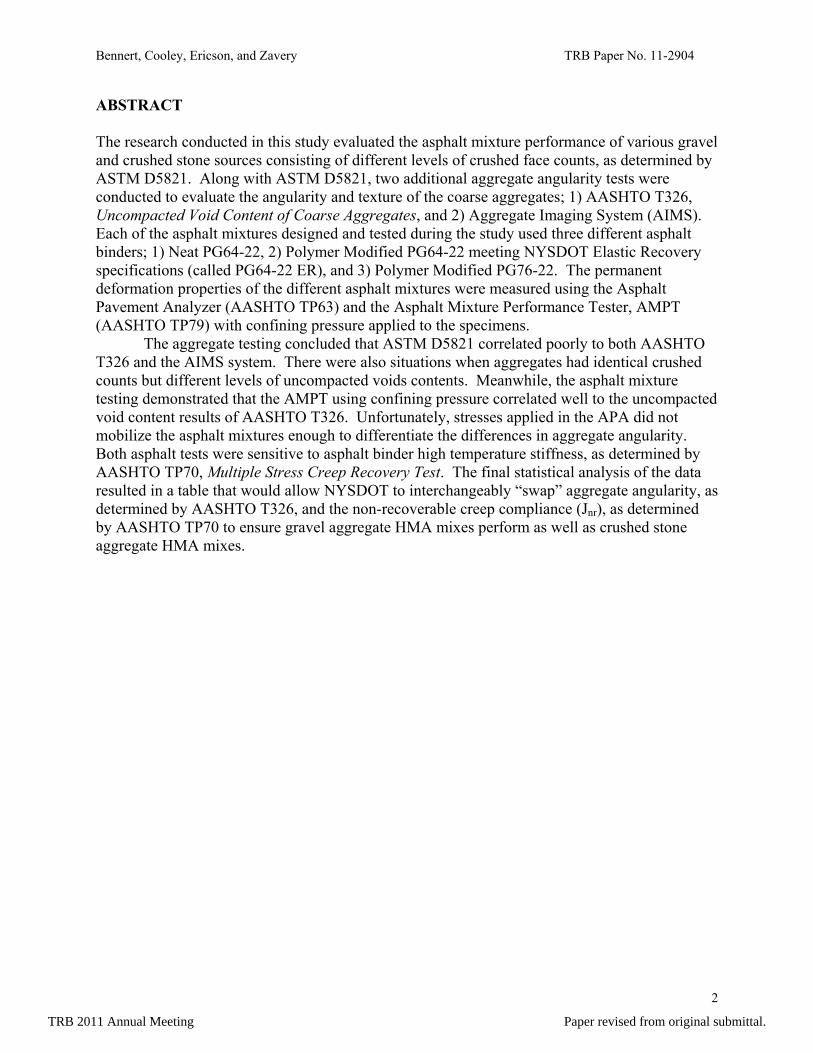
ABSTRACT The research conducted in this study evaluated the asphalt mixture performance of various gravel and crushed stone sources consisting of different levels of crushed face counts, as determined by ASTM D5821. Along with ASTM D5821, two additional aggregate angularity tests were conducted to evaluate the angularity and texture of the coarse aggregates; 1) AASHTO T326, Uncompacted Void Content of Coarse Aggregates, and 2) Aggregate Imaging System (AIMS). Each of the asphalt mixtures designed and tested during the study used three different asphalt binders; 1) Neat PG64-22, 2) Polymer Modified PG64-22 meeting NYSDOT Elastic Recovery specifications (called PG64-22 ER), and 3) Polymer Modified PG76-22. The permanent deformation properties of the different asphalt mixtures were measured using the Asphalt Pavement Analyzer (AASHTO TP63) and the Asphalt Mixture Performance Tester, AMPT (AASHTO TP79) with confining pressure applied to the specimens.
The aggregate testing concluded that ASTM D5821 correlated poorly to both AASHTO T326 and the AIMS system. There were also situations when aggregates had identical crushed counts but different levels of uncompacted voids contents. Meanwhile, the asphalt mixture testing demonstrated that the AMPT using confining pressure correlated well to the uncompacted void content results of AASHTO T326. Unfortunately, stresses applied in the APA did not mobilize the asphalt mixtures enough to differentiate the differences in aggregate angularity. Both asphalt tests were sensitive to asphalt binder high temperature stiffness, as determined by AASHTO TP70, Multiple Stress Creep Recovery Test. The final statistical analysis of the data resulted in a table that would allow NYSDOT to interchangeably “swap” aggregate angularity, as determined by AASHTO T326, and the non-recoverable creep compliance (Jnr), as determined by AASHTO TP70 to ensure gravel aggregate HMA mixes perform as well as crushed stone aggregate HMA mixes.
TRB 2011 Annual Meeting Paper revised from original submittal.
Bennert, Cooley, Ericson, and Zavery TRB Paper No. 11-2904
3
INTRODUCTION Aggregates comprise over 80% of the hot mix asphalt (HMA) mixture by volume. Therefore, it is obvious that aggregate characteristics are a major factor in the performance of HMA. In the Superpave mixture design system, aggregate criteria were included to assure proper performance of the HMA. These criteria included: coarse aggregate angularity (percent of fractured faces), fine aggregate angularity (percent uncompacted voids in the fine aggregate), flat and elongated particles, clay content, and gradation parameters. The recommended limits set during the Strategic Highway Research Program (SHRP) on these aggregate criteria were established by a group of experts based on years of previous research and experience utilizing the Modified Delphi approach (1). The main premise behind the aggregate criteria was to provide an angular aggregate skeleton to maximize internal shear strength, and hence, mixture stability.
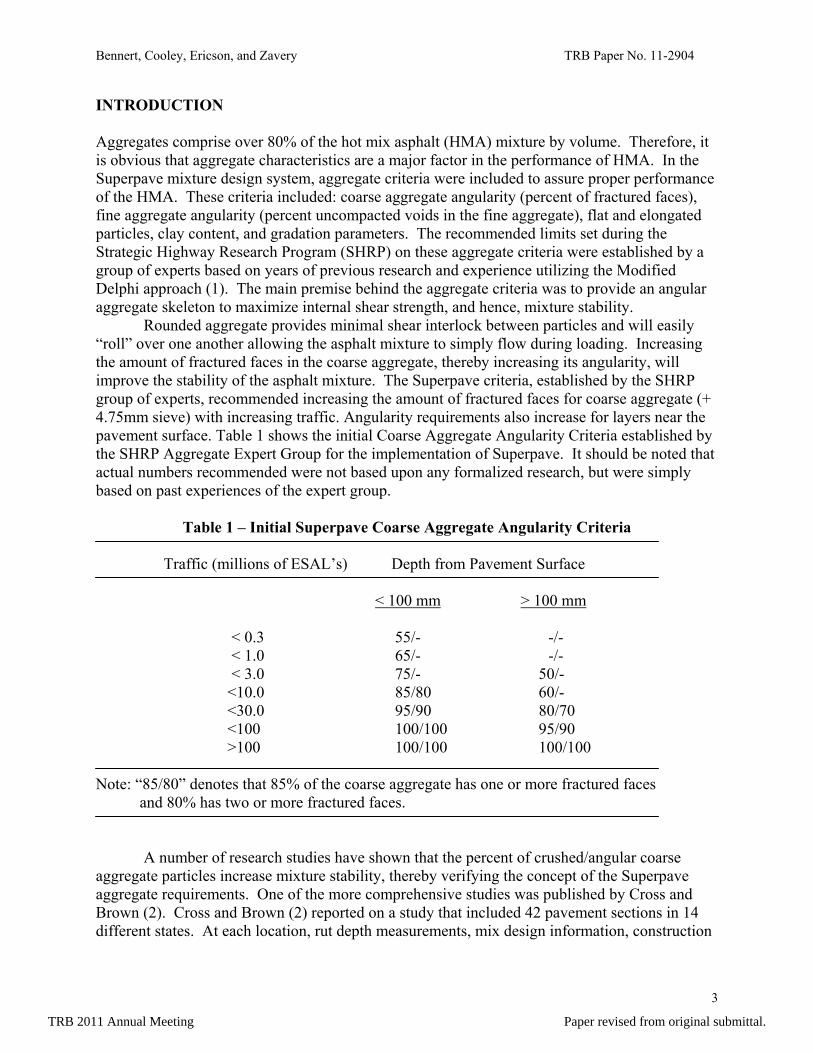
Rounded aggregate provides minimal shear interlock between particles and will easily “roll” over one another allowing the asphalt mixture to simply flow during loading. Increasing the amount of fractured faces in the coarse aggregate, thereby increasing its angularity, will improve the stability of the asphalt mixture. The Superpave criteria, established by the SHRP group of experts, recommended increasing the amount of fractured faces for coarse aggregate (+ 4.75mm sieve) with increasing traffic. Angularity requirements also increase for layers near the pavement surface. Table 1 shows the initial Coarse Aggregate Angularity Criteria established by the SHRP Aggregate Expert Group for the implementation of Superpave. It should be noted that actual numbers recommended were not based upon any formalized research, but were simply based on past experiences of the expert group.
Table 1 – Initial Superpave Coarse Aggregate Angularity Criteria Traffic (millions of ESAL’s) Depth from Pavement Surface < 100 mm > 100 mm < 0.3 55/- -/- < 1.0 65/- -/- < 3.0 75/- 50/- <10.0 85/80 60/- <30.0 95/90 80/70 <100 100/100 95/90 >100 100/100 100/100 Note: “85/80” denotes that 85% of the coarse aggregate has one or more fractured faces and 80% has two or more fractured faces.
A number of research studies have shown that the percent of crushed/angular coarse aggregate particles increase mixture stability, thereby verifying the concept of the Superpave aggregate requirements. One of the more comprehensive studies was published by Cross and Brown (2). Cross and Brown (2) reported on a study that included 42 pavement sections in 14 different states. At each location, rut depth measurements, mix design information, construction
TRB 2011 Annual Meeting Paper revised from original submittal.
Bennert, Cooley, Ericson, and Zavery TRB Paper No. 11-2904
4
records, traffic counts, and pavement samples were collected and recorded. All of the collected data was analyzed and compared with the field rutting information. Of all the material and mixture properties studied, coarse and fine aggregate angularity (percent fractured faces and uncompacted voids, respectively) correlated best to pavement rutting (i.e. – as aggregate angularity increased, pavement rutting decreased).
Although the intent of the Superpave aggregate specifications was to ensure a high level of internal shear strength by maximizing aggregate angularity, in some states, it precluded many suppliers from using native gravel sources for HMA in asphalt pavements designed for traffic levels in excess of 30 millions ESAL’s. According to Superpave, coarse aggregates to be used in an asphalt mixture where the traffic level is greater than 30 million ESAL’s must have a coarse aggregate angularity of 100/100. This requirement eliminates practically all New York gravel sources from being used on these pavements because they would never meet the 100/100 angularity requirement. Therefore, a NYSDOT supplier/contractor would be required to bring in crushed stone to meet the 100/100 requirement. This would obviously increase the price of the HMA due to the additional material and shipping costs of the crushed stone.
This exact situation arose in 2003 when an aggregate supplier in New York State approached the NYSDOT about using a 100/98 gravel for a HMA mix that was to be placed on a pavement with traffic levels exceeding 30 million ESAL’s. The supplier, Lopke Products from Binghamton, NY, contracted the National Center for Asphalt Technology (NCAT) to conduct rutting-type testing, utilizing the Asphalt Pavement Analyzer, on two sources of coarse aggregates; a 100/100 and a 100/98. Based on the rutting tests conducted by NCAT, it was statistically determined that the 100/100 and 100/98 gravels produced similar rut resistant mixtures (4). Based on this study, the NYSDOT revised its current specifications to allow 100/98 coarse aggregates for asphalt mixtures placed on pavements exceeding 30 million ESAL’s.
In 2004, Lopke Products again utilized the laboratory services of NCAT to evaluate angularity issues (3, 4). Although the main premise behind the 2004 study was to evaluate levels of fine aggregate angularity, additional work regarding the coarse aggregate angularity was also conducted. As reported by Prowell et al. (4), three different levels of coarse aggregate angularity were evaluated; two crushed gravels having a coarse aggregate angularity of 100/90 and 100/95, and a limestone aggregate of 100/100. All three coarse aggregates were blended with the identical limestone manufactured sand to produce a 12.5mm nominal maximum aggregate size (NMAS) gradation according to the Superpave specifications. The final mixture gradations and volumetric properties of the 12.5 NMAS were all similar. Statistical comparisons of the Asphalt Pavement Analyzer rutting results indicated that the results between the three different HMA mixtures were similar, meaning that the performance of the HMA mixtures were not affected by the differences in the coarse aggregate angularity values. Identical findings were also determined using three different 25mm NMAS HMA mixtures produced with different coarse aggregate angularity values. OBJECTIVES The objectives of this research were to: 1) evaluate the rutting performance of NYSDOT HMA mixes containing gravels with varying degrees of angularity and 2) compare different methods to characterize the angularity of coarse aggregates.
TRB 2011 Annual Meeting Paper revised from original submittal.
Bennert, Cooley, Ericson, and Zavery TRB Paper No. 11-2904
5
MATERIALS SUMMARY Aggregates Four (4) NYSDOT approved gravel sources, which represented the greatest volume of gravel usage and supply for hot mix asphalt, were used in the study. The sources are shown below along with their respective fractured face count as supplied by the NYSDOT. For each source, crushed gravel conforming to NYSDOT 1 and 1A gradation designations were sampled. Uncrushed gravel from the identical sources that conformed to the 1 and 1A designation were also sampled for blending with crushed gravel. The blending of crushed and uncrushed gravels were used to manufacture different magnitudes of fractured face counts for eventual permanent deformation evaluation. The final breakdown of the gravel sources and manufactured fractured face counts are shown in Table 2.
1. G1 CAA: 1’s: 100/99.5; 1A’s: 100/99.9
2. G3 CAA: 1’s: 100/99.2; 1A’s: 100/99.4
3. G1 CAA: 1’s: 100/92.9; 1A’s: 100/98.6
4. G4 CAA: 1’s: 100/99.2; 1A’s: 100/99.4
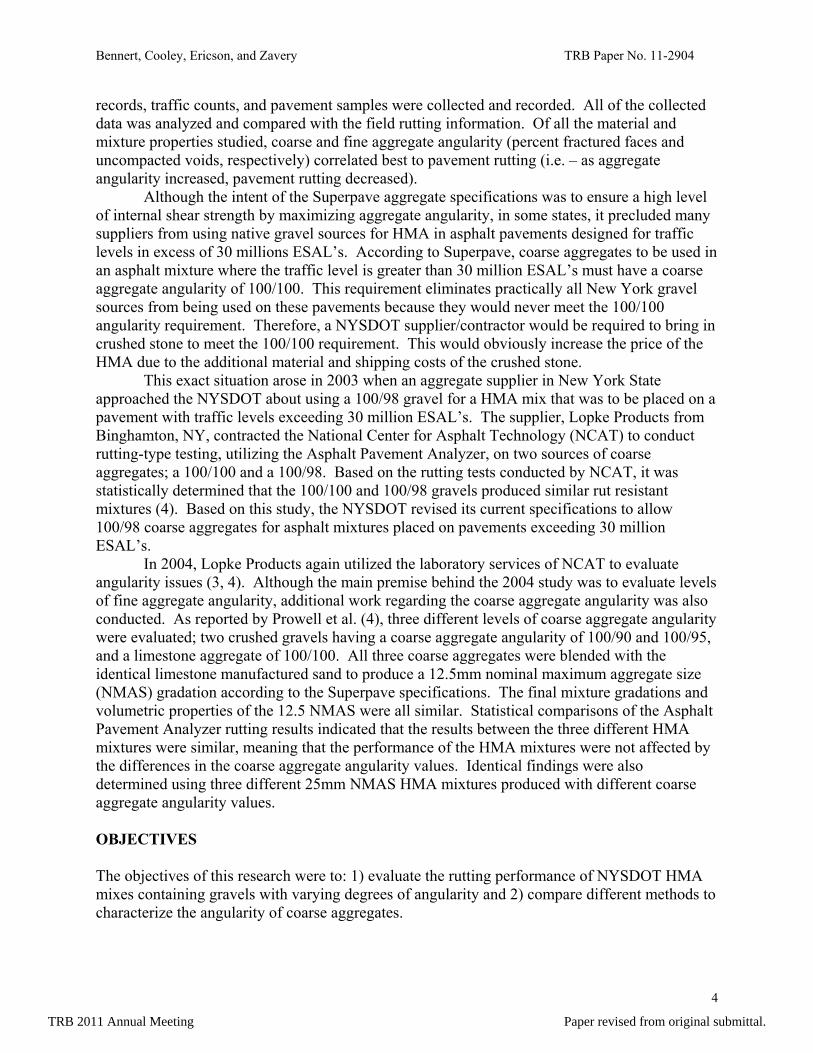
Two (2) NYSDOT approved crushed stone sources were included as “baseline” data to illustrate a 100/100 crushed stone. The two (2) crushed stone sources and the 20 different gravel blends provide a total of 22 different aggregate blends that were evaluated under aggregate angularity testing and hot mix asphalt laboratory rutting tests.
Table 2 – Proposed Coarse Aggregate Angularity Blends
ASTM D5821 Fractured Face Counts (Based on Theoretical Blending)
G1 G2 G3 G4 100/96 100/99 100/99 100/99 97/93 97/96 97/96 97/96 94/90 94/93 94/93 94/93 91/87 91/90 91/90 91/90 88/84 88/87 88/87 88/87
TRB 2011 Annual Meeting Paper revised from original submittal.
Bennert, Cooley, Ericson, and Zavery TRB Paper No. 11-2904
6
Asphalt Binders Three different asphalt binders were used during the mixture performance testing; 1) PG64-22, PG64-22 with an elastic recovery requirement, and 3) PG76-22. Prior to conducting the mixture testing work, the asphalt binders were continuous PG graded (AASHTO M320 and R29) and tested in accordance to AASHTO TP70, Multiple Stress Creep Recovery Test of Asphalt Binder Using a Dynamic Shear Rheometer. The asphalt binder test results are shown below. The results show that the high temperature PG grade, which would influence the rutting performance of the asphalt mixtures, increases from the PG64-22 to the PG64-22 (ER) to the PG76-22. The non-recoverable creep compliance (Jnr), measured at 64oC, decreases in the same manner (i.e. - the lower the Jnr value, the more rut resistant the asphalt binder).
PG64-22: Continuous Grade: 69.3-26.5 (20.4); Jnr = 2.42 kPa, % Recovery = 1.91%; PG64-22ER: Continuous Grade: 75.1-26.8 (22.2); Jnr = 0.80 kPa, % Recovery = 20.8%; PG76-22: Continuous Grade: 77.4-26.6 (21.6); Jnr = 0.53 kPa, % Recovery = 28.4%
Asphalt Mixture Design HMA mixture designs were conducted in accordance with NYSDOT Materials Method: MM 5.16, Superpave Hot Mix Asphalt Mixture Design and Mixture Verification Procedures. Each of the coarse aggregates sources was blended with a single fine aggregate (5-33GFM) to construct the aggregate gradation. The 5-33GFM fine aggregate has a fine aggregate angularity (FAA) value of 46%, adhering to the requirements of NYS 5.16 for pavement with greater than 30 million ESAL’s. It was decided to use a sole fine aggregate to help and eliminate compounding parameters that could influence permanent deformation properties of the asphalt mixtures. The addition of the fine aggregate was held between 37 and 42% in an attempt to keep aggregate blend proportions consistent for each mixture constructed. No sieve size varied by more than 5% from the average for any of the mixes. For the >30 Million ESAL’s traffic design, a design gyration level of 100 gyrations, as specified in NYSDOT Materials Method: MM 5.16, was used to determine the optimum asphalt content of the mixtures at a target air void content of 3.5%. Aggregate blends and asphalt contents of the designed mixtures were also compared with typical asphalt mixture designs from New York State Department of Transportation to ensure job mix formulas obtained were representative of typical NYSDOT asphalt mixtures. The general range in volumetrics were obviously aggregate source dependent but conformed to the ranges below:
Optimum asphalt content: 6.5 to 7.5%; Voids in Mineral Aggregate (VMA): 15.3 to 17.3% Voids Filled with Asphalt (VFA): 75.5 to 79.7%,
All mixture designs were conducted using the unmodified (Neat) PG64-22 asphalt binder. All performance samples were compacted to densities ranging between 94 and 93% of maximum specific gravity, Gmm (i.e. – 6 to 7% air voids). This range in density was chosen to represent typical in-place compacted densities in the pavement. COARSE AGGREGATE AGGREGATE ANGULARITY TESTING The aggregate testing consisted of measuring the angularity properties of the different aggregate sources. For angularity testing, three main test procedures were utilized;
TRB 2011 Annual Meeting Paper revised from original submittal.
Bennert, Cooley, Ericson, and Zavery TRB Paper No. 11-2904
7
1 Fractured Face Count (ASTM D5821), designated FFC hereafter; 2. Uncompacted Void Test procedure (AASHTO T326), designated UVCA hereafter; and 3. Angularity and Texture measured in the Aggregate Imaging System (AIMS).
The NYSDOT measured and provided the FFC results for the crushed gravel sources. The FFC results for the blended gravels (crushed and uncrushed) were determined based on their theoretical combination of crushed and uncrushed particles. Uncompacted Void Test for Coarse Aggregates (AASHTO T326) AASHTO T326, Uncompacted Void Content of Coarse Aggregates, describes the determination of the loose uncompacted void content of a sample of coarse aggregate. When measured on any aggregate of a known grading, void content provides an indication of the aggregate’s angularity, sphericity, and surface texture compared with other coarse aggregates tested in the same grading. The general test procedure and apparatus is similar to that of AASHTO T304, Uncompacted Void Content of Fine Aggregates, with respect to concept, test procedure, and the determination of the uncompacted void content. Laboratory rutting tests conducted by Alhrich (6) and Kandhal and Parker, (7), as well as full-scale rutting tests conducted during NCHRP Project 4-19b (8), concluded that the measured rutting was highly correlated to the UVCA as measured using AASHTO T326. The test results for the UVCA (AASHTO T326) are shown in Table 3. As expected, the gravel aggregates, noted as “G”, had lower uncompacted voids when compared to the crushed stone sources, noted as “R”. However, Table 3 also shows that the three gravels having a two-face fractured count of >99%, all had different UVCA values ranging between 45.5 and 47.9%. The results also show that larger differences in fractured face
TRB 2011 Annual Meeting Paper revised from original submittal.
Bennert, Cooley, Ericson, and Zavery TRB Paper No. 11-2904
8
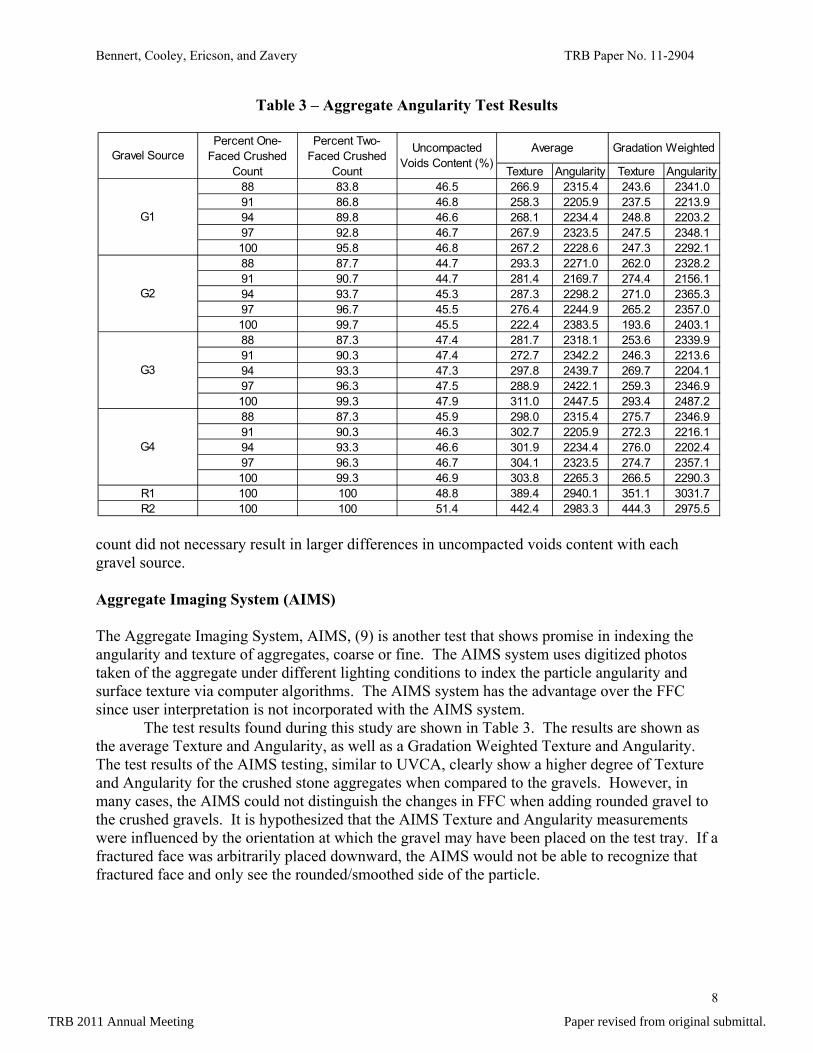
Table 3 – Aggregate Angularity Test Results
count did not necessary result in larger differences in uncompacted voids content with each gravel source. Aggregate Imaging System (AIMS) The Aggregate Imaging System, AIMS, (9) is another test that shows promise in indexing the angularity and texture of aggregates, coarse or fine. The AIMS system uses digitized photos taken of the aggregate under different lighting conditions to index the particle angularity and surface texture via computer algorithms. The AIMS system has the advantage over the FFC since user interpretation is not incorporated with the AIMS system. The test results found during this study are shown in Table 3. The results are shown as the average Texture and Angularity, as well as a Gradation Weighted Texture and Angularity. The test results of the AIMS testing, similar to UVCA, clearly show a higher degree of Texture and Angularity for the crushed stone aggregates when compared to the gravels. However, in many cases, the AIMS could not distinguish the changes in FFC when adding rounded gravel to the crushed gravels. It is hypothesized that the AIMS Texture and Angularity measurements were influenced by the orientation at which the gravel may have been placed on the test tray. If a fractured face was arbitrarily placed downward, the AIMS would not be able to recognize that fractured face and only see the rounded/smoothed side of the particle.
Texture Angularity Texture Angularity88 83.8 46.5 266.9 2315.4 243.6 2341.091 86.8 46.8 258.3 2205.9 237.5 2213.994 89.8 46.6 268.1 2234.4 248.8 2203.297 92.8 46.7 267.9 2323.5 247.5 2348.1100 95.8 46.8 267.2 2228.6 247.3 2292.188 87.7 44.7 293.3 2271.0 262.0 2328.291 90.7 44.7 281.4 2169.7 274.4 2156.194 93.7 45.3 287.3 2298.2 271.0 2365.397 96.7 45.5 276.4 2244.9 265.2 2357.0100 99.7 45.5 222.4 2383.5 193.6 2403.188 87.3 47.4 281.7 2318.1 253.6 2339.991 90.3 47.4 272.7 2342.2 246.3 2213.694 93.3 47.3 297.8 2439.7 269.7 2204.197 96.3 47.5 288.9 2422.1 259.3 2346.9100 99.3 47.9 311.0 2447.5 293.4 2487.288 87.3 45.9 298.0 2315.4 275.7 2346.991 90.3 46.3 302.7 2205.9 272.3 2216.194 93.3 46.6 301.9 2234.4 276.0 2202.497 96.3 46.7 304.1 2323.5 274.7 2357.1100 99.3 46.9 303.8 2265.3 266.5 2290.3
R1 100 100 48.8 389.4 2940.1 351.1 3031.7R2 100 100 51.4 442.4 2983.3 444.3 2975.5
Average Gradation Weighted
G3
G4
G1
G2
Gravel SourcePercent One-
Faced Crushed Count
Percent Two-Faced Crushed
Count
Uncompacted Voids Content (%)
TRB 2011 Annual Meeting Paper revised from original submittal.
Bennert, Cooley, Ericson, and Zavery TRB Paper No. 11-2904
9
Summary of Aggregate Testing Correlations between percent FFC and the other aggregate angularity tests were attempted but poor relationships were found. Using the entire dataset, an R2 = 0.024 was achieved between the FFC and UVCA, while R2’s of 0.29 and 0.12 for the AIMS Texture and Angularity, respectively. However, when the dataset is broken up by gravel source, a much better relationship was determined. This may simply be due to what a fractured face actually represents, which is simply the efficiency of the crushing procedure employed by the aggregate supplier. The FFC cannot provide any detail to the degree of angularity or texture resulting from the crushing process, only that crushing had indeed occurred. Meanwhile, gravels exhibiting greater levels of angularity and texture should result in higher UVCA and AIMS Angularity and Texture Indexes. Additional correlations were also evaluated between the UVCA and AIMS Angularity and Texture measurements with resulting R2 values of the entire dataset not much better, 0.15 and 0.25 between the UVCA and AIMS Texture and Angularity, respectively. However, if the dataset is once again separated for each gravel source, the R2 values slightly improve. The data shown in Table 3 also indicates that the general sensitivity of the AIMS with respect to crushed gravel aggregates may not be sufficient enough to index their general angularity and texture properties. This is demonstrated as similar AIMS Texture and Angularity values had different UVCA values. For example:
G2: AIMS Texture = 281.4; UVCA = 44.7%; FFC (2 Face) = 87.7% G3: AIMS Texture = 281.7; UVCA = 47.4%; FFC (2Face) = 87.3% G2: AIMS Angularity = 2271.0; UVCA = 44.7%; FFC (2 Face) = 87.7% G4: AIMS Angularity = 2265.3; UVCA = 46.9%; FFC (2 Face) = 99.3%
Based on the preliminary recommendations of White et al, (2006), a minimum UVCA for coarse aggregates for heavy traffic conditions would be 45%. Under this specification, gravel G2 would not meet the requirements while G3 would (Table 3). Unfortunately, both G2 and G3 resulted in almost identical AIMS Texture. The same again could be said for G2 and G4, although in this case, both G2 and G4 had almost identical AIMS Angularity values. ASPHALT MIXTURE PERFORMANCE TESTING The permanent deformation (rutting) properties of the different mixtures were evaluated under two different tests; 1) Asphalt Pavement Analyzer and 2) Asphalt Mixture Performance Tester (AMPT) Flow Number. Along with testing the baseline asphalt mixtures, variations of the designed asphalt mixtures were also tested with two additional asphalt binders. It is common knowledge that the use of polymer modified asphalt binders have shown to improve the permanent deformation properties of asphalt mixtures. Therefore, it was decided to include two additional asphalt binders with each mix. This resulted in a total of three (3) different asphalt binders used for each asphalt mixture; 1) PG64-22, 2) PG64-22 meeting the NYSDOT Elastic Recovery specification, and 3) PG76-22. The purpose of including the additional two asphalt binders was to determine if perhaps a stiffer asphalt binder could be used with an aggregate blend that had lesser angularity properties. In total, 396 APA samples were compacted and tested. A total of 198 repeated load (Flow Number) samples were compacted and tested.
TRB 2011 Annual Meeting Paper revised from original submittal.
Bennert, Cooley, Ericson, and Zavery TRB Paper No. 11-2904
10
Asphalt Pavement Analyzer (AASHTO TP63) The Asphalt Pavement Analyzer (APA) was conducted in accordance with AASHTO TP63, Determining Rutting Susceptibility of Asphalt Paving Mixtures Using the Asphalt Pavement Analyzer (APA). A hose pressure of 120 psi and a wheel load of 120 lb were used in the testing. A test temperature of 58oC was selected for testing to correspond with previous test temperatures used in earlier NYSDOT studies. Testing was continued until 8,000 loading cycles and APA rutting deformation was recorded at each cycle. Prior to testing, each sample was conditioned for 6 hours (+/- 15 minutes) at the testing temperature to ensure temperature equilibrium within the test specimen was achieved. Testing started with 25 cycles used as a seating load to eliminate any sample movement during testing. After the 25 seating cycles completed, the data acquisition began sampling test information until a final 8,000 loading cycles was reached. Attempts were made to develop correlations between the APA rutting and the different aggregate angularity parameters. Unfortunately, only poor correlations were able to be developed (R2 < 0.20). However, general observations made throughout the APA testing were as follows:
o The rutting measured in the Asphalt Pavement Analyzer appeared to be more sensitive to PG grade of asphalt binder used in the study than the aggregate angularity. The APA rut depth measurements were always able to differentiate between the PG grade used within the same aggregate blend and angularity.
o The rutting measured in the Asphalt Pavement Analyzer appeared to lack the sensitivity required to distinguish asphalt mixtures of different levels of aggregate angularities and textures. Neither the FFC, AIMS Texture Index, AIMS Angularity Index, nor UVCA correlated to the Asphalt Pavement Analyzer rutting results.
Repeated Load Permanent Deformation (AASHTO TP79) Repeated Load permanent deformation testing was measured and collected in uniaxial compression using the Simple Performance Tester (SPT) following the method outlined in AASHTO TP79, Determining the Dynamic Modulus and Flow Number for Hot Mix Asphalt (HMA) Using the Asphalt Mixture Performance Tester (AMPT). The testing conditions used for the study were as follows:
o Test Temperature = 58oC o Applied Deviatoric Stress, d = 100 psi o Applied Confining Stress, 3 = 20 psi
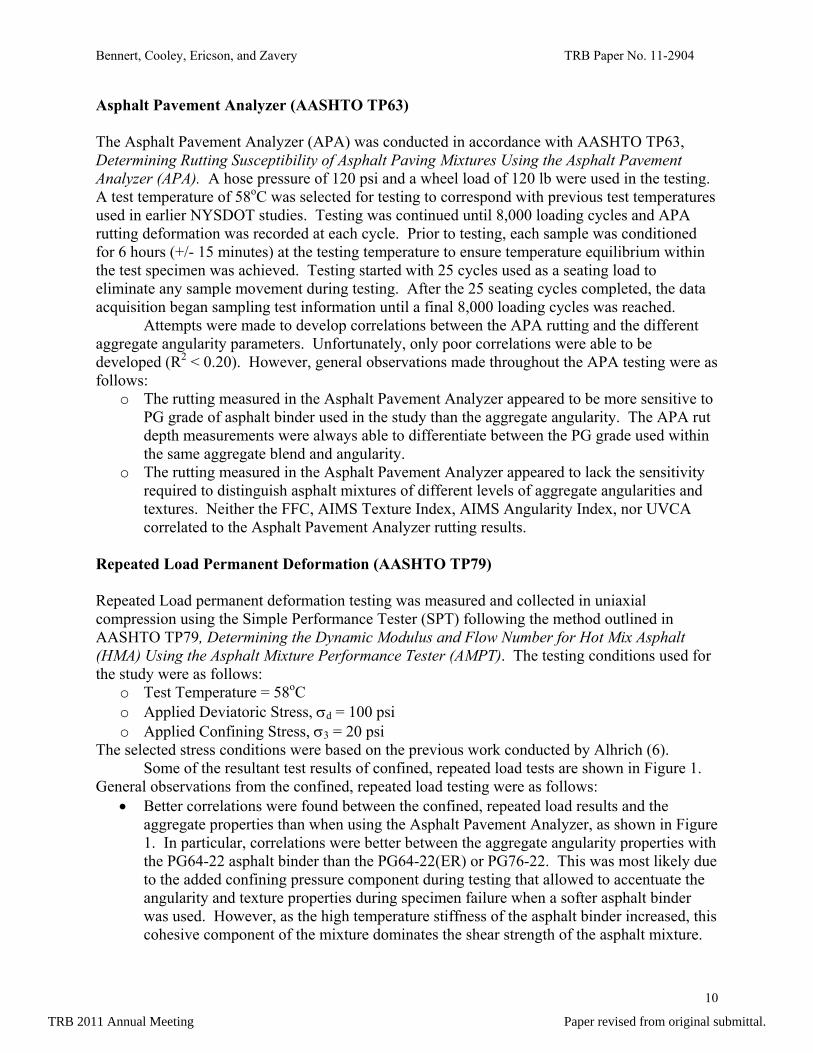
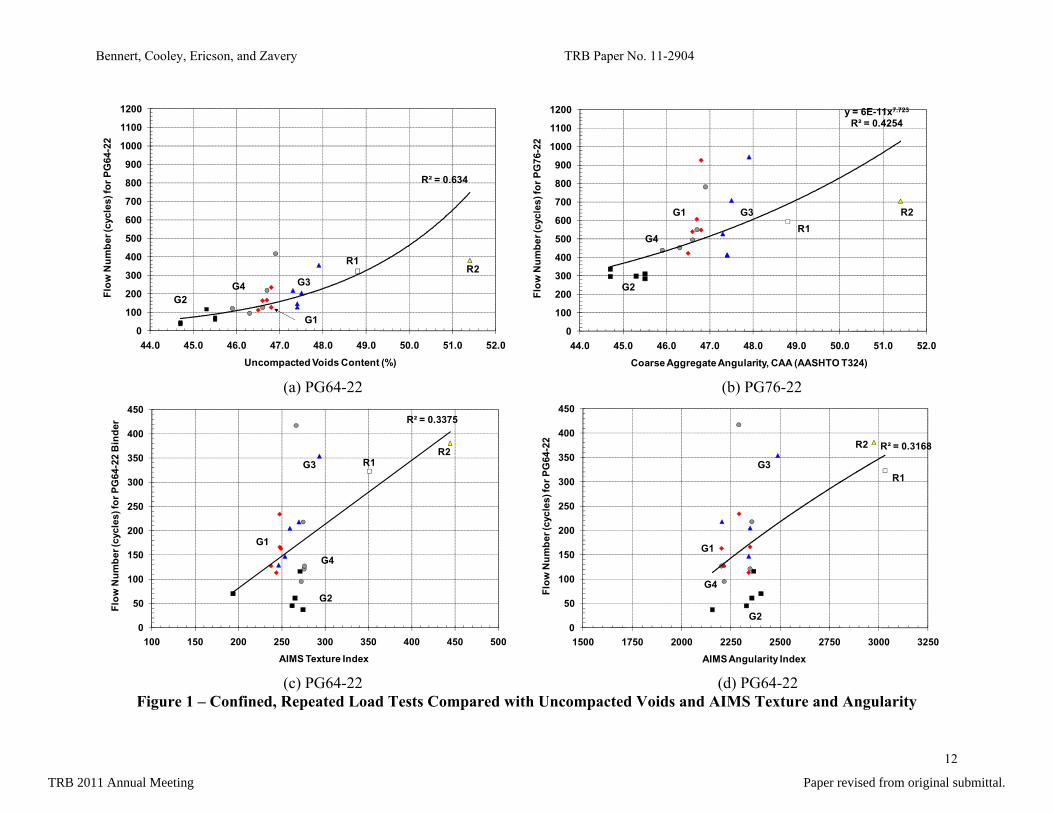
The selected stress conditions were based on the previous work conducted by Alhrich (6). Some of the resultant test results of confined, repeated load tests are shown in Figure 1. General observations from the confined, repeated load testing were as follows:
Better correlations were found between the confined, repeated load results and the aggregate properties than when using the Asphalt Pavement Analyzer, as shown in Figure 1. In particular, correlations were better between the aggregate angularity properties with the PG64-22 asphalt binder than the PG64-22(ER) or PG76-22. This was most likely due to the added confining pressure component during testing that allowed to accentuate the angularity and texture properties during specimen failure when a softer asphalt binder was used. However, as the high temperature stiffness of the asphalt binder increased, this cohesive component of the mixture dominates the shear strength of the asphalt mixture.
TRB 2011 Annual Meeting Paper revised from original submittal.
Bennert, Cooley, Ericson, and Zavery TRB Paper No. 11-2904
11
This resulted in better correlations between the Uncompacted Voids Content and Flow Number with the PG64-22 asphalt binder, as opposed to the PG64-22ER and PG76-22.
UVCA measurements correlated better to the confined, repeated load tests than the AIMS Texture and Angularity and the FFC. This may be due to the UVCA incorporating both aggregate angularity and texture properties into a single index. Unlike the AIMS device which measures these properties independently.
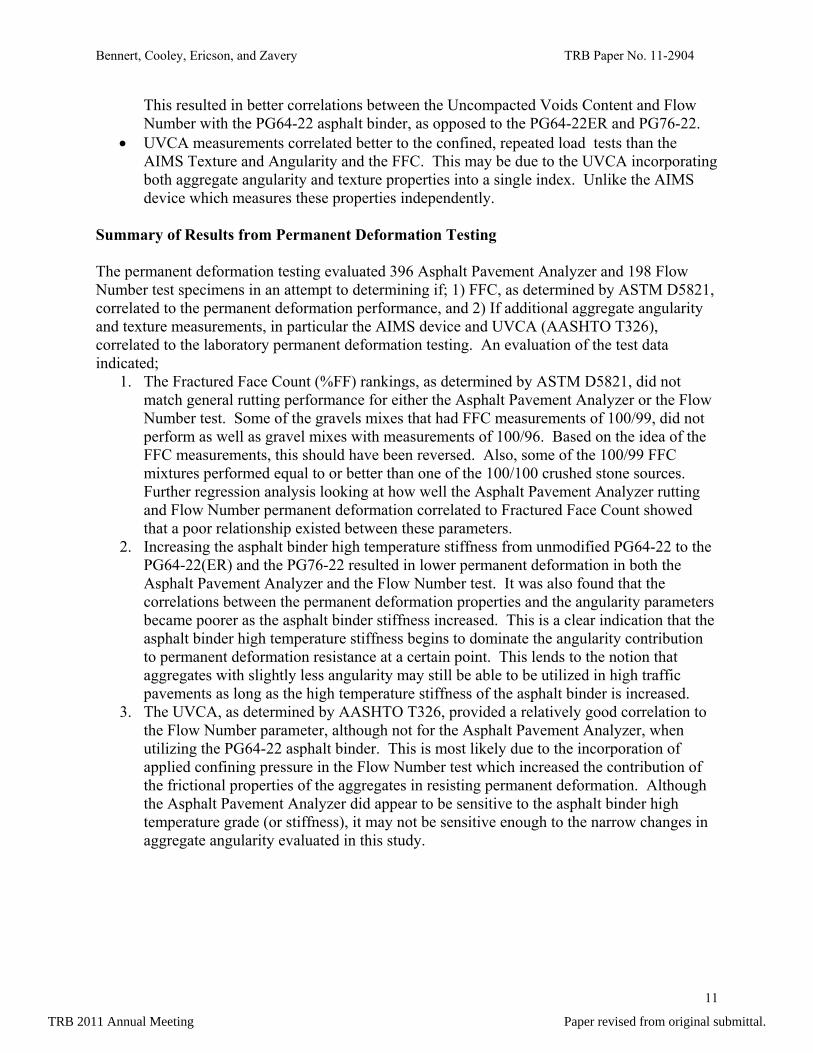
Summary of Results from Permanent Deformation Testing The permanent deformation testing evaluated 396 Asphalt Pavement Analyzer and 198 Flow Number test specimens in an attempt to determining if; 1) FFC, as determined by ASTM D5821, correlated to the permanent deformation performance, and 2) If additional aggregate angularity and texture measurements, in particular the AIMS device and UVCA (AASHTO T326), correlated to the laboratory permanent deformation testing. An evaluation of the test data indicated;
1. The Fractured Face Count (%FF) rankings, as determined by ASTM D5821, did not match general rutting performance for either the Asphalt Pavement Analyzer or the Flow Number test. Some of the gravels mixes that had FFC measurements of 100/99, did not perform as well as gravel mixes with measurements of 100/96. Based on the idea of the FFC measurements, this should have been reversed. Also, some of the 100/99 FFC mixtures performed equal to or better than one of the 100/100 crushed stone sources. Further regression analysis looking at how well the Asphalt Pavement Analyzer rutting and Flow Number permanent deformation correlated to Fractured Face Count showed that a poor relationship existed between these parameters.
2. Increasing the asphalt binder high temperature stiffness from unmodified PG64-22 to the PG64-22(ER) and the PG76-22 resulted in lower permanent deformation in both the Asphalt Pavement Analyzer and the Flow Number test. It was also found that the correlations between the permanent deformation properties and the angularity parameters became poorer as the asphalt binder stiffness increased. This is a clear indication that the asphalt binder high temperature stiffness begins to dominate the angularity contribution to permanent deformation resistance at a certain point. This lends to the notion that aggregates with slightly less angularity may still be able to be utilized in high traffic pavements as long as the high temperature stiffness of the asphalt binder is increased.
3. The UVCA, as determined by AASHTO T326, provided a relatively good correlation to the Flow Number parameter, although not for the Asphalt Pavement Analyzer, when utilizing the PG64-22 asphalt binder. This is most likely due to the incorporation of applied confining pressure in the Flow Number test which increased the contribution of the frictional properties of the aggregates in resisting permanent deformation. Although the Asphalt Pavement Analyzer did appear to be sensitive to the asphalt binder high temperature grade (or stiffness), it may not be sensitive enough to the narrow changes in aggregate angularity evaluated in this study.
TRB 2011 Annual Meeting Paper revised from original submittal.
Bennert, Cooley, Ericson, and Zavery TRB Paper No. 11-2904
12
(a) PG64-22 (b) PG76-22
(c) PG64-22 (d) PG64-22
Figure 1 – Confined, Repeated Load Tests Compared with Uncompacted Voids and AIMS Texture and Angularity
R² = 0.634
0
100
200
300
400
500
600
700
800
900
1000
1100
1200
44.0 45.0 46.0 47.0 48.0 49.0 50.0 51.0 52.0
Flow
Num
ber (
cycl
es) f
or P
G64
-22
Uncompacted Voids Content (%)
G2
G3
G1
G4R2
R1
y = 6E-11x7.723
R² = 0.4254
0
100
200
300
400
500
600
700
800
900
1000
1100
1200
44.0 45.0 46.0 47.0 48.0 49.0 50.0 51.0 52.0
Flow
Num
ber (
cycl
es) f
or P
G76
-22
Coarse Aggregate Angularity, CAA (AASHTO T324)
G2
G4
G1 G3R1
R2
R² = 0.3375
0
50
100
150
200
250
300
350
400
450
100 150 200 250 300 350 400 450 500
Flow
Num
ber (
cycl
es) f
or P
G64
-22
Bin
der
AIMS Texture Index
G2
G3 R1R2
G1
G4
R² = 0.3168
0
50
100
150
200
250
300
350
400
450
1500 1750 2000 2250 2500 2750 3000 3250
Flow
Num
ber (
cycl
es) f
or P
G64
-22
AIMS Angularity Index
G2
G4
G3
G1
R1
R2
TRB 2011 Annual Meeting Paper revised from original submittal.
Bennert, Cooley, Ericson, and Zavery TRB Paper No. 11-2904
13
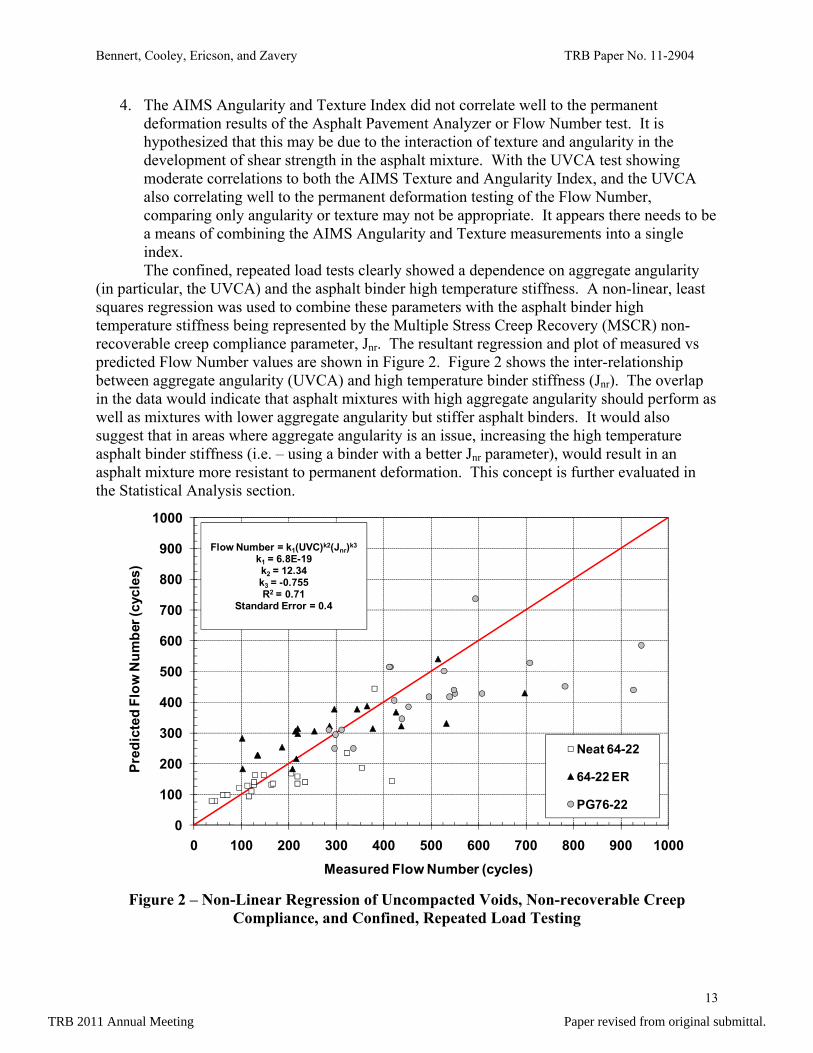
4. The AIMS Angularity and Texture Index did not correlate well to the permanent deformation results of the Asphalt Pavement Analyzer or Flow Number test. It is hypothesized that this may be due to the interaction of texture and angularity in the development of shear strength in the asphalt mixture. With the UVCA test showing moderate correlations to both the AIMS Texture and Angularity Index, and the UVCA also correlating well to the permanent deformation testing of the Flow Number, comparing only angularity or texture may not be appropriate. It appears there needs to be a means of combining the AIMS Angularity and Texture measurements into a single index. The confined, repeated load tests clearly showed a dependence on aggregate angularity
(in particular, the UVCA) and the asphalt binder high temperature stiffness. A non-linear, least squares regression was used to combine these parameters with the asphalt binder high temperature stiffness being represented by the Multiple Stress Creep Recovery (MSCR) non-recoverable creep compliance parameter, Jnr. The resultant regression and plot of measured vs predicted Flow Number values are shown in Figure 2. Figure 2 shows the inter-relationship between aggregate angularity (UVCA) and high temperature binder stiffness (Jnr). The overlap in the data would indicate that asphalt mixtures with high aggregate angularity should perform as well as mixtures with lower aggregate angularity but stiffer asphalt binders. It would also suggest that in areas where aggregate angularity is an issue, increasing the high temperature asphalt binder stiffness (i.e. – using a binder with a better Jnr parameter), would result in an asphalt mixture more resistant to permanent deformation. This concept is further evaluated in the Statistical Analysis section.
Figure 2 – Non-Linear Regression of Uncompacted Voids, Non-recoverable Creep
Compliance, and Confined, Repeated Load Testing
0
100
200
300
400
500
600
700
800
900
1000
0 100 200 300 400 500 600 700 800 900 1000
Pred
icte
d Fl
ow N
umbe
r (cy
cles
)
Measured Flow Number (cycles)
Neat 64-22
64-22 ER
PG76-22
Flow Number = k1(UVC)k2(Jnr)k3
k1 = 6.8E-19k2 = 12.34k3 = -0.755R2 = 0.71
Standard Error = 0.4
TRB 2011 Annual Meeting Paper revised from original submittal.
Bennert, Cooley, Ericson, and Zavery TRB Paper No. 11-2904
14
STATISTICAL ANALYSIS OF ASPHALT MIXTURE RESULTS The main purpose of the statistical analysis was to determine;
1. What factors influence the mixture permanent deformation the greatest; 2. At what level, if possible, can the NYSDOT reduce the Fractured Face Count value in
order to provide asphalt mixtures as rut resistant as the desired crushed stone materials and;
3. At what grade of asphalt binder does the permanent deformation performance of the gravel mixes equal that of the crushed stone mixes.
To accomplish this, two types of statistical analyses were conducted; 1) Analysis of Variance (ANOVA) and 2) Student F- and t-test.
Analysis of Variance (ANOVA)
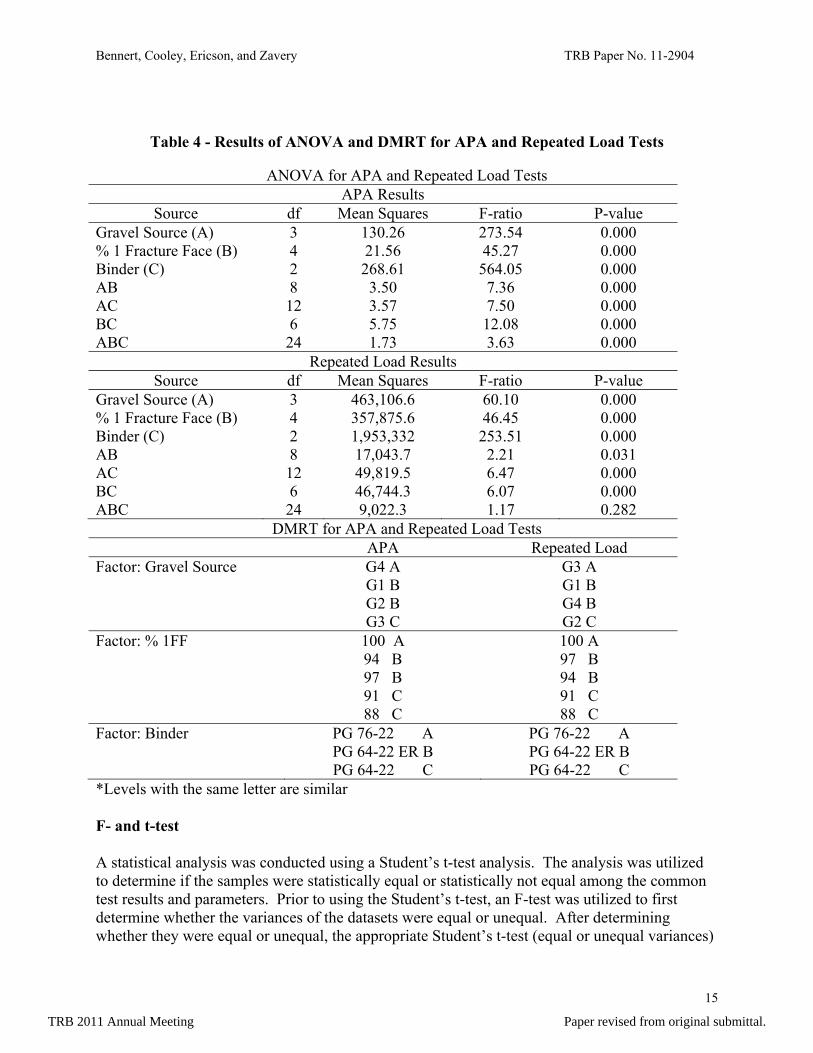
An Analysis of Variance (ANOVA) was conducted for both the APA and repeated load test results. Table 4 presents the results of these ANOVAs. Factors included in the analyses included the gravel source (G1, G2, G3 and G4), percent of one fractured faces within the gravel (88, 91, 94, 97 and 100), and asphalt binder (PG64-22, PG 64-22ER, and PG 76-22). Based upon the ANOVA results, all factors were found significant at a 5 percent level of significance. Additionally, most interactions were also found significant.
As shown within Table 4, both test methods (Asphalt Pavement Analyzer and Repeated Load test) ranked the impact of the factors the same (based upon F-statistic). The most important factor influencing test results was the binder grade followed by gravel source and percent 1 fractured faces. Because of the significance of each factor, a Duncan’s Multiple Range Test (DMRT) was conducted for both data sets to rank the levels of each Factor. Results of the DMRTs are also presented in Table 4.
The DMRT results in Table 4 shows that the two test methods ranked the levels within the percent 1 fractured face and binder grade identically. However, the results from the two permanent deformation test methods ranked the gravel sources differently. Pertinent to this project; however, are the ranking of the aggregate angularity measures. For both tests, the 100 percent level provided the most resistance to rutting. Next, the 94 and 97 percent were ranked similarly and next most resistant to rutting. Finally, the 88 and 91 percent were ranked similarly and the least resistant to rutting. Referring back to Table 2, these results suggest that mixtures having a FFC of 94/90 (%1FF/2FF) performed similarly to the mixtures having an FFC of 97/96. The DMRT results also suggest that the %FF may not adequately rank mixture performance. In looking at the Gravel Source rankings, gravel sources with 100/99 ranked best and worst, while a 100/96 gravel was ranked second.
TRB 2011 Annual Meeting Paper revised from original submittal.
Bennert, Cooley, Ericson, and Zavery TRB Paper No. 11-2904
15
Table 4 - Results of ANOVA and DMRT for APA and Repeated Load Tests
ANOVA for APA and Repeated Load Tests APA Results
Source df Mean Squares F-ratio P-value Gravel Source (A) 3 130.26 273.54 0.000 % 1 Fracture Face (B) 4 21.56 45.27 0.000 Binder (C) 2 268.61 564.05 0.000 AB 8 3.50 7.36 0.000 AC 12 3.57 7.50 0.000 BC 6 5.75 12.08 0.000 ABC 24 1.73 3.63 0.000
Repeated Load Results Source df Mean Squares F-ratio P-value
Gravel Source (A) 3 463,106.6 60.10 0.000 % 1 Fracture Face (B) 4 357,875.6 46.45 0.000 Binder (C) 2 1,953,332 253.51 0.000 AB 8 17,043.7 2.21 0.031 AC 12 49,819.5 6.47 0.000 BC 6 46,744.3 6.07 0.000 ABC 24 9,022.3 1.17 0.282
DMRT for APA and Repeated Load Tests APA Repeated Load Factor: Gravel Source G4 A G3 A G1 B G1 B G2 B G4 B G3 C G2 C Factor: % 1FF 100 A 100 A 94 B 97 B 97 B 94 B 91 C 91 C 88 C 88 C Factor: Binder PG 76-22 A PG 76-22 A PG 64-22 ER B PG 64-22 ER B PG 64-22 C PG 64-22 C *Levels with the same letter are similar F- and t-test A statistical analysis was conducted using a Student’s t-test analysis. The analysis was utilized to determine if the samples were statistically equal or statistically not equal among the common test results and parameters. Prior to using the Student’s t-test, an F-test was utilized to first determine whether the variances of the datasets were equal or unequal. After determining whether they were equal or unequal, the appropriate Student’s t-test (equal or unequal variances)
TRB 2011 Annual Meeting Paper revised from original submittal.
Bennert, Cooley, Ericson, and Zavery TRB Paper No. 11-2904
16
was then used to determine if the datasets were statistically equal at a 95% Confidence Level. Of particular interested were:
1. Is the permanent deformation properties of the gravel mixes, at any angularity level, statistically equal to the crushed stone mixes of the same asphalt binder grade; and
2. At what combination of gravel angularity and asphalt binder grade do the permanent deformation results achieve statistical equal, or better, results than the crushed stone sources with the PG64-22 asphalt binder. These results would validate the concept of grade “bumping” or selecting an asphalt binder with a better rut resistant property (i.e. – lower non-recoverable creep compliance, Jnr).
Since the test results from the Asphalt Pavement Analyzer did not appear to be that sensitive to the angularity properties of the aggregates as the Flow Number test, it was determined that only the data from the Flow Number test would be used during the F- and t-test analysis. Gravel Mix vs Crushed Stone Performance at Same Binder Grade During the statistical analysis, it was discovered that the statistically equal performance of the mixtures ranked relatively well with the UVCA. The results showed that:
o When the asphalt mixtures used a PG64-22 asphalt binder, Statistically Equal permanent deformation properties were found when the Uncompacted Voids Content was 46.9% or greater.
o When the asphalt mixture used the PG64-22(ER) asphalt binder, Statistically Equal permanent deformation properties were found when the Uncompacted Voids Content was 46.7% or greater.
o When the asphalt mixture used the PG76-22 asphalt binder, Statistically Equal permanent deformation properties were found when the Uncompacted Voids Content was 46.3% or greater.
Based on the statistical analysis conducted when comparing the gravel and crushed stone mixes using the identical PG binder grade, it appears that permanent deformation properties were Statistically Equal at a 95% Confidence Level when the coarse aggregate portion of the asphalt mixture was able to achieve an UVCA of 46.9% or greater (for the entire dataset). However, this obviously decreased as the high temperature asphalt binder stiffness increased. An UVCA values above did not correlate to a specific FFC, as shown in Table 3, and was found to be source dependent, which is most likely a function of the raw stock gravel feed and crushing process of the individual gravel supplier. Grade “Bumping” Comparison The Flow Number results for each of the gravel mixes with the different asphalt binder grades were compared to the crushed stone mixes with only the PG64-22 asphalt binder, which is the base grade used in New York. The concept here was to determine at what combination of UVCA and binder grade would provide equal or better permanent deformation properties than crushed stone aggregates using aPG64-22 asphalt binder. The statistical analysis showed:
o When the asphalt binder grade is “bumped” from an unmodified PG64-22 to a polymer modified PG64-22(ER), the gravel mixtures that had an UVCA of 45.9 or greater achieved permanent deformation Flow Number values Statistically Equal at a 95%
TRB 2011 Annual Meeting Paper revised from original submittal.

Bennert, Cooley, Ericson, and Zavery TRB Paper No. 11-2904
17
Confidence Level to the crushed stone mixtures that used the unmodified PG64-22 asphalt binder. When the asphalt binder grade is “bumped” from an unmodified PG64-22 to a polymer modified PG76-22, the gravel mixtures that had an Uncompacted Voids Content of 44.7 or greater achieved permanent deformation Flow Number values Statistically Equal at a 95% Confidence Level to the crushed stone mixtures that used the unmodified PG64-22 asphalt binder.
CONCLUSIONS AND RECOMMENDATIONS A laboratory investigation was conducted to determine if gravel mixtures with Fractured Face Counts (%FF) determined using ASTM D5821, values of 100/95 could be utilized for heavy volume pavements (greater than30 million ESAL’s) in New York State. The research project evaluated both aggregate angularity tests and asphalt mixture permanent deformation tests of crushed gravel and crushed stone aggregate sources. The research project also evaluated the impact of polymer modified asphalt binders, PG64-22(ER) and PG76-22, and how the modified binders influenced the permanent deformation performance. Based on the testing conducted in the study, the following conclusions are drawn:
o Aggregate testing showed that the Fractured Face Count (%FF) values, as determined using ASTM D5821, Standard Test Method for Determining the Percentage of Fractured Particles in Coarse Aggregate, did not correlate to angularity/texture type tests, such as the Uncompacted Void Content or the Aggregate Imaging System (AIMS) device. This indicates that indexing crushed gravels according to ASTM D5821 may not necessarily provide adequate rutting resistance for heavy volume pavements, or in some occasions, may be under-determining the true angularity properties of the gravel and restrict the gravel from being used.
o Asphalt Pavement Analyzer (APA) rutting properties suggests that the device is more sensitive to the asphalt binder stiffness than the range in aggregate angularities measured in this study. The APA rutting clearly decreased as the PG grade of the asphalt binder increased (i.e. – unmodified PG64-22 to polymer modified PG64-22 to polymer modified PG76-22). However, the APA did not correlate well with the aggregate angularities measured in the study. At times, asphalt mixture that had the same asphalt binder but with lower aggregate angularities achieved lesser APA rutting values than asphalt mixtures with higher aggregate angularities. When comparing the APA rutting values to the FFC results (ASTM D5821), UVCA (AASHTO T326) and AIMS Angularity and Texture Index, in all cases poor correlations were found.
o The Flow Number permanent deformation results were found to be both sensitive to aggregate angularity, as determined using the UVCA (AASHTO T326), and asphalt binder stiffness. Flow Number values increased as the UVCA values increased and asphalt binder high temperature PG grade increased (i.e. – unmodified PG64-22 to polymer modified PG64-22(ER) to polymer modified PG76-22. However, it was also found that the Flow Number test did not correlate well to the AIMS Texture or Angularity Indexes. This may be due to the need for the interaction between both texture and angularity to generate shear strength and perhaps simply focusing on one does not truly represent the shear strength potential. Since the Flow Number was found to be sensitive to the aggregate angularities evaluated in this study, it was decided to further use the device during the statistical analysis portion of the project.
TRB 2011 Annual Meeting Paper revised from original submittal.
Bennert, Cooley, Ericson, and Zavery TRB Paper No. 11-2904
18
o Using the ANOVA statistical analysis, the most important factor influencing test results was the binder grade followed by gravel source and percent 1 fractured faces for both the APA and Flow Number tests. This is further evidence that the FFC parameter may not provide adequate indexing of aggregate angularity and texture. The DMRT statistical analysis showed that the APA and Flow Number ranked the permanent deformation performance of the gravel sources differently, although the Flow Number rankings matched the trend of UVCA results. The DMRT results also indicated that there is a clear difference in the permanent deformation performance with respect to 1Face Fractured count and asphalt binder grade.
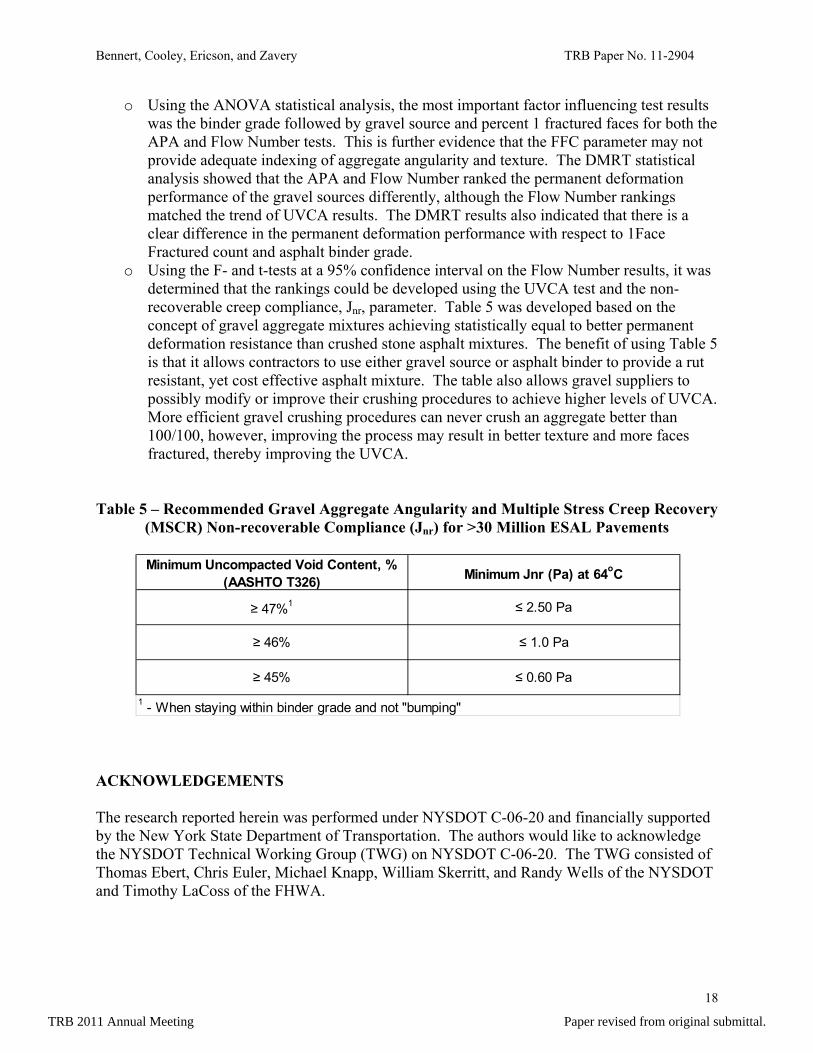
o Using the F- and t-tests at a 95% confidence interval on the Flow Number results, it was determined that the rankings could be developed using the UVCA test and the non-recoverable creep compliance, Jnr, parameter. Table 5 was developed based on the concept of gravel aggregate mixtures achieving statistically equal to better permanent deformation resistance than crushed stone asphalt mixtures. The benefit of using Table 5 is that it allows contractors to use either gravel source or asphalt binder to provide a rut resistant, yet cost effective asphalt mixture. The table also allows gravel suppliers to possibly modify or improve their crushing procedures to achieve higher levels of UVCA. More efficient gravel crushing procedures can never crush an aggregate better than 100/100, however, improving the process may result in better texture and more faces fractured, thereby improving the UVCA.
Table 5 – Recommended Gravel Aggregate Angularity and Multiple Stress Creep Recovery
(MSCR) Non-recoverable Compliance (Jnr) for >30 Million ESAL Pavements
ACKNOWLEDGEMENTS The research reported herein was performed under NYSDOT C-06-20 and financially supported by the New York State Department of Transportation. The authors would like to acknowledge the NYSDOT Technical Working Group (TWG) on NYSDOT C-06-20. The TWG consisted of Thomas Ebert, Chris Euler, Michael Knapp, William Skerritt, and Randy Wells of the NYSDOT and Timothy LaCoss of the FHWA.
1 - When staying within binder grade and not "bumping"
Minimum Uncompacted Void Content, % (AASHTO T326) Minimum Jnr (Pa) at 64oC
≥ 47%1
≥ 46%
≥ 45%
≤ 2.50 Pa
≤ 1.0 Pa
≤ 0.60 Pa
TRB 2011 Annual Meeting Paper revised from original submittal.
Bennert, Cooley, Ericson, and Zavery TRB Paper No. 11-2904
19
REFERENCES
1. Cominsky, Ronald et al, (1994), SHRP A-408 Level One Mix Design: Materials Selection,Compaction, and Conditioning, TRB.
2. Cross, S. and E.R. Brown, 1992, “Selection of Aggregate Properties to Minimize Rutting to Heavy Duty Pavements”, Effects of Aggregates and Mineral Fillers on Asphalt Mixture Performance, ASTM STP 1147, American Society of Testing and Materials, Philadelphia.
3. Prowell, B., 2003, Rutting Evaluation of Lopke Aggregate Blends, NCAT Report 03-06, National Center for Asphalt Technology, Auburn, AL, 23 pp.
4. Prowell, B., J. Scherocman, and R. Kennedy, 2005, “Comparison of Rutting Potential Resulting from Different Levels of Coarse and Fine Aggregate Angularity”, Proceedings of the 84th Annual Meeting of the Transportation Research Board, Washington D.C., 18 pp.
5. Hand, A.J., J. Epps, and P. Sebaaly, 2000, “Precision of ASTM D5821 Standard Test Method for Determining the Percentage of Fractured Particles in Coarse Aggregate”, Journal of Testing and Evaluation, American Society for Testing and Materials, JTEVA, Vol. 28, No. 2, pp. 67 – 76.
6. Ahlrich, R., 1996, “Influence of Aggregate Properties on Performance of Heavy-Duty Hot-Mix Asphalt Pavements”, Transportation Research Record 1547, Transportation Research Board, Washington D.C., pp. 8 – 14.
7. Kandhal, P.S. and F. Parker, 1998, Aggregate Test Related to Asphalt Concrete Performance in Pavements, NCHRP Report 405, National Cooperative Highway Research Program, Transportation Research Board, Washington, D.C., 105 pp.
8. White, T., J. Haddock, and E. Rismantojo, 2006, Aggregate Tests for Hot-Mix Asphalt Mixtures in Pavements, NCHRP 557, National Cooperative Highway Research Program, Transportation Research Board, Washington, D.C., 48 pp.
9. Al-Rousan, T., E. Masad, L. Myers, and C. Speigelman, 2005, “New Methodology for Shape Classification of Aggregates”, In Transportation Research Record 1913, TRB, National Research Council, Washington, D.C., pp. 11 – 23.
TRB 2011 Annual Meeting Paper revised from original submittal.