
Evolution of Accountable Care Organization (ACO) Initiatives at CMS - Public Responses (1/2)

Evaluation of CMMI Accountable Care Organization Initiatives Contract HHSM-500-2011-0009i/HHSM-500-T0002 Effect of Pioneer ACOs on Medicare Spending in the First Year November 3, 2013
Prepared for: Jesse Levy, Ph.D. Contracting Officer Representative Centers for Medicare & Medicaid Services CMS/CMMI/RREG/DRPA 7500 Security Boulevard Baltimore, MD 21244 Prepared by: L&M Policy Research, LLC 1743 Connecticut Ave NW, Suite 200 Washington, DC 20009 Attn: Lisa Green, Project Director [email protected] With partners: Abt Associates, Avalere Health, Social & Scientific Systems, and Truven Health Analytics

HHSM-500-2011-0009i/HHSM-500-T0002
TABLE OF CONTENTS
ACKNOWLEDGEMENTS .................................................................................................................. III
EXECUTIVE SUMMARY .................................................................................................................. IV
RESULTS ......................................................................................................................................... 1
Pioneer ACOs had a Small Collective Impact on Slowing Total Medicare Spending Growth in the First Year, but Most Pioneer ACOs Saw Growth Similar to Their Local Markets .............. 1
Eight Pioneer ACOs had Significantly Lower Spending Growth in the First Year of the Pioneer Model ............................................................................................................................. 4
Pioneer ACOs May be Showing Spending Effects for Some Medicare Services ...................... 4
Physician and Outpatient ........................................................................................................ 5
Inpatient .................................................................................................................................. 6
Post-Acute Care ...................................................................................................................... 7
Comparing Evaluation Results to Pioneer ACO Baseline-Benchmarks .................................... 8
DRIVERS OF ACO SPENDING GROWTH: FINDINGS TO DATE AND FUTURE ANALYSIS .............. 10
METHODS ...................................................................................................................................... 14
Data ........................................................................................................................................... 14
Approach ................................................................................................................................... 15
Step 1: Define treatment and comparison groups ................................................................ 15
Step 2: Conduct Oaxaca-Blinder reweighting for each comparison group for each Pioneer
ACO ....................................................................................................................................... 15
Limitations ................................................................................................................................ 17
LIST OF TABLES
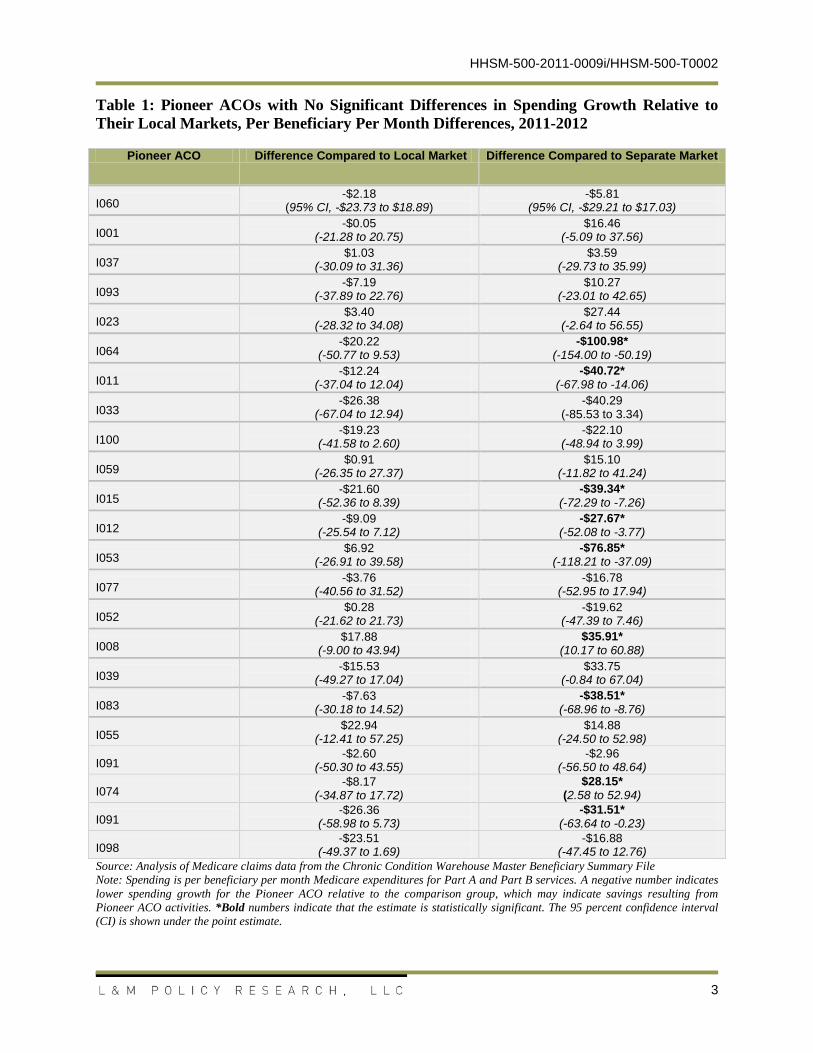
Table 1: Pioneer ACOs with No Significant Differences in Spending Growth Relative to Their Local Markets, Per Beneficiary Per Month Differences, 2011-2012 ............................................. 3
Table 2: Pioneer ACOs with Significant Differences in Spending Growth Relative to Their Local Markets, Per Beneficiary Per Month Differences, 2011-2012 ....................................................... 4
i

HHSM-500-2011-0009i/HHSM-500-T0002
Table 3: Differences in Spending Growth for All Pioneer ACO-Aligned and Comparison Market Beneficiaries by Medicare Service, Per Beneficiary Per Month Differences, 2011-2012 ............. 5
Table 4: Count of Pioneer ACOs with Higher, Lower, and No Significant Spending Growth between 2011 and 2012 Relative to Local FFS Market, by Service Type (N = 32) ....................... 8
ii

HHSM-500-2011-0009i/HHSM-500-T0002
ACKNOWLEDGEMENTS
L&M Policy Research, LLC is the prime contractor for the “Evaluation of CMMI Accountable Care Organization Initiatives” and the primary author of this update report. We would like to acknowledge our partner firms, Abt Associates, Avalere Health, Social & Scientific Systems, and Truven Health Analytics, for their tremendous analytic and written contributions, insights, and review of this update report. We would also like to thank the Pioneer ACOs who have been incredibly flexible and forthcoming during our many interactions with them thus far in the evaluation. Without their input, this report would lack context and interpretability. Finally, we appreciate and want to thank the CMMI evaluation team for their ongoing assistance and direction.
Disclaimer: L & M Policy Research, LLC conducted this study under contract with the U. S. Department of Health and Human Services, Centers for Medicare and Medicaid Services (CMS). The technical parameters and protocols governing the study were determined by the contract terms and provisions under which the work was performed as well as technical direction provided by the U. S. Government. The findings included herein reflect these constraints.
L & M Policy Research, LLC is not responsible for information that was available to it but did not fall into the range of data obtainable using the study protocols and technical direction provided to the firm by the U. S. Government, even if such information was provided to L & M Policy Research, LLC by the parties being studied or by any parties. Further, L&M Policy Research, LLC is under no obligation to provide or include in its analysis any information not obtainable directly through the study protocols as outlined in its contract with the U. S. Government or as a result of the technical direction provided by the U.S. Government during the progress of the study.
iii

HHSM-500-2011-0009i/HHSM-500-T0002
EXECUTIVE SUMMARY
This report presents early findings from an evaluation of the 32 Pioneer Accountable Care Organizations’ (ACO) effects on Medicare spending between 2011 and 2012, the first year of the demonstration program. As part of a multi-method data collection and analytic approach, the evaluation estimates the ACO treatment effect using an approach akin to a difference-in-differences framework to compare the growth rate in per beneficiary per month Medicare spending for Pioneer ACO-aligned beneficiaries to two comparison groups: 1) fee-for-service (FFS) Medicare beneficiaries who are not aligned or assigned to a Medicare ACO in the Pioneer ACO’s local market and, 2) FFS Medicare beneficiaries in a geographically distinct, but similar market where Medicare ACOs are not present. Analyses were conducted primarily at the individual Pioneer ACO level, but we also report results averaged over all Pioneer ACOs, with each Pioneer ACO weighted by the number of aligned beneficiaries.
The difference in the spending growth between the Pioneer ACO beneficiaries and their local market FFS counterparts shows the estimated effect of being aligned with the Pioneer ACO on per beneficiary spending growth — lower growth can be equated with savings to the Medicare program and higher growth equated with excess spending that would not have occurred absent the Pioneer ACO alignment, all else equal. The analysis includes both a local geographically proximate market and a separate geographically distinct market comparison group because spillover of an ACO’s activities into the local market may bias comparisons towards showing no effect of the Pioneer ACO Model compared to local markets. This may be particularly true in cases where a dominant ACO or multiple ACOs are present in the same market. The separate market comparison allows us to examine spending differences between Pioneer ACO-aligned beneficiaries and a control group less likely to be affected by potential spillover effects of the treatment.
Beneficiaries aligned with Pioneer ACOs had lower growth in total Medicare spending per person than their local market FFS comparison group in the first year of the demonstration. On average, spending was approximately $20 less per beneficiary per month than it would have been had those beneficiaries not been aligned with a Pioneer ACO. The results differed across individual Pioneer ACOs: 23 of 32 did not differ significantly in total Medicare spending compared to their local FFS comparison markets. Eight Pioneer ACOs had significantly lower growth in total Medicare spending per beneficiary than their local market comparison groups, ranging from $32.58 to $102.21 per beneficiary per month lower. The lower growth from these eight Pioneer ACOs translates to a preliminary estimated savings of $155.4 million to the Medicare program in the first year. One Pioneer ACO had significantly higher spending growth rate, estimated to cost the Medicare program $8.5 million more than if the beneficiaries had received equivalent care in their local market. Combined, these results estimate an overall $146.9 million dollar savings to the Medicare program1. The eight Pioneer ACOs that reduced spending growth varied in geographic location, size, organizational structure, and average Medicare spending in their markets, suggesting that ACOs can achieve lower spending growth under a 1 Estimates presented in this report are based on one year of program data that will be supplemented over the course of the evaluation with data and information from additional time periods and sources. They are, by definition, preliminary in nature, and intended as an early snapshot of the Pioneer ACO Model’s impact.
iv
HHSM-500-2011-0009i/HHSM-500-T0002
range of market conditions and organizational structures. Service-specific differences in spending growth, most notably in outpatient and physician spending, were significant for many Pioneer ACOs that did not show significant differences in total Medicare spending from their local markets.
In addition to claims-based quantitative analyses of expenditures, these results integrate findings from qualitative data analyses of quarterly telephone interviews with all Pioneer ACOs and environmental scans of their local and distant markets. Taken together, findings from the first year of the Pioneer Model reflect activities of systems in transition—organizations are adapting to modified payment incentives and those changes may not yet be reflected in total Medicare spending in the first year of the demonstration program. As revealed through the qualitative data collected in this evaluation, many Pioneer ACOs have not yet fully optimized their relationships with partners and providers, care management protocols, information management and IT systems, strategies for managing beneficiary leakage, or other core aspects of the accountable care model. Results thus far suggest domains for continued exploration to discern the market features (such as Pioneer ACO baseline spending level, costliness of the overall market, and demand for ACOs from other payers) and specific ACO activities (such as care management, provider financial incentives, and electronic health record functionality) that affect Medicare spending and other outcomes for beneficiaries aligned with Pioneer ACOs.
v

HHSM-500-2011-0009i/HHSM-500-T0002
RESULTS
In the first year of the Pioneer ACO Model, Pioneer ACOs had a small collective impact on total Medicare spending growth, resulting in total Medicare spending per Pioneer ACO-aligned beneficiaries that was approximately $20 per beneficiary per month less than it would have been had beneficiaries not been aligned with a Pioneer ACO in their local market. Twenty-three of the 32 Pioneer ACOs had spending growth per beneficiary that was similar to their local markets, though seven of these ACOs showed lower spending growth compared to beneficiaries in geographically distinct markets. Eight Pioneer ACOs had significantly lower growth in total Medicare spending per beneficiary than their local market comparison groups, ranging from $32.58 to $102.21 per beneficiary per month lower. One Pioneer ACO had higher growth than its local market. Early results of the evaluation presented here capture what Pioneer ACO-aligned beneficiaries would have cost the Medicare program if they had not been aligned.
Service-specific differences in spending growth, most notably in outpatient and physician spending, were significant for many Pioneer ACOs that did not show significant overall differences in spending with their local markets. Few Pioneer ACOs had slower growth in inpatient spending. Results so far suggest domains for continued exploration to discern the market features (such as Pioneer ACO baseline spending level, costliness of the overall market, and demand for ACOs from other payers) and specific ACO activities (such as care management, provider financial incentives, and electronic health record functionality) that affect total Medicare and service-specific spending changes and other outcomes for beneficiaries aligned with Pioneer ACOs.
Pioneer ACOs had a Small Collective Impact on Slowing Total Medicare Spending Growth in the First Year, but Most Pioneer ACOs Saw Growth Similar to Their Local Markets
As a group, beneficiaries aligned with Pioneer ACOs had lower growth in total Medicare spending per person than FFS beneficiaries in their local market comparison group. On average, spending for Pioneer ACO-aligned beneficiaries was approximately $20 per beneficiary per month less than it would have been had they not been aligned with a Pioneer ACO in their local market.
Results from Pioneer ACO-level analyses, however, reveal heterogeneity across Pioneer ACOs. For 23 (out of 32) of the Pioneer ACOs, the growth rate of spending for aligned beneficiaries was not significantly different from the growth rate of spending for local comparison beneficiaries. Of these 23, seven had significantly lower spending growth compared to the geographically distinct market comparison group of beneficiaries. To the extent that Pioneer ACOs’ practices “spillover” to other non-ACO health care providers, the effect of the Pioneer ACOs in comparison to the local market will be muted, although spillover may be limited in the first year of the Pioneer Model. Table 1 below presents the differences in growth rates as the dollar amounts that would have been spent in excess, or saved, per beneficiary per month, had the Pioneer ACO-aligned beneficiary otherwise received care under traditional FFS Medicare in the same market.
1

HHSM-500-2011-0009i/HHSM-500-T0002
In Boston, a market where spillover may be more likely due to the number of providers participating in the Pioneer Model, we may be seeing some preliminary evidence of spillover.
o Two of the five Boston-area Pioneer ACOs2 showed significantly lower spending growth compared to their geographically separate market (Worcester, MA) but not their local markets: I012 showed spending growth that was $27.66 per beneficiary per month lower and I083 was $38.51 per beneficiary per month lower.
o A third Pioneer ACO in Boston, I002, also reduced spending growth relative to its local market (see Table 2), and showed even lower growth compared to their geographically distinct market (Worcester, MA), at $74.50 per beneficiary per month lower.
In Minneapolis, another market where spillover might be expected given the volume of providers participating in one of the three Pioneer ACOs3 in the metro area, comparison with the geographically distinct market does not seem to show spillover.
o None of the Minneapolis Pioneer ACOs showed significantly lower spending growth compared to either the local or separate market (Omaha, NE).
o One, I008, had significantly higher spending growth compared to Omaha, NE.
Through our ongoing quarterly assessment interviews with Pioneer ACOs, marketplace analyses, and site visits to the ACOs, we will continue to examine differences between local and geographically distinct market results to assess the extent to which local market spillover may be biasing spending growth differences with the local market.
2 Boston-area Pioneer ACOs include: Atrius Health, Beth Israel Deaconess Care Organization, Mount Auburn Cambridge IPA, Partners Healthcare, and Steward Care System 3 Minneapolis-area Pioneer ACOs include: Allina Health, Fairview Health Services, and Park Nicollet Health Services
2
HHSM-500-2011-0009i/HHSM-500-T0002
Table 1: Pioneer ACOs with No Significant Differences in Spending Growth Relative to
Their Local Markets, Per Beneficiary Per Month Differences, 2011-2012
Pioneer ACO Difference Compared to Local Market Difference Compared to Separate Market
I060 -$2.18
(95% CI, -$23.73 to $18.89) -$5.81
(95% CI, -$29.21 to $17.03)
I001 -$0.05
(-21.28 to 20.75) $16.46
(-5.09 to 37.56)
I037 $1.03
(-30.09 to 31.36) $3.59
(-29.73 to 35.99)
I093 -$7.19
(-37.89 to 22.76) $10.27
(-23.01 to 42.65)
I023 $3.40
(-28.32 to 34.08) $27.44
(-2.64 to 56.55)
I064 -$20.22
(-50.77 to 9.53) -$100.98*
(-154.00 to -50.19)
I011 -$12.24
(-37.04 to 12.04) -$40.72*
(-67.98 to -14.06)
I033 -$26.38
(-67.04 to 12.94) -$40.29
(-85.53 to 3.34)
I100 -$19.23
(-41.58 to 2.60) -$22.10
(-48.94 to 3.99)
I059 $0.91
(-26.35 to 27.37) $15.10
(-11.82 to 41.24)
I015 -$21.60
(-52.36 to 8.39) -$39.34*
(-72.29 to -7.26)
I012 -$9.09
(-25.54 to 7.12) -$27.67*
(-52.08 to -3.77)
I053 $6.92
(-26.91 to 39.58) -$76.85*
(-118.21 to -37.09)
I077 -$3.76
(-40.56 to 31.52) -$16.78
(-52.95 to 17.94)
I052 $0.28
(-21.62 to 21.73) -$19.62
(-47.39 to 7.46)
I008 $17.88
(-9.00 to 43.94) $35.91*
(10.17 to 60.88)
I039 -$15.53
(-49.27 to 17.04) $33.75
(-0.84 to 67.04)
I083 -$7.63
(-30.18 to 14.52) -$38.51*
(-68.96 to -8.76)
I055 $22.94
(-12.41 to 57.25) $14.88
(-24.50 to 52.98)
I091 -$2.60
(-50.30 to 43.55) -$2.96
(-56.50 to 48.64)
I074 -$8.17
(-34.87 to 17.72)
$28.15* (2.58 to 52.94)
I091 -$26.36
(-58.98 to 5.73) -$31.51*
(-63.64 to -0.23)
I098 -$23.51
(-49.37 to 1.69) -$16.88
(-47.45 to 12.76) Source: Analysis of Medicare claims data from the Chronic Condition Warehouse Master Beneficiary Summary File
Note: Spending is per beneficiary per month Medicare expenditures for Part A and Part B services. A negative number indicates
lower spending growth for the Pioneer ACO relative to the comparison group, which may indicate savings resulting from
Pioneer ACO activities. *Bold numbers indicate that the estimate is statistically significant. The 95 percent confidence interval
(CI) is shown under the point estimate.
3

HHSM-500-2011-0009i/HHSM-500-T0002
Eight Pioneer ACOs had Significantly Lower Spending Growth in the First Year of the Pioneer Model
One-quarter of Pioneer ACOs had significantly lower growth in total Medicare spending per beneficiary than their local market comparison groups, ranging from $32.87 to $104.29 per beneficiary per month (see Table 2). In this preliminary look, we estimate that the combined Medicare spending for beneficiaries aligned with these eight Pioneer ACOs was $155.4 million less than what it would have been in 2012, if the same beneficiaries had not been aligned with the Pioneer ACO but otherwise received care in the same FFS market. Two ACOs—I099 and I048—accounted for nearly 41 percent of the total observed reduction in 2012 spending growth compared to the local market. Given the variation in their geographies, markets, organizational structures, size, and other characteristics, results for these eight Pioneer ACOs in the first year may suggest that ACOs can achieve lower spending growth under a range of market conditions and organizational structures.
Table 2: Pioneer ACOs with Significant Differences in Spending Growth Relative to Their
Local Markets, Per Beneficiary Per Month Differences, 2011-2012
Pioneer ACO Local Market Spending Difference Separate Market Spending Difference
Significantly lower growth than local market
I040 -$104.29*
(95% CI, -$145.21 to -$64.32) -$201.28*
(95% CI, -$244.89 to -$158.69)
I013 -$94.91*
(-151.79 to -39.71) -$70.32
(-163.09 to 18.02)
I095 -$57.97*
(-94.26 to -22.64) -$27.80
(-70.69 to 13.72)
I048 -$50.57*
(-68.70 to -32.73) -$19.79
(-51.10 to 10.66)
I002 -$46.49*
(-68.56 to -24.80) -$74.48*
(-104.63 to -45.05) I099 -$45.11*
(-67.36 to -23.20) $5.47
(-19.88 to 30.36)
I026 -$37.60* (-58.34 to -17.36)
-$12.26
(-43.94 to 18.21)
I029 -$32.87*
(-59.67 to -6.62) -$5.22
(-35.56 to 24.39)
Significantly higher growth than local market
I063 $34.05*
(11.64 to 55.98) $24.56
(-2.59 to 51.00) Source: Analysis of Medicare claims data from the Chronic Condition Warehouse Master Beneficiary Summary File
Note: Spending is per beneficiary per month Medicare expenditures for Part A and Part B services. A negative number indicates
savings resulting from lower spending growth for the Pioneer ACO relative to the comparison group. *Bold numbers indicate
that the estimate is statistically significant. The 95 percent confidence interval (CI) is shown under the point estimate.
Pioneer ACOs May be Showing Spending Effects for Some Medicare Services
Although the pooled results suggest a significant difference overall in total per beneficiary per month Medicare expenditures for Pioneer ACO-aligned beneficiaries relative to their local market comparison beneficiaries, this varied by type of Medicare service (see Table 3). Spending
4

HHSM-500-2011-0009i/HHSM-500-T0002
growth for outpatient and physician services for Pioneer ACO-aligned beneficiaries was lower than for local market comparison beneficiaries. That lower growth translated into an average savings of $3.10 per beneficiary per month for outpatient services and $2.34 per beneficiary per month for physician services for all aligned beneficiaries. Pioneer ACO-aligned beneficiaries had higher average spending growth for skilled nursing facility services and home health services. Pioneer ACO pooled spending was not significantly different for all other service types we examined to date. Results of the comparison with beneficiaries in geographically separate markets showed significantly lower total Medicare spending growth, but differences were not significant for individual Medicare services.
Table 3: Differences in Spending Growth for All Pioneer ACO-Aligned and Comparison
Market Beneficiaries by Medicare Service, Per Beneficiary Per Month Differences, 2011-
2012
Service Difference Compared to Local Market
Difference Compared to Separate Market
Total -$19.97*
(95% CI, -$28.20 to -$11.80)
-$18.86
(95% CI, -$37.30 to -$0.70)
Outpatient -$3.10*
(-4.46 to -1.74)
- $1.80
(-4.72 to 1.06)
Physician -$2.34*
(-4.01 to -0.68)
-$0.69
(-4.39 to 2.96)
Inpatient -3.91
(-10.33 to 2.43)
-$8.93
(-23.62 to 5.32)
Skilled Nursing Facility $0.98*
(0.20 to 1.75)
$0.80
(-1.02 to 2.59)
Home Health $0.84*
(0.35 to 1.33)
$0.81
(-0.32 to 1.92)
Hospice -$0.10
(-0.31 to 0.10)
$0.09
(-0.37 to 0.55)
Durable Medical Equipment $0.04
(-0.11 to 0.19)
-$0.03
(-0.38 to 0.31)
Source: Analysis of Medicare claims data from the Chronic Condition Warehouse Master Beneficiary Summary File
Note: Amounts are pooled spending per beneficiary per month for all Pioneer ACO-aligned beneficiaries and comparison group
beneficiaries. Spending is per beneficiary per month Medicare expenditures for Part A and Part B services. A negative number
indicates savings resulting from lower spending growth for the Pioneer ACO relative to the comparison group. *Bold numbers
indicate that the estimate is statistically significant. The 95 percent confidence interval (CI) is shown under the point estimate.
Physician and Outpatient
Many ACOs showed significantly lower rates of growth in physician and outpatient spending than the comparison populations (see Table 4). These services may be more readily affected by care management and provider decisions about the site of service than inpatient services, making it comparatively easier to realize reduced spending growth in the first year. The eleven Pioneer ACOs with significant reductions in physician spending growth include the eight organizations that also reduced total Medicare spending growth. The three Pioneer ACOs with slower rates of
5

HHSM-500-2011-0009i/HHSM-500-T0002
growth in physician spending, but not total spending, were all located in the Boston area—I033, I012, and I083.
Outpatient spending grew at a slower rate than the local market comparisons for fifteen Pioneer ACOs. As a result, beneficiaries aligned with these Pioneer ACOs had outpatient spending with a range that averaged a low of $4 to a high of $27 per beneficiary per month less than had they not been aligned with the ACO. One explanation for the number of Pioneer ACOs showing lower growth in outpatient spending that we are exploring in our quarterly assessment interviews with Pioneer ACOs is a possible reversal of recent trends in some physician services migrating to the outpatient department setting. Nationally, Medicare outpatient spending per beneficiary grew an average of 8.3 percent per year between 2006 and 2011; in contrast, inpatient spending per beneficiary grew 1.7 percent for the same period.4 According to the Medicare Payment Advisory Commission, this growth has been, in part, a result of a shift in the “delivery of some services from a freestanding physician’s office to an office that is deemed part of a hospital’s outpatient department,” that is consistent with the financial incentives under Medicare’s FFS payment system.5 This shift can result in higher FFS Medicare spending for the same service performed in an outpatient department rather than a physician’s office. Under the incentive structure of the Pioneer ACO Model, where organizations share in savings to the Medicare program, ACOs may be reversing this recent trend of growth in outpatient utilization in favor of settings with lower costs for equivalent services. The evaluation team will continue to monitor spending and utilization in these settings in future analysis.
Inpatient
In contrast to outpatient spending, nearly all Pioneer ACOs showed no significant difference in the rate of growth for inpatient spending compared to their local FFS markets. Two Pioneer ACOs—I060 and I012—saw inpatient spending grow faster than their local markets. The absence of difference in the growth of inpatient spending for Pioneer ACOs relative to their local markets may reflect the more difficult challenge of reducing spending for inpatient care relative to spending for physician and outpatient services. Shifts of lower intensity services from inpatient to outpatient settings had been documented among Medicare beneficiaries prior to the implementation of the Pioneer ACO Model, suggesting that some spending reductions in inpatient services may have already been realized. In addition, improvements in coordination of care and managing transitions from inpatient settings to post-acute care settings may not show effects on spending growth in the first year of the program. These process improvements are important to the Pioneer Model and to beneficiaries, however, and will be explored in more detail in analyses of quality and utilization data, particularly data on readmissions.
Four Pioneer ACOs—I048, I040, I098, and I026—demonstrated significantly lower inpatient spending growth than their local markets in the first year of the Pioneer ACO Model. Not surprisingly, given the large contribution of inpatient spending to overall spending, three of these also were among the ACOs that achieved significantly lower total Medicare spending growth relative to their local markets. One of these organizations reported activities on two fronts aimed
4 Calculation based on data from MedPAC, Report to the Congress: Medicare Payment Policy, March 2013, p. 45. 5 MedPAC, p. 48.
6

HHSM-500-2011-0009i/HHSM-500-T0002
at reducing inpatient utilization: working to reduce inpatient readmissions from nursing homes and partnering with practices of ACO participating physicians to monitor patients at risk for inpatient admissions. The evaluation team is currently in the process of collecting data from the field about ACOs’ care management activities that could influence inpatient spending.
Post-Acute Care
Our pooled analysis suggests that spending on skilled nursing facility services (SNF) and home health agency services grew significantly faster among Pioneer ACO-aligned beneficiaries relative to local market comparison beneficiaries. Individual ACO differences show that nine Pioneer ACOs had spending grow significantly faster than their local markets for these two types of post-acute care services, while just three Pioneer ACOs (I048, I040, and I026) had slower spending growth for skilled nursing facility and home health services.
The lack of significant differences in post-acute care spending growth, or higher growth in post-acute care spending in some instances, may reflect organizations’ efforts to substitute higher acuity or a greater volume of SNF days or home health episodes for acute care stays. The evaluation team is currently collecting data on the range of care management activities offered by each ACO, and several Pioneer ACOs have cited transitions between acute care and post-acute care settings as an area in need of improvement. For example, most of the Boston area Pioneer ACOs mentioned the need to improve coordination with post-acute care providers. The ACOs reported that there has been an increased focus on coordination and management of SNF care as a result of the implementation of the Pioneer Model. More than one Boston ACO also described improved coordination or formalization of their collaboration with home health agencies. These ACOs anticipate improved cost control from these efforts will materialize in later performance years.
In our interviews with three Minneapolis Pioneer ACOs, they discussed their focus on post-acute care, suggesting that skilled nursing facilities may be an area to watch for spending and utilization changes in subsequent years of the Pioneer ACO demonstration. Two Minneapolis Pioneer ACOs reported their intention to develop methods to identify specific SNFs in the community that outperform their peer facilities on cost and quality measures. Predictive modeling to identify high-risk and complex patients, including those that need post-acute care, supplements efforts to guide care management services to beneficiaries with the greatest need for support from trained health professionals.
7

HHSM-500-2011-0009i/HHSM-500-T0002
Table 4: Count of Pioneer ACOs with Higher, Lower, and No Significant Spending Growth
between 2011 and 2012 Relative to Local FFS Market, by Service Type (N = 32)
Service Significantly Faster Growth
Significantly Slower Growth
No Significant Differences
Outpatient 4 15 13
SNF 9 3 20
Home Health 9 3 20
Inpatient 2 4 26
Physician 4 11 17
Hospice 7 7 18
Durable Medical Equipment
4 2 26
Source: Analysis of Medicare claims data from the Chronic Condition Warehouse Master Beneficiary Summary File
Comparing Evaluation Results to Pioneer ACO Baseline-Benchmarks
Early results of the evaluation presented here capture what Pioneer ACO-aligned beneficiaries would have cost the Medicare program if they had not been aligned. It is important to distinguish this methodology and results from the performance year expenditure baseline-benchmarks CMS uses to determine savings achieved or losses incurred by Pioneer ACOs at the end of each performance year.6 There are significant differences between the methodologies and thus, the results of the respective analyses differ. Two of the primary differences in methodology are stated below:
1. The comparison groups. The evaluation methodology compares spending growth for beneficiaries aligned with each Pioneer ACO to spending growth for non-aligned but alignment-eligible FFS Medicare beneficiaries in the Pioneer ACO’s local market. Adjustments are applied to ensure comparison populations are comprised of beneficiaries similar to Pioneer ACO-aligned beneficiaries in each market. In contrast, the baseline-benchmark methodology relies on showing the difference between Medicare expenditures for beneficiaries aligned with each Pioneer ACO and those of a national reference expenditure adjusted for each Pioneer ACO based on price and case mix.
2. The years of data. The evaluation uses 2011 expenditure data for Pioneer ACO-aligned beneficiaries and beneficiaries in the comparison population as the baseline for comparison. The baseline-benchmark methodology uses Medicare spending data from 2011 as well as 2009 and 2010.
6 For a detailed discussion of the approach used in the evaluation, refer to the Methods section of this document. For a detailed discussion of the calculation of baseline and benchmarks for Pioneer ACOs see the Center for Medicare & Medicaid Innovation publication, “Pioneer ACO Alignment and Financial Reconciliation Methods,” November 21, 2011.
8

HHSM-500-2011-0009i/HHSM-500-T0002
Both of these methodological differences could account for variation in results. Results of the respective methodological approaches are most prominently observable in the comparison groups’ results, i.e., where the local markets, on which the evaluation methodology is based, exhibit key characteristics that differ from those of the national average. For example:
Local variations in practice/spending patterns. We can hypothesize that Pioneer ACOs located in high cost health care markets may be able to achieve savings more easily when compared to their local market than to a national benchmark. Similarly, if a Pioneer ACO is located in a low cost health care market, it is reasonable to consider that the Pioneer ACO may have a more difficult time showing savings when compared to their local market than to a national benchmark. In reviewing the results, there are instances where these hypotheses hold true, however, there are also examples where the results are similar between the methodologies regardless of the cost of the local health care market.
Anomalies in pre-Pioneer ACO period. The evaluation methodology uses only 2011 so there may be instances where the single year (e.g. 2011) in the evaluation results for certain markets do not follow the national 3-year trend.7
While some differences are seen in results for the Pioneer ACOs that showed savings and losses relative to the benchmark in performance year one and the preliminary evaluation findings of Pioneer ACOs that had slower and faster growth relative to their local markets, five of the eight Pioneer ACOs that had statistically significantly lower growth than their local markets—I048, I026, I002, I013 and I040—also achieved savings under the Pioneer ACO shared savings arrangement benchmarking calculation. Variations in the results are expected due to the different methodologies and the very distinct purposes of the baseline-benchmark and evaluation analyses, i.e., the baseline-benchmark methodology is used to assess savings or losses achieved by the Pioneer ACOs resulting in shared savings or loss with CMS, while the evaluation is focused on measuring how the Pioneer ACOs may be impacting Medicare costs.
7 The evaluation methodology included a review of the growth in costs prior to 2011 to test for unintended impact of having only one year of pre-evaluation data available. No discernable pattern in the growth rates was detected. As specified in the evaluation approach inclusion of prior years of data will be considered further.
9

HHSM-500-2011-0009i/HHSM-500-T0002
DRIVERS OF ACO SPENDING GROWTH: FINDINGS TO DATE AND FUTURE ANALYSIS
The results presented here offer a preliminary snapshot of whether Pioneer ACOs may be able to impact expenditure growth relative to comparison FFS markets. In addition to analysis of expenditures, this evaluation will also estimate the effects of Pioneer ACOs on particular expenditure areas (e.g., imaging and other service areas prone to high spending or sensitive to changes in care management activities), as well as other dimensions of performance such as utilization and quality. To provide the contextual detail around these analyses, and also spotlight the explanatory factors behind any observed variation in spending, we draw from the information gathered through the evaluation’s myriad qualitative activities.
Several rounds of quarterly discussions with the Pioneer ACOs, among other environmental scanning activities, have been completed and we are able to begin empirically testing whether certain factors may be underlying Pioneer spending. Guided by the literature and qualitative findings to date, we selected a number of beneficiary, ACO, and market characteristics that could be operationalized at this point in the evaluation, and have also been hypothesized in the literature and observed in our qualitative research activities as possible drivers of ACO performance.8 We then regressed the estimated treatment effects on these variables. While these regression models are in the early stages of development, we found that only the beneficiary-level characteristics: gender, age, acute myocardial infarction (AMI), colorectal cancer, and stroke showed a significant relationship with treatment effect. Fewer savings were associated with older beneficiaries and women, and greater savings were indicated for individuals experiencing an AMI, colorectal cancer, or a stroke in 2012. We did not observe significant spending differences for those with a hip fracture or lung cancer in 2012.
None of the ACO or market-level characteristics we tested revealed statistically significant relationships to spending growth differences between Pioneer ACOs and comparison groups in the first performance year of the Pioneer ACO Model. For example, ACO subtype (e.g., integrated delivery system, independent practice association) varied for ACOs that demonstrated significant spending growth reductions and those that had no differences in spending growth. Similarly, average Medicare spending in local markets did not explain any of the difference in spending growth compared to the local or separate market comparison groups.9
8 Beneficiary-level variables tested include: sex, age, race, death in 2012, AMI in 2012, colorectal cancer in 2012, hip fracture in 2012, lung cancer in 2012, and a stroke in 2012. Market-level variables tested included: the number of Pioneer, MSSP, and AP MSSP ACOs in the market; population size; median household income; unemployment rate; proportion of population with less (more) than a HS (Bachelor) degree; physicians per capita; specialists per capita; average age, sex, and price adjusted Medicare spending per beneficiary in 2010; Herfindahl-Hirschman index (HHI) of hospital charges; HHI of hospital cases; HHI of system charges; and HHI of system cases. Pioneer ACO-level characteristics tested include indicators for: ACO subtype (integrated delivery system, medical groups and network of individual practices, network of individual practices, or partnership of group practices); and, an aggregated “leadership” variable (integrated delivery system leadership, joint leadership, or physician leadership). 9Data on average per beneficiary spending for hospital referral regions in 2010 - adjusted for age, sex, and price - are from the Dartmouth Atlas of Healthcare.
10

HHSM-500-2011-0009i/HHSM-500-T0002
Six of the eight Pioneer ACOs that had lower spending growth relative to their local markets operated in markets that were in the third or fourth quartile of 2010 per-beneficiary Medicare spending nationally.10
Of the remaining two, I048 was in the second quartile and I026 was in the first quartile.
The only Pioneer ACO to show a significantly higher spending growth rate than its local market, I063, operates in a market where average Medicare spending ranks in the third quartile nationally.
We will continue to test the relationship between the level of Medicare spending in the local market and spending growth differences for additional years of Pioneer ACO results, as well as other types of ACO (not discussed in this report) in our evaluation cohort.
In future models, we also plan to test whether higher per-beneficiary Medicare spending for the Pioneer ACO-aligned beneficiaries relative to the local market comparison group (adjusting for beneficiary characteristics and the presence of chronic conditions controls for case mix differences; comparing to the local market adjusts for price differences) in the years prior to implementation of the Pioneer ACO Model is associated with spending growth differences with their local markets.
Evidence from the first year of the Pioneer Model suggests that higher per beneficiary spending levels relative to the local market prior to implementation of the Pioneer ACO may be related to lower spending growth.
o Six of the eight Pioneer ACOs that achieved slower growth in spending in the first performance year—I040, I013, I048, I099, I095, and I002—had higher spending levels11 in 2011 than their local markets.
o Of the six Pioneer ACOs with total spending in 2011 of 110 percent or more of their local markets, four showed significantly slower spending growth in 2012.
However, higher spending baseline appears neither to be universally related to lower rates of growth, nor necessary for a Pioneer ACO to realize slower spending growth relative to the local market.
o I091 and I015 had spending levels above their local markets in 2011 but neither ACO had a lower spending growth rate in 2012.
o In contrast, I026 and I029 each reduced spending growth rates in 2012 and had lower spending than their local markets in 2011, providing two examples of
10 Measured here as total 2010 Medicare spending for Part A and Part B adjusted for price, age, sex, and race for each ACO’s hospital referral region. 11Measured as the ratio of Pioneer ACO to local market total Medicare spending per beneficiary per month, adjusted for differences in beneficiary characteristics.
11

HHSM-500-2011-0009i/HHSM-500-T0002
ACOs able to achieve significantly lower spending growth while starting at a baseline level of spending less than that of their local markets.
Through ongoing evaluation tasks, which include quarterly assessments and ACO site visits, the evaluation team is, at present, collecting information from ACOs about care management programs, information management and health information technology systems, provider financial incentives, and organizational culture and leadership that we expect will provide deeper insight into drivers of ACO performance. Where appropriate, some of these factors will be included in regression models to assess their relationship to spending and clinical quality. However, many of these drivers will be summarized in the context of qualitative findings about the operations of the ACOs in the evaluation cohort. As presented in examples above, the evaluation team’s qualitative assessment to date suggests that key features of ACO operations undergird organizations’ performance. While these key facets of ACOs may not yet have a demonstrable impact on spending or quality outcomes, we will continue to monitor the ACOs’ progress on improving operational and clinical processes and, where possible, document their downstream effects on care delivery. The remainder of this section presents additional key drivers and working hypotheses that will be explored as the evaluation continues.
Extent of system integration and the level of cooperation between an ACO and hospitals or hospital systems
Examples abound of hospitals collaborating with ACOs on critical dimensions of clinical care, such as reducing readmissions, decreasing length of stay, and proactively monitoring and managing patients’ transitions in care. While it is often advantageous for an ACO to incorporate a hospital or health system directly into its provider network, quarterly assessment interviews provide evidence that less formal relationships between ACOs and hospitals can produce cooperative working relationships, and that providing incentives towards information sharing and engaging in collaborative practices can surmount some of the inherent challenges of not having an ACO-affiliated hospital.
Capacity to identify, follow and monitor beneficiaries through the continuum of care and to analyze beneficiary data from a population perspective
Two-way information-sharing, with and among ACO-participating providers, as well as providers that are not part of the ACO network is vital to an ACO’s capacity to monitor the delivery of care to its beneficiaries across the care continuum. While a subset of ACOs report full capability to monitor or track beneficiaries moving through the continuum, many ACOs report that they still are in the process of developing or implementing this level of functionality. These organizations report that their challenges are largely attributable to limited proficiency with HIT tools, which is compounded by the limited or non-existent capacity to transmit and receive clinical and administrative information with specialists, hospitals, and other health care entities in their communities.
Ability to incent providers to be cost-conscious and deliver high quality care
Incentive arrangements utilized by ACOs vary. Some ACOs focus almost exclusively on financial compensation to induce desired behaviors, others rely on the influence of selective referral practices to providers across the continuum of care that meet the ACO’s performance
12

HHSM-500-2011-0009i/HHSM-500-T0002
standards, while other ACOs rely on “provider peer pressure” to induce cost-conscious decision making and evidence-based practice behaviors.
ACO leadership and organization culture
Leadership and organizational culture are likely critical to developing a successful vision for the organization and executing the elements of that vision. The evaluation team has made some progress in understanding the nature and personality of ACO leadership but it is too early in the process to comment on either the leadership styles or quality of the leadership teams. At this point, we are able to report that ACOs’ leaderships vary in their confidence in their organizations’ abilities to accomplish the triple-part aim, the level of transparency in communications across all the participating organizations, and the innovation in their thinking and problem solving.
Demand-side pressures from other purchasers for ACO-like care delivery
ACOs face different demands from private and public purchasers depending on their markets. In some Pioneer ACOs’ markets, few purchasers are demanding accountable care models and few of their competitors offer accountable care products. In other markets, such as Boston and Minneapolis, employers and the state are actively engaged in payment reform activities and multiple organizations are offering competing accountable care-type models, reinforcing the efforts of the Medicare ACO program. A Pioneer ACO operating in another market reported that private purchasers and other payers in their market exert combined pressures driving them toward accountable care. Commercial payers are creating accountable care payment structures and health systems in the region are vying to be the partner of the payers in these ventures. Although they began assembling the foundation of their ACO prior to implementing the Pioneer ACO, designation as a Pioneer has served as a catalyst for engaging in conversations with commercial payers and purchasers seeking accountable care arrangements. The evaluation team will continue to monitor whether the combination of Medicare ACO initiatives and similar demands from other purchasers affects the operations of Medicare accountable care organizations, their commitment to the model, and the success the model shows at reducing spending and improving quality and population health.
13

HHSM-500-2011-0009i/HHSM-500-T0002
METHODS
This study employed a quasi-experimental design to examine changes in outcomes across the treatment (Pioneer ACO-aligned beneficiaries) and comparison groups (FFS beneficiaries who are eligible for alignment, but are not aligned or assigned to a Pioneer or MSSP ACO) to obtain the estimated average treatment effect of being aligned with a Pioneer ACO. In order to estimate the treatment effect, we used an Oaxaca-Blinder regression based reweighting technique to ensure that our comparison beneficiaries are similar to our treatment beneficiaries (1973). This is qualitatively similar to using a propensity score (reweighting) method (Dinardo, 2002; Kline, 2011).12 In essence, the method adjusts, or reweights, our comparison population in order to remove potential biases from selection on observables. Simple comparisons of outcome means across intervention and comparison beneficiaries may be biased, as program participants (beneficiaries and providers) are not randomly selected, and may differ in important systematic ways from nonparticipants.
In our evaluation, we first match Pioneer ACO markets to comparison markets, and then we use the Oaxaca-Blinder method to reweight comparison observations. We then examine changes in expenditures across the two groups in order to obtain the estimated average treatment effect on the treated (ATT). This allows us to control for time-varying changes that occur during the implementation of the Pioneer ACOs that are common to all beneficiaries (e.g., shared expenditure changes across the health systems) as well as controlling for the base year spending level differences across provider markets and market populations.
Significant differences in the baseline spending levels remained after using regression methods to control for observed differences between the Pioneer and comparison beneficiary populations. As such, equal changes in nominal spending, after adjustment, between the two populations represented differing rates of growth. Similarly, given non-equivalent base spending, equivalent spending growth rates imply different nominal changes in spending. Descriptive analyses of the comparison populations showed that the change in the natural logarithm of the population mean was a more consistent measure describing growth across varying base levels of spending. Specifically, the coefficient of variation for natural log changes was smaller than nominal changes in the comparison populations. Additionally, the changes in the natural log of the mean over these populations were less correlated with baseline spending (r = 0.27) than was the change in nominal spending (r = 0.745). As such, we expect the natural log of spending to more adequately describe the changes in spending from baseline to performance year one across populations with varying adjusted baseline spending.
Data
For the principal part of this analysis, we used monthly Medicare claims records for 2011 and 2012 in the CMS Chronic Condition Warehouse. We also used market level data from 2009 and 2010 to define markets from which to select treatment and comparison groups.
12 Kline (2011) shows that the Oaxaca (1973)-Blinder (1973) regression based estimate is equivalent to a propensity score reweighting estimator under the assumption of “common support” (see also Dinardo, 2002).
14

HHSM-500-2011-0009i/HHSM-500-T0002
Approach
There are two main steps to estimating the treatment effect of ACOs on expenditures.
Step 1: Define treatment and comparison groups
For each ACO we defined two comparison groups. We used market level data from 2010 for this analysis.
For each Pioneer ACO, we define the Pioneer ACO’s market as either the Core Based Statistical Areas (CBSA) or the Hospital Referral Region (HRR) in which most of the ACO aligned beneficiaries reside. We then define the Pioneer’s local market as the areas where Pioneer ACO providers are located and all contiguous counties.
Our first comparison group contains FFS Medicare beneficiaries not aligned with a Pioneer ACO but who reside within the Pioneer ACO’s local market and who are otherwise alignable. These non-aligned beneficiaries in the Pioneer’s local market constitute our primary counterfactual or comparison group for the treatment effect.
Our second comparison group contains FFS Medicare beneficiaries not aligned with a Pioneer ACO who reside in a separate (non-contiguous) market that is “similar” to the Pioneer ACO’s local market. Henceforth, we refer to this comparison group as the “separate market” comparison group. In addition to having no Medicare ACOs (Pioneer, AP MSSP, or non-AP MSSP) in the market, the separate market comparison must also have fewer than 5 percent of Medicare ACO-aligned beneficiaries. Eligible comparison markets were matched to the Pioneers’ markets based on several market characteristics. To determine the closest match, we calculated the Euclidean distance (straight line distance between two points) for each potential comparison separate market and each Pioneer ACO market. We calculated this distance over several dimensions13 and then we chose the comparison separate market that was “nearest” (minimum distance) and within the Pioneer ACO’s Census division.14 Beneficiaries from the separate market provide a weaker counterfactual but allow us to examine spending differences in a comparison group unaffected by potential spillover effects of the treatment that may contaminate the comparison with the local market control group. However, spillover from the ACO program itself is likely to be minimal, particularly in the first year. We may observe local market norms that affect ACO-aligned and non-ACO aligned beneficiaries’ utilization and spending in a similar way but those similarities are more likely to be a function of long-standing local or regional practice patterns and market conditions, not the ACO program.
Step 2: Conduct Oaxaca-Blinder reweighting for each comparison group for each Pioneer ACO
In this reweighting, we endeavored to create a counterfactual that answers the question of what would expenditures be in the comparison group if the distribution of observable characteristics 13 We used the following standardized market level measures: ln(2010 population); age, sex, and race adjusted Medicare spending per beneficiary (2009); unemployment rate (2010); Herfindahl-Hirschman Index (HHI) of hospital charges; median HH income (2010); percent of the population of white race (2010); and Medicare managed care penetration rate (2010). 14 The only exception to the “within Census division” rule was for New York City, NY, which we matched to Chicago, IL.
15

HHSM-500-2011-0009i/HHSM-500-T0002
was the same as in the treatment population in order to estimate the average treatment effect on the treated (ATT). Thus, we estimated the following regression separately for the comparison populations for each Pioneer ACO-comparison market pair:
(1)
where Δyi is equal to ( ) ( ) and represents the percentage change in outcome y for beneficiary i from the pre to post-intervention period; and X is a vector of kbeneficiary level characteristics, including age categories (less than 64 years, 65-74 years, 75-84 years, and 85+ years), sex; race (an indicator for black); indicators for whether the beneficiary died in 2012, had end stage renal disease in 2012; indicators for whether the beneficiary had a hip fracture, colorectal cancer, stroke, AMI, and lung cancer in 2011 and 2012 (separate for each year); indicators for whether the beneficiary ever had a hip fracture, colorectal cancer, stroke, AMI, and lung cancer; an indicator for having two or more of the aforementioned conditions in the current 2011; and an indicator for having three or more of the conditions ever. From this estimation, we obtain
for each covariate which we use with Pioneer ACO beneficiary observations to predict outcomes for the treatment population, which gives us the expected outcomes that would have prevailed given the distribution of characteristics observed in the treatment (ACO) group
∑
(2) ∑
∑
(3)
∑
(4)
where NACO is the number of Pioneer ACO beneficiaries, represents the mean among
comparison beneficiaries of y controlling for covariate k, and represents the fraction of ACO beneficiaries for whom covariate k is equal to one. Given that we observe the change in expenditures for the Pioneer ACO beneficiaries, the expected change given participation in the Pioneer program is simply the sample mean, .
We obtained the estimated ATT as:
∑
(5)
Because the two components of the ATT are estimated using independent samples, the variance of the ATT is simply the sum of variance for the two components, the variance of the average change in the Pioneer ACO population plus the variance-covariance matrix from the robust estimate of the variance covariance matrix from the comparison group regression adjusted the covariate values of the Pioneer beneficiaries.
We estimate the ATT for total Medicare expenditures per beneficiary per month and also for several types of expenditures: skilled nursing facility, outpatient, physical therapy, inpatient, hospice, home health and durable medical equipment. Annual spending was capped at $138,218 (approximately the top 1% of the distribution) for non-ESRD beneficiaries and $429,118 for beneficiaries with ESRD. Because the natural logarithm of 0 is undefined, we also recoded all expenditures that were equal to zero or missing as $1 (per beneficiary per month). As noted, we
16

HHSM-500-2011-0009i/HHSM-500-T0002
estimated regressions (equation 1) using the difference in the natural logarithms of expenditures. Thus, in equation (5), we are comparing the percentage changes in spending for the treatment group to the comparison group. For ease of interpretation and to present the results linearly, we have also retransformed these percentage changes to changes in dollars using Duan’s smearing estimator.
In addition to estimating the ATT separately for each ACO-comparison pair, we have also generated averages across all Pioneer beneficiaries to obtain estimated of the pooled ATT for the Pioneer ACOs.
Limitations
We note the following limitations of this preliminary analysis:
First, because we only have data for two years, we may not be adequately controlling for differences in spending trends for the treatment and comparison populations. We will update this analysis with more years of data in the future and use quarterly measures of spending (rather than annual spending numbers).
Second, the main OB model presented uses a log transformation of the main dependent variable, Δy , which is equal to ln (y^post )-ln (y^pre), estimated in an OLS model. This model poses problems for handling observations where expenditures were zero because the natural logarithm of zero is undefined. In addition, in the presence of log-scale heteroskedasticity, coefficients will be biased.
Finally, the expected value of lnY is not equal to the natural logarithm of the expected value of Y. As noted above, our current solution to this in the natural log OLS model was to replace all zeroes with one and use Duan’s smearing estimator.
Our next steps are to test formally for log-scale heteroskedasticity and explore other estimators. We will continue to refine our methods to address these limitations and explore risk adjustment and adding the other time periods for future analyses.
17