EVALUATION OF CHILD AND ADOLESCENT MENTAL HEALTH …...Positive Evaluation of Child and Adolescent...
50
i 65% 81% 82% 86% 78% 0% 25% 50% 75% 100% Overall Staff Service Quality Outcomes Percent Favorable Responses EVALUATION OF CHILD AND ADOLESCENT MENTAL HEALTH PROGRAMS By Parents of Children Served in Vermont July – December 2007 TECHNICAL REPORT July 2008 Vermont Department of Mental Health Mental Health Research and Statistics 108 Cherry Street Burlington, VT 05401 John Pandiani, PhD [email protected] 802.863.7249 Barbara Carroll, EdD [email protected] 802.657.4341
Transcript of EVALUATION OF CHILD AND ADOLESCENT MENTAL HEALTH …...Positive Evaluation of Child and Adolescent...

i
65%
81%
82%
86%
78%
0% 25% 50% 75% 100%
Overall
Staff
Service
Quality
Outcomes
Percent Favorable Responses
EVALUATION OF CHILD AND ADOLESCENT MENTAL HEALTH PROGRAMS
By Parents of Children Served in Vermont
July – December 2007
TECHNICAL REPORT
July 2008
Vermont Department of Mental Health Mental Health Research and Statistics
108 Cherry Street Burlington, VT 05401
John Pandiani, PhD
[email protected] 802.863.7249
Barbara Carroll, EdD
[email protected] 802.657.4341

ii

iii
FOREWORD The 2008 survey of parents of children served by child and adolescent mental health programs in Vermont is one part of a larger effort to monitor community mental health program performance. The parent evaluations will be used in conjunction with measures of program performance drawn from existing databases to provide a more complete picture of the performance of local community mental health programs. The combined results of these evaluations will allow a variety of stakeholders to systematically compare the performance of community-based mental health programs in Vermont, and to support local programs in their ongoing quality improvement process. The results of this survey should be considered in light of previous consumer and stakeholder evaluations of community mental health programs in Vermont, and in conjunction with the results of surveys that will be conducted in the future. Previous surveys were administered to parents in 2002 and again in 2006 regarding the quality of services their children received. Technical reports of previous survey data can be found online at http://healthvermont.gov/mh/docs/res-eval/satisfaction-report.aspx. The results of these evaluations should be considered in terms of access to care, service delivery patterns, service system integration, and treatment outcomes based on analyses of existing databases. Many of these indicators are published in the annual Department of Mental Health (DMH) Statistical Reports and weekly Performance Indicator Project data reports (PIPs), which are available in hard copy from the Vermont Department of Health’s Mental Health Research and Statistics Unit or online at http://healthvermont.gov/mh/docs/research-pubs.aspx. This approach to program evaluation assumes that program performance is a multidimensional phenomenon which is best understood on the basis of a variety of indicators that focus on different aspects of program performance. This report focuses on one very important measure of the performance of Vermont’s community child and adolescent mental health programs, the subjective evaluations of parents of the children who were served. The authors of this report thank all those who contributed to this project. This work could not have been completed without the help of the staff of the Child, Adolescent and Family Unit of the Vermont Department of Mental Health. The authors also thank the parents who took the time to evaluate and comment on the child and adolescent mental health programs provided by community mental health centers in Vermont.

iv
TABLE OF CONTENTS
PROJECT OVERVIEW AND SUMMARY OF RESULTS ................................................................................ 1
Methodology .......................................................................................................................................... 1
Overall Results ...................................................................................................................................... 1
Overview of Differences among Programs......................................................................................... 2
STATEWIDE RESULTS ................................................................................................................................... 4
EVALUATION OF DIFFERENCES AMONG PROGRAMS ............................................................................. 5
Overall Evaluation ................................................................................................................................. 5
Staff......................................................................................................................................................... 6
Quality..................................................................................................................................................... 6
Services.................................................................................................................................................. 7
Outcomes ............................................................................................................................................... 7
Narrative Comments ............................................................................................................................. 8
APPENDIX I: LETTERS ................................................................................................................................... 9
First Cover Letter................................................................................................................................. 10
Follow-up Cover Letter ....................................................................................................................... 11
APPENDIX II: VERMONT MENTAL HEALTH FAMILY SURVEY................................................................. 13
Vermont Mental Health Family Survey .............................................................................................. 14
APPENDIX III: DATA COLLECTION ............................................................................................................. 17
Project Philosophy.............................................................................................................................. 18
Data Collection Procedures................................................................................................................ 18
Consumer Concerns ........................................................................................................................... 19
APPENDIX IV: ANALYTICAL PROCEDURES.............................................................................................. 21
Scale Construction and Characteristics ........................................................................................... 22
Narrative Comments ........................................................................................................................... 24
Data Analysis ....................................................................................................................................... 24
Discussion............................................................................................................................................ 26
v
APPENDIX V: TABLES AND FIGURES........................................................................................................ 29
Response Rates by Program.............................................................................................................. 30
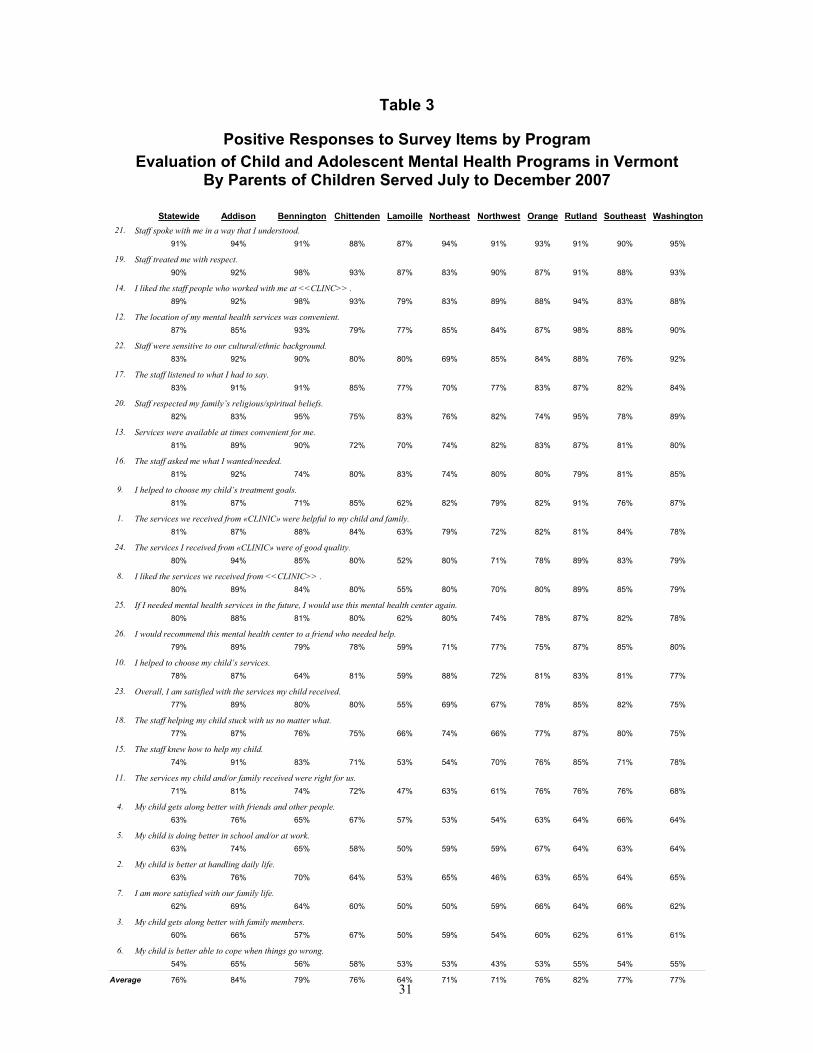
Positive Responses to Survey Items by Program ........................................................................... 31
Adjusted Positive Scale Scores by Program.................................................................................... 32
APPENDIX VI: PROGRAM COMPARISONS ................................................................................................ 33
Overall Evaluation ............................................................................................................................... 34
Evaluation of Staff ............................................................................................................................... 35
Evaluation of Quality........................................................................................................................... 36
Evaluation of Services ........................................................................................................................ 37
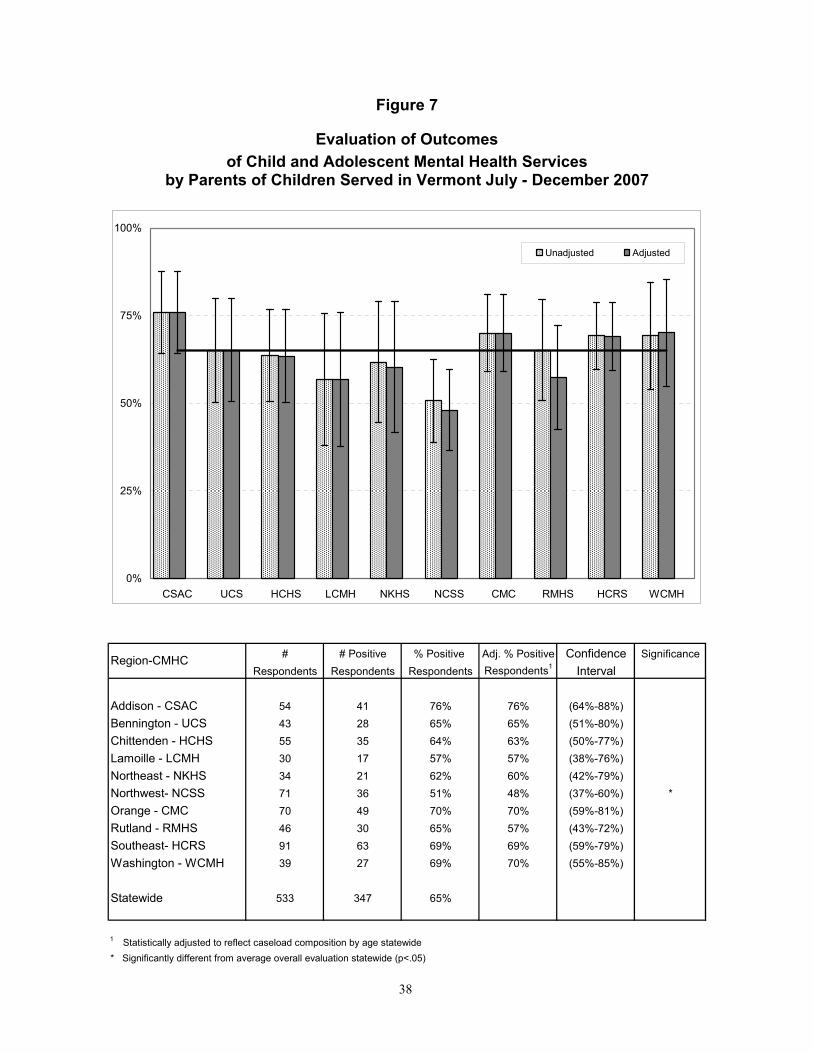
Evaluation of Outcomes ..................................................................................................................... 38
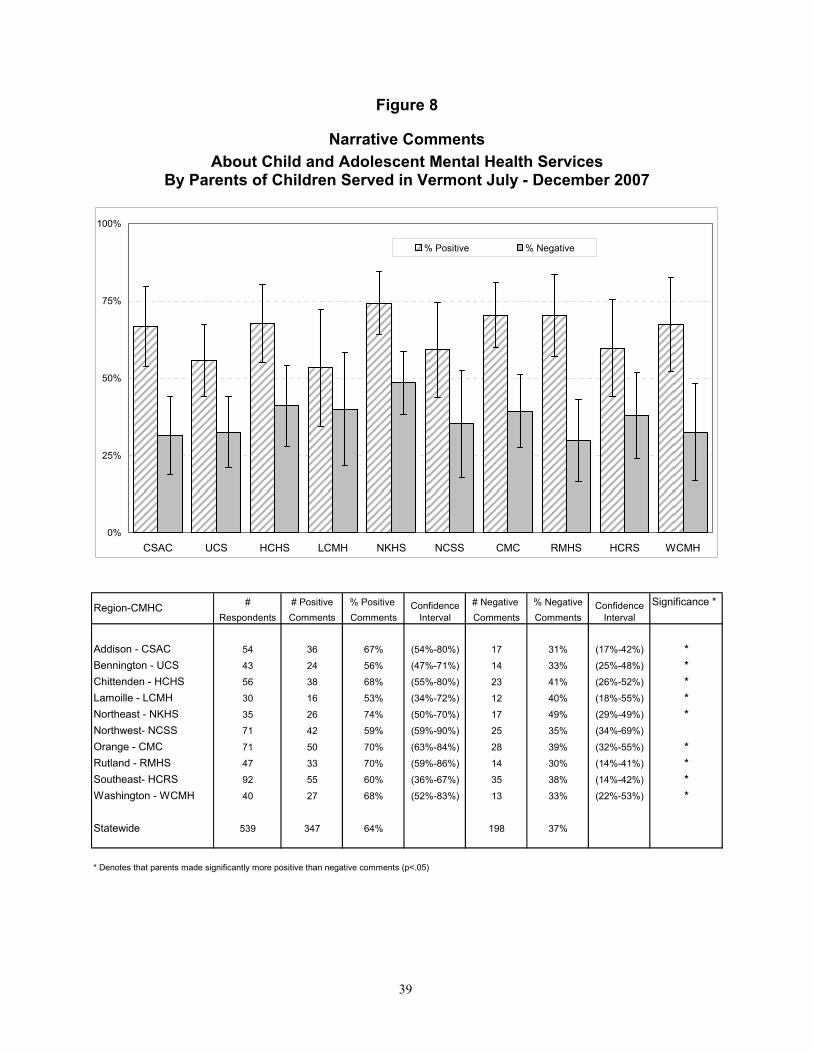
Narrative Comments ........................................................................................................................... 39
Comparison of Scales from 2002, 2006 and 2008 Surveys ............................................................. 40
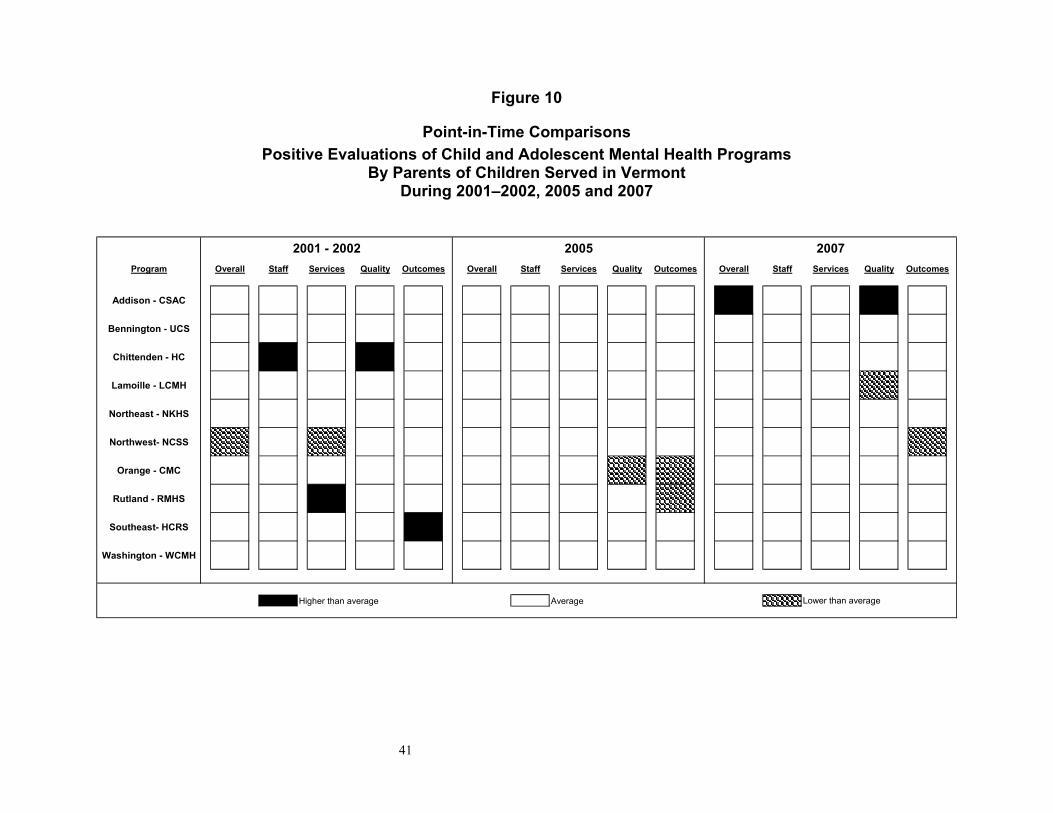
Point-in-Time Comparisons................................................................................................................ 41
APPENDIX VII: Child and Adolescent Mental Health Programs in Vermont .......................................... 43

vi

1
EVALUATION OF CHILD AND ADOLESCENT MENTAL HEALTH PROGRAMS
By the Parents of Children Served in Vermont July - December 2007
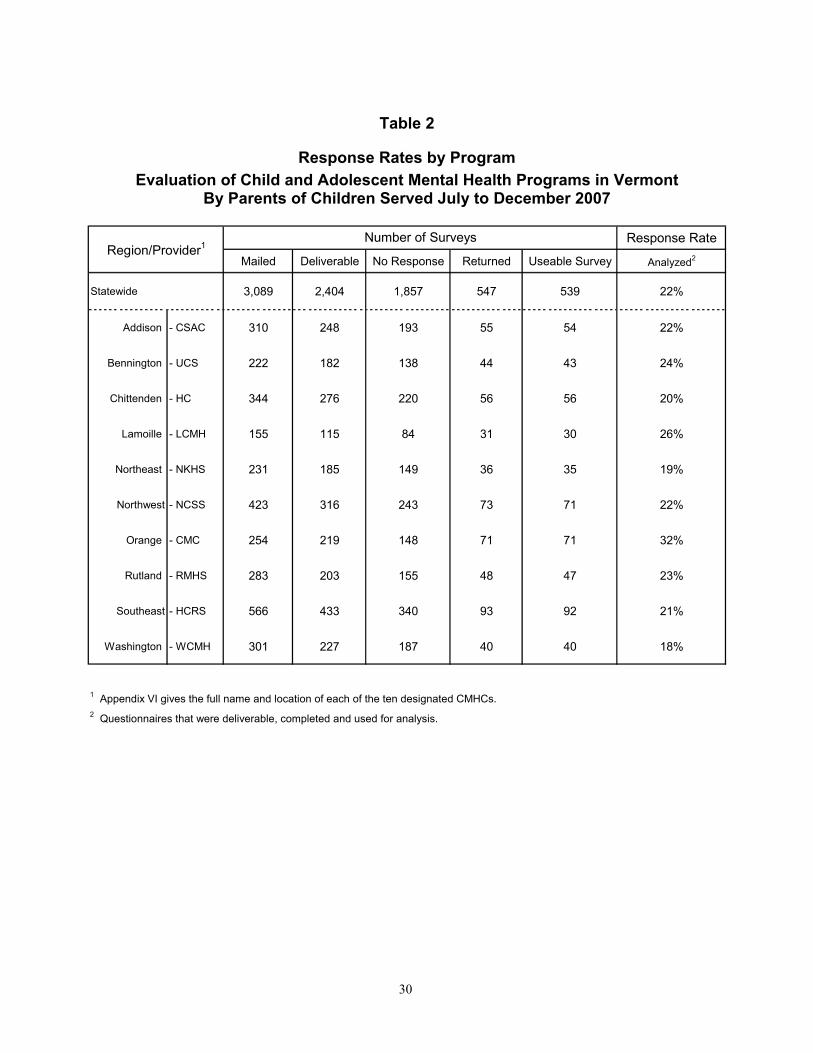
PROJECT OVERVIEW AND SUMMARY OF RESULTS During the spring of 2008, the Child and Family Unit of the Vermont Department of Mental Health (DMH) invited the parents of children who had recently received community mental health services to complete a survey to evaluate child and adolescent mental health programs in Vermont’s ten regional Community Mental Health Centers (CMHCs). Surveys were sent to parents of all children up to the age of 18 who received at least three Medicaid-reimbursed services during the period July through December 2007. In total, 547 of the potential pool of 2,404 deliverable surveys were returned. Twenty-two percent of the deliverable surveys (539) were useable for quantitative analysis (See Appendix V, Table 2, page 30). The parent survey consisted of twenty-six fixed alternative questions and four open-ended questions designed to provide information that would help stakeholders to compare the performance of child and adolescent mental health programs in Vermont. The survey instrument was based on the Mental Health Statistics Improvement Program (MHSIP) Consumer Survey developed by a multi-state work group and modified as a result of input from Vermont stakeholders (see Appendix II, page 14).
Methodology In order to facilitate comparison of Vermont’s ten child and adolescent mental health programs, parents' responses to the twenty-six fixed alternative questions were combined into five scales. These scales focus on overall consumer evaluation of program performance, and evaluation of program performance with regard to staff, services, quality, and outcomes. In order to provide an unbiased comparison across programs, survey results were statistically adjusted to remove the effect of dissimilarities among the client populations served by different community programs. Reports of significance are at the 95% confidence level (p<.05). For details of scale construction and statistical analyses, see Appendix IV (page 22). The percentages of parents making positive and negative narrative comments in response to the open-ended questions are noted in this report.
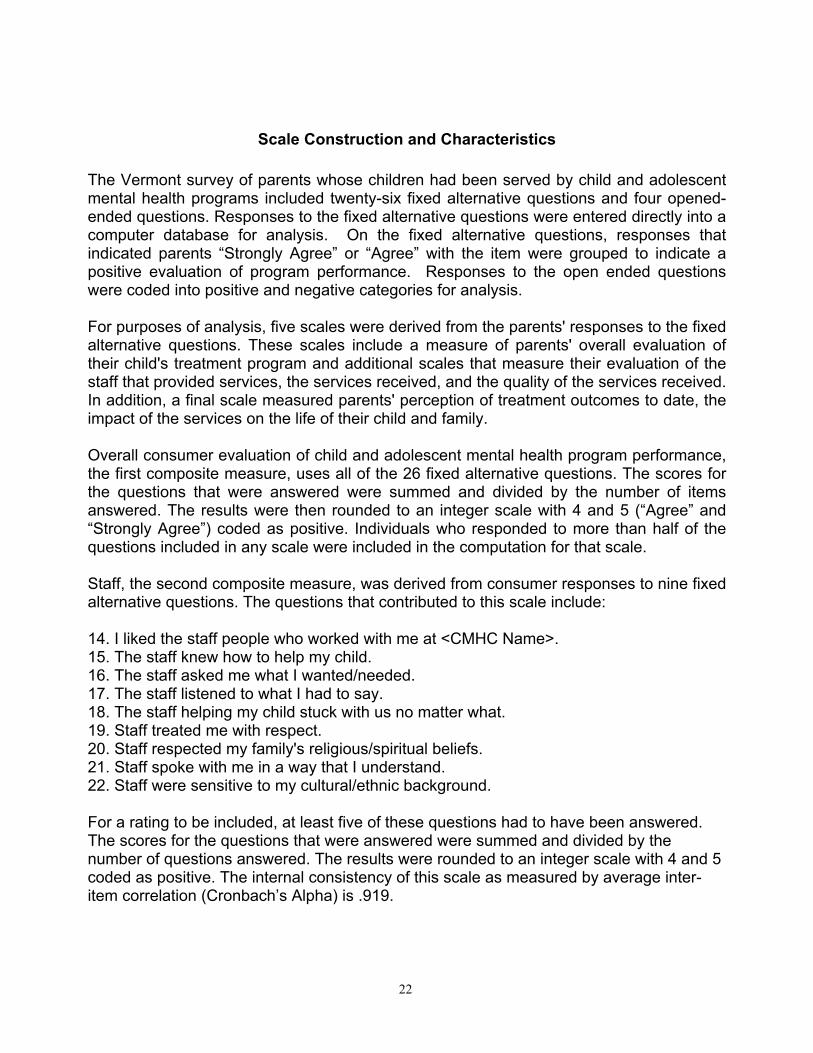
Overall Results The parents of children served by child and adolescent mental health programs in Vermont were very likely to rate their programs favorably. Statewide, on the overall measure of program performance, 78% of the parents evaluated the programs positively. Some aspects of program performance, however, were rated more favorably than others. Fixed alternative items related to staff received the most favorable responses (86%

2
Agency Overall Staff Quality Services Outcomes
Addison
Bennington
Chittenden
Lamoille
Northeast
Northwest
Orange
Rutland
Southeast
Washington
Key Higher than average Average
Positive Evaluation of Children's Programsby Parents of Children Served in Vermont: 2007
Lower than average
favorable), followed by services (82% favorable) and quality (81% favorable). Items related to outcomes received the lowest ratings (65% favorable). Additional comments about program performance were offered by 71% of parents who responded to the survey. When these comments were coded as positive or negative, it was found that significantly more parents made positive comments (64%) than negative comments (37%).
Overview of Differences among Programs In order to compare parents' evaluations of child and adolescent mental health programs in the ten CMHCs, ratings of individual programs on each of five composite scales were compared to the average of the regional scores (referred to in this report as the statewide average) for each scale. Although all programs received high scores, the results of this survey indicate that parents’ evaluations of several of the state’s ten child and adolescent community mental health programs were significantly different from the statewide average on individual measures of program performance.
Figure 1
Positive Evaluation of Child and Adolescent Mental Health Programs by Parents of Children Served in Vermont August – November 2007
The Addison child and adolescent mental health program was rated more favorably compared to the statewide average on two of the five scales, Overall and Quality. The Lamoille child and adolescent mental health program was rated less favorably compared to the statewide average on one of the five scales, Quality. The Northwest child and adolescent mental health program was rated less favorably compared to the statewide

3
average on one of the five scales, Outcomes. Parents' evaluations of the seven other programs were not statistically different from the statewide average on any of the scales. The results of this evaluation of child and adolescent mental health programs in Vermont need to be considered in conjunction with other measures of program performance in order to obtain a balanced picture of the quality of care provided to children and adolescents with mental health needs and their families in Vermont.

4
Scales Derived from Survey Items
78%
86%
82%
81%
65%
0% 25% 50% 75% 100%
Overall
Staff
Service
Quality
Outcomes
Percent Favorable Responses
STATEWIDE RESULTS The majority of parents of children served by child and adolescent mental health programs at community mental health centers in Vermont rated their programs favorably. (Appendix V, Table 3, page 31 provides an item-by-item summary of responses to the fixed alternative items.) The two most favorably rated questions related to staff: “Staff spoke with me in a way that I understood” (91%) and “Staff treated me with respect” (90%). Parents gave very favorable ratings to other staff-related questions: "I liked the staff people who worked with me" (89%), “Staff were sensitive to our cultural/ethnic background” (83%), “The staff listened to what I had to say” (83%), and “Staff respected my family’s religious/spiritual beliefs” (82%). Parents also gave very favorable ratings to two service-related questions: “The location of my mental health services was convenient” (87%) and “Services were available at times convenient for me” (81%). Eighty-one percent of the parents agreed or strongly agreed that “The services we received from <CMHC name> were helpful to my child and family”. The least favorably rated questions related to outcomes as a result of mental health services. Fifty-four percent felt that "My child is better able to cope when things go wrong" and 60% agreed that "My child gets along better with family members." There were significant differences in parents' ratings of child and adolescent mental health programs on the five scales derived from responses to the Vermont survey (see Figure 2 below).
Figure 2
Positive Evaluation of Child and Adolescent Mental Health Programs By Parents of Children Served in Vermont August - November 2007

5
Seventy-eight percent of parents rated programs favorably Overall. The Staff scale (86% favorable) received more favorable responses than the Services and Quality scales (82% and 81% favorable). Parents’ ratings on all four of these scales were significantly higher than ratings on the Outcomes scale (65% favorable).
EVALUATION OF DIFFERENCES AMONG PROGRAMS Parents' evaluations of child and adolescent mental health programs at Vermont’s ten regional CMHCs on the five scales that were built from survey responses were highly favorable. In order to provide a comprehensive overall evaluation of program performance, the average of the regional scores for each of the scales was calculated. The parent ratings of each regional program were then compared to this statewide average for each of the scales (Appendix V, Table 4, page 32 and Appendix VI, Figures 3-7, pages 34-38). These comparisons show some variation between providers. Combined, these results provide a succinct portrait of parents' evaluations of child and adolescent mental health programs in Vermont. Seven of the ten Vermont child and adolescent mental health programs received parent ratings similar to the statewide average on all five scales for the period July through December 2007. Parents of children receiving child and adolescent mental health services at the Counseling Services of Addison County (Addison) program received ratings significantly more favorable than the statewide average on the Overall and Quality scales. Parents of children receiving child and adolescent mental health services at the Lamoille County Mental Health Services (Lamoille) rated their program less favorably than the statewide average on one of the five scales (Quality) and the Northwest Counseling and Support Services (Northwest) child and adolescent mental health program was rated less favorably than the statewide average on one scale (Outcomes). The child and adolescent mental health programs received ratings similar to the statewide average score on all five scales at the United Counseling Services (Bennington), HowardCenter (Chittenden), Northeast Kingdom Human Services (Northeast), Clara Martin Center (Orange), Rutland Mental Health Services (Rutland), Health Care and Rehabilitation Services of Southeast Vermont (Southeast), and Washington County Mental Health Services (Washington).
Overall Evaluation The measure of overall satisfaction with each of the ten community child and adolescent mental health programs that was used in this study is based on parents' responses to 26 fixed alternative questions. The response alternatives were on a 5-point scale: 5 (Strongly Agree), 4 (Agree), 3 (Undecided), 2 (Disagree), or 1 (Strongly Disagree). For the purposes of scale construction, the composite measure of overall satisfaction for each respondent

6
was based on the number of individual questions with positive responses. (For details of scale construction, see Appendix IV, page 22.) Statewide, parents rated their child and adolescent mental health programs favorably with 78% of parents giving a positive overall evaluation. Parents’ overall ratings in Addison were significantly higher (91% favorable) than the statewide average score. The parents' overall ratings of the remaining nine CMHC programs did not differ significantly from the statewide average score (see pages 32 and 34).
Staff The parents' rating of the staff of their local community child and adolescent mental health programs was derived from responses to nine fixed alternative questions: 14. I liked the staff people who worked with me at <CMHC Name>. 15. The staff knew how to help my child. 16. The staff asked me what I wanted/needed. 17. The staff listened to what I had to say. 18. The staff helping my child stuck with us no matter what. 19. Staff treated me with respect. 20. Staff respected my family's religious/spiritual beliefs. 21. Staff spoke with me in a way that I understand. 22. Staff were sensitive to my cultural/ethnic background. The composite measure of staff performance was based on the number of questions with positive responses (i.e., a rating of 4 or 5). Statewide, parents generally rated their child and adolescent mental health programs more favorably on the Staff scale than on the other scales; 86% gave their child and adolescent mental health programs a positive staff evaluation. No child and adolescent mental health program was rated significantly differently from the statewide average score on the Staff scale (see pages 32 and 35).
Quality Parents' rating of the quality of the programs from which their children received services was derived from responses to three fixed alternative questions: 24. The services I received from <CMHC Name> were of good quality. 25. If I needed mental health services in the future, I would use this mental health center
again. 26. I would recommend this mental health center to a friend who needed help. The composite measure of program quality was based on the number of questions with positive responses (i.e., a rating of 4 or 5). Statewide, 81% of parents rated their child and adolescent mental health programs favorably on the Quality scale. Two child and adolescent mental health programs were rated significantly differently from the statewide
7
average score on the Quality scale. The quality of the child and adolescent mental health program in the Addison region was rated significantly higher (91% favorable) than the statewide average, and the quality of the child and adolescent mental health program in the Lamoille region was rated significantly lower (59% favorable) than the statewide average (see pages 32 and 36).
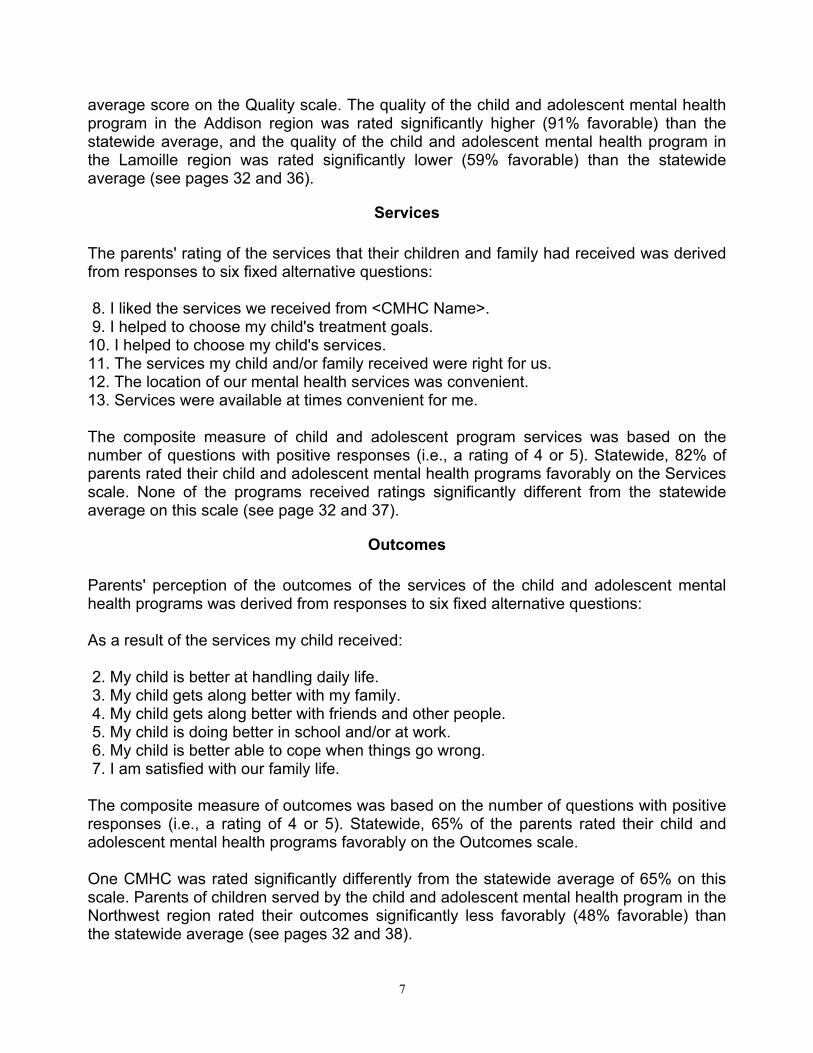
Services The parents' rating of the services that their children and family had received was derived from responses to six fixed alternative questions: 8. I liked the services we received from <CMHC Name>. 9. I helped to choose my child's treatment goals. 10. I helped to choose my child's services. 11. The services my child and/or family received were right for us. 12. The location of our mental health services was convenient. 13. Services were available at times convenient for me. The composite measure of child and adolescent program services was based on the number of questions with positive responses (i.e., a rating of 4 or 5). Statewide, 82% of parents rated their child and adolescent mental health programs favorably on the Services scale. None of the programs received ratings significantly different from the statewide average on this scale (see page 32 and 37).
Outcomes Parents' perception of the outcomes of the services of the child and adolescent mental health programs was derived from responses to six fixed alternative questions: As a result of the services my child received: 2. My child is better at handling daily life. 3. My child gets along better with my family. 4. My child gets along better with friends and other people. 5. My child is doing better in school and/or at work. 6. My child is better able to cope when things go wrong. 7. I am satisfied with our family life. The composite measure of outcomes was based on the number of questions with positive responses (i.e., a rating of 4 or 5). Statewide, 65% of the parents rated their child and adolescent mental health programs favorably on the Outcomes scale. One CMHC was rated significantly differently from the statewide average of 65% on this scale. Parents of children served by the child and adolescent mental health program in the Northwest region rated their outcomes significantly less favorably (48% favorable) than the statewide average (see pages 32 and 38).

8
Narrative Comments In order to obtain a more complete understanding of the opinions and concerns of parents of young consumers, four open-ended questions were included in the questionnaire: 27. What was most helpful about the services you have received? 28. What was least helpful about the services you have received? 29. What could your mental health center do to improve? 30. Other comments: In total, 391 parents (71% of returned surveys) supplemented their responses to the survey with 545 written comments that were coded and grouped into positive and negative categories. Of the total number of comments received, 347 (from 89% of respondents who made comments) were positive and 198 (from 51% of respondents who made comments) were negative. Forty-two percent of parents who made comments made both positive and negative comments. Fewer than 10% of the parents who made comments made only negative comments. Parents were more likely to make positive than negative comments about every agency (see Figure 8, page 39). Analysis of comments revealed several common themes. Positive comments tended to focus on parents’ satisfaction with how easy it was to talk to their child’s mental health provider, and how they and their child felt listened to and respected by their case workers. As one parent stated, “communication is always excellent.” A number of parents made comments about specific counselors, saying they were “awesome” and “professionally trained, skilled workers.” Parents found it most helpful that services were conveniently available at their child’s school. Parents also found the specific services their child received helpful: one parent expressed clearly that “we received therapeutic services that matched my child’s emotional needs well,” while another stated that “my son was finally put on the right medication, and it has made a big difference.” One parent said that “I cannot imagine the help we received being improved in any way.” Negative comments also followed several common themes. Some parents found it difficult to make appointments with psychiatrists or doctors in a timely fashion, and others stated that there was “a lack of communication between staff and us.” An often-mentioned suggestion was to involve the family more, to increase communication with parents regarding their child’s progress, and to improve coordination of physical health and mental health services. Some parents mentioned frequent turnover in staff and the negative effect of this on their child’s progress.

9
APPENDIX I:
LETTERS
First Cover Letter Follow-up Cover Letter

10
Agency of Human Services
Department of Mental Health [phone] 802-652-2000 108 Cherry Street, PO Box 70 [Legal] 802-657-4310 Burlington, VT 05402-0070 [fax] 802-652-2005 www.healthvermont.gov/mh [tty] 800-253-0191 [Code #]
March 31, 2008 To the parent(s) of: Name Street Address City, State, Zipcode Dear Parent: We are asking you to help evaluate the mental health services for children and adolescents provided by [CMHC name]. You were selected as part of our sample as records indicate your child received services from that agency between July 1 and November 30, 2007. If you are not sure what services your child received, you may call us and we will look it up. Many services by community mental health centers may be provided at other locations such as in the child’s school or in the community. Your opinions and your answers are very important to us. We want to continue to improve the quality of care received by Vermonters, and we believe that people who participate in services have a special insight into what makes quality health care. Answering the survey’s questions is your choice. Your answers will not affect your ability to receive services. No one at [CMHC name] will know whether or not you are participating in the survey. Your answers to this survey will not be available to anyone other than our research staff. Results will be reported as rates and percentages for groups of people; no individuals will be identified. The code on the questionnaire will allow us to link your answers to demographic and service information about your child and to assure that you do not receive another survey after you answer this one. If you would like to receive a summary of the results of this survey, please check the box at the end of the questionnaire. If you have any questions, please feel free to call Alice Maynard, our Chief of Quality Management, at 802-652-2035. Thank you. Sincerely,
Charles Biss, Director Child, Adolescent, and Family Mental Health Enc.
First Cover Letter

11
Agency of Human Services
Department of Mental Health [phone] 802-652-2000 108 Cherry Street, PO Box 70 [Legal] 802-657-4310 Burlington, VT 05402-0070 [fax] 802-652-2005 www.healthvermont.gov/mh [tty] 800-253-0191 [Code #] April 30, 2008 To the parent(s) of: Name Street Address City, State, Zipcode Re: Request for Feedback I am writing to encourage you to complete and return the survey you received recently about community mental health services your child received between July 1 and November 30, 2007, through [CMHC name]. Your answers to the survey’s questions are important to us as we work to continue to improve the quality of health care received by Vermonters. Your answers remain confidential as we report the results only as group data with rates and percentages. In case you did not receive the original survey or misplaced it, I have enclosed another copy with a pre-addressed and stamped return envelope in which to mail it. If you would like to receive a summary of the results of this survey, please check the box at the end of the questionnaire. If you have any questions, please feel free to call Alice Maynard, our Chief of Quality Management, at 802-652-2035. Thank you for your help. Sincerely, Charles Biss, Director Child, Adolescent, and Family Unit Enc.
Follow-up Cover Letter

12
13
APPENDIX II:
VERMONT MENTAL HEALTH FAMILY SURVEY

14
«Survey_»-«CMHC_Code»
Please circle the number for each item that best describes your evaluation of the services your child received from «CLINIC».
Strongly Strongly Disagree Disagree Undecided Agree Agree
Results
1. The services we received from «CLINIC» were helpful to my child and family........................................ 1 2 3 4 5
As a result of the services I received:
2. My child is better at handling daily life................................... 1 2 3 4 5
3. My child gets along better with family members .................... 1 2 3 4 5
4. My child gets along better with friends and other people........ 1 2 3 4 5
5. My child is doing better in school and/or at work ................... 1 2 3 4 5
6. My child is better able to cope when things go wrong ............ 1 2 3 4 5
7. I am more satisfied with our family life .................................. 1 2 3 4 5
Services
8. I liked the services we received from «CLINIC»............................................................................... 1 2 3 4 5
9. I helped to choose my child’s treatment goals......................... 1 2 3 4 5
10. I helped to choose my child’s services .................................... 1 2 3 4 5
11. The services my child and/or family received were right for us 1 2 3 4 5
12. The location of my mental health services was convenient..... 1 2 3 4 5
13. Services were available at times convenient for me. ............... 1 2 3 4 5
Staff 14. I liked the staff people who worked with me at
«CLINIC»............................................................................... 1 2 3 4 5
15. The staff knew how to help my child ...................................... 1 2 3 4 5
16. The staff asked me what I wanted/needed............................... 1 2 3 4 5
17. The staff listened to what I had to say ..................................... 1 2 3 4 5
18. The staff helping my child stuck with us no matter what........ 1 2 3 4 5
19. Staff treated me with respect ................................................... 1 2 3 4 5
20. Staff respected my family’s religious/spiritual beliefs ............ 1 2 3 4 5
21. Staff spoke with me in a way that I understood....................... 1 2 3 4 5
22. Staff were sensitive to our cultural/ethnic background ........... 1 2 3 4 5
Please turn over for questions on other side.
Vermont Mental Health Family Survey

15
Strongly StronglyDisagree Disagree Undecided Agree Agree
Overall Satisfaction 9. Overall, I am satisfied with the services my child received .... 1 2 3 4 5
10. The services I received from «CLINIC» were of good quality................................................................ 1 2 3 4 5
11. If I needed mental health services in the future, I would use this mental health center again .......................................... 1 2 3 4 5
12. I would recommend this mental health center to a friend who needed help ...................................................................... 1 2 3 4 5
Comments 13. What was most helpful about the services you received?
14. What was least helpful about the services you received?
15. What could your mental health center do to improve?
16. Other comments?
Your relationship to child: __ Parent __ Foster parent __ Other (please specify)__________________________________
Please send me a summary of the findings of the survey.
Thank you!

16

17
APPENDIX III:
DATA COLLECTION
Project Philosophy Data Collection Procedures
Consumer Concerns
18
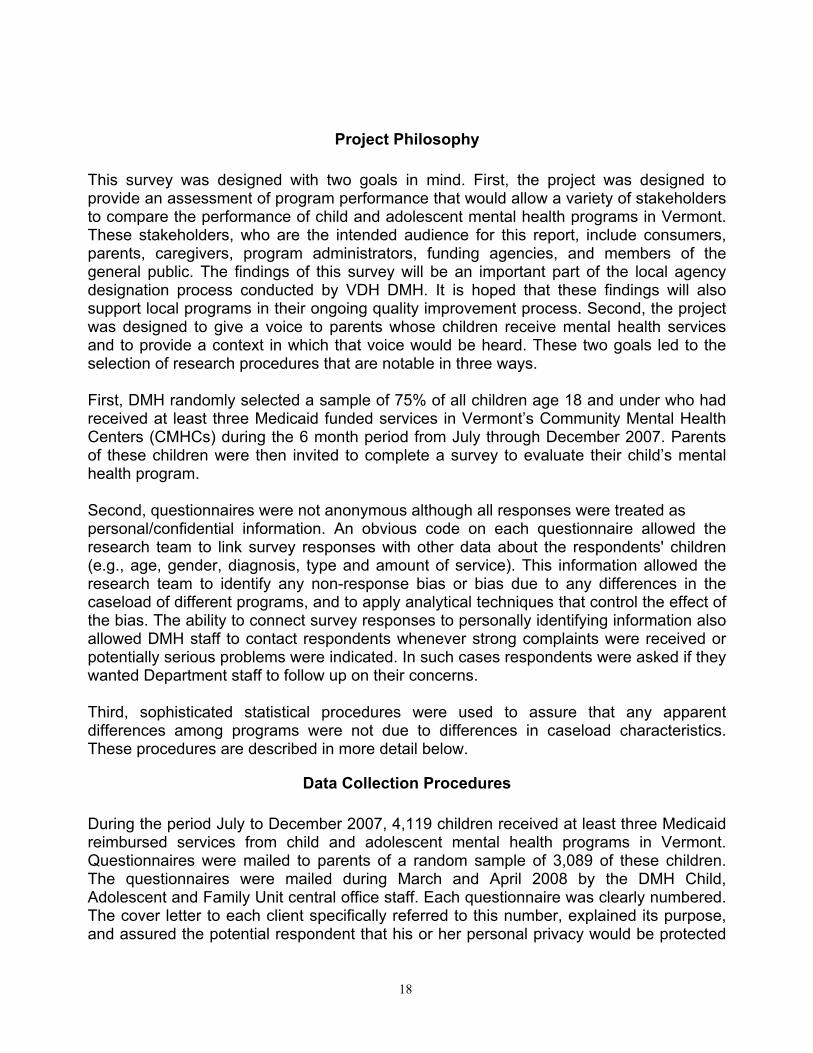
Project Philosophy This survey was designed with two goals in mind. First, the project was designed to provide an assessment of program performance that would allow a variety of stakeholders to compare the performance of child and adolescent mental health programs in Vermont. These stakeholders, who are the intended audience for this report, include consumers, parents, caregivers, program administrators, funding agencies, and members of the general public. The findings of this survey will be an important part of the local agency designation process conducted by VDH DMH. It is hoped that these findings will also support local programs in their ongoing quality improvement process. Second, the project was designed to give a voice to parents whose children receive mental health services and to provide a context in which that voice would be heard. These two goals led to the selection of research procedures that are notable in three ways. First, DMH randomly selected a sample of 75% of all children age 18 and under who had received at least three Medicaid funded services in Vermont’s Community Mental Health Centers (CMHCs) during the 6 month period from July through December 2007. Parents of these children were then invited to complete a survey to evaluate their child’s mental health program. Second, questionnaires were not anonymous although all responses were treated as personal/confidential information. An obvious code on each questionnaire allowed the research team to link survey responses with other data about the respondents' children (e.g., age, gender, diagnosis, type and amount of service). This information allowed the research team to identify any non-response bias or bias due to any differences in the caseload of different programs, and to apply analytical techniques that control the effect of the bias. The ability to connect survey responses to personally identifying information also allowed DMH staff to contact respondents whenever strong complaints were received or potentially serious problems were indicated. In such cases respondents were asked if they wanted Department staff to follow up on their concerns. Third, sophisticated statistical procedures were used to assure that any apparent differences among programs were not due to differences in caseload characteristics. These procedures are described in more detail below.
Data Collection Procedures During the period July to December 2007, 4,119 children received at least three Medicaid reimbursed services from child and adolescent mental health programs in Vermont. Questionnaires were mailed to parents of a random sample of 3,089 of these children. The questionnaires were mailed during March and April 2008 by the DMH Child, Adolescent and Family Unit central office staff. Each questionnaire was clearly numbered. The cover letter to each client specifically referred to this number, explained its purpose, and assured the potential respondent that his or her personal privacy would be protected

19
(see Appendix I, page 10). The purpose of the questionnaire number was to allow the research team to identify non-respondents for follow-up, and to allow for the linkage of questionnaire responses to the DMH databases. Approximately five weeks after the original questionnaire was mailed, people who had not responded to the first mailing were sent a follow-up letter (see Appendix I, page 11). This mailing included a follow-up cover letter, a copy of the original cover letter, and a second copy of the questionnaire. Of the 3,089 questionnaires that were mailed, 2,404 were deliverable. Of these, 547 were returned to DMH. Twenty-two percent of deliverable surveys were included in the analyses. Response rates for individual child and adolescent mental health programs varied from 18% to 32% (see Appendix V, Table 2, page 30). Overall, there was no difference in response rates related to age or gender of children receiving services. However, response rates varied somewhat related to other characteristics of the children served. Parents of children with a diagnosis of organic brain syndrome or substance abuse, or with an indication of alcohol use, drug abuse, or involvement with criminal justice, responded less frequently than did other parents. Parents of children with schizophrenia or a personality disorder responded more frequently than did other parents.
Consumer Concerns Written comments accompanied 71% of all returned questionnaires. These comments expressed concerns of various kinds. Whenever a written comment indicated the possibility of a problem that involved the health or safety of a client, or that involved potential ethical or legal problems, a formal complaint procedure was initiated. Appropriate staff of DMH reviewed each complaint. If follow-up was deemed appropriate, staff contacted the consumer (by telephone) to volunteer the service of the Department staff in regard to the issue.

20

21
APPENDIX IV:
ANALYTICAL PROCEDURES
Scale Construction and Characteristics Narrative Comments
Data Analysis Discussion
22
Scale Construction and Characteristics The Vermont survey of parents whose children had been served by child and adolescent mental health programs included twenty-six fixed alternative questions and four opened-ended questions. Responses to the fixed alternative questions were entered directly into a computer database for analysis. On the fixed alternative questions, responses that indicated parents “Strongly Agree” or “Agree” with the item were grouped to indicate a positive evaluation of program performance. Responses to the open ended questions were coded into positive and negative categories for analysis. For purposes of analysis, five scales were derived from the parents' responses to the fixed alternative questions. These scales include a measure of parents' overall evaluation of their child's treatment program and additional scales that measure their evaluation of the staff that provided services, the services received, and the quality of the services received. In addition, a final scale measured parents' perception of treatment outcomes to date, the impact of the services on the life of their child and family. Overall consumer evaluation of child and adolescent mental health program performance, the first composite measure, uses all of the 26 fixed alternative questions. The scores for the questions that were answered were summed and divided by the number of items answered. The results were then rounded to an integer scale with 4 and 5 (“Agree” and “Strongly Agree”) coded as positive. Individuals who responded to more than half of the questions included in any scale were included in the computation for that scale. Staff, the second composite measure, was derived from consumer responses to nine fixed alternative questions. The questions that contributed to this scale include: 14. I liked the staff people who worked with me at <CMHC Name>. 15. The staff knew how to help my child. 16. The staff asked me what I wanted/needed. 17. The staff listened to what I had to say. 18. The staff helping my child stuck with us no matter what. 19. Staff treated me with respect. 20. Staff respected my family's religious/spiritual beliefs. 21. Staff spoke with me in a way that I understand. 22. Staff were sensitive to my cultural/ethnic background. For a rating to be included, at least five of these questions had to have been answered. The scores for the questions that were answered were summed and divided by the number of questions answered. The results were rounded to an integer scale with 4 and 5 coded as positive. The internal consistency of this scale as measured by average inter-item correlation (Cronbach’s Alpha) is .919.

23
The services scale, the third composite measure, was derived from consumer responses to six fixed alternative questions. The items that contributed to this scale include: 8. I liked the services we received from <CMHC Name>. 9. I helped to choose my child's treatment goals. 10. I helped to choose my child's services. 11. The services my child and/or family received were right for us. 12. The location of our mental health services was convenient. 13. Services were available at times convenient for me. For a rating to be included, at least four of these questions had to have been answered. The scores for the items that were answered were summed and divided by the number of items answered. The results were rounded to an integer scale with 4 and 5 coded as positive. The internal consistency of this scale as measured by average inter-item correlation (Cronbach’s Alpha) is .890. Quality, the fourth composite measure, was derived from consumer responses to three fixed alternative questions. The items that contributed to this scale include: 24. The services I received from <CMHC Name> were of good quality. 25. If I needed mental health services in the future, I would use this mental health center
again. 26. I would recommend this mental health center to a friend who needed help. For a rating to be included, at least two of these questions had to have been answered. The scores for the items that were answered were summed and divided by the number of items answered. The results were rounded to an integer scale with 4 and 5 coded as positive. The internal consistency of this scale as measured by average inter-item correlation (Cronbach’s Alpha) is .941. Parents' perception of treatment outcomes, the fifth composite measure, was based on responses to six fixed alternative questions. The items that contributed to this scale include: As a result of the services I received: 2. My child is better at handling daily life. 3. My child gets along better with family members. 4. My child gets along better with friends and other people. 5. My child is doing better in school and/or at work. 6. My child is better able to cope when things go wrong. 7. I am more satisfied with our family life. The outcomes scale was constructed for all individuals who had responded to at least four of these items. The scores for the items that were answered were summed and divided by the number of items answered. The results were rounded to an integer scale with 4 and 5
24
coded as positive. The internal consistency of this scale as measured by average inter-item correlation (Cronbach’s Alpha) is .929.
Narrative Comments In order to obtain a more complete understanding of the opinions and concerns of consumers of child and adolescent mental health programs in Vermont, four open-ended questions were included in the questionnaire: 27. What was most helpful about the services you received? 28. What was least helpful about the services you received? 29. What could your mental health center do to improve? 30. Other comments? Three hundred ninety-one parents (71% of respondents) supplemented their responses to the survey with written comments. Eight of these parents did not answer at least half of the fixed alternative items so their item responses were not included in the survey analyses. Ten parents supplied comments only. All written responses were coded and grouped to provide further indication of consumer satisfaction with child and adolescent mental health programs. The primary indicator used was the proportion of all respondents who made positive or negative comments about their child and adolescent mental health programs.
Data Analysis In order to provide a more valid basis for comparison of the performance of Vermont’s ten child and adolescent mental health programs, two statistical correction/adjustment procedures were considered for the data analysis. First, it was determined that a “finite population correction” to adjust for the proportion of all potential respondents who returned useable questionnaires was not necessary because the overall response rate was relatively low. Second, a statistical “case-mix adjustment” was applied to the results in order to eliminate any bias that might be introduced by dissimilarities among the client populations served by different community programs. Finite Population Correction Consumer satisfaction surveys, intended to provide information on a finite number of people who are served by specific programs, can achieve a variety of response rates. When responses are received from a substantial proportion of all potential subjects, standard techniques for determining confidence intervals overstate the uncertainty of the results. The standard procedure for deriving 95% confidence intervals for survey results assumes an infinite population represented by a small number of observations. In order to correct this confidence interval for studies in which a substantial proportion of all potential respondents is represented, a finite population correction can be added to the computation. For this survey, 22% of all potential respondents returned useable

25
Potential Case-mix Agency
Adjustment Factors Case Mix Overall Staff Service Quality Outcomes
Age * Gender
Schizophrenia Affective Disorder * * * Anxiety Disorder *
Personality Disorder Adjustment Disorder * *
Substance Abuse
Case-mix Adjustment: Statistical Significance of Relationships (p<.05)
Fixed Alternative Scales
questionnaires. Because this response rate represents a relatively small number of possible responses, finite population correction would have no impact on the data analyses of this survey. Case-mix Adjustment In order to compare the performance of Vermont’s child and adolescent mental health programs, each of the five measures of consumer satisfaction described above was statistically adjusted to account for differences in the case-mix of the ten programs. This process involved three steps. First, a variety of child characteristics, or potential risk-adjustment factors, were tested. These included gender, age, and a range of yes/no variables for individual DSM diagnoses. The child characteristics that were statistically related to variation in parent evaluations of child and adolescent mental health programs were identified. Second, statistically significant differences in the caseloads of the community programs were identified and compared to the child characteristics that were related to variation in parent evaluations of program performance. Finally, the child characteristics that were statistically related to both evaluation of services and caseload differences were used to adjust the raw measures of satisfaction for each community program. The relationship of each of the five scales to these child characteristics and the variation of each across programs is described in the following table.
Table 1
Risk Adjustment: Statistical Significance of Relationships Three risk adjustment factors were found to vary among the child and adolescent mental health program caseloads at a statistically significant level (p<.05). These factors include a diagnosis of affective disorder, a diagnosis of anxiety disorder, and a diagnosis of adjustment disorder. Other possible risk factors, such as gender or a diagnosis of schizophrenia, were not found to vary significantly among program caseloads.

26
One scale score, service, was significantly related to the age of the children served and to a diagnosis of affective disorder. The staff scale scores were significantly related to a diagnosis of affective disorder and a diagnosis of adjustment disorder. The overall, quality and outcomes scale scores were not significantly related to any of the possible risk factors. Because scores on these scales varied among programs and were related to the risk factors, the scales were risk adjusted before scores for different programs were compared. Age group (less than 10 years, 10-13, and 14-18) was also included in the risk adjustment procedures. Whenever a statistical adjustment of survey results was necessary to provide an unbiased comparison of child and adolescent mental health programs, the analysis followed a four-step process. First, the respondents from each community program were divided into the number of categories resulting from the combination of risk factors. When age alone is required, three categories are used. When age (three categories) and affective disorder (two categories) adjustments are both indicated, six categories result. Second, the average respondent rating was determined for each of these categories. Third, the statewide proportion of all child and adolescent mental health program clients who fell into each category was determined. Finally, the average parent rating for each category was multiplied by the statewide proportion of all respondents who fell into that category, and the results were summed to provide a measure of consumer rating that is free of the influence of differences in the characteristics of consumers across programs. Mathematically, this analytical process is expressed by the following formula:
∑ ii Xw
where 'wi' is the proportion of all potential respondents who, for example, fall into age
category 'i', and ' iX ' is the average level of satisfaction for people in age group 'i'. When one of the categories used in this analysis included no responses, it was necessary to consider whether the difference between the caseload of a specific program and the caseload of other programs in the state was too great to allow for statistical case-mix adjustment. If it was decided that the difference was within reason, the empty category was collapsed into an adjacent category and the process described above was repeated using the smaller set of categories.
Discussion The statistical adjustments/corrections used in this evaluation allowed the analysis to take into account the methodological strengths and shortcomings of the survey and the unique characteristics of Vermont’s community mental health programs. Statistical adjustment for difference in case-mix allows researchers and program evaluators to appropriately compare the performance of programs that serve people with different demographic and clinical characteristics, and different patterns of service utilization.
27
The statistical adjustment designed to correct for differences in case-mix across provider organizations had some impact on the survey results. In general, there was very little difference in the client populations of the ten programs in areas that were related to consumer satisfaction. The relative impact of these statistical adjustments could be very different in situations where response rates are higher and/or case-mix differences are more substantial.

28

29
APPENDIX V:
TABLES AND FIGURES
Response Rates by Program Positive Responses to Individual Questions by Program
Positive Scale Scores by Program
30
Response Rate
Mailed Deliverable No Response Returned Useable Survey Analyzed2
Statewide 3,089 2,404 1,857 547 539 22%
Addison - CSAC 310 248 193 55 54 22%
Bennington - UCS 222 182 138 44 43 24%
Chittenden - HC 344 276 220 56 56 20%
Lamoille - LCMH 155 115 84 31 30 26%
Northeast - NKHS 231 185 149 36 35 19%
Northwest - NCSS 423 316 243 73 71 22%
Orange - CMC 254 219 148 71 71 32%
Rutland - RMHS 283 203 155 48 47 23%
Southeast - HCRS 566 433 340 93 92 21%
Washington - WCMH 301 227 187 40 40 18%
1 Appendix VI gives the full name and location of each of the ten designated CMHCs. 2 Questionnaires that were deliverable, completed and used for analysis.
Number of SurveysRegion/Provider1
Table 2
Response Rates by Program Evaluation of Child and Adolescent Mental Health Programs in Vermont
By Parents of Children Served July to December 2007
31
Statewide Addison Bennington Chittenden Lamoille Northeast Northwest Orange Rutland Southeast Washington21. Staff spoke with me in a way that I understood.
91% 94% 91% 88% 87% 94% 91% 93% 91% 90% 95%
19. Staff treated me with respect.90% 92% 98% 93% 87% 83% 90% 87% 91% 88% 93%
14. I liked the staff people who worked with me at <<CLINC>> .89% 92% 98% 93% 79% 83% 89% 88% 94% 83% 88%
12. The location of my mental health services was convenient.87% 85% 93% 79% 77% 85% 84% 87% 98% 88% 90%
22. Staff were sensitive to our cultural/ethnic background.83% 92% 90% 80% 80% 69% 85% 84% 88% 76% 92%
17. The staff listened to what I had to say.83% 91% 91% 85% 77% 70% 77% 83% 87% 82% 84%
20. Staff respected my family’s religious/spiritual beliefs.82% 83% 95% 75% 83% 76% 82% 74% 95% 78% 89%
13. Services were available at times convenient for me.81% 89% 90% 72% 70% 74% 82% 83% 87% 81% 80%
16. The staff asked me what I wanted/needed.81% 92% 74% 80% 83% 74% 80% 80% 79% 81% 85%
9. I helped to choose my child’s treatment goals.81% 87% 71% 85% 62% 82% 79% 82% 91% 76% 87%
1. The services we received from «CLINIC» were helpful to my child and family.81% 87% 88% 84% 63% 79% 72% 82% 81% 84% 78%
24. The services I received from «CLINIC» were of good quality.80% 94% 85% 80% 52% 80% 71% 78% 89% 83% 79%
8. I liked the services we received from <<CLINIC>> .80% 89% 84% 80% 55% 80% 70% 80% 89% 85% 79%
25. If I needed mental health services in the future, I would use this mental health center again.80% 88% 81% 80% 62% 80% 74% 78% 87% 82% 78%
26. I would recommend this mental health center to a friend who needed help.79% 89% 79% 78% 59% 71% 77% 75% 87% 85% 80%
10. I helped to choose my child’s services.78% 87% 64% 81% 59% 88% 72% 81% 83% 81% 77%
23. Overall, I am satisfied with the services my child received.77% 89% 80% 80% 55% 69% 67% 78% 85% 82% 75%
18. The staff helping my child stuck with us no matter what.77% 87% 76% 75% 66% 74% 66% 77% 87% 80% 75%
15. The staff knew how to help my child.74% 91% 83% 71% 53% 54% 70% 76% 85% 71% 78%
11. The services my child and/or family received were right for us.71% 81% 74% 72% 47% 63% 61% 76% 76% 76% 68%
4. My child gets along better with friends and other people.63% 76% 65% 67% 57% 53% 54% 63% 64% 66% 64%
5. My child is doing better in school and/or at work.63% 74% 65% 58% 50% 59% 59% 67% 64% 63% 64%
2. My child is better at handling daily life.63% 76% 70% 64% 53% 65% 46% 63% 65% 64% 65%
7. I am more satisfied with our family life.62% 69% 64% 60% 50% 50% 59% 66% 64% 66% 62%
3. My child gets along better with family members.60% 66% 57% 67% 50% 59% 54% 60% 62% 61% 61%
6. My child is better able to cope when things go wrong.54% 65% 56% 58% 53% 53% 43% 53% 55% 54% 55%
Average 76% 84% 79% 76% 64% 71% 71% 76% 82% 77% 77%
Table 3
Positive Responses to Survey Items by Program Evaluation of Child and Adolescent Mental Health Programs in Vermont
By Parents of Children Served July to December 2007

32
Overall Staff Quality Service Outcomes
Statewide 78% 86% 81% 82% 65%
Addison -CSAC 91% 93% 91% 91% 76%
Bennington -UCS 77% 92% 81% 81% 65%
Chittenden -HC 77% 90% 80% 73% 63%
Lamoille -LCMH 60% 79% 59% 63% 57%
Northeast -NKHS 84% 68% 80% 74% 60%
Northwest -NCSS 70% 87% 71% 70% 48%
Orange -CMC 78% 82% 78% 64% 70%
Rutland -RMHS 78% 88% 87% 79% 57%
Southeast -HCRS 81% 87% 84% 79% 69%
Washington -WCMH 73% 92% 79% 79% 70%
For each scale, BOLD numbers indicate significant differences when compared to the statewide average (p<.05).
Region-Provider
* Overall scores, and scores for Access, Service, Respect, Autonomy and Outcomes are adjusted for differences in case mix for age and gender by region.
Table 4
Adjusted* Positive Scale Scores by Program Evaluation of Child and Adolescent Mental Health Programs
by Parents of Children Served in Vermont July - December 2007

33
APPENDIX VI:
PROGRAM COMPARISONS
Overall Evaluation Evaluation of Staff
Evaluation of Services Evaluation of Quality
Evaluation of Outcomes Narrative Comments
Comparison of Scales from 2002, 2006 and 2008 Surveys Point-in-Time Comparisons

34
# # Positive % Positive Adj. % Positive Confidence SignificanceRespondents Respondents Respondents Respondents1 Interval
Addison - CSAC 54 49 91% 91% (83%-99%) *Bennington - UCS 43 33 77% 77% (64%-90%) Chittenden - HCHS 56 43 77% 77% (65%-88%) Lamoille - LCMH 30 18 60% 60% (41%-80%) Northeast - NKHS 34 28 82% 84% (72%-97%) Northwest- NCSS 71 52 73% 70% (60%-81%) Orange - CMC 71 56 79% 78% (68%-88%) Rutland - RMHS 47 39 83% 78% (63%-94%) Southeast- HCRS 92 75 82% 81% (73%-90%) Washington - WCMH 40 29 73% 73% (59%-87%)
Statewide 538 422 78%
1 Statistically adjusted to reflect caseload composition by age statewide* Significantly different from average overall evaluation statewide (p<.05)
Region-CMHC
0%
25%
50%
75%
100%
CSAC UCS HCHS LCMH NKHS NCSS CMC RMHS HCRS WCMH
Unadjusted Adjusted
Figure 3
Overall Evaluation of Child and Adolescent Mental Health Services
by Parents of Children Served in Vermont July - December 2007

35
# # Positive % Positive Adj. % Positive Confidence SignificanceRespondents Respondents Respondents Respondents1 Interval
Addison - CSAC 53 49 92% 93% (77%-100%)Bennington - UCS 43 39 91% 92% (73%-100%) Chittenden - HCHS 56 49 88% 90% (72%-100%) Lamoille - LCMH 30 24 80% 79% (57%-100%) Northeast - NKHS 35 27 77% 68% (46%-90%) Northwest- NCSS 71 61 86% 87% (73%-100%) Orange - CMC 70 59 84% 82% (68%-97%) Rutland - RMHS 47 43 91% 88% (68%-100%) Southeast- HCRS 92 76 83% 87% (72%-100%) Washington - WCMH 40 35 88% 92% (69%-100%)
Statewide 537 462 86%
* Significantly different from average statewide evaluation of outcomes (p<.05)
1 Statistically adjusted to reflect caseload composition by age, affect disorder, and schizophrenia statewide
Region-CMHC
0%
25%
50%
75%
100%
CSAC UCS HCHS LCMH NKHS NCSS CMC RMHS HCRS WCMH
Unadjusted Adjusted
Figure 4
Evaluation of Staff of Child and Adolescent Mental Health Services
by Parents of Children Served in Vermont July - December 2007

36
# # Positive % Positive Adj. % Positive Confidence SignificanceRespondents Respondents Respondents Respondents1 Interval
Addison - CSAC 53 48 91% 91% (83%-99%) *Bennington - UCS 42 34 81% 81% (69%-93%) Chittenden - HCHS 56 45 80% 80% (69%-91%) Lamoille - LCMH 29 17 59% 59% (38%-79%) *Northeast - NKHS 35 28 80% 80% (66%-95%) Northwest- NCSS 70 52 74% 71% (61%-82%) Orange - CMC 68 54 79% 78% (68%-88%) Rutland - RMHS 46 41 89% 87% (74%-100%) Southeast- HCRS 92 78 85% 84% (77%-92%) Washington - WCMH 40 31 78% 79% (67%-91%)
Statewide 531 428 81%
1 Statistically adjusted to reflect caseload composition by age statewide* Significantly different from average overall evaluation statewide (p<.05)
Region-CMHC
0%
25%
50%
75%
100%
CSAC UCS HCHS LCMH NKHS NCSS CMC RMHS HCRS WCMH
Unadjusted Adjusted
Figure 5
Evaluation of Quality of Child and Adolescent Mental Health Services
by Parents of Children Served in Vermont July - December 2007

37
# # Positive % Positive Adj. % Positive Confidence SignificanceRespondents Respondents Respondents Respondents1 Interval
Addison - CSAC 54 47 87% 91% (70%-100%) Bennington - UCS 42 36 86% 81% (60%-100%) Chittenden - HCHS 55 43 78% 73% (57%-88%) Lamoille - LCMH 30 21 70% 63% (40%-86%) Northeast - NKHS 34 29 85% 74% (53%-95%) Northwest- NCSS 71 55 77% 70% (47%-93%) Orange - CMC 71 60 85% 64% (41%-87%) Rutland - RMHS 47 42 89% 79% (58%-100%) Southeast- HCRS 92 73 79% 79% (70%-88%) Washington - WCMH 40 31 78% 79% (58%-99%)
Statewide 536 437 82%
1 Statistically adjusted to reflect caseload composition by age and affective disorder statewide* Significantly different from average overall evaluation statewide (p<.05)
Region-CMHC
0%
25%
50%
75%
100%
CSAC UCS HCHS LCMH NKHS NCSS CMC RMHS HCRS WCMH
Unadjusted Adjusted
Figure 6
Evaluation of Services of Child and Adolescent Mental Health Services
by Parents of Children Served in Vermont July - December 2007
38
# # Positive % Positive Adj. % Positive Confidence SignificanceRespondents Respondents Respondents Respondents1 Interval
Addison - CSAC 54 41 76% 76% (64%-88%) Bennington - UCS 43 28 65% 65% (51%-80%) Chittenden - HCHS 55 35 64% 63% (50%-77%) Lamoille - LCMH 30 17 57% 57% (38%-76%) Northeast - NKHS 34 21 62% 60% (42%-79%) Northwest- NCSS 71 36 51% 48% (37%-60%) *Orange - CMC 70 49 70% 70% (59%-81%) Rutland - RMHS 46 30 65% 57% (43%-72%) Southeast- HCRS 91 63 69% 69% (59%-79%) Washington - WCMH 39 27 69% 70% (55%-85%)
Statewide 533 347 65%
1 Statistically adjusted to reflect caseload composition by age statewide* Significantly different from average overall evaluation statewide (p<.05)
Region-CMHC
0%
25%
50%
75%
100%
CSAC UCS HCHS LCMH NKHS NCSS CMC RMHS HCRS WCMH
Unadjusted Adjusted
Figure 7
Evaluation of Outcomes of Child and Adolescent Mental Health Services
by Parents of Children Served in Vermont July - December 2007
39
# # Positive % Positive # Negative % Negative Significance *Respondents Comments Comments Comments Comments
Addison - CSAC 54 36 67% (54%-80%) 17 31% (17%-42%) *Bennington - UCS 43 24 56% (47%-71%) 14 33% (25%-48%) *Chittenden - HCHS 56 38 68% (55%-80%) 23 41% (26%-52%) *Lamoille - LCMH 30 16 53% (34%-72%) 12 40% (18%-55%) *Northeast - NKHS 35 26 74% (50%-70%) 17 49% (29%-49%) *Northwest- NCSS 71 42 59% (59%-90%) 25 35% (34%-69%)
Orange - CMC 71 50 70% (63%-84%) 28 39% (32%-55%) *Rutland - RMHS 47 33 70% (59%-86%) 14 30% (14%-41%) *Southeast- HCRS 92 55 60% (36%-67%) 35 38% (14%-42%) *Washington - WCMH 40 27 68% (52%-83%) 13 33% (22%-53%) *
Statewide 539 347 64% 198 37%
* Denotes that parents made significantly more positive than negative comments (p<.05)
Region-CMHC Confidence Interval
Confidence Interval
0%
25%
50%
75%
100%
CSAC UCS HCHS LCMH NKHS NCSS CMC RMHS HCRS WCMH
% Positive % Negative
Figure 8
Narrative Comments About Child and Adolescent Mental Health Services
By Parents of Children Served in Vermont July - December 2007

40
0%
25%
50%
75%
100%
Overall Staff Services Quality Outcomes
2002 2005 2007
Figure 9
Comparison of Scales from 2002, 2006 and 2008 Surveys of Child and Adolescent Mental Health Programs
by Parents of Children Served in Vermont during 2001–2002, 2005 and 2007
41
Program Overall Staff Services Quality Outcomes Overall Staff Services Quality Outcomes Overall Staff Services Quality Outcomes
Addison - CSAC
Bennington - UCS
Chittenden - HC
Lamoille - LCMH
Northeast - NKHS
Northwest- NCSS
Orange - CMC
Rutland - RMHS
Southeast- HCRS
Washington - WCMH
Higher than average Average Lower than average
20052001 - 2002 2007
Figure 10
Point-in-Time Comparisons Positive Evaluations of Child and Adolescent Mental Health Programs
By Parents of Children Served in Vermont During 2001–2002, 2005 and 2007

42

43
APPENDIX VII:
Child and Adolescent Mental Health Programs in Vermont This report provides assessments of the ten regional child and adolescent mental health programs that are designated by the Vermont Department of Health’s Department of Mental Health. Child and adolescent mental health programs serve children and families who are undergoing emotional or psychological distress or are having problems adjusting to changing life situations. These programs primarily provide outpatient services (individual, group and family therapy, and diagnostic services), although some agencies also provide residential services for children and adolescents who have a severe emotional disturbance. Throughout this report, these child and adolescent mental health programs have been referred to by the name of the region that they serve. The full name and business office location of the designated agency with which each of these programs is associated are provided below. Additional information about these programs can be found at: http://healthvermont.gov/mh/providers/provider-list.aspx Addison Counseling Service of Addison County (CSAC) in Middlebury. Bennington United Counseling Services (UCS) in Bennington. Chittenden HowardCenter (HC) in Burlington. Lamoille Lamoille County Mental Health Services (LCMH) in Morrisville. Northeast Northeast Kingdom Human Services (NKHS) in Newport and St.
Johnsbury. Northwest Northwest Counseling and Support Services (NCSS) in St. Albans. Orange Clara Martin Center (CMC) in Randolph. Rutland Rutland Mental Health Services (RMHS) in Rutland. Southeast Health Care & Rehabilitation Services of Southeastern Vermont
(HCRS) in Springfield. Washington Washington County Mental Health Services (WCMH) in Berlin and
Barre.

44