
Evaluation of Chemical Assays for Determining ...
141
i Evaluation of Chemical Assays for Determining Hydroperoxides Levels in Oxidized Lipids by ELAH TAMAR STELTZER A thesis submitted to the Graduate School-New Brunswick Rutgers, The State University of New Jersey in partial fulfillment of the requirements for the degree of Master of Science Graduate Program in Food Science written under the direction of Dr. Karen M. Schaich and approved by ________________________ ________________________ ________________________ ________________________ New Brunswick, New Jersey [May, 2012]
Transcript of Evaluation of Chemical Assays for Determining ...

i
Evaluation of Chemical Assays for Determining Hydroperoxides Levels in Oxidized
Lipids
by
ELAH TAMAR STELTZER
A thesis submitted to the
Graduate School-New Brunswick
Rutgers, The State University of New Jersey
in partial fulfillment of the requirements
for the degree of
Master of Science
Graduate Program in Food Science
written under the direction of
Dr. Karen M. Schaich
and approved by
________________________
________________________
________________________
________________________
New Brunswick, New Jersey
[May, 2012]

ii
ii
ABSTRACT OF THESIS
Evaluation of Chemical Assays for Determining Hydroperoxides Levels in Oxidized
Lipids
By ELAH T. STELTZER
Thesis Director:
Dr. Karen M. Schaich
This thesis re-evaluated current analyses for hydroperoxides, the first stable
product of lipid oxidation. The objective was to compare linearity of response, accuracy,
limits of detection, active concentration range, reproducibility, and required conditions
and handling for six commonly-used hydroperoxide assays, using cumene (lipid-soluble)
and tert-butyl (water-soluble) hydroperoxides as test standards; optimized procedures
were then applied to oxidized methyl linoleate.
Traditional iodometric titration method with thiosulfate is the most accurate assay
chemically. It is stoichiometric, linear, and useful for high peroxide concentrations, but
unclear endpoints limits sensitivity and many handling issues must be controlled to
provide reproducible results. It is the only method providing absolute quantitation of
hydroperoxides.
PeroxySafeTM
and PeroxoQuantTM
commercial kits based on the xylenol orange
assay detected nanomoles of hydroperoxides, but samples with more than trace levels of
hydroperoxides (the usual case with foods) must be diluted extensively before analysis.
Variation of reaction response varied with hydroperoxide structure is a major

iii
iii
disadvantage for this assay, and the Fe3+
-xylenol orange complex was readily bleached
by excess hydroperoxide, thus reducing apparent hydroperoxide levels. Reaction
stoichiometry cannot be determined due to proprietary reagents of unspecified
concentration.
The ferric thiocyanate method (chemical reaction or Cayman LPOTM
kit) is
extremely sensitive, detecting as low as 5 nanomoles, but the reaction stoichiometry
varies with solvent and hydroperoxide structure and concentration. Fe3+
-SCN complexes
bleached at high hydroperoxide concentrations, causing underestimation of peroxide
values. Extensive dilution of samples is thus required for analyses of lipid extracts from
most foods.
Due to these complications, xylenol orange and Fe3+
-thiocyanate assays may be
useful for monitoring changes of single materials over time or comparing extracts with
comparable fatty acid composition, but they cannot determine absolute hydroperoxide
concentrations. No optical assay tested matched peroxide values determined by
iodometric assay.
Finally, hydroperoxides oxidize triphenylphosphine selectively and
stoichiometrically to triphenylphosphine oxide that can be detected and quantitated by
HPLC, detecting as low as 5 picomoles of hydroperoxide. The reaction has promise, but
needs further investigation before adoption. Results for all methods highlight the
importance of excluding oxygen during the assays and understanding the correct
concentration range for each assay.

iv
iv
Acknowledgements
I would like to thank the following people, whose contributions were critical for completion
of this thesis:
Dr. Karen M. Schaich, my thesis advisor, for her support through the years. Her patience,
kindness, knowledge and insight helped me reach my goals. I am grateful for the privilege of
having known and worked with her.
Dr. Chaim Frenkel and Dr. Chi-Tang Ho for serving on my thesis committee. Their
comments and suggestions are greatly appreciated.
My parents and siblings for their unconditional support and constant encouragement in
helping me with this endeavor.
My friends and lab mates, for their help and friendship. They were there to cheer me through
all the difficult times.

v
v
TABLE OF CONTENTS
ABSTRACT OF THE THESIS ii
ACKNOWLEDGEMENTS iv
TABLE OF CONTENTS v
LIST OF TABLES viii
LIST OF FIGURES x
1. INTRODUCTION 1
2. BACKGROUND 5
2.1. General Overview of Lipid Oxidation 5
2.2 .Assays for Lipid Hydroperoxides 10
2.2.1. General Considerations 10
2.2.2. Iodometric Titration of Hydroperoxides with Thiosulfate 12
2.2.3. Ferric Thiocyanate for Lipid Hydroperoxides 23
2.2.4. Xylenol Orange Background 31
2.2.5. PeroxySafe Background 38
2.2.6. Triphenylphosphine Oxidation using HPLC 40
3. OBJECTIVES 42
4. EXPERIMENTAL PROCEDURES 43
4.1. Materials used for all assays 43
4.2. Experimental Protocols for Hydroperoxide Assays 43
4.2.1. Iodometric Titration with Thiosulfate 43
4.2.2. Ferric Thiocyanate Assay for Lipid Hydroperoxides 48

vi
vi
4.2.3. Cayman Chemical Company: Lipid Hydroperoxide (LPO)
Assay Kit 54
4.2.4. PeroXOquantTM
Quantitative Peroxide Assay Kit,
Lipophilic version 57
4.2.5. SafTest PeroxySafe Assay for Lipid Hydroperoxides 61
4.2.6. LOOH Based on Triphenylphosphine Oxidation using HPLC 65
4.2.7. Modification of Iodometric Titration: Lovaas Method 67
4.3. Autoxidation of Methyl Linoleate 68
4.3.1. Assay of Methyl Linoleate 68
5. RESULTS AND DISCUSSION 69
5.1. Iodometric Titration with Thiosulfate (TS) 69
5.2. Ferric Thiocyanate Assay for Hydroperoxides 79
5.3. Cayman Hydroperoxide Kit (Thiocyanate Assay) 88
5.4. Xylenol Orange – Pierce Assay Kit 94
5.5. PeroxySafe Kit 100
5.6. Triphenylphosphine/ HPLC Assay of Cumene Hydroperoxide 109
5.7. Application of Assays to Determination of Hydroperoxides in Oxidized
Methyl Linoleate 112
5.7.1. Iodometric Titration 112
5.7.2. PeroxySafeTM
Xylenol Orange Assay 112
5.7.3. Pierce Xylenol Orange Assay 114
5.7.4. Ferric Thiocyanate Assay 115
5.7.5. Cayman Kit - Thiocyanate Assay 116

vii
vii
5.8. Comparison of Assays 118
6. SUMMARY AND CONCLUSIONS 120
7. FUTURE WORK 122
8. REFERENCES 123

viii
viii
LIST OF TABLES
Table 1. Comparison of several methods by author. 26
Table 2. Reagents for preparation of Fe3+
Standard Curve 51
Table 3: Cumene hydroperoxide. Hydroperoxide Standard is first diluted to 1.64 ug/ml
using Methanol. 53
Table 4. Cayman Lipid Hydroperoxide Standard (13-HpODE) Curve 55
Table 5a. Reproducibility of Iodometric titration for quantitating hydroperoxides. Values
presented below are averages of 5 replicates.. 77
Table 5b. Reproducibility of Iodometric titration for quantitating hydroperoxides. Values
presented below are averages of 5 replicates. 78
Table 6. Stoichiometry of ferric thiocyanate reaction with cumene and t-Butyl
hydroperoxides with comparison of regression curves. 84
Table 7a. Reproducibility of ferric thiocyanate assay for hydroperoxides: ferric iron
standard. 85
Table 7b. Reproducibility of ferric thiocyanate assay for hydroperoxides: cumene
and t-Butyl. 5 replicates per day. 86
Table 7c. Reproducibility of ferric thiocyanate assay for hydroperoxides: t-Butyl
hydroperoxides. 5 replicates per day. 87
Table 8a. Reproducibility of Cayman ferric thiocyanate assay for cumene hydroperoxide.
5 replicates per day. 92
Table 8b. Reproducibility of Cayman ferric thiocyanate assay for hydroperoxides: t-butyl
hydroperoxides. 5 replicates per day. 93

ix
ix
Table 9. Reproducibility of Pierce xylenol orange assay for hydroperoxides, using
standard cumene and t-Butyl hydroperoxides. 99
Table 10 . Detection efficiency of Peroxy-Safe assay for lipid hydroperoxides. 105
Table 11a. Reproducibility of Peroxy-Safe assay for lipid hydroperoxides. 106
Table 11b. Reproducibility of Peroxy-Safe assay for lipid hydroperoxides. 106
Table 12. HPLC peak area of TPPO formed in reaction of cumene hydroperoxide with
TPP. Average of 3 analyses. 111
Table 13. Methyl Linoleate – Iodometric Titration. Three different concentrations; three
replicates 112
Table 14. Detection of ML hydroperoxides by the PeroxySafeTM
assay. Values are
averages of three replicates. 114
Table 15. Detection of ML hydroperoxides by the Pierce Xylenol Orange assay. Values
are averages of three replicates. 115
Table 16. Detection of ML hydroperoxides by the ferric thiocyanate assay. Values are
averages of three replicates. 116
Table 17. Detection of ML hydroperoxides by the Cayman ferric thiocyanate assay.
Values are averages of three replicates. 117
Table 18. Comparison of detection ranges for various hydroperoxide assays. 118
Table 19. Comparison of methyl linoleate hydroperoxide levels detected by the various
assays. 119

x
x
LIST OF FIGURES
Figure 1. Free radical reactions sequence in lipid oxidation described by classical theory
(Schaich 2005) 7
Figure 2. Concentration response curves for thiosulfate titration of cumene and t-butyl
hydroperoxides. Plotted values are averages of five replicates. Standard error and
replication data are presented in Table 1. Top: full concentration range. Bottom:
expanded scale showing increased linearity at lowest hydroperoxide
concentrations. 70
Figure 3. Progressive color changes during thiosulfate titration of iodine released after
reduction of hydroperoxides. Change from D to E is often very fast. Note E is
colorless. 73
Figure 4. Iron standard curve for Ferric Thiocyanate assay for hydroperoxides. Top: full
concentration range tested. Bottom: Expanded scale for lowest concentration
ranges. 81
Figure 5. Reaction response of cumene and t-Butyl hydroperoxides in the
FeSCN assay. 82
Figure 6. Response stoichiometry of cumene and t-Butyl hydroperoxides in the FeSCN
assay. Curves labeled 1 were calculated using the slope of the upper region of the
Fe3+
standard curve (0.013); curves labeled 2 were calculated using the slope from
the lower region of the standard curve (0.017). 83
Figure 7. Reproducibility of standards and kits supplied for Cayman ferric thiocyanate
assay of hydroperoxides. Average of three replicates; two different kits run
several months apart. 89

xi
xi
Figure 8. Reaction responses as a function of of cumene and t-butyl hydroperoxide
concentrations in the Cayman Fe3+
-SCN assay. 90
Figure 9. Comparison of reaction responses for cumene hydroperoxide and 13-HpODE
standards in the Cayman Fe3+
-SCN assay. 90
Figure 10. Response curves for reaction of Fe3+
, CuOOH, and t-BuOOH in the Pierce
xylenol orange assay. Top curve: full concentration range. Bottom curve: lower
concentration range on expanded scale. 96
Figure 11. Optical spectra of xylenol orange blank and cumene
hydroperoxide-XO. 97
Figure 12. SafTest response curves for cumene and t-Butyl hydroperoxides. Each data
point is an average of five replicates. 102
Figure 13. Comparison of SafTest peroxide values with actual peroxide concentrations
added, calculated as / kg isopropanol (wt basis) or /L isopropanol
(volume basis). 103
Figure 14. SafTest reported values for CuOOH reaction vs theoretical values (weights of
standards) assuming that SafTest calculations are based on a sample weight of 25
ul isopropanol. Other calculation procedures attempted to account for sample
weight do not give values anywhere close to reported PVs. Slope of standards:
0.79. 108
Figure 15. Response curve for cumene hydroperoxide with triphenylphosphine. Each
point is the average of three analyses. 111
1
1. INTRODUCTION
Lipid Oxidation has interested humans for centuries. In 1800 a Swiss Chemist by
name of Nicolas-Théodore de Saussure observed a layer walnut oil exposed to air for a
year using simple mercury nanometer (Leray, 2011). This observation led to the
recognition that lipid oxidation is a major degradative reaction limiting shelf life and
destroying quality of foods. Thus, over the years since, scientists have continued to study
the causes, development, and products of lipid oxidation in foods and a wide range of
model systems (Lea, 1946; Hills & Thiel, 1945: Gupta, 1973; Jiang et al., 1992; Eymard
& Genot, 2003; Gay et al., 1999; Grau et al., 2000). While knowledge about lipid
oxidation has grown as science has advanced, the process remains complicated. Even
more importantly, with current trends in replacing stable saturated and monounsaturated
fats with “healthy” polyunsaturated oils in foods, lipid oxidation has once again become a
huge problem for the food industry.
The average consumer recognizes lipid oxidation as “rancidity”. A consumer
notices a food is rancid by odors or off flavors caused by volatile products released from
oxidizing lipids. In general, these compounds are detrimental to food quality, although
there are certain foods such as cheeses, fried foods, and dried cereal for which small
amounts of lipid oxidation products are required to develop full characteristic flavors
(McClements & Decker, 2008). Oxidation of the lipids are the main cause of chemical
deterioration, reduced stability, and formation of off-flavors that reduce the quality,
storage life, and consumer acceptance of most processed foods (Hornero-Méndez et al.,
2001).
For food industry the oxidative deterioration of food has large economic

2
importance (Frankel, 1985) because lipid oxidation products can be found in all natural
food materials (Kamal-Eldin & Pokorny, 2005). Even minute amounts present after
processing can translate to greatly accelerate reactions during storage, with parallel
changes in flavor, odor, texture, color, and loss of nutritional value (Schaich, 2009,
2012). There are even some claims that potentially toxic or carcinogenic products are
formed (Shahidi, 1998; Schaich, 2012).Consequently, it is imperative that food scientists
be able to track lipid oxidation at very low concentrations in order to control food quality
all the way from ingredients through processing to products sitting for indefinite times in
storage at consumers’ homes.
Analysis of lipid oxidation is not simple. The complexity of lipid oxidation
reactions and products formed means there is no straightforward way to monitor the
entire process. One particular difficulty is that lipid oxidation reactions are at the same
time both sequential and overlapping (Kamal-Eldin & Pokorny, 2005) with products
constantly forming and decomposing to other products. Also, there is no set series of
reactions – alternate pathways are active and the balance between them varies with
conditions and reaction system (Schaich, 2005). This means that analyses of multiple
products must be performed to obtain a complete picture of the oxidation process. To
further complicate matters, not only do foods contain natural components other than
lipids that can react with lipid free radicals, hydroperoxides, aldehydes, etc, but minor
components of fats and oils also further react with radicals and hydroperoxides (Kamal-
Eldin & Pokorny, 2005). These side reactions can make lipid oxidation appear to be low
when in fact they have just been broadcast to other molecular targets. Thus, full tracking
3
of lipid oxidation requires analyses of co-oxidations, e.g. protein radicals and
crosslinking, in addition to direct lipid oxidation products (Schaich, 2008).
Now add to these issues additional technical problems. First, all traditional
analyses of lipid oxidation require extraction of lipids, and this process can itself induce
oxidation or decompose some products into others. Second, analyses vary in their
sensitivity, stoichiometry, detection ranges, and side reactions, yet these limitations are
routinely ignored. Rather, the common method for selecting a lipid oxidation assay is to
either
a) follow a method standardized by AOCS or AOAC, most of which were
developed for oils decades ago using insensitive methods, or
b) Following a method cited in the literature, for which complete experimental
details and appropriate concentration ranges are seldom available.
Both of these approaches can miss the target concentration range for lipid oxidation in
foods, though in opposite directions. In particular, some of the more recent methods
developed to detect ultralow levels of lipid oxidation products in living tissues have been
adapted for use in foods, but these show response saturation at nano or micro molar
levels. As a result, it is very easy to get results indicating no lipid oxidation in foods.
Returning to an earlier point, with current focus on reformulating foods with
polyunsaturated oils to support improved health, the time has come to re-evaluate how
lipid oxidation is measured in foods. As part of a larger program designed to establish a
rational quantitative basis for selection of lipid oxidation assays for foods, this thesis
focused on hydroperoxides assays. Five assays based on three fundamental reactions
were tested for upper and lower detection limits, linear response ranges, stoichiometry of

4
reaction, accuracy and reproducibility, and required handling procedures and quirks. A
sixth assay was given preliminary investigation. Comparisons of results provide some
guidelines for selection and use of these assays for different types of samples.
It must be noted that this thesis focuses on optimizing assays to obtain the most
accurate information possible, and comparing assays to determine appropriate
concentration ranges and conditions for use of each assay. The expectation was some
assays would be identified as useful for trace concentrations and others might be the
method of choice for samples with high oxidation levels. This thesis is not addressing the
issue of whether hydroperoxides should even be measured or whether hydroperoxides
detected in extracts accurately reflect actual oxidation in original materials (foods or
biological tissues). Kamal-Eldin has pointed out that analyzing whole lipid oxidation
mixtures is generally easier than analyzing separate components, and separation of lipids
can tremendously complicate interpretation of results (Kamal-Eldin & Pokorny, 2005).
Isolating oxidized lipids from common foods is not easy, particularly when lipid
oxidation products become bound to proteins and similar compounds with covalent bonds
and thus are lost to normal analysis. The handling required in extraction and subsequent
storage can induce extraneous oxidation or change existing products. Hydroperoxides are
a particular case in point since they are decomposed by ultraviolet light and temperatures
above about 40 C. Finally, none of the various classes of lipid oxidation products are
stable, and they rapidly undergo transformations with improper handling and storage
(Kamal-Eldin & Pokorny, 2005). These are indeed important points to keep in mind
when monitoring lipid oxidation, particularly hydroperoxides. However, the issues are
beyond the scope of this research project.
5
2. BACKGROUND
2.1. General Overview of Lipid Oxidation
Lipid oxidation occurs in three stages. Lipid oxidation is not thermodynamically
spontaneous. Although this is an oxidation reaction, oxygen cannot add directly to double
bonds because the electrons in double bonds and in ground state oxygen are all parallel in
the same direction. However, oxygen adds almost instantaneously to free radicals, so the
initiation step in lipid oxidation requires high activation energy to produce alkyl free
radicals on the lipid hydrocarbon chain (Schaich, 2005). This high energy comes most
commonly from light, heat or metals, or radicals formed in other reactions such as
decomposition of pre-formed trace hydroperoxides (Schaich, 2005). Alkyl radicals are
formed at various positions depending on the initiator. Oxygen then adds to the alkyl
radicals to generate peroxyl radicals, LOO (Kamal-Eldin & Pokorny, 2005; Schaich,
2005).
LOO are moderately reactive and abstract hydrogen atoms from a neighboring
lipid chain to form stable hydroperoxides and new radicals. So each time a peroxyl
radical is converted into lipid hydroperoxide, it produces another lipid radical which
continues the chain. This basic process continues indefinitely, providing the basis for the
second stage, Propagation, which establishes the characteristic free radical chain reaction
of lipid oxidation (Schaich, 2006). Hydroperoxides are relatively stable. However, LOOH
decomposes in the presence of metals to radicals plus ions,
LOOH + Fe2+
LO +
OH,
LOOH + Fe2+
LOO +
+H

6
or in the presence of light or heat to yield two even more reactive lipid alkoxyl and
hydroxyl radicals,
LOOH LO +
OH,
All of these radicals abstract hydrogens to keep existing chains going and to generate new
chains (called branching) (Schaich, 2005). As a result, oxidation rates begin to increase
exponentially.
Free radical transfers continue and do not stop until there are no hydrogens
available or the chain is interrupted (Schaich, 2009), i.e. the chain is terminated. In the
termination step, two radicals can combine to form an infinite variety of nonradical
products, or alkoxyl radicals. Then they can undergo scission on either side of the C-O
bond to release mostly short chain alkanes and aldehydes, some of which are volatile.
Figure 1 shows how these reactions are integrated into the three stages of lipid oxidation.
The rate of lipid oxidation depends on many factors, including system
environment and solvent (temperature, light, oxygen pressures, etc), presence of other
components (pro-oxidants, antioxidants, interceptors), nature or form of lipid (degree of
unsaturation, trans vs cis isomers, phospholipids, etc), and molecular surfaces (Schaich,
2009). Rate information is important because a lipid analyst can slow oxidation during
handling and analysis by decreasing temperature, or by storing samples under reduced
oxygen pressure (partial to full vacuum) or inert gas. Addition of antioxidants can reduce
oxidation rate, but not completely stop it, unless initiation is also blocked (Schaich,
2009). Most foods contain enough redox-active metal concentrations high enough to
catalyze lipid oxidation; these are impossible to remove completely and very difficult to

7
Figure 1. Free radical reactions sequence in lipid oxidation described by classical theory (Schaich
2005)
Figure 1. Traditional free radical chain reaction mechanism understood for lipid oxidation {Schaich, 2005 #1068}.
Initiation (formation of ab initio lipid free radical)
L1H L1 (1)
Propagation
Free radical chain reaction established
L1 + O2 L1OO (2)
L1OO + L2H L1OOH + L2 (3)
L2OO + L3H L2OOH + L3 etc. LnOOH (4)
Free radical chain branching (initiation of new chains)
LnOOH LnO + OH
– (reducing metals) (5)
LnOOH LnOO + H+ (oxidizing metals) (6)
LnOOH LnO + OH (heat and uv) (7)
LnO
LnOH (8a)
LnOO + L4H LnOOH + L4 (8b)
HO HOH (8c)
L1OO + LnOOH L1OOH + LnOO (9)
L1O + LnOOH L1OH + LnOO (10)
Termination (formation of non-radical products)
Ln Ln
(11a)
LnO + LnO
polymers, non-radical monomer products (11b) (ketones, ethers, alkanes, aldehydes, etc.)
LnOO LnOO (11c)
LOO (12a)
LO (12b)
i - initiation; o-oxygenation; -O2 scission; p-propagation; d-dissociation; t-termination; ts-termination/scission
non-radical products (aldehydes, ketones, alcohols, alkanes, etc.)
kp1
Radical recombinations
ki
kp1
kd1
kd2
kd3
kp2
kp1
kp3
kt1
kt2
kt3
kts1
kts2
ko
k
kp4
kp5
Radical scissions
CLASSICAL FREE RADICAL CHAIN REACTION MECHANISM OF LIPID OXIDATION

8
bind and inactivate completely by chelators (Love, 1895; Schaich, 1992).
Polyunsaturated lipids oxidize more rapidly than monounsaturated (Uri,1961);
saturated lipids are stable to autoxidation but can degrade at high temperatures (Nawar,
1986). Increasing the number of double bonds increases rates of lipid oxidation; ease of
formation of fatty acid radicals increases with increasing unsaturation (Uri, 1961);
(Frankel, 1985; Schaich, 2012) because the hydrogens on the methylene groups between
two double bonds have much lower bond energies than at other positions on the acyl
chain, and hence are more easily abstracted (Schaich, 2006).
All current analyses follow the three oxidation stages just described. Lipid
radicals [L or LO(O)
] formed in any stage are short-lived to detect directly, even by
electron paramagnetic resonance, although they can be trapped with spin traps (Schaich,
1980). The first detectable stable products are conjugated dienes formed when radical
and hydroperoxide formation at external positions of 1,4 dienes structures, e.g. in linoleic
and linolenic acids, forces a migration of the neighboring double bond:
-CH=CH-CH-CH=CH- -CH-CH-CH-CH-CH- R-CH=CH-CH=CH-CH-
Conjugated dienes are the only lipid chromophore with significant absorption in
the UV range, from 231-234 nm. Because of its ease and simplicity, this assay has been
used extensively to follow lipid oxidation. However, the extinction coefficient varies with
the solvent, conjugated dienes are not permanent but are generated even while the assay
is underway and also are lost as lipids degrade to secondary products, and phenolic
antioxidants in oils absorb in the same region and interfere with the analysis. Thus,
conjugated dienes are best used when following the same system over time. They can
only be considered general indicators of oxidation when spot-checking samples of

9
unknown history (e.g. pulling a sample off the shelf in a warehouse), and in most cases
should be combined with other product analyses to accurate interpret the extent of lipid
oxidation.
Termination products of lipid oxidation -- aldehydes, ketones, furans, alcohols,
epoxides, and others -- are responsible for well-known flavors and odors of oxidized
lipids. However, these products are difficult to detect because many of these products are
not stable, they are present at very low concentrations, they are present in complex
mixtures that are difficult to separate, and they are reactive so transform to other products
and complex with food molecules, particularly proteins. Most commonly, secondary
products are monitored as volatiles detected by gas chromatography (Frankel et al., 1977,
1979, 1984) or the Rancimat assay (Barrera-Arellano, 1992), but these approaches ignore
non-volatile degradation products. A few chemical reactions are available for detecting
aldehydes, e.g. the anisidine assay and formation of dinitrophenylhydrazones, but each
has significant short-comings so are not used as routine measures (although they should
be, in combination with conjugated dienes and other measures). It must also be noted that
following or assessing lipid oxidation only by secondary products misses all the early
reactions and can lead to incorrect interpretation of the extent of lipid oxidation.
Secondary products are formed too late in the reaction sequence to be used for
monitoring and control.
Last in this discussion but not in priority of oxidation products are the lipid
hydroperoxides (LOOH), the first stable product that forms in all fatty acids regardless of
degree of unsaturation. Hydroperoxides are the product most commonly monitored in the
food industry and are also among the most controversial due to problems and with assays

10
and inconsistency of results (Schaich, 2012). Because of the serious issues with LOOH
assays and the acute need for accurate improved LOOH assays in the food industry, this
thesis research focused on hydroperoxides assays.
2.2. Assays for Lipid Hydroperoxides
2.2.1. General Considerations
Oxidation analysis is not simple ‘since food lipids can contain many different
unsaturated fatty acids and can be exposed to several different prooxidants, hundreds of
decomposition products can be formed (McClements & Decker, 2008). The complexity
of pathways that consequently occur makes analysis very challenging.
Numerous analytical methods are available to measure lipid hydroperoxides, and
choosing the best method for a particular application can be difficult (Dobarganes &
Velasco, 2002). These methods can be separated into two groups based on endpoints:
quantitative and qualitative. Chemical analytical methods are quantitative and determine
the total amount of hydroperoxides, while chromatographic techniques are qualitative and
give information about the structures and types as well as amounts of specific
hydroperoxides present in test samples (Dobarganes & Velasco, 2002). Thus, the most
appropriate method must be determined for each application, depending on what
information is most needed. In most cases, qualitative assays that identify specific
products are used mostly for basic research, particularly when reaction mechanisms are in
question, whereas quantitative assays are used both in research and in practical
applications such as storage stability studies and monitoring degradation of products on-
line and after storage.

11
Each method has its positive and negative attributes, and these must be balanced
when deciding upon an assay to use. For example one method may be ‘simple to apply
but unreliable or expensive’, while another may be ‘highly sensitive, but difficult to
control’ (Hara & Totani, 1988 p.1948). The nature of the sample matrix, number of
samples to be analyzed, and quality parameters required also must be considered when
determining the method which most consistently determines lipid hydroperoxides in food
systems (Navas et al., 2004).
It is critical to keep in mind that every determination still only reflects oxidation
status at the particular time of sampling, without history. Thus, due care must be
exercised to avoid misinterpretation of results. For example, when primary lipid
oxidation products are the only products measured, especially later stages of oxidation
when formation rate becomes slower than decomposition rate, concentrations of these
products will naturally decrease without a decrease in oxidation (McClements & Decker,
2008). Assays of a single product at a single time in food samples without prior testing
or monitoring additional oxidation products to detect other pathways can lead to the
erroneous conclusion of low lipid oxidation.
Another issue that can lead to misleading or erroneous results is that with certain
conditions such as high temperature or high levels of reactive transition metals, primary
product concentrations may show minimal net increase because decomposition rate is so
high (McClements & Decker, 2008). Isolated biological samples often have peroxides
naturally and if stored in presence of oxygen, these can contribute to overall oxidation
products and can cause overestimation of sample composition (Fukuzawa et al., 2006).
Endogenous peroxides in a sample can be detected in the assay in the same way the

12
hydroperoxides that are formed, leading to higher PV. Endogenous hydroperoxides are a
particular problem in the presence of oxygen, where they serve as rapid initiators of new
oxidation chains.
2.2.2. Iodometric Titration of Hydroperoxides with Thiosulfate
Volumetric methods of hydroperoxide determination, such as titrations, have been
in use for more than 50 years (Pokorný, 2005). Titration methods are very simple, rapid,
and require only unsophisticated equipment. Many titrations have 1:1 stoichiometry and
are suitable for evaluation of large number samples (Dobarganes & Velasco, 2002).
Iodometric titration of hydroperoxides was developed and standardized, and
official methods were published by AOCS in 1997(Method Cd 8-53). Since very little has
actually changed in the methods, many references citing use of iodometric titration are
very old, and the method is still used extensively in the food and oils industries. The
discussions and points made in these articles are still very useful because many of the
limitations and issues raised in these articles are not known and are not referenced in the
official methods (Pokorný, 2005).
The reaction chemistry of the titration is very straightforward, developed from
observations that all peroxidic compounds react with iodide ions, and are reduced to
hydroxyl derivatives while at the same time, iodide ions are oxidized further to free
iodine (Pokorný, 2005).The hydroperoxide reduction proceeds as:
LOOH + 2 H+ + 2e
LOH + H2O
The electrons for this reduction are provided by the saturated KI which dissociates in
solution:

13
2KI 2 K+ + 2 I
2 I I2 + 2 e
This is an equilibrium reaction. When the electrons are removed, e.g. by reaction with
oxygen or with LOOH, the reaction is driven to the right. Otherwise, I is favored.
In the net reaction, reduction of one LOOH releases one I2 for reaction with thiosulfate.
LOOH + 2 H+ + 2 KI I2 + LOH + H2O + 2 K
+
(clear) (yellow)
In presence of excess iodide, a complex ion that reacts in same way as free iodine is
formed. The released iodine is then titrated, usually with standardized sodium thiosulfate,
which becomes oxidized into a tetrathionate (reduction of free iodine with thiosulfate).
I2 + 2 Na2S2O3 Na2S4O6 + 2 NaI
(yellow)
(colorless)
Starch is used as indicator; it forms a blue-purple complex with iodine molecules. When
all the iodine has been reacted, the solution loses its color, and the transition from purple
to clear marks the endpoint of the reaction (Skoog et al., 1998). The reaction should take
place in the dark or in diffused daylight to prevent decomposition of hydroperoxides
(Pokorný, 2005). If following the standard AOCS method, five grams of sample are
recommended for peroxide values below 10, and about 1 gram of sample for peroxide
values greater than 10 (Frankel, 1998) although certainly smaller quantities of lipids are
routinely analyzed.
Despite the simplicity of the reaction chemistry and actual method, there are a large
number of inherent disadvantages.
The titration is highly empirical, so in order to replicate results special care must
be taken to maintain exact conditions. Even small changes, such a new technician

14
or different grade of solvent, can cause variations in results. Consequently, it has
been recommended that this method be used mainly for evaluation of related
samples or determining evolution of hydroperoxides in the same samples over
time (Dobarganes & Velasco, 2002).
The chloroform used as solvent is organic and toxic, and replacement solvents
introduce still more complications.
This is one of the least sensitive methods (cannot detect PVs less than 0.5
meq/kg) because of difficulty in visually distinguishing the color change marking
the actual end point determination. The color fades gradually in many shades
rather than colored to clear instantaneously.
The reaction is highly sensitive to oxygen, so accurate and reproducible results
require scrupulous oxygen removal.
Due to the empirical nature of the methodology, validity of results cannot be
determined until the method used is also given (Gray, 1978).
Many papers have investigated various conditions that can affect the peroxide levels
determined by the titration. Both ‘hot’ and ‘cold’ methods have been developed. Lea’s
‘hot’ method involved heating the solvents and oil/fat to boiling point (Lea, 1946). The
‘cold’ method usually referred to as ‘Wheelers’ is completed at room temperature,
dissolving oil/fat in solvent without heat involved (Lea, 1946). In both the ‘hot’ and
‘cold’ methods (including modifications suggest by other authors) various factors such as
method and length of deaeration, solvent composition, order of mixing reactants, effect
of water, sample concentrations, and reaction time were all investigated (Lea, 1946,
1952; Stuffins & Weatherall, 1945).

15
Interestingly, while conducting these early studies, Lea observed that that many
scientists, when comparing effects of factors assumed that the highest reproducible value
was the correct one, and this was an incorrect assumption (Lea, 1946). At the time,
prevailing thought was that peroxide values were too low because of “incomplete
reaction of more stable peroxides with the reagent, possible decomposition of very labile
peroxides by side reactions, and loss of part of liberated iodine owing to re-absorption of
fat” (Lea, 1946, p.290). While these are all valid problems to consider, Lea’s assessment
was still accurate. Even so, as Lea pointed out, studies assuming the highest value is
correct could provide some valuable information, as long as absolute peroxide value was
not needed. One recommended application was simple comparative studies that follow
the oxidation of sample during different storage conditions (Lea, 1946).
In 1960, Mehlenbacher determined that there are two principle sources of error in
iodometric titration; both have been widely observed and are considered to be true
(Mehlenbacher, 1960). First, he identified of potassium iodide to molecular iodine by
oxygen present in titrating and titrated solutions as the source of “oxygen error” that leads
to high results in peroxide determinations. The second source of error is adsorption or
addition of iodine to unsaturated bonds of fatty acids, which decreases PVs as proposed
even by early scientists. Careful controls are necessary to avoid both kinds of error.
Issues with oxygen have been recognized since the earliest use of this method.
Numerous articles have documented that when a titration is completed without
deoxygenation, peroxide values are higher. However, there is no simple solution to the
problem. To exclude oxygen from the reaction, Lea (1931) filled the sample tube with
nitrogen at beginning of the test and assumed that evolution of chloroform would prevent

16
reentry of oxygen into the tube. Wheeler (1932) reformulated the reaction in homogenous
solution to eliminate the need for shaking, thus minimizing oxygen effects. The ‘hot’ and
‘cold’ methods discussed above were both adapted to include inert gas bubbled through
reaction mixtures throughout the reaction; flooding only the headspace with inert gas or
not degassing at all gave much higher peroxide values (Stuffins & Weatherall, 1945). In
1954, rather than using inert gas, Sully mixed reactants in boiling acetic acid-chloroform
solution to reduce dissolved oxygen (Sully, 1954). He observed that the iodine liberated
was related, not to partial pressure of oxygen during reaction, but to the quantity of
peroxide decomposed. He claimed that when iodide and peroxides react, radicals are
formed, and even with short lifetimes these radicals react with gaseous oxygen and
produce more peroxides (Sully, 1954). Until that time, it was believed that subtracting a
blank could take care of the oxygen error. However, Sully asserted that the “effect of
radical reactions cannot be estimated by blank determination” (Sully, 1954, p.86).
Radical production in his system probably was due to thermal decomposition rather than
iodide reaction, and these indeed cannot be covered by blanks which contain no lipid, but
his observations are still quite interesting. Despite Sully’s findings, standard official
methods still include in their directions a blank subtraction step. This controversy
illustrates why the method remains somewhat controversial and why results from
different labs can be quite different. In fact, both blanks and argon sparging are required,
but for different reasons. The blank accounts for reactive species in the solvents and
reagents, while the argon eliminates oxygen that increases conversion of KI to I2.
Oxygen error also brings up another important factor for iodometric titration,
which is reaction time. Longer reaction time increases diffusion of oxygen into solutions

17
and emphasizes slow reactions at the expense of fast ones. Early methods of reaction at
room temperature, e.g. Lea’s cold method, had a reaction time of one hour in the dark
(Lea, 1946; Stuffins & Weatherall, 1945). “Hot” iodometry always required less reaction
time. Lea’s ‘hot’ method had flask immersion in boiling water bath for only about 30
seconds and then transferred to 77 degree C bath for about 2 minutes, cooled, water
added and then titrated (Lea, 1946). It was later determined that the LOOH-KI reaction is
fast enough that when LOOH concentration is low, reaction time is not critical and PV
does not change drastically with increasing reaction times (Dobarganes & Velasco,
2002).
Most methods today recommend only 1-2 minute reaction time. The AOCS
(Method Cd 8 -53) standard procedure recommends 1 minute reaction time and specifies
under diffuse daylight and room temperature (no inert gas) (Dobarganes & Velasco,
2002). However, three separate studies all concluded that one minute reaction time was
not enough for complete reaction between lipid peroxides and iodide (or iodine)
(Lezerovich,1985; Tian & Dasgupta, 1999). As cited by Pokorný (Pokorný, 2005),
Yanishlieva and Popov in 1972 (Yanishlieva & Popov, 1972) found 5 minutes at room
temperature was optimum for oxidized oils, while 1 minute reactions were sufficient for
fresh fats and oils. IUPAC method agrees with this five minute reaction time at room
temperature under diffuse daylight; like AOCS, IUPAC omits sparging with inert gas
(IUPAC Method 2.501). The Japan Oil Chemists’ Society official method (Std Method 2
4 12-71) also has a five minute reaction, but in contrast to AOCS and IUPAC, takes steps
to avoid iodide autooxidation.

18
Perhaps because of radical complications from thermal decomposition of
hydroperoxides, “hot” iodometry also appears to have fallen out of favor as a method. No
current standard methods suggest heating solvents. Although an early study in 1945
found results between “hot” and “cold” method were similar, specifically when both
bubbled with inert gas and saturated KI solution was used instead of solid KI, final
recommendation were to use the “cold” or room temperature method (Stuffins, 1945).
Several decades later, a study also showed that peroxide values of different oils were
similar to the “cold” Wheeler and “hot” Sully method (though “hot” PV tended to be
slightly lower), but further testing carried out by the group showed that ‘hot’ methods
resulted in almost complete disruption of lipid hydroperoxides (Barthel & Grosch, 1974).
At ambient temperatures, the LOOH-KI reaction is faster than LOOH breakdown to LO
+ OH. Although LOOH-KI reactions accelerated at higher temperatures, the
corresponding acceleration of hydroperoxide decomposition was even greater (Barthel &
Grosch, 1974). Similarly, comparisons of a new hot method with Lea’s hot and Stuffins
‘cold’ showed similar values, but “hot” values were slightly lower (Sully, 1954). In
contrast, Amar et al showed the hot “Sully” Method PVs were significantly higher than
“cold” Wheelers for Linseed Oil and Cotton seed oil (Amer et al., 1961).
Returning to the second error source cited by Mehlenbacher (1960), adsorption or
addition of iodine to unsaturated bonds of fatty acids, in effort to perfect an assay based
on oxidation of iron II to iron III (these type assays will be discussed later on), Tian and
Dasgupta discovered another issue in iodometric methods that cannot be solved by
increasing reaction time to allow from complete reaction or by subtraction of blanks. This
issue was that all oils and fats of food origin contain some unsaturated sites that consume

19
iodine liberated by LOOH-KI reaction, leading to underestimation of actual peroxide
content (Tian & Dasgupta, 1999).
Solvents have been another issue in iodometric titrations of lipid hydroperoxides,
from several standpoints. One source of contention has been the ratio of chloroform to
acetic acid. Stuffins and Weatherall study showed the when ratio of chloroform was
greater than acetic acid then lower values are obtained (Stuffins & Weatherall, 1945).
Acetic acid is needed to support ionization of KI, but Sully stated that present work
showed that if insufficient chloroform is added to depress ionization of the acetic acid,
potassium iodide precipitates and there is incomplete reaction (Sully, 1954). Another
issue is that there must be sufficient H+ ions for complete reaction and acetic acid does
not always provide this.
There have been attempts to replace toxic chloroform with acetone, ethyl alcohol,
and isopropanol, but these solvents each react with iodine in the presence of water and
acid so are unsuitable for this assay (Osawa et al., 2007). AOCS has approved an
alternative official method using iso-octane as the lipid solvent (AOCS Cd 8b-90).
However, poor miscibility with polar solvents creates new problems for the assay. For
example, one study found that a 15-30 second delay in neutralizing the starch indicator at
high PVs (>70 meq/kg) was caused by isooctane floating on the surface of the aqueous
medium –extra time was required to adequately mix solvents when large volumes of
titrant were added (Brooks & Berner,1990). Failure to note this condition can cause
over-titration. As a result, the iso-octane official method recommends that it not be used
for high peroxide analyses. Another problem is that while isoctane is less toxic, it can

20
create a fine emulsion that makes detecting the endpoint difficult and the assay overall
less accurate (Kamal-Eldin & Pokorny, 2005).
The difficulty in visually determining the color endpoint is a perpetual problem
that lowers the sensitivity of the assay and has spurred scientists to find alternative
approaches. The most common is substitution of electrochemical or potentiometric
determination of the endpoint while performing the titration in an electrochemical cell.
The liberated iodine is reduced at a platinum electrode maintained at constant potential;
the resulting current can be quantified by electronic integration, detecting with good
precision peroxide values as low as 0.06 (Fiedler, 1974). It is essential that all solutions
are dearated to prevent formation of peroxides when using this method (Shahidi &
Wanasundara, 2002). Radicals can form from reaction of peroxide with iodide, which can
react with oxygen and produce more peroxides (Sully, 1954).
In another approach, replacing the visual endpoint with potentiometric
determination in the standard AOCS titration detected as low as 40 neq hydroperoxide
(Hara & Totani, 1988). Two important changes helped achieve high accuracy (very small
coefficient of variation). First, less than 1 mol of saturated potassium iodide was added
when PVs were less than 100 meq/kg. At these peroxide levels, the free iodine formed by
oxidation in the saturated potassium iodide solution increased COV, and decreasing the
amount of iodide added limited the interference. Secondly, the reaction should be cooled
(run on ice) and kept at a constant temperature because “solubility of potassium iodide in
water is influenced by the atmospheric temperature”, and at higher temperatures,
potassium iodide can more easily react with oxygen to produce free iodine and lipids also
undergo oxidation more easily (Hara & Totani, 1988, p.1950; Schaich, 2005).

21
Another approach to increase sensitivity has been to abandon the thiosulfate
titration altogether and convert the iodine detection to an optical assay. One really old
method by Baldwin et al. (1944), cited by Hicks & Gebicki (Hicks & Gebicki, 1979),
measured the iodine-starch complex at 560 nm. However, the method was not very
adaptable because it was complicated and extinction varied with starch source.
A second optical method measured absorbance of the tri-iodide ion formed in the
reaction:
LOOH + 2 H+ + 2 KI I2 + LOH + H2O + 2 K
+
I2 + I
↔ I3
In presence of excess I, the formation of I3
will by favored and it can be quantified by
its absorbance at 360 nm (Gebicki & Guille, 1989). As with so many other assays, this
one is also very sensitive to traces of oxygen due to oxidation of excesses iodide.
Because of this sensitivity, reaction mixtures must be protected from light, solutions must
be rigorously dearated before use, and during reaction there must be constant purging
with inert gas to exclude atmospheric oxygen. Though some methods simply dearate by
flushing with a gas (Takagi et al., 1977) , other procedures set up more elaborate gas flow
systems with stoppered or sealed cuvettes (Gebicki & Guille, 1989; Hicks & Gebicki,
1979; Swoboda & Lea, 1958; Nouros, 1999). The procedures with the gas flow systems
purge trace amounts of oxygen more fully so give better results. However, the added
difficulty of this additional set-up may has prevented wide use of these colorimetric
methods.
There are several methods with slight variations based on this chemistry (Gebicki
& Guille, 1989; Hicks & Gebicki, 1979; Takagi et al., 1977). One used stoppered

22
spectrophotometric cuvettes with nitrogen flowing through to remove the oxygen (Hicks
& Gebicki, 1979). The solvent and saturated KI are added to the cuvette (bubbled with
nitrogen), absorbance recorded at 290 or 360 nm to ensure it did not increase by more
than 0.005 units. Then the lipid sample was injected through a capillary, mixed with
reagents, and absorbance was recorded until the change was linear with time (Hicks &
Gebicki, 1979). Although this method was highly reproducible, had 1:1 stoichiometry,
and was very sensitive (1 neq of lipid hydroperoxide), not all labs have the gas flow
apparatus necessary.
A variation of this method is to add cadmium to complex with remaining I
to
prevent further oxidation by oxygen (Gebicki & Guille, 1989; Swoboda & Lea, 1958;
Takagi et al., 1977). Addition of cadmium plus purging solutions with CO2 and reacting
in the dark has also been tested (Takagi et al., 1977). The I3
was measured at 358 or 410
nm, and peroxide values were calculated based on absorbance in a calibration curve.
Another variation to improve sensitivity was to inject the reaction into an HPLC for
detection instead of reading I3
on a spectrophotometer (Gebicki & Guille, 1989).
Cadmium salts are extremely toxic (Kamal-Eldin & Pokorny, 2005), and perhaps because
of this, these methods are not commonly utilized.
There is one last method based on measurement of triiodide ion. To eliminate
oxygen interference, the assay was completed in solutions with low acid added, reduced
iodide concentration, and Fe2+
as a catalyst (Løvaas, 1992). The acid was needed to
supply protons for the reaction, but it also increased iodide oxidation and lipid
peroxidation at the same time (Løvaas, 1992). Using less acid prevented autoxidation of
lipids and decreased background oxidation of iodide. Fe2+
was added to accelerate I3

23
formation from lipid hydroperoxide, assuming “that iron is kept at its reduced state by
excess of iodine and that lipid peroxidation by Fe3+ thus was prevented” (Løvaas, 1992,
p.780):
ROOH + Fe2+
RO + OH
+ Fe
3+
2RO + 2H+ + 3I
2ROH + I3
2Fe3+
+ 3I 2Fe
2+ + I3
ROOH + 2H+ + 3I
ROH + H2O + I3
This approach basically assumes that the iodide added incompletely reduces lipid
hydroperoxides, so the reducing power of ferrous iron is needed to complete the reaction.
Fe2+
did indeed induce a 30-80 fold increase in specific rate of I3
formation (Løvaas,
1992), but in preliminary evaluations, we found that the mix of aqueous and lipid phases
caused serious solubility problems, the iron reactions did not run as proposed, and the
reaction was very inefficient and poorly reproducible
2.2.3. Ferric Thiocyanate Assay for Lipid Hydroperoxides
The ferric thiocyanate (FeSCN) method also uses Fe2+
reduction of
hydroperoxides in acidic media, but in this case the resulting Fe3+
ions are complexed by
thiocyanate to form a red-violet complex that absorbs strongly between 500-510 nm. This
method has greater sensitivity than iodometric titration, requires smaller samples (0.1g)
(Frankel, 1998), and gives uncorrected peroxide values that are higher by a factor of 1.5
to 2 (Dobarganes & Velasco, 2002; Frankel, 1998). The latter occurs because the
stoichiometry is actually 2:1 (LOOH and LO both oxidize Fe
2+) and the second
oxidation by LO is seldom accounted for in calculations.

24
The FeSCN assay is an old method. While measuring hydrogen peroxide and
succinyl peroxide, Young et al. were the first to see the potential of estimating peroxides
based on the color that was produced by ferric thiocyanate complex (Young et. al, 1936).
This finding sparked interest in the reaction as a way to quantify peroxide values and
several methods were developed, differing in solvent choice, oxygen exclusion, reaction
timing, and detection method (Kolthoff & Medalia, 1951; Lea, 1952).
Since then, the literature on the accuracy of this assay has remained very divided.
An important aspect of the assay is the reaction stoichiometry, or the moles of Fe2+
oxidized by each mole of hydroperoxide. The reaction mechanism indicates that one lipid
hydroperoxide should generate two ferric iron complexes:
LOOH + Fe2+
LO + OH
+ Fe
3+
LO + Fe
2+ + H
+ LOH + Fe
3+
However, stoichiometry reported in the literature has been quite variable. Inclusion or
exclusion of oxygen further complicates the assay’s accuracy.
Very early it was observed that peroxide values obtained by FeSCN were
considerably higher than with iodometric titration in three studies assessing rancidity in
edible fats, each with slightly different variations (for variations see Table 1) of the
FeSCN method (Chapman & McFarlane, 1943; Hills & Thiel, 1945; Lips et al., 1943).
Initially, it was assumed that the FeSCN results were correct and differences were
attributed to problems with the iodometric method (e.g., heating of solvent in the “hot”
iodometric method destroyed peroxides, resulting in low values). However, at the time
both the ferric thiocyanate and iodometric methods were still developing and many

25
variations were in use. The outcome of validation of the ferric thiocyanate method
changed depending on which variant it was compared to.
A competing school of thought was that the iodometric method provided accurate
values, and higher values in the FeSCN assay were due to the presence of oxygen that
increased autoxidation of Fe2+
(Kolthoff & Medalia, 1951; Lea 1945,1946). Wagner also
found lower peroxide values in the absence of oxygen but concluded that in presence of
molecular oxygen, reduction of LO was faster than LOOH decomposition, leading to
stoichiometric generation of ferric thiocyanate; the opposite was true in absence of
molecular oxygen, resulting in lower formation of ferric thiocyianate) (Wagner et al.,
1947). He concluded this after results showed comparable peroxide content detected
when oxygen was carefully excluded using similar apparatus as Lea (Lea, 1945) and
when air was passed for ten minutes through sample and reagent before mixing (Wagner
et al., 1947). Additionally, if air was passed through a mixture of oxygen-free sample
and reagent after reaction was allowed to take place, no additional color developed;
which Wagner et al. stated was because peroxides were being decomposed rather than
reduced (Wagner et al., 1947). Lea’s results in 1952 agreed that there was no need to
exclude oxygen since it complicated a simple method and results were always much
lower than expected for oxidized fats (Lea, 1945) and oxidized pure esters (Lea, 1952).
Kolthoff et al. reported that, in the absence of oxygen, the ratio of Fe3+
formed to
peroxides reacted was less than expected, and he attributed this to competitive peroxide
decomposition by factors other than Fe2+
so that the iron did not get oxidized (Kolthoff &
Medalia, 1951). In contrast, addition of oxygen (when present) to alkyl radicals generated
by downstream reactions of LO (from decomposition of LOOH) forms peroxide free

26
radicals which further oxidize ferrous iron, causing “high analytical results” (Kolthoff &
Medalia, 1951). Kolthoff went on to assert that the accuracy of all the procedures was
questionable since there was very little difference in the protocols of the studies, whether
results reported were correct, high, or low (Kolthoff & Medalia, 1951).
Table 1. Comparison of several methods by author.
Author Solvent Applications Comments
Young et al. 1936 methanol hydrogen peroxide
succinyl peroxide
One of first to estimate
peroxides based on
reaction with ferrous
thiocyanate
Bolland et al 1941 benzene: methanol
7:3
autoxidized rubber;
succinyl peroxide,
cyclohexane peroxide,
dihydroxyheptyl
peroxide
Application of Young et
al 1936 method with
change in solvent
Chapman &
MacFarlane 1943
96% acetone edible fats
Wagner et al. 1947 methanol organic peroxides
hydrogen peroxide
Based directly on Young
1936 procedure
Solvents, as well as oxygen, can participate in radical reactions (Kolthoff &
Medalia, 1951), leading to discrepancies in stoichiometry. Several solvents have been
used in the FeSCN method. Older methods used 96% acetone and benzene-methanol
(7:3) (Lips et al., 1943; Stine et al., 1954). Newer methods tend to use
chloroform:methanol or (dichloromethane:methanol) (IDF 74A:1991; Mihaljevic et al.,
1996; Richards & Feng, 2000). The problem is that the alkoxyl radicals formed in
hydroperoxide decomposition can abstract hydrogens from solvents, forming solvent
radicals. As with lipid radicals, radicals derived from organic solvents add oxygen to for
peroxyl radicals, which in turn abstract hydrogens to form hydroperoxides. Solvent
27
radicals have different sensitivity to oxidative attack and different ability to propagate
separate reactions (Kolthoff & Medalia, 1951), a behavior that depends at least in part on
redox potential of the solvent radicals. This means solvent radicals can have significant
effect on the overall reaction, most often increasing the stoichiometry to greater than
expected stoichiometry, i.e. high results. Acetone was originally used because it was
thought to suppress the induced decomposition of peroxides (Kolthoff & Medalia, 1951).
However, acetone does not dissolve all oils. Removal of oxygen can be obtained by
boiling aqueous phases for a short amount of time (Kolthoff & Medalia, 1951), or by
sparging solvents with argon and maintaining inert gas in headspaces.
These problems with solvent radicals were known previously but ignored, and
stoichiometry of the FeSCN assay was assumed to always be the predicted 2:1 ratio until
a recent study raised the issue again. Using chloroform and methanol as solvents,
Mihaljevic showed that solvent radicals cause additional reactions that change the yield
of Fe3+
(Mihaljevic et al., 1996). When attacked by alkoxyl radicals, chloroform produces
trichloromethyl radicals (Cl3C) which are strongly oxidizing and can continue to oxidize
ferrous ions directly and after oxidation:
LO + CHCl3 LOH +
CCl3
Fe2+
+ CCl3 + H
+ CHCl3 + Fe
3+
CCl3 + O2
OOCCl3
OOCCl3 + Fe
2+ Fe
3+ +
OOCCl3
In contrast, alkoxyl radical attack on methanol produces hydroxyl-methyl radicals which
are strong reducing agents and recycle Fe3+
to Fe2+
.

28
LO + CH3OH LOH + CH2OH
CH2OH + Fe
3+ HCHO + Fe
2+ + H
+
These are all competing reactions, so the resulting amount of Fe3+
generated in the
reaction will be determined by nature of the solvent, levels and type of hydroperoxide,
oxygen availability, and pH. In other words, the stoichiometry will depend on the
analytical solution composition (Mihaljevic et al., 1996).
One additional comment about solvents needs to be made. Observations that at
times bottles of chloroform caused high absorbance readings, and this prevented accurate
quantitation of lipid hydroperoxides initiated an interesting on effects of chloroform
stabilizers, amylene vs ethanol (Richards & Feng, 2000). Chloroform was originally
chosen because it had been already verified as an appropriate solvent (Shantha & Decker,
1994). Chloroform stabilized with amylene caused not only very high blank readings, but
also non-linear calibration curves with cumene hydroperoxide. Amylene did not prevent
formation of trichlorometyl radicals in chloroform, and amylene did not prevent
trichlromethyl radicals from reacting with ferrous ion. In contrast, ethanol as preservative
either prevented trichloromethyl radicals from forming or stopped trichloromethyl
radicals from reacting with the Fe3+
ions (Richards & Feng, 2000). Dichloromethane had
less of sensitivity to amylene and gave lower blank readings (Richards & Feng, 2000).
Returning to issues of stoichiometry, peroxide values reported in the literature
have confirmed inconsistencies in stoichiometry in this assay, and these create problems
for absolute quantitation of hydroperoxides in this assay. Using the method of Stine et al
with benzene-methanol as solvent (Stine et al., 1954), Barthel and Grosch saw a
difference in stoichiometry of hydrogen peroxide and methyl linoleate hydroperoxide

29
(Barthel & Grosch, 1974). Hydrogen peroxide oxidized two equivalents of Fe2+
, while
methyl linoleate hydroperoxide oxidized four equivalents of Fe2+
. The more extensive
reaction with methyl linoleate was attributed to “secondary reactions of the methyl
linoleate hydroperoxide acyl residue” (Barthel & Grosch, 1974, p. 540). Stoichiometric
equivalents calculated for t-butyl hydroperoxide (2.5), cumene hydroperoxide (3), and
MOPO/MLPO (~4) showed clearly that extent of reaction varied with the nature of the R
group in the hydroperoxide. Barthel et al theorized that aromatic systems or double bonds
increase Fe3+
production (Barthel & Grosch, 1974), although these explanations seem
unlikely chemically.
In recent studies, Mihaljevic et al separated reactivity into three hydroperoxide
classes based on the number of ferrous ions oxidized per molecule of ROOH: Hydrogen
peroxide 2, small tertiary organic hydroperoxides (t-BuOOH and CuOOH) about 3, and
fatty acid hydroperoxides about 4. Within the fatty acids, hydroperoxide structure --
primary vs secondary, positional of the -OOH, methyl esters or free acids – did not make
a difference (Mihaljevic et al., 1996). Analyzing this hierarchy, redox potentials
of the hydroperoxides and radicals increase in the same order. Thus, the most plausible
explanation is that the stoichiometry of the FeSCN-LOOH assay increases with the redox
potential of the hydroperoxide, i.e. the stronger the oxidant RO, the greater the driving
force for side reactions with that generate Fe3+
independently of LOOH.
These are critical observations for use of this assay with oxidized lipids where
hydroperoxides are present on many different positions on different fatty acids. However,
even more important for accurate quantitation of lipid oxidation was the observation that
because of these stoichiometry differences, using tertiary hydroperoxides (t-butyl and

30
cumene) for calibration, as is customarily done, could lead to overestimation of LOOH
(Mihaljevic et al., 1996).
A version of the ferric thiocyanate method was standardized by the International
Dairy Federation. Now known as IDF (74A:1991), this variation was applied mainly to
dairy products which normally have low peroxide values so need high sensitivity for
detection (Frankel, 1998). Shantha and Decker then adapted the IDF method to non-dairy
products such as chicken fat, cooked beef fat, fish oil, butter, and vegetable oil (Shantha
& Decker, 1994). The IDF/ Shantha & Decker adaptation is the version most commonly
used currently. Both methods retain the in situ generation of FeCl2 from a displacement
reaction with BaCl2,
BaCl2 + FeSO4 BaSO4(ppt) + FeCl2
and construct standard curves using iron powder. Both these methods divide by results by
a factor of two to express peroxide value in milliequivalents of peroxide instead of
milliequivalents of atomic oxygen (O, not O2) (Shantha & Decker, 1994).
There are a few other interferences that compromise the ferric thiocyanate
method. In general, radical-quenching antioxidants have little effect on this assay, but
strong metal chelators such as EDTA (0.02%) significantly decrease PV due to
competition for the iron (Nielsen et al., 2003; Mihaljevic et al., 1996 ). Pigments, on the
other hand, can be strong interferences if they absorb in the same wavelength region used
to determine PV (Dobarganes & Velasco, 2002). To avoid this problem, Hornero et al
modified the Shantha and Decker method by using diethyl ether to extract the pigments
after oxidation reaction has completed, so that it could be applied to high carotenoid
content (Hornero-Méndez et al., 2001).

31
2.2.4. Xylenol Orange Background
Originally developed to detect very low levels of lipid hydroperoxides in living
tissues, the xylenol orange assay became widely used after initial testing showed it was
simple with high sensitivity, and was not sensitive to dioxygen (Wolff, 1994). Ferrous ion
oxidation occurs in presence of ferric ion indicator xylenol orange for measurement of
hyroperoxides (Wolff, 1994). This assay is based on the oxidation of ferrous ions in an
acidic medium containing xylenol orange dye. Binding of the resulting ferric ions by the
dye produces a blue-purple complex with absorbance maximum between 550-600 nm
(Dobarganes & Velasco, 2002; Grau et al., 2000). In simplest terms the mechanism can
be shown as follows (Grau et al., 2000):
ROOH + Fe2+
Fe3+
Fe3+
+ XO (Fe3+
…XO) complex
Gupta, in 1973, published one of the first papers that examined in detail the use of Fe-XO
complex to determine concentrations of H2O2 (Gupta, 1973). Previous papers had
documented binding of Fe3+
by xylenol orange; Gupta now investigated absorbance
characteristics of the complex and ways to adapt the reaction as an assay for H2O2.
Simon Wolff and collaborators extended applications of the xylenol orange assay to
organic hydroperoxides, including cumene, tert-butyl, and lipid hydroperoxides (Jiang et
al., 1990; Jiang et al., 1992), and probably contributed the most in formalizing this assay
for trace levels of lipid hydroperoxides. Two procedures for the Fe3+
- xylenol orange (or
FOX) assay were proposed. FOX1 is water-soluble version containing sorbitol as a
reaction enhancer (Wolff, 1994). A second version was developed for samples in which
high backgrounds of nonperoxidized lipids could interfere with measurement of low

32
levels of lipid hydroperoxides (Wolff, 1994). This version, FOX2, omitted sorbitol and
added butylated hydroxytoluene (BHT) and methanol (Wolff, 1994).
As FOX1 and FOX2 procedures were applied to various systems, it became
generally recognized that the stoichiometry was not constant and conditions of the
original version of assay must be modified to fit individual sample types. If certain
conditions of the assay are not adjusted, the hydroperoxide concentrations measured will
not be accurate. One major problem discovered was that the recommended protocol for
FOX (Wolff, 1994) was that it was only valid for the assay of H2O2, but not for other
peroxides because not all hydroperoxides have the same molar absorption coefficients
and reactivity of secondary alkoxyl and H abstraction radicals differ (Gay et al., 1999a,
1999b; Gay & Gebicki, 2000). A number of early papers recommended that a general
extinction coefficient of 43,000 M-1
cm-1
could be used to quantitate hydroperoxides in
this assay (Gay et al., 1999b). However, a survey of the literature and specific
experimentation with different hydroperoxides showed clearly that this assumption is
incorrect, that extinction coefficients vary with the reaction system and hydroperoxide,
and that the FOX assay can be used if only relative hydroperoxide concentrations are
needed, but not to obtain absolute concentrations of hydroperoxides (Gay et al., 1999a,
1999b; Gay & Gebicki, 2003).
Molar extinction coefficients and stoichiometry of the FOX reaction remain
highly controversial. Molar extinction coefficients reflect the stoichiometry of the
reaction, and variations in values indicate that the reaction is not running identically
under all conditions or with all hydroperoxides (Fukuzawa et al., 2006). One paper
claimed that 3 mole of Fe3+
were formed per mole of hydroperoxide, based on average

33
apparent extinction coefficient of 4.52 X 10 ^4 M-1
cm-1
(Jiang et al., 1992). This same
paper found t-butyl and cumene hydroperoxides slightly less reactive than hydrogen
peroxide, and linoleic hydroperoxide slightly more (Jiang et al., 1992). On the other
hand, dicumyl peroxide, benzoyl peroxide, and lauroyl endoperoxides showed very little
reactivity in this assay in comparison to hydrogen peroxide (Jiang et al., 1992). Yildiz
(Yildiz et al., 2003) disagreed with these results. When comparing FOX assay with the
AOCS PV method (Iodometric titration with thiosulfate), he found that if results were
calculated in the manner suggested by Jiang et al. (Jiang et al., 1992) peroxide values
were consistently overestimated (Yildiz et al., 2003). In order for results to compare with
AOCS PV method where stoichiometry is unequivocal, Yildiz argued that two Fe3+
ions
reacted with XO instead of one, and that 3 moles of ferric-XO complex were formed for
every 2 moles of hydroperoxide (Yildiz et al., 2003). Seeking to clarify the issue, Gay
and Gebicki examined the effect of solvent and hydroperoxide structure(Gay et al.,
1999a, 1999b) as well as sorbitol (Gay, 2000) see below) on XO reaction stoichiometry.
In their systems, Fe3+
ions generated per –OOH group were 2.5 for H2O2, 5 for cumene
and tert-butyl hydroperoxides and, 2 for other hydroperoxides (Gay et al., 1999b; Yildiz
et al., 2003). There was no obvious mechanism for production of five Fe3+
for t-butyl and
cumene, but authors proposed that the cumene alkoxyl radical formed a methyl radical by
-elimination. Oxygen adds to this CH3 to form a peroxyl radical capable of oxidizing
Fe2+
directly or via radicals initiated in other molecules by H abstractions (Gay et al.,
1999b).
Another issue with this assay is its strong dependence on pH and source of
acidity. The requirement of a low pH for this assay ensures the stability of iron ions in

34
reduced and oxidized forms. First suggested by Wolff (Wolff, 1994), 25 µM H2SO4 is
commonly used in the FOX assay in order to maintain the pH consistently below pH 2.
Reliable results can only be obtained with pH values below 2; maximum reaction occurs
near pH 1.8. However, with H2SO4 the pH optimum of the assay is very narrow (pH 1.7-
1.9) (Fukuzawa et al., 2006). This pH values is very difficult to maintain in the presence
of compounds containing dissociable protons (Gay & Gebicki, 2002).
This problem has led investigators to evaluate other acids for replacing H2SO4.
hydrochloric acid instead of sulfuric acid (Burat & Bozkurt, 1996; Shantha & Decker,
1994). Grau et al. found that HCl exerted the same stabilization as H2SO4 but found
lower sensitivity so recommended no change in acids (Grau et al., 2000). A study
determining LHP in snacks fried in sunflower oil agreed; sulfuric acid gave greater
reaction sensitivity than hydrochloric acid, as well as better precision (Navas et al.,
2004). In contrast, perchloric acid lowered the assay optimum pH to 1.1 (not so difficult
to control), decreased dependence of ferric-xylenol orange complexes on acid
concentration, decreased interference from added compounds, and increased molar
absorption coefficients were higher for all hydroperoxides tested (hydrogen peroxide,
cumene, t-butyl, lipid, protein) (Gay & Gebicki, 2002). A new protocol designated PCA-
FOX was developed based on the observed 110 mM perchloric acid optimum (Gay &
Gebicki, 2002).
The addition of sorbital to the assay has also been contested. Sorbitol, which acts
as a radical chain carrier, was initially added to FOX-1 to increase assay response and
sensitivity (Wolff, 1994; Gay et al., 1999b). Addition of 100 mM sorbitol increased the
extinction coefficient for the H2O2 reaction from 4.46 x 10⁴ to 2.24 x 10
5 M-1cm-1
35
(Wolff, 1994). Order of magnitude enhancement of H2O2 reactions by sorbitol was
confirmed in later studies, sorbitol, but the amount of Fe3+
produced by organic
hydroperoxides such as cumene, tert-butyl, and protein was only doubled (Gay &
Gebicki, 2000). This difference was attributed to ability of the strongly oxidizing HO
from H2O2 to abstract hydrogens from every carbon on sorbitol, thus creating at least six
new radical sites for reaction with oxygen and/or Fe2+
. In contrast, alkoxyl radicals
formed from organic hydroperoxides can abstract H only from terminal carbons of
sorbitol:
RO + RCH2OH ROH + RC
HOH
In the end, the authors recommended against the use of sorbitol unless assaying H2O2 to
avoid uncontrolled and unpredictable enhancement (Gay & Gebicki, 2000).
The FOX-2 assay contains BHT to prevent continued oxidation of lipids during
handling and assay (Wolff, 1994). There is some disparity in the literature regarding
effectiveness of BHT. Jiang et al. included it without notable problems in the procedures
of at three studies (Jiang et al, 1990, 1991, 1992). However, in assays of phosphatidyl
choline hydroperoxides (PC-OOH) in egg yolk, BHT decreased stoichiometry from 3.5 to
2.4 Fe3+
generated per PC-OOH (Fukuzawa et al., 2006; Grau et al., 2000). This decrease
was considered tolerable and perhaps even desirable since the antioxidant was thought to
inhibit generation of new radical chains that would, in turn, increase stoichiometry during
the reaction. There are also authors who discourage use of BHT because BHT blocks
reaction of LO with ferrous iron, thus diminishing Fe
3+ generation and leading to
pronounced underestimation of hydroperoxides (Hermes-Lima et al., 1995; Eymard &
Genot, 2003; Grau et al., 2000).

36
While investigators disagree on details of the XO reaction, they all agree that the
source of XO dye and even the batch number from the same source can significantly
change the results (Gay et al., 1999; Grau et al., 2000; Navas et al., 2004). An example of
this is XO dye from Sigma turned from red to purple (depending on hydroperoxide
concentration) with one absorption maximum at 560 nm (Navas et al., 2004). In same
study, XO bought from Aldrich or Scharlau resulted in colors ranging from brown to blue
and the appearance of two absorption peaks at 560 nm and 590 nm (Navas et al., 2004).
If the same supplier and same batch is used in a study, presumably the color
change should be due to hydroperoxide reaction. However, shifts in color with xylenol
orange, iron, and hydroperoxide concentrations complicate interpretation. Both Navas
(Navas et al., 2004) and Eymard (Eymard & Genot, 2003) agree that at low
hydroperoxide concentrations (less than 10 uM), the absorption maximum is 550-560 and
the color of the complex should be orange. At higher concentrations, however, absorption
maximum shifts to 580-590 nm and the color turns purple. Supposedly, this shift in color
from “reddish to purple” results mostly from iron concentration since the Fe3+
calibration curve was not linear over wide range; limitation of concentrations to 5-20
Fe3+
was thus recommended (Shantha & Decker, 1994). Burat and Bozkurt were able to
extend the lower detection limit to 2-4 ug Fe3+
by increasing the XO concentration to 1.00
umol of (versus 0.5 umol in Shantha and Decker’s assay) to prevent saturation of
response at high LOOH and Fe3+
concentrations (Burat & Bozkurt, 1996). Gay and
Bebicki also mention that a blueish/purple color indicates insufficient XO to complex of
all Fe3+ present, resulting in underestimating of amount of hydroperoxide in sample
(they claim brown/orange is correct color)( Gay & Gebicki, 2002).

37
Despite these many problems, the xylenol orange assay has its proponents and
advantages. Its principal strong point is high sensitivity, detecting nanomoles of
hydroperoxides in solution. The assay is felt to provide a reliable measure of
concentrations of hydroperoxides in reasonably pure compounds under specific
conditions (Gay et al., 1999a, 1999b), and can be used to compare relative concentrations
of hydroperoxides in like samples or over time. The FOX assay was been applied to
chicken, fish and lipid extracts from meat; edible oils and butterfat; foods; plant tissues
and biological samples (Burat & Bozkurt, 1996; Eymard & Genot, 2003; Grau et al.,
2000; Navas et al., 2004). Results from several papers conclude that FOX assay is
comparable to the spectrophotometric iodometric assay (Jiang et al., 1991, 1992;
Nourooz-Zadeh et al.,1995) and the official International Diary Federation (IDF
74A:1991) method (Burat & Bozkurt, 1996).
However, accurate quantitative measurements of absolute hydroperoxide
concentrations are problematic, requiring at a minimum knowledge of hydroperoxide
structure and apparent molar absorption coefficients as well as careful control of assay
conditions (incubation time, solvent, source of XO etc, optimum wavelength, pH)
(Fukuzawa et al., 2006; Gay et al., 1999b). This means the assay can be used to measure
amounts of hydroperoxides at two levels of precision (Gay et al., 1999b). For high
precision and absolute quantitation, the chemical identity of hydroperoxide must be
known so that accurate extinction coefficient can be applied; if not yet determined, the
hydroperoxide concentration must be measured by an independent primary method such
as iodometric titration for calibration of XO results (Fukuzawa et al., 2006; Gay et al.,
1999b; Gay & Gebicki, 2002). If the sample has unknown composition or contains

38
mixed hydroperoxides in unknown proportions, approximate ROOH concentrations can
be calculated by using an appropriate general molar absorption coefficient (Gay et al.,
1999b) or by expressing the concentrations as hydrogen peroxide equivalents (Fukuzawa
et al., 2006; Gay et al., 1999b). Such values are useful for following oxidation of a
single type of material over time or comparing like materials, but are not absolute and
thus are not appropriate for mechanisms studies.
There is a second problem with consistent quantitation that is seldom recognized
– bleaching of the Fe3+
-XO complex at high hydroperoxide concentrations. Thus, when
samples are not sufficiently diluted, reaction can appear not to occur or to detect only low
levels of hydroperoxides. Excess hydroperoxide probably explains results of Yildiz et al,
who saw a good correlation of FOX assay with titration and PeroxySafe kit (also based
on the xylenol orange reaction), but cited accuracy problems with samples of low PV
(<2) and the uncorrected PV were consistently under-predicted (Yildiz et al., 2003).
2.2.5. PeroxySafe Background
Safety Associates, Inc (Temp, AZ) developed a colorimetric assay for peroxide
value determination and marketed it as a kit under the brand name of SafTestTM
, more
specifically PeroxySafeTM
. The assay is based on the xylenol orange assay described in
the previous section, i.e. oxidation of ferrous ion in presence of xylenol-orange in an
acidic medium (Osawa et al, 2008). PeroxySafeTM
has been certified by as an official
method by AOAC-RI #030501 (Gordon, 2005). The kits include optical reader,
proprietary reagents, calibration standards, and autodispensers for reagent delivery.
SafTestTM
offers three different kits; PeroxySafe™ MSA Kit (matrix special
applications) which is designed for solid matrices such as pet foods, PeroxySafe™ STD

39
Kit (standard) recommended for pure oils or viscose substances with turbidity issues, and
PeroxySafe™ HSY Kit (high sensitivity) designed for living tissues and samples with
low oxidation levels. The company’s website claims that all three kits “effectively
measure peroxide levels up to 50 meq/kg with a high level of confidence”, have an
empirical lower detection limit of 0.02 meq/kg levels, and are “capable of analyzing a
wide range of values with a high degree of accuracy and precision” (MP Biomedicals,
2012). The assay offers advantages of small sample size, rapid and straightforward
performance, and reduced toxicity compared to traditional titration (Yildiz et al., 2003).
PeroxySafe is still a very new assay that has not yet been broadly accepted in the
food industry, despite AOAC certification and internal studies by the manufacturer
showing successful application of the assay to food systems (Foo et al., 2006). Research
papers verifying accuracy and precision of PeroxySafe and correlating this assay with
various other PV methods have shown mixed results. A study by Yildiz found a strong
correlation between PeroxySafe assays and standard iodometric titration of
hydroperoxides (Yildiz et al., 2003). Plots of PeroxySafe versus standard titration values
were linear with slope close to one, indicating comparable response in the two assays
(Yildiz et al., 2003). Foo et al found that calibration curves constructed from a single kit
and multiple kits had good reproducibility with no significant lot to lot difference (Foo et
al., 2006). However, diluted of samples to fit within the calibration curve markedly
increases variability and decreased precision (Foo et al., 2006). After monitoring oil
exposed to high heat for seven days, the study concluded that unless higher concentrated
standards can be included in the kits to allow for an extension of the calibration curve, the
PeroxySafe kit as currently sold should not be used to monitor the quality of heat abused

40
oil (Foo et al., 2006). [Note: the PeroxySafe assay has been used to track hydroperoxides
in frying oil at Rutgers University with no problems. However, as noted for the xylenol
orange assay above, constant argon atmospheres to avoid oxidation during handling and
appropriate dilution of samples are critical for obtaining accurate and reproducible
results.]
In analyses of refined vegetables oils, lard, and hydrogenated fats, reasonable
correlations were observed between PeroxySafe kits (standard and HSY) kits and
iodometric titration (AOCS method Cd 8b-90), although the SafTests were always
higher. Differences in PVs between methods increased at PVs below 2 meq/kg and when
lower concentrations of thiosulfate were used for titration (Osawa et al., 2007). The lower
PVs obtained by iodometric titration were attributed to lack of sensitivity of iodometric
method to low peroxides where endpoints are more difficult to see. However, the
difference more likely stems from the stoichiometric variability of the xylenol orange
reaction, which is at least 2:1, whereas Iodometric titration is 1:1.
In contrast, peroxide values in dried pet foods analyzed by the PeroxySafe MSA
kits were less than half the peroxide values determined by iodometric titration (Osawa et
al., 2008). Insufficient experimental detail was available to determine sources of
differences.
2.2.6. Triphenylphosphine Oxidation using HPLC
High-performance liquid chromatography (HPLC) is considered a useful
technique for hydroperoxide analysis (Dobarganes & Velasco, 2002). The biggest
advantage HLPC has over Gas Chromatography is that it can be run at room temperature
which decreases the risk of artifact formation, and lipid samples can be analyzed directly

41
without derivatization (Dobarganes & Velasco, 2002). However, lack of a universal
detector causes difficulties in quantitative analysis (Dobarganes & Velasco, 2002).
One way to provide a detectable chromophore is to react the hydroperoxides with
reagents that either bind or generate a modified species that can be followed
independently. Triphenylphosphine (TPP) is one such reagent. TPP reduces
hydroperoxides quantitatively to corresponding hydroxyl compounds, while being
converted to triphenylphosphine oxide (TPPO) (Nakamura & Maeda, 1991). Either the
TPPO produced or the TPP consumed in the reaction can be measured to quantify lipid
peroxide content. (Nakamura & Maeda, 1991).
TPP TPP=O (max = 560 nm)
It is particularly advantageous that even in high quantities (10 fold), TPP has no effect on
hydrogen peroxide making it a useful tool to differentiate between H2O2 and non-H2O2
hydroperoxides (Nourooz-Zadeh et al., 1994).
Akasaka et al originally adapted the TPP reaction as a test tube assay, adding
excess amounts of TPP, then measuring unreacted TPP after hydroperoxide reduction
(Akasaka et al., 1987). However, at low lipid oxidation levels, accurate measurement of
unreacted reagent was difficult since only trace amounts of TPP was consumed
(Nakamura & Maeda, 1991). Thus, a new procedure was developed where even small
amounts of TPO produced could be separated, detected, and quantified using reverse-
phase or normal-phase HPLC with ultraviolet (UV)-detection at 220 nm (Nakamura &
Maeda, 1991). The reaction is stoichiometric with cumene hydroperoxide or methyl 13-
hydroperoxyoctadecadienoate and sensitivity is high (detection limit < 10 pmole)
(Nakamura & Maeda, 1991).

42
Compared to the other hydroperoxide detection methods, TPP is a relatively new
assay; and several papers have been published (Bauer-Plank & Steenhorst-Slikkerveer,
2000; Prior & Loliger, 1994; Yamada et a., 1987; Yamamoto et al., 1987).
3. OBJECTIVES
Inconsistencies in methodology and results in literature reports show that there are
still many problems with lipid hydroperoxide analyses. Whether oxygen should be
excluded, which solvent to use to solubilize both lipids and lipid oxidation products,
which solvents are active radical substrates, how much response is generated per mole of
hydroperoxide (i.e. stoichiometry), and which assay is best for different concentrations of
hydroperoxides are all controversial issues that remain unresolved experimentally.
Choosing an assay blindly from the literature without considering all these factors can
lead to incorrect or invalid results.
The goals of this project, therefore, were:
evaluate the three assays most commonly used to determine lipid hydroperoxides
(iodometric titration, xylenol orange in two commercial kits, ferric thiocyanate
chemical reaction and commercial kit).
use two standard hydroperoxides (tert-butyl and cumene) which can be obtained
commercially in high purity and known concentrations and provide distinctly
different structure and solubility to determine for each assay
linearity of response (and linear response concentration range)
active concentration range (limits of detection and quantification)
reaction stoichiometry
43
effects of hydroperoxide structure on quantitative response
reproducibility
required and optimum reaction conditions
handling quirks and limitations.
apply optimized procedures for all assays to analysis of hydroperoxides in methyl
linoleate oxidized to different extents; compare results (between assays and lipid vs
standards) to determine most appropriate for use at different oxidation levels.
use the information collected to develop guidelines and recommended procedures for
hydroperoxide quantitation in research and industrial quality control.
4. EXPERIMENTAL PROCEDURES
4.1 Materials used for all assays:
Standard hydroperoxides: Tert-butyl hydroperoxide; 70% purity (MP
Biomedicals,Solon, OH); cumene hydroperoxide; 88.1% purity (MP Biomedicals, Solon,
OH)
Methyl Linoleate; > 99 %; NU-Chek Prep, Inc (Elysian, MN)
Other reagents as listed in the following protocols.
4.2. Experimental Protocols for Hydroperoxide Assays
4.2.1. Iodometric Titration with Thiosulfate
(Adapted from AOCS Cd 8-53 and AOAC 41.1.16)
I. Apparatus/Instrumentation/Equipment
A. Argon gas Source (AirGas, Inc, pre-purified Argon compressed)

44
B. Micro-pipettes; 1 ml, 200 µl, 100 µl
C. Erlenmeyer flasks (25 ml or 50 ml)
D. Stir plate and stir bar
E. Volumetric burettes
F. Analytical balance
II. Chemicals/Solvents
A. Hydroperoxide standard or lipid extract
B. Acetic acid, Glacial (CH3CO2H) – Sigma-Aldrich (St. Louis, MO), ACS reagent
≥ 99.7%
C. Chloroform (CHCl3) - Chromasolv® for HPLC ≥99.8%; (St. Louis, MO)
D. Potassium Iodide (KI) – Alfa Aesar: A Johnson Matthey Company;(Fair Lawn,
NJ) ;99%
E. Distilled water – Milli-Q™ Water System
F. Soluble starch – Argo Corn Starch 100% (Englewood Cliffs, NJ)
G. Sodium Thiosulfate (Na2S2O3) – Canolco, Canal Industrial Corporation
H. Potassium dichromate (K2Cr2O7) – Mallinckrodt crystals, Analytical Reagent
I. Potassium oxalate (K2C2O4·H2O) – Fischer Scientific (St. Louis), certified A.C.S,
crystals
J. Sulfuric Acid (H2SO4) – EMD, OmniTrace® (Gibbstown, NJ); 95.5-96.5%
III. Reagents/Solutions (make in appropriate quantities as needed)
For all reagents, use highest purity available. Use 18 M water (Milli-Q or
comparable) for all solutions.

45
A. 1% soluble starch solution in 18 M water (bring water to a boil to solubilize
starch and heat until solution is clear; mix continuously with stir bar until starch
is in solution). Cool and store in stoppered bottles. Short term use – OK at room
temperature. However, for long term storage and use, best stored in refrigerator
to inhibit mold growth and yeast fermentation.
B. Acetic acid : Chloroform (3:2). HPLC grade or better.
C. Solution B: Dissolve 45 g of dry Potassium oxalate plus 20 g of KI in 500 ml 18
M water.
D. Solution C: Dilute 59 ml of concentrated H2SO4 to1000 ml with 18 M H2O.
E. Saturated potassium iodide solution (make fresh daily). Bubble water on ice with
Ar for 15 min. Immediately before use, dissolve 6 g KI in 5.0 ml water and keep
covered with aluminum foil to prevent light access (or use red glass container).
Bubble with argon periodically throughout the day to prevent oxidation.
F. 0.01 N K2Cr2O7: Dry K2Cr2O7 for 1-2 hrs at 150-200 C. Accurately weigh
0.49036 g dichromate, dissolve in 100-200 mls 18 M water, make up to 1000
ml with H2O.
G. 0.1 N sodium thiosulfate solution (weigh 12.4019 g of Na2S2O3 and dissolve in
500 ml of recently boiled water).
H. Dilute 0.1 N sodium thiosulfate ten-fold to make a 0.01 N solution.
This solution can also be further diluted to 0.001 N if hydroperoxide concentration is
very low.
IV. Standardization of Sodium Thiosulfate solution
A. Run at least three replications for all samples.
46
B. Mix together 5 ml of 0.01N K2Cr2O7, 1.5 ml of Solution B and 1.5 ml of Solution
C. Orange color will form.
C. Titrate with sodium thiosulfate (0.01 or 0.001N) until orange color turns lighter
D. Add about 1-3 drops of 1% starch solution; sample will turn blue. Add more
starch if it does not.
E. Continue titration until blue color turns clear and colorless.
F. Calculate normality of Sodium Thiosulfate solution from
(ml of thiosulfate) X (Normality of thiosulfate) = (ml of chromate) X
(normality of chromate)
Note: Sodium thiosulfate should be stored refrigerated and must be standardized each
time a new solution is made. It is not necessary to re-standardize daily, but should be
checked for degradation by repeating standardization steps about every 10 days.
V. Peroxide Value determination (italic text denotes critical handling required for
accurate results)
A. Dilute standard hydroperoxide or extracted lipid if necessary. Sample size
required is determined by extent of oxidation.
Note: The official method recommends 1-5 grams of extracted lipid per analysis,
but these assays were designed for the oil industry where large volumes of oil are
readily available. Another approach is to start the titration with whatever sample
is available. We have run samples sizes as low as 30-40 mg to several hundred
mg. If more than 10-15 ml of 0.01 thiosulfate is used, then the sample must be
diluted for a more accurate reading. If less than 1 ml thiosulfate is used, 0.001 N
thiosulfate must be used or the sample size must be increased.

47
B. Bubble CHCl3:acetic acid with Ar for 15 minutes at 4 C to avoid unequal
volatilizing of solvents, seal bottle, bring to room temperature.
C. Dissolve aliquots of standard hydroperoxides, oil, or extracted lipid, accurately
weighed to 0.1 mg, neat or diluted in solvent, in 10 ml of glacial acetic acid:
chloroform (3:2).
D. Bubble sample with argon for two minutes. This can easily be done with a Pasteur
pipette attached to a tube on a gas line.
E. Add 0.5 ml of saturated potassium iodide solution, flush headspace with argon,
and stopper the flask.
F. After exactly one minute, add 15 ml of distilled water (sparged with argon).
G. Set up an argon line so that argon is continuously bubbling in the solution during
the titration.
H. Add two drops of 1% starch solution, or enough drops to produce a noticeable
bluish purple color.
I. Titrate above solution with 0.01 (or 0.001N*) sodium thiosulfate until the
moment right when blue color disappears. Titrate carefully and vigorously mix
after each addition either using hand stirring or a stir bar/stir plate with stir bar**.
*If less than 0.5 ml of 0.01 N sodium thiosulfate is used, repeat using 0.001N for
better accuracy.
** Stir bar/stir plate is recommended for clearer endpoint and better
reproducibility.

48
Additional Note: If solution is dark yellow in color (indicating high PV) before adding
starch solution, start titrating with sodium thiosulfate until the yellow is lighter in
color. Once the color is a ‘light yellow’, the starch can be added. This can help create
a clearer endpoint.
VI. Calculations
A. Normality of standardized sodium thiosulfate
(ml of thiosulfate) X (Normality of thiosulfate) = (ml of chromate) X (normality
of chromate)
Plug in known information and solve for Normality of thiosulfate.
B. Peroxide Value
PV = meq peroxide/ kg fat = ((1000)(ml of Na2S2O3)(Normality of Na2S2O3))/ (g
fat or hydroperoxide)
4.2.2. Ferric Thiocyanate Assay for Lipid Hydroperoxides
Adapted from (Mihaljevic et al., 1996; Shantha & Decker, 1994).
I. Apparatus/Instrumentation/Equipment
C. Argon source (AirGas, Inc, pre-purified Argon compressed)
D. Centrifuge – Beckman Model TJ-6
E. Plastic centrifuge tubes
F. Micro-pipettes – 1ml, 200 µl, 100 µl
G. Spectrophotometer – Varian, Cary 50 Bio UV-visible
H. Crystal/glass 3 ml cuvettes
I. Glass test tubes (various sizes)
49
II. Chemicals/Solvents
A. Hydroperoxide standard or lipid extract
B. Methanol – Fluka Analytical, LC-MS Chromasolv® (St. Louis, MO); ≥99.9%
C. Chloroform (CHCl3) - Chromasolv® for HPLC (St. Louis, MO); ≥99.8%
D. Barium Chloride dehydrate – Fischer Scientific Company (Fair Lawn, NJ)
E. Ferrous Sulfate – Matheson Coleman & Bell Manufacturing Chemists
(Phillipsburg, NJ), crystals
F. Ammonium Thiocyanate – Riedel-De Haen AG Seelze-Hannover; Reag. ACS,
Reag ISO, Reag. Ph. Eur I.
G. Hydrochloric Acid (HCl; concentrated, 12N) – A.C.S reagent Sigma-Aldrich (St.
Louis, MO); 37%
H. Ferric Chloride (FeCl3) – J.T. Baker Chemical, chloride hexhydrate (Phillipsburg,
NJ)
I. Distilled water – Milli-Q™ Water System
III. Reagents/Solutions (make in appropriate quantities as needed)
A. Chloroform: Methanol (2:1) v/v
B. 10 N Hydrochloric acid in distilled water (remember to add acid to water!)
C. Ferrous Chloride Solution (make fresh daily):
1. 0.4 g barium chloride dehydrate dissolved in 50 ml distilled water
2. 0.5 g Ferrous sulfate dissolved in 50 ml distilled water
3. Barium chloride solution was slowly added with constant stirring to the
ferrous sulfate solution
4. 2 ml of 10 N hydrochloric acid added to above solution

50
5. Solution was centrifuged for 3-5 minutes or until solution clear enough to
siphon off
6. Clear iron (II) solution is pipetted out, leaving behind the barium sulfate
precipitate). Store iron (II) solution in brown bottle or cover with foil to keep
in the dark. Dearate solution with argon for 3-5 minutes.
D. 30 % Ammonium thiosulfate solution: 30 grams of Ammonium thiosulfate
dissolved in water and volume brought up to 100 ml
E. Fe3+
standard curve solutions
1. Stock 1 mg/ml Fe3+
: dissolve 2.470 g of ferric chloride in a few mls of 10 N
HCl, make up to 500 ml in a volumetric flask with 10 N HCl. Store in an
amber-glass bottle at 4 C.
2. Intermediate Standard Solution (0.1 mg Fe/ml): Prepare fresh daily. Add 1 ml
of Stock 1 mg/ml
Fe3+
to 9 ml CHCl3:MeOH (2:1), v/v. Mix.
3. Working Standard Solution 1 (0.01 mg Fe/ml): Prepare fresh daily. Mix
together 3 ml of intermediate standard solution and 27 ml CHCl3:MeOH (2:1),
v/v.
4. Working Standard Solution 2 (0.001 mg Fe/ml): Prepare fresh daily. Mix
together 3 ml of Working Standard Solution 1 (0.01 mg Fe/ml) with 9 ml of
CHCl3:MeOH (2:1), v/v.
IV. Fe3+
Thiocyanate Standard Curve
A. Use Working Standard solution 1 (10 ug Fe/ ml) and Working Standard Solution 2
(1 ug Fe/ml) to construct Fe3+
standard curve.

51
B. Deaerate (on vacuum line or by argon sparging) enough Working Standard and
solvent for analyses to be performed. See Table 2 for volumes.
C. Prepare reactions with a range of standard Fe concentrations in small test tubes,
mixing reagents in volumes and order specified in Table 2. In particular, SCN must
be added last.
D. Vortex solutions and react in dark for exactly 10 minutes.
E. Transfer reaction solutions to glass or quartz optical cuvettes (disposable cuvettes
cannot be used, plastic dissolves in chloroform:methanol) and record absorbance
at 500 nm.
F. Plot absorbance vs standard concentration to generate standard curve. Determine
regression equation for curve using any standard math program (e.g. Excel or
MatLab) or by determining the x-intercept and calculating slope of the linear
region of the curve, then fitting these values to the equation for a straight line:
y = mx + b or y = slope (x) + y-intercept
Table 2. Reagents for preparation of Fe3+
Standard Curve
Standard
Fe3+ Conc.
(µM)
10 g
Fe/ml std
(l)
1 g Fe/ml
std
(l)
0.5 g
Fe/ml std
(l)
Chloroform:
Methanol 2:1
(l)
30% SCN
(l)*
Total (l)
1.013 0 0 300 2337.5 12.5 2650
1.689 0 0 500 2137.5 12.5 2650
2.365 0 0 700 1937.5 12.5 2650
3.378 0 0 1000 1637.5 12.5 2650
5.067 0 0 1500 1137.5 12.5 2650
7.770 0 0 2300 337.5 12.5 2650
13.51 0 2000 0 637.5 12.5 2650
40.54 600 0 0 2037.5 12.5 2650
54.053 800 0 0 1837.5 12.5 2650
67.566 1000 0 0 1637.5 12.5 2650
135.133 2000 0 0 637.5 12.5 2650
168.916 2500 0 0 137.5 12.5 2650
*Note: Add 30% SCN last.

52
V. Peroxide Value Assay
A. Dissolve/dilute samples (hydroperoxide or extracted lipids) in appropriate solvent
(usually water, chloroform, methanol, or chloroform:methanol for compatability)
to give a stock concentration of about 5 mg lipid /ml or <20 uM hydroperoxides.
B. From this stock, prepare a series of dilutions in the same solvent to test the reaction
response. This is particularly important with samples that have unknown
hydroperoxides concentrations.
C. Dearate samples with argon for 3-5 minutes.
D. In a clean test tube take appropriate amount diluted sample from above step
(hydroperoxide or extracted lipid) and mix with appropriate amount of deaerated
solvent to give desired final concentrations. Total volume after all reagents add to
2.65 ml. See Table 3 for example of concentration curve for cumene
hydroperoxide.
E. Add 12.5 µl of 30% SCN.
F. Add 12.5 µl of FeCl2 solution and vortex and allowed to react in dark for 10
minutes.
G. Allow to react in dark for 10 minutes.
H. Transfer to glass or quartz optical cuvettes and record absorbance at 500 nm.
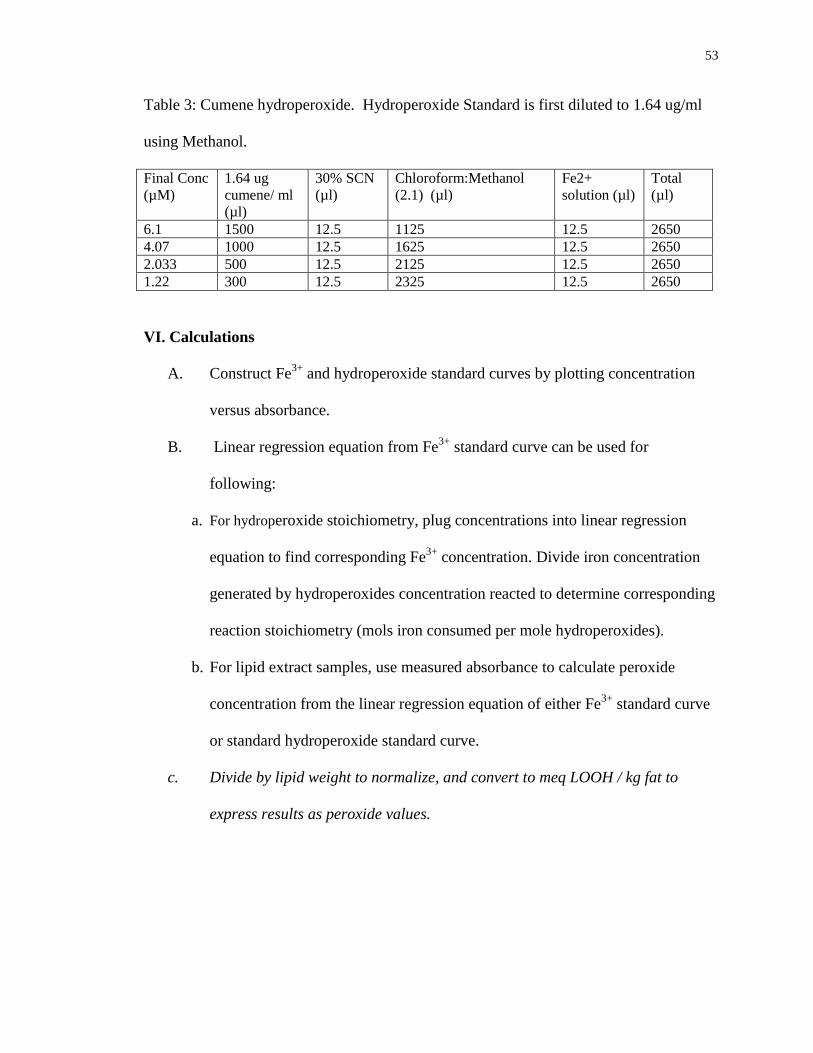
53
Table 3: Cumene hydroperoxide. Hydroperoxide Standard is first diluted to 1.64 ug/ml
using Methanol.
Final Conc
(µM)
1.64 ug
cumene/ ml
(µl)
30% SCN
(µl)
Chloroform:Methanol
(2.1) (µl)
Fe2+
solution (µl)
Total
(µl)
6.1 1500 12.5 1125 12.5 2650
4.07 1000 12.5 1625 12.5 2650
2.033 500 12.5 2125 12.5 2650
1.22 300 12.5 2325 12.5 2650
VI. Calculations
A. Construct Fe3+
and hydroperoxide standard curves by plotting concentration
versus absorbance.
B. Linear regression equation from Fe3+
standard curve can be used for
following:
a. For hydroperoxide stoichiometry, plug concentrations into linear regression
equation to find corresponding Fe3+
concentration. Divide iron concentration
generated by hydroperoxides concentration reacted to determine corresponding
reaction stoichiometry (mols iron consumed per mole hydroperoxides).
b. For lipid extract samples, use measured absorbance to calculate peroxide
concentration from the linear regression equation of either Fe3+
standard curve
or standard hydroperoxide standard curve.
c. Divide by lipid weight to normalize, and convert to meq LOOH / kg fat to
express results as peroxide values.
54
4.2.3. Cayman Chemical Company: Lipid Hydroperoxide (LPO) Assay Kit
Adapted from booklet that came with kit (Catalog No. 70500) provided by Cayman
Chemical Company; Ann Arbor, MI.
I. Apparatus/Instrumentation/Equipment
1. Plate Reader (500 nm filter) – Berthold Technologies Mirthras LB 940
2. Micro-Pipettes: 1ml, 200 µl, 100 µl
3. Glass 96-well plate – Cayman Chemical Company
4. Argon source (AirGas, Inc, pre-purified Argon compressed)
5. Test tubes: VWR Disposable Culture Tubes – Borosilicate Glass Size: 12 X 75 mm
II. Chemicals/Solvents
1. Standard Hydroperoxide or Extracted Lipid
2. Methanol – Fluka Analytical, LC-MS Chromasolv® (St. Louis, MO); ≥99.9% or
comparable
3. Chloroform (CHCl3) - Chromasolv® for HPLC (St. Louis, MO); ≥99.8% or
comparable
4. LPO Assay Kit:
a. FTS Reagent 1: 4.5 mM ferrous sulfate in 0.2 M hydrochloric acid (ready to use
as supplied; store in 4 degree C).
b.LPO Assay FTS Reagent 2: 3% methanolic solution of ammonium thiocyanate
(ready to use as supplied; store in 4 degree C).
c. Lipid Hydroperoxide Standard: 50 uM ethanolic solution of 13-
hydroperoxyoctadecadienoic acid (ready to use as supplied; store at -80 C).

55
III. Reagents/Solutions (make in appropriate quantities as needed):
1. Chloroform: Methanol (2:1) v/v (deoxygenate by bubbling with argon)
2. Chromogen: in clean test mix equal volumes of FTS Reagent 1 with FTS Reagent 2
and vortex. Each test tube needs 50 ul of chromogen. (ex: replicates of five; 5 X 50
ul = 250 ul per sample).
Must be freshly prepared.
IV. Calibration Curve: Lipid Hydroperoxide Standard supplied with kit
Note: Other standard hydroperoxides (cumene or t-butyl) can be used in addition to Lipid
Hydroperoxide Standard supplied.
Dynamic range of kit; 0.25- 50 nmol per assay tube.
1. Mark 24 clean test tubes A-H (or with standard conc) in triplicates
2. Remove Lipid Hydroperoxide Standard from freezer and store on ice.
3. Aliquot Lipid Hydroperoxide Standard and solvent into each tube as shown in
Table 4.
Table 4: Cayman Lipid Hydroperoxide Standard (13-HpODE) Curve *
Tube HP Standard
(ul)
Chloroform:
Methanol (2:1) (ul)
Final HP**
(nmol)
A 0 950 0
B 10 940 0.5
C 20 930 1.0
D 30 920 1.5
E 40 910 2.0
F 60 890 3.0
G 80 870 4.0
H 100 850 5.0 *Table copied from page 12 of booklet supplied in kit. **This is the final amount of hydroperoxide in assay tube.

56
4. Start the reaction by adding 50 l freshly prepared Chromogen added to each test
tube. Vortex for 15 seconds or until well mixed. Use polypropylene caps to tightly
seal test tubes.
5. Allow reaction to proceed at room temperature for five minutes.
6. Transfer contents of each tube each tube to a 1 ml glass/quartz cuvette and read
absorbance at 500 nm against Tube 1 as the blank.
V. Standard Assay
1. Dissolve lipid extracts or oil samples in chloroform:MeOH. Record weight
concentration (wt lipid/ml) for each sample.
2. In clean test tube aliquot 500 ul of lipid extract
3. Add 450 ul of chloroform: methanol solvent mixture.
4. Volume of sample can be more or less based on hydroperoxide concentration.
Solvent volume must also be adjusted so that final volume is 950 µl before
chromogen is added.
5. 50 µl of freshly prepared Chromogen added to each test tube. Vortex for 15 seconds
or until well mixed. Use polypropylene caps to tightly close test tubes.
6. Leave assay tubes at room temperature for five minutes.
7. After 5 minute reaction time, color is stable for 2 hours. However, it is best to read
absorbances immediately to avoid evaporation of solvent and corresponding change
in absorbance.
8. Assay may be run in microplates by transferring 300 µl from each tube into a well
of 96-well plate. Absorbance is read at 500 nm.

57
VI. Calculations
1. Before constructing lipid hydroperoxide standard curve, subtract average
absorbance of standard A (the blank) from all other standards and samples.
2. Plot corrected absorbance of standards as function of final Lipid Hydroperoxide
value from Table 4.
3. Determine hydroperoxide value by using linear regression equation obtained from
standard curve. Corrected absorbance values for each sample are substituted in
following equation:
4. Calculate concentration of hydroperoxide in original sample:
HPST (nmol) = (sample absorbance – y-intercept)/ slope
Hydroperoxide conc. in sample (µM) = (HPST/VE) x (1 ml/SV)
VE = volume of extract used for assay (ml)
SV = volume of original sample used for extraction (ml)
4.2.4. PeroXOquantTM
Quantitative Peroxide Assay Kit, Lipophilic version
Based on xylenol orange assay (Jiang et al 1991; Jiang and Wolff, 1992); adapted from
insert that came with kit available from Thermo Scientific (Pierce Biotechnology;
Rockford, IL) Product number: 23285; Quantitative Peroxide Assay Kit (Lipid).
I. Apparatus/Instrumentation/Equipment
A. Spectrophotometer - Varian, Cary 50 Bio UV-visible (plate reader may be used in
place of spectrophotometer)
B. Micro-pipettes

58
C. Glass test tubes -VWR Disposable Culture Tubes – Borosilicate Glass Size: 12 X
75 mm
D. Vortexer - Fischer Scientific Touch Mixer Model 232
E. Disposable Plastic cuvettes, 1 ml
II. Chemicals/Solvents
A. Standard hydroperoxide or lipid extract
B. Methanol - Fluka Analytical, LC-MS Chromasolv® (St. Louis, MO); ≥99.9%
C. Distilled water – Milli-Q™ Water System
D. PeroxoQuantTM
Kit – Reagents are ready to use/ store at 4 C.
i. Reagent A, 1 ml, Composition: 25 mM ferrous (II) ammonium sulfate in 2.5 M
H2SO4
ii. Reagent C, 2 X 50 ml, Composition: 4 mM BHT, 125 uM xylenol orange in
methanol
III. Reagents/Solutions (make in appropriate quantities as needed)
Working Reagent (WR) : Mix 1 volume of Reagent A with 100 volumes of Reagent B
Example: Mix 10 ul of Reagent A with 1000 ul of Reagent C. This solution is
stable for 12 hours.
Prepare at least 1 ml WR for each sample and standard replicate to be assayed in
cuvettes.
(200 ul of WR for each sample and standard replicate if using a microplate).
A. Hydroperoxide Standard Curve: Serially dilute standard hydroperoxide (tert-butyl
or cumene hydroperoxide for lipid analysis) so concentration range is between 1

59
uM to 1000 uM (working range of assay) using appropriate solvent. There should
be 8-10 different concentrations.
C. Fe3+
Standard curve: Although not specified by Pierce, we prepared an Fe3+
standard curve to provide a basis for stoichiometry calculations and to determine
completeness of reactions.
Fe3+
concentration range tested: 4.1 M to 1000 M.
D. Unless hydroperoxide levels are very low, sample should also be diluted so that
absorbance is in the concentration range of hydroperoxide standard curve. Setting
up a concentration curve for the sample can help ensure this, e.g. 1:10, 1:100,
1:1000.
Special note: High levels of peroxides bleach the dye and Fe-dye complexes, causing
inaccurate low absorbance readings. It is recommended that all samples be
analyzed over a range of dilutions, at least 1000x. If no reaction is obtained,
continue diluting sample to 106 dilution. If diluted samples have higher or similar
readings to undiluted samples, a bleaching effect has occurred and readings from
the lowest concentrations giving a color should be used for calculations.
IV. Assay
A. Add 10 volumes of Working Reagent to 1 volume of sample (or standard) to a
clean test tube. Example: 1000 µl of Working Reagent added to 100 µl of sample
(or standard)
B. Vortex until mixed and leave reaction for 15-20 minutes at room temperature.
C. Transfer to plastic cuvette and measure absorbance at 560-600 nm (560 optimal) in
a spectrophotometer (595 nm if using plate reader).

60
The complex formed is fairly stable, but samples should be measured the same day
the reaction is performed and always after the same set reaction time, e.g. 20
minutes, 30 minutes, or four hours.
D. Using the measured absorbance, determine the hydroperoxide concentration from
the regression equation for the standard curve as a reference.
Additional Notes:
1. In some cases depending on sample, it is necessary to prepare a blank that omits
Reagent A. (for example: lipid sample is not extracted, sample contains
endogenous iron interferences, sample contains other transition metals or a protein
having chelating properties or strong absorbance characteristics at wavelengths
used for measurement).
V. Calculations
Normally, the slope of the regression of A560 vs concentration of LOOH is equal to the
molar absorption coefficient of the XO-Fe3+
complex, thus providing the basis for
calculating unknown ROOH concentrations from Beer’s Law. However, in this assay,
none of the standard curves are linear (see below) except at very low concentrations, so a
quadratic or best-fit curve to standard points must be used, or linear curves must be fit to
individual100 uM increments. Also, the response curves are quite different, so serious
questions must be raised regarding appropriate standard curves for use with lipids.

61
4.2.5. SafeTest PeroxySafeTM
Assay for Lipid Hydroperoxides
Adapted from Protocol for PeroxySafeTM
Standard Kit that is available from MP
Biomedical, Solon, OH. This assay was developed specifically for use with oils.
Important Modifications:
1) The standard assay comes with reagents in bottles equipped with calibrated
autopipettors. We found these units to be inaccurate, irreproducible, and extremely
wasteful of expensive reagents due to the priming required, so we replaced them with
direct pipetting of reagents using micropipettors.
2) Use a heating block set at 25 C to maintain a constant “room temperature”.
I. Apparatus/Instrumentation/Equipment
A. SafeTest Optical Analyzer provided with kit
B. Micro-pipettors (1 ml, 200 l, 100 l, 10 l) and
corresponding tips
C. Disposable Glass Test Tubes
a. Disposable Culture Tubes – VWR (West Chester, PA); Borosilicate Glass Size:
12 X 75 mm
b. Disposable Culture Tubes – VWR (West Chester, PA); Borosilicate Glass Size:
10 X 75 mm
D. Vortex
II. Chemicals/Solvents
A. Hydroperoxide standard or lipid extract
B. PeroxySafe Kit (store in 2-6 degree C): (All Reagents and calibrators are provided
ready to use.)

62
a. Reagent A: Isopropyl Alcohol + Proprietary Compound
b.Reagent B: water, ultrapure + Chromogen (pH indicator)
c. Reagent C: Water, ultrapure + Sulfuric acid + Proprietary Compound (Iron salts)
d.Calibrators C1-C4: Fixed concentration of lipid peroxides; Isopropyl Alcohol +
Proprietary Compound
e. Prep Reagent: Isopropyl Alcohol + Proprietary Compound (Stabilized alcohol)
II. Generation of Calibration Curve
A. Set-up Calibrators C1-C4 in the same way as regular samples. Follow steps in
section III. In step III.B.in place of sample add 25 ul of the calibrator.
B. Press the calibration button and follow steps on machine
C. At ‘Read Black” prompt insert test tube filled with distilled water in sample
compartment. (Wipe outside of each tube with Kimwipe before inserting into
analyzer)
D. At “Reagent Blank” prompt insert test tube containing reagent blank.
E. At “Cal # _, Insert tube” insert the Calibrators that were previously prepared.
F. Be sure to select “Yes” at “Store Cal Data” prompt.
G. Calibration is now set-up, stored in program, and will only need to be
repeated when a new kit is opened. At the next prompt, regular sample tubes
may now be inserted. More detailed instructions of sample preparation in
III.A-F.
Note: If the “Corr” value under “Equation of Line” is less than 0.990, must redo
calibration

63
III. PeroxySafeTM
Assay
Note: 1. Assay is usually performed in triplicates.
2. Transfer reagents to be used into flasks; discard any unused portions when
finished.
A. Dilute samples or standards in Prep Reagent to bring expected ROOH
concentration into working range of the assay. Especially when working with
unknowns (e.g. food oils or lipid extracts), we recommend diluting sample to at
least three concentrations that are at least one order of magnitude different to
make sure sample is detected. If no reaction is observed, do not assume absence
of hydroperoxides – excess hydroperoxides bleaches the detection complex. When
no reaction occurs, dilute the samples further sequentially until a response is
observed. Record the dilution factor for each sample.
B. Vortex hydroperoxide standard or lipid extract for several seconds with Prep
Reagent to fully dissolve.
C. In a clean test tube:
1. Add Reagent A – 1000 µl
2. Add diluted sample – 25 µl
3. Add Reagent B – 100 µl
4. Add Reagent C – 160 µl
D. Start timer for 15 minutes at the moment Reagent C is added to the first sample.
E. Cap each tube and vortex each sample for about 30 seconds.
F. Let reaction incubate for 15 minutes at room temperature (25and then read
immediately on SafTest analyzer. Wipe outside of each tube with Kimwipe before

64
inserting into analyzer. Follow the prompts on the machine (Sample #_, insert
tube). The absorbance is read at 570 nm.
Additional Notes:
1. Values that are greater than highest calibrator will be flagged as HI. This means
the sample must be further diluted and then the assay redone because the value is
inaccurate. Values that are lower than value of lowest calibrator will be flagged as Lo. If
possible the sample should be diluted less and retested. If sample has not been diluted
then the sample value should just reported as ‘less than (value of lowest calibrator)’.
Coefficient of variation (%CV) will be flagged on screen if it is greater than 10% and
assay should be repeated. If samples are being measured at low end of calibration curve,
a high %CV is expected, so test may not have to be repeated.
IV. Calculations
A. Analyzer will calculate Peroxide Values as milliequivalents of peroxides per
kilogram of sample using the calibration curve stored.
NOTE 1: These calculations are based on “per kg isopropanol”. The assumption is that
the sample is diluted to such an extent that the isopropanol weight accurately represents
what is in the 25 l of sample. Results for 25 µl are adjusted for IPA density (0.786) and
multiplied by 40,000 (the number of sample wt units/kg, or 1000/0.025). The standard
concentrations they specify are actually final meq/kg IPA, not the amount added in the
sample.
NOTE 2: MP Bio uses cumene hydroperoxide as their standard. When standards are fresh
and undegraded, the slope of the regression equation for the standard curve is very close

65
to 1. The slope decreases as the controls age. This needs to be monitored closely and
controls replaced when the slope drops below a limit point (determination in progress) or
PVs of samples are erroneously low.
B. Adjust results for any sample dilution:
Actual sample PV = SafTest PV * dilution factor
For example: SafTest result of 0.07 meq/kg with a dilution factor of 1:10:
Sample PV = 0.07 meq/kg * 10 dil = 0.70 meq/kg.
C. Adjust results for fat weight in sample to express PV as meq ROOH / kg fat.
Actual sample PV = SafTest PV ( * dilution factor) ( * % fat in sample)
For example, if sample has 11% fat and PV/kg sample was 0.70 meq/kg:
PV (meq/kg fat) = 0.70/(11/100) = 6.36
When testing standards, adjust for sample purity rather than lipid weight in this step.
4.2.6. LOOH Based on Triphenylphosphine Oxidation Using HPLC
Adapted from (Nakamura & Maeda, 1991)
A. Apparatus/Instrumentation/Equipment
A. Glass test tubes with cap
B. HPLC:
i. Autosampler: Shimadzu SIL-10ADvp
ii. Detector: Shimadzu SPD-M10Avp
iii. Pump: Shimadzu LC-10ADvp *2
iv. Column: Restek Ultra C18 (5um, 150*4.6mm, Serial# 10080457T,
Lot#100617P); (reverse-phase)
66
C. Micro-pipettes
D. Aluminum foil
E. Water bath
F. Floating foam platform
II. Chemicals/Solvents
A. Hydroperoxide standard or lipid extract
B. Triphenylphosphine (TP); >99%; Alfa Aesar (A Johnson Matthey Company);
Ward Hill; MA
C. Cyclohexane; Fischer Scientific (Fair Lawn, NJ); certified ACS
III. Reagents/Solutions
A. Triphenylphosphine solution (4 mM): Weigh 0.0052 grams of TP and dissolve in
5 ml of cyclohexane. TP reagent make fresh daily and prepare right before use.
IV. Peroxide Value Assay
A. Cover glass tubes with aluminum foil before adding reagents.
B. Add 750 ul of diluted hydroperoxide plus 750 ul of TP reagent to aluminum
covered tube.
C. Cap, Mix, and place in 30 degree C water bath (used piece of foam with holes
cut in it, so tubes could float in water bath).
D. Leave in water bath for 20 minutes.
E. Set-up HPLC: 1.35 ml/min ACN; 0.15 ml/min water (total flow rate 1.50
ml/min); 7 minute run; absorption at 220 nm; 20 ul of sample injected.

67
4.2.7. Modification of Iodometric Titration – Lovaas Method (Løvaas, 1992)
Chemicals: Potassium Iodide (KI) ( Alfa Aesar: A Johnson Matthey Company (Ward
Hill, MA); 99%); Methanol (Fluka Analytical, LC-MS Chromasolv® (St. Louis, MO);
≥99.9%); Butanol (HPLC Grade; Fisher Chemical/Fisher Scientific; Fair Lawn, NJ);
Hydrochloric acid (concentrated, 12N; A.C.S reagent; Sigma-Aldrich (St. Louis, MO);
37%); Ammonium iron(II) sulfate (NH4)2Fe(SO4)2·6H2O (Fischer Scientific (Fair Lawn,
NJ); certified ACS).
Assay: Mix 2.2 ml of solvent (MeOH:BuOH; 2:1 in 3% saturated KI solution), 100 µl
HCl in MeOH (25 mM), 100 µl of hydroperoxide (diluted in BuOH), and 100 ul of Fe2+
solution (500 µM). Absorbance read for 15 minutes at 360 nm in spectrophotometer.
Please note: Protocol was not written for this assay because assay did not work

68
4.3. Autoxidation of Methyl Linoleate
About 15 ml of fresh methyl linoleate (stored in freezer) was poured into a round-
bottomed flask. The flask was connected to a rotary evaporator, and rotated for thirteen
days open to air with no protection light. Five milliliters of oxidized Methyl Linoleate
was removed from flask on day 4, day 9, and day 13 for analysis. The sample was stored
in three 2 ml vials covered with aluminum foil to block light. The sample was bubbled
with argon for several minutes, capped tightly, and stored at -80 C.
4.3.1. Assay of Methyl Linoleate
Samples were analyzed using the five assays described above over three days in different
order (unable to analyze TPP Oxidation Assay because of technical problems with HPLC
in lab). Each day the PeroxySafe assay was performed as a basis for comparison to ensure
there were no changes in oxidation during analyses. Each assay day, a vial of sample was
removed from the freezer and allowed to warm to room temperature (between 45-60
minutes). Each time the vial was opened it to remove a sample aliquot, it was again
bubbled with argon, closed tightly and kept in the dark to prevent further oxidation.

69
5. RESULTS AND DISCUSSION
5.1. Iodometric Titration with Thiosulfate (TS)
The iodometric titration was assayed over a range of 0.118 umoles to 0.2 mmols
of hydroperoxide added, requiring a thiosulfate concentration range of 0.001-0.01 N for
titration. Lower concentrations were not tested because the endpoint color change became
too difficult to determine visually. Higher ROOH concentrations can be detected but the
reproducibility decreases due to the high concentration of 0.1 N thiosulfate in each drop.
As shown in Figure 2, reaction response for both hydroperoxides was linear (with
average R2 =
0.997) and detectable from about 2 – 200 mols added peroxide. While the
regression correlations were quite high for the full range, reactions were surprisingly
most linear (R2=1) in the lowest concentration range (<50 mol added ROOH). The
assay was slightly more sensitive for cumene, with a lower limit of detection of 0.3
µmole ROOH compared to the lower limit of 0.88 µmoles t-butyl hydroperoxide using
0.001N thiosulfate. The lower limit was determined as the lowest concentration at which
the endpoint could be comfortably and reproducibly detected by sight. The upper limit of
the assay was arbitrarily set at 0.33 mmols t-butyl and 0.21 mmol for cumene using 0.01
N TS, the concentration of ROOH requiring 25 ml of 0.01 N TS to reach the endpoint.
No true upper limit of detection was found. Samples requiring more than 25 ml 0.01 N
TS must be diluted or titrated with 0.1 N TS. Each operation adds to variability in assay
response.

70
y = 1.206x + 0.0003 R² = 1
y = 1.1461x + 0.0008 R² = 0.9987
0
0.01
0.02
0.03
0.04
0.05
0.06
0 0.01 0.02 0.03 0.04 0.05 0.06
meq
LO
OH
dete
cte
d
mmols of sample added
Stoichiometry of TS reaction
t-BuOOH
CuOOH
Figure 2. Concentration response curves for thiosulfate titration of cumene and t-butyl
hydroperoxides. Plotted values are averages of five replicates. Standard error and
replication data are presented in Table 1. Top: full concentration range. Bottom:
expanded scale showing increased linearity at lowest hydroperoxide concentrations.
y = 1.1403x + 0.0016 R² = 0.998
y = 1.1702x - 0.0005 R² = 0.9955
0.00
0.05
0.10
0.15
0.20
0.25
0.30
0 0.03 0.06 0.09 0.12 0.15 0.18
meq
LO
OH
dete
cte
d
mmols of sample added
Stoichiometry of TS reaction

71
Slopes of 1.14 (t-butyl) and 1.17 (cumene) verify that the stoichiometry was very close
1:1 as expected theoretically from the reaction, i.e. the amount of iodine liberated was
essentially equal to the ROOH concentration. It should be kept in mind that if thiosulfate
solutions are prepared on a molar basis, the amount of thiosulfate consumed is twice the
concentration of I2 released and LOOH in the sample. However, if thiosulfate solutions
are prepared as 1 N solutions (or dilutions thereof), the amount of thiosulfate consumed is
equivalent to the I2 released. Surprisingly, this was the most unambiguous stoichiometry
and accurate reaction of all the assays tested. Comparable responses of the two
hydroperoxides demonstrates that lipid extracts with different fatty acids and
hydroperoxides structures can be analyzed accurately without concern that observed
differences are due to different hydroperoxides rather than different hydroperoxides
concentrations. The slight excess of reaction was probably due to traces of residual
oxygen that are difficult to remove from hydroperoxide solutions.
Such excellent response was not obtained in first tests of this assay. This assay is
known to be highly empirical and considered untrustworthy and inaccurate by some, and
the problems described below verified these views.
1. Visual detection of the endpoint. The purple-blue color that formed after the starch
was added turned various hues from oranges to pink (light purple/orange) and at times
never fully cleared (staying a very light pink) when hand-swirling was used to add the
thiosulfate. This was not observed when mechanical stirring (stir bar/stir plate) was
utilized. Difficulty in distinguishing these changes were compounded by the swirling
required to disperse the thiosulfate. Final color changes were not very distinct and often
came suddenly in titration (Figure 3). At the endpoint the solution is colorless, though not

72
completely clear. The slight cloudiness is due to chloroform and water not mixing (Figure
3). Results ultimately depend on the titrator’s perception of when color changed.
Endpoint determination (light blue to colorless) was particularly problematic at low
hydroperoxide concentrations.

73
Figure 3. Progressive color changes during thiosulfate titration of iodine released after
reduction of hydroperoxides. Change from D to E is often very fast. Note E is colorless.
A B
C D
E

74
2. Freshness of KI solutions. Protocols for Iodometric titrations always specify “prepare
fresh daily”. However, during handling the KI must be protected from light and bubbled
with argon. When replicate samples show poor matches, making bubbling the KI with
argon or preparing fresh KI restored reaction performance.
3. Transfer of hydroperoxide from organic phase to aqueous phase for reaction
with I. Most organic hydroperoxides and certainly lipid hydroperoxides are soluble in
the organic solvent but the iodine required to reduce the hydroperoxide is in the aqueous
acid phase. Passive diffusion of hydroperoxides is inadequate so rigorous stirring/mixing
must be provided to transfer the hydroperoxides from the organic to the aqueous phase of
the reaction mixture. Normally, mixing is accomplished by hand swirling of the reaction
flask during titration. However, reactions were incomplete (less ROOH detected than
added) and the agitation this induced complicated endpoint detection. In addition, on
numerous occasions reactions that appeared to be complete developed pink colors after
standing as undetected ROOH diffused from the organic phases. To eliminate these
problems, hand-stirring was replaced with mechanical stirring using a stir bar and stir
plate. This modification clarified endpoints and greatly increased reproducibility. The
purple-blue color no longer turned into the strange orange/pink colors, instead gradually
lightening until colorless. An additional advantage of the stir bar/stir plate was that it
freed the hands, making the entire titration easier to handle.
4. Oxygen. The most well-known problem with the iodometric titration is oxygen
because in the chemical reaction of KI with ROOH, I can also react with any oxygen
present, forming more iodine:

75
LOOH + 2 H+ + 2 KI I2 + LOH + H2O + 2 K
+
2KI 2 K+ + 2 I
I2 + 2 e
KI + O2 I2
The electrons for the ROOH reduction are provided by the saturated KI which dissociates
in solution. This is an equilibrium reaction. Normally, I is favored. However, when the
electrons are removed, e.g. by reaction with oxygen or with LOOH, the reaction is driven
to the right. Consequently, unless oxygen is rigorously excluded, peroxide values can be
significantly overestimated.
Initial titration data confirmed that the concentration of ROOH was several times
higher than the theoretical amount when oxygen was present. Thus, several approaches
were tested for eliminating oxygen.
1) To exclude oxygen, argon was bubbled through the solvents in every step.
This included the saturated potassium iodide solution, acetic acid:chloroform solvent
(3:2) before and after ROOH was added, and during the titration. Argon saturation
combined with rigorous stirring reduced over-reaction and gave hydroperoxide yields
very close to what was added.
2) A second solution to the problem was also attempted. Addition of sodium
biocarbonate (sodium hydrogen carbonate) has been suggested as a way to provide a
blanket of carbon dioxide over a solution and the layer of carbon dioxide would exclude
oxygen from titration vessel (Skoog et al., 1998). However, sodium biocarbonate only
made the solution more cloudy and the cloudiness obscured the endpoint. This approach
was therefore abandoned.

76
Two other alterations to the procedure were investigated. The AOCS standard
method has one variation in which the reaction time is extended to 2 minutes to ensure
complete reaction after adding the KI and the distilled water; this option was tested. At
lower hydroperoxide concentrations, one minute reaction time gave values that fit closer
to the theoretical concentration, and at higher hydroperoxide concentrations, there was no
significant difference between reaction times. Thus, one minute reaction time was
retained since it gave the most accurate values and reduced opportunity for side reactions.
3:1 ratio of acetic acid: chloroform was tested as a replacement for the traditional
3:2 ratio of acetic acid: chloroform to investigate whether concentration of the
hydroperoxides in the aqueous phase could increase sensitivity of the assay. No
differences in response were observed so the original 3:2 ratio was retained.
After evaluating all these variations, it was clear that the assay accurately detected
the standard hydroperoxides only when all solutions were sparged with argon, vigorous
mechanical stirring was provided during titration, and argon sparging in and over the
reaction solution was maintained throughout titration. These conditions were then used to
test the reproducibility of the method. Five replicates of each hydroperoxide
concentration were analyzed daily and repeated over three days. Results are presented in
Table 5; the response curves shown in Figure 2 were also generated from this data.
Within day reproducibility is just under 4% variance; variance between days is only
slightly higher than this, just over 4%. Both values are surprisingly low for this assay that
is notorious for its problems, and are well within acceptable limits for quantitative
analyses. Replacing visual colorimetric detection of endpoint with electrochemical
determinations may improve this reproducibility as well as method sensitivity.

77
Table 5a. Reproducibility of Iodometric titration for quantitating hydroperoxides. Values
presented below are averages of 5 replicates. *0.01024 N TS **0.00104 N TS
Cumene Hydroperoxide mls TS required for titration
With-in day Between Days
Mmols/rxn day 1 day 2 day 3 average stdev %COV
0.00472** average 4.03 4.19 4.11 0.11 2.71
stdev 0.17 0.13
%cv 4.26 3.14
0.00886** average 9.83 10.49 10.16 0.47 4.59
stdev 0.16 0.14
%cv 1.67 1.36
0.018* average 2.20 2.16 1.9 2.10 0.16 7.81
stdev 0.07 0.09 0.08
%cv 3.21 4.14 4.40
0.047* average 5.23 5.51 5.26 5.33 0.15 2.88
stdev 0.1823 0.07 0.17
%cv 3.4865 1.35 3.18
0.0767* average 8.38 7.94 8.10 8.14 0.22 2.74
stdev 0.51 0.60 0.26
%cv 6.05 7.54 3.27
Within day average % COV 3.84 Between Days average % COV 4.38

78
Table 5b. Reproducibility of Iodometric titration for quantitating hydroperoxides. Values
presented below are averages of 5 replicates. *0.01024 N TS **0.00104 N TS
t-Butyl Hydroperoxide mls TS required for titration
Within day (ml) Between Days
mmols/rxn day 1 day 2 day 3 average stdev %COV
0.0219* average 2.52 2.56 2.76 2.61 0.13 4.92
stdev 0.08 0.13 0.18
%cv 3.32 5.24 6.58
0.0585* average 6.63 6.00 7.14 6.59 0.57 8.67
stdev 0.13 0.28 0.54
%cv 1.90 4.71 7.52
0.0022** average 2.92 2.78 2.81 2.84 0.07 2.60
stdev 0.13 0.08 0.07
%cv 4.47 3.01 2.64
0.0058** average 8.73 8.83 8.72 8.76 0.06 0.69
stdev 0.11 0.13 0.08
%cv 1.25 1.48 0.96
Within day average COV% 3.59 Between days average COV% 4.22
Overall, results showed why iodometric titration remains the gold standard to
analyze hydroperoxides. However, oxygen and stirring must be controlled for accurate
analysis. How the reaction is run strongly affects reaction stoichiometry, accuracy, and
reproducibility. Results presented here prove that when there is strict control, the assay is
linear and stoichiometric. Problems with weak endpoint can cause you to miss early
oxidation products when levels are low. The assay may be time-consuming, and
cumbersome; and does not lend itself to automation, but since it is a simple titration most
labs would have the equipment necessary. This assay is least sensitive to low
hydroperoxide concentrations, which may overestimate induction periods, but it is the

79
only assay useful for direct analysis of high hydroperoxide concentrations(no extensive
dilution). High priority should be give to testing whether autotitrators can simplify the
sample handling and amperometric endpoints can increase the sensitivity at low
hydroperoxide concentrations.
5.2. Ferric Thiocyanate Assay for Hydroperoxides
There were various problems with the ferric thiocyanate procedure in the
beginning. The absorbance was much lower than expected (less than 2:1 stoichiometry),
so Fe3+
was not being formed. Results in lab were not matching the results in the
literature. In order to find the source of the problem several modifications were tested,
varying the. solvent, sources of Fe2+
(ferrous sulfate; ammonium ferrous sulfate) and
NH4SCN concentration (30% and 3 %; diluted in water and methanol). The issue of
acidity, order of addition of reagents, and solubility issues were also investigated. Two
papers in particular (Mihaljevic et al., 1996; Richards & Feng, 2000) were used as
guidelines because they suggested that concentration of hydroperoxide should not exceed
20 uM. It is possible that the higher [ROOH] was causing problems. The final procedure
presented in the Methodology section was based more on the Shantha & Decker Method
(modified official IDF standard Method 74A:1991) than the Mihaljevic paper because
results were closer to theoretical with 30% SCN than 3% SCN and adding Iron(II) and
SCN separately, rather than together.
Sensitivity and linearity of response:
Standard curves prepared from authentic Fe(III) appeared to be linear up to
optical limits of spectrophotometers (Figure 4). However, the FeSCN complexes are

80
intensely colored and have high extinction coefficients. Consequently, only very low
concentrations are needed to give absorbances greater than 1, the dependable detection
limit on most spectrometers. The upper limit with our Cary 50 spectrophotometer is
about 70 µM or 180 nmoles Fe3+
added. Assuming that each LOOH reacts with 2 Fe, the
upper limit for LOOH with our Cary 50 spectrophotometer is about 90 nmoles ROOH per
reaction (half of the upper limit of Fe3+
in Figure 4). For other spectrophotometers, the
upper limit is even lower. Using the full standard curve, the lower limit for most accurate
detection must be set at about 14 µM Fe3+
or 36 nmols of Fe3+
added. Again assuming
each LOOH reacts with 2 Fe, lower limit is about 18 nmoles of ROOH added (Figure 4).
The lower limit was set there because the slope of the response curve increases at
concentrations below this value (Figure 4). If using only the lower end of the standard
curve (<14 µM), the lower limit is much lower; about 3 µM Fe3+
or 10 nmoles Fe3+
added
(or 5 nmoles of ROOH added).
The actual reaction response for hydroperoxides was linear between 1 and 32 M
for CuOOH, and between 0.28 and 42 M for t-BuOOH (Figure 5).
Accuracy and stoichiometry of response:
Two factors can lead to errors in calculation when using this assay with mixed or
different hydroperoxides. As shown in Figure 5, the reaction response varied with the
hydroperoxide, with cumene-OOH showing stronger reaction than t-Butyl-OOH. As will
be shown in a later section, methyl linoleate hydroperoxide reaction is dramatically
stronger than either of these standard hydroperoxides.
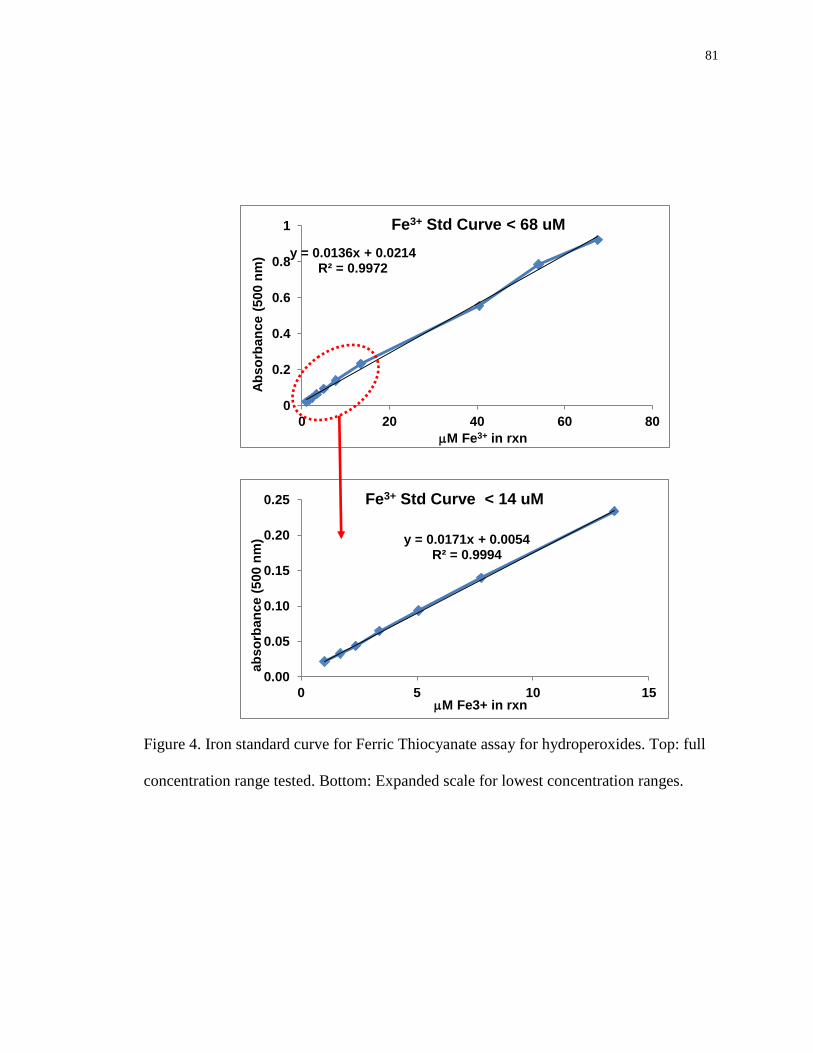
81
y = 0.0136x + 0.0214 R² = 0.9972
0
0.2
0.4
0.6
0.8
1
0 20 40 60 80
Ab
so
rban
ce (
500 n
m)
M Fe3+ in rxn
Fe3+ Std Curve < 68 uM
y = 0.0171x + 0.0054 R² = 0.9994
0.00
0.05
0.10
0.15
0.20
0.25
0 5 10 15
ab
so
rban
ce (
500 n
m)
M Fe3+ in rxn
Fe3+ Std Curve < 14 uM
Figure 4. Iron standard curve for Ferric Thiocyanate assay for hydroperoxides. Top: full
concentration range tested. Bottom: Expanded scale for lowest concentration ranges.

82
Figure 5. Reaction response of cumene and t-Butyl hydroperoxides in the FeSCN assay.
In addition, the calculated ROOH concentrations varied with the section of the
regression curve applied (Figure 6). Thus, applying the slope of the higher concentration
region (0.013) is probably accurate for that region but underestimates lower
concentrations (some values were negative). On the other hand, using the slope for the
lower concentration region underestimates the higher concentrations, and this
discrepancy increases with concentration.
Both phenomena can lead to significant interpretation errors when comparing
oxidation of oils/fats with different fatty acid compositions.
0.0
0.2
0.4
0.6
0.8
1.0
1.2
1.4
1.6
0 20 40 60 80
Ab
so
rban
ce (
500 n
m)
[ROOH] in rxn, M
cumene
t-butyl

83
-20
0
20
40
60
80
100
120
0 10 20 30 40 50 60 70
RO
OH
dete
cte
d,
uM
[ROOH] in rxn, M
CumeneOOH 1
t-BuOOH 2
CuOOH 2
t-BuOOH 1
Figure 6. Response stoichiometry of cumene and t-Butyl hydroperoxides in the FeSCN
assay. Curves labeled 1 were calculated using the slope of the upper region of the Fe3+
standard curve (0.013); curves labeled 2 were calculated using the slope from the lower
region of the standard curve (0.017).
In terms of stoichiometry, Table 6 show that the reaction stoichiometry differed
between hydroperoxides, was not constant with either ROOH concentration or direction
of change, and was less than the 2:1 expected theoretically in all cases except the highest
concentrations of CuOOH (also seen in Figure 6). CuOOH stoichiometry was at or near 2
and the highest concentrations but decreased dramatically as [CuOOH] decreased. t-
BuOOH stoichiometry never reached 2 at any concentration and, opposite to CuOOH,
was inversely related to [t-BuOOH] when the regression coefficient of the lower curve
was used for calculations. Since the second electron is consumed in RO reactions, we

84
may speculate that the reaction is controlled by the redox potential of individual
hydroperoxides in susceptibility to being reduced (Reaction 1) and by the redox potential
of the resulting alkoxyl radicals in mediating secondary oxidations (iron or solvent) in
reaction 2. This possibility will be discussed in more detail later.
Table 6. Stoichiometry of ferric thiocyanate reaction with cumene and t-Butyl
hydroperoxides with comparison of regression curves.
CuOOH: y=0.0136X+0.0214 y=0.017x + 0.0054
[ROOH] [ROOH] Stoichiometry [ROOH] Stoichiometry
reacted detected detected
(µM) (µM) (µM)
32.25 71.20 2.21 57.90 1.80
24.81 55.19 2.22 45.10 1.82
19.85 43.49 2.19 35.73 1.80
12.40 25.40 2.05 21.26 1.71
7.12 13.53 1.90 11.76 1.65
6.10 11.78 1.93 10.37 1.70
4.07 6.11 1.50 5.83 1.43
2.03 3.08 1.51 3.40 1.67
1.22 1.08 0.89 1.81 1.48
0.81 0.00 0.00 0.94 1.16
t-BuOOH: y=0.0136X+0.0214 y=0.017x + 0.0054
[ROOH] [ROOH] Stoichiometry [ROOH] Stoichiometry
reacted detected detected
(uM) (uM) (uM)
62.81 99.48 1.58 80.52 1.28
41.87 79.13 1.89 64.24 1.53
33.50 63.44 1.89 51.69 1.54
20.94 38.28 1.83 31.56 1.51
12.56 23.06 1.84 19.39 1.54
7.15 13.24 1.85 11.54 1.61
3.58 6.32 1.77 6.00 1.68
2.15 3.15 1.47 3.46 1.61
1.43 1.37 0.96 2.04 1.42
0.36 -0.01 -0.04 0.93 2.60
0.29 -0.14 -0.49 0.83 2.89

85
Reproducibility of response:
The complexation of ferric iron by thiocyanate showed excellent precision and
reproducibility, with an average coefficient of variance of 3.01% over all concentrations
(Table 7). In contrast, reactions of cumene and t-Butyl hydroperoxides were less
reproducible than the assays discussed above, with within-day and between-day COVs of
7.37 and 11.72%, and 5.75% and 19.78% respectively for CuOOH and for t-BuOOH.
Reasons for the inconsistency have not been identified yet, but probably are related to
complexity of the reaction system itself.
Table 7a. Reproducibility of ferric thiocyanate assay for hydroperoxides: ferric iron
standard. Three replicates per day. Fe3+ Std curve
Fe3+
Std Curve
µmoles absorbance moles absorbance µmoles absorbance
added added added
average 0.45 1.3594 0.11 0.5556 0.009 0.0648
stdev 0.0078 0.0174 0.0022
cov% 0.57 3.13 3.39
average 0.36 1.1740 0.04 0.2340 0.006 0.0438
stdev 0.0123 0.0002 0.0020
cov% 1.05 0.09 4.52
average 0.18 0.9215 0.02 0.1400 0.005 0.0330
stdev 0.0202 0.002 0.0011
cov% 2.19 1.37 3.34
average 0.14 0.7847 0.01 0.0937 0.003 0.0218
stdev 0.0082 0.004 0.0024
cov% 1.05 4.41 11.03
Within-day average COV 3.01%

86
Table 7b. Reproducibility of ferric thiocyanate assay for hydroperoxides: cumene
hydroperoxides. 5 replicates per day.
Cumene Hydroperoxide
Final conc. With-in a day (absorbance) Between Days
(µM) day 1 day 2 day 3 average stdev %cv
6.10 average 0.1858 0.1747 0.1844 0.1816 0.0060 3.31
stdev 0.0037 0.0052 0.0026
cov% 1.99 2.98 1.40
4.10 average 0.0805 0.1111 0.1218 0.1045 0.02 20.50
stdev 0.0091 0.0105 0.0035
cov% 11.29 9.4861 2.87
2.03 average 0.0671 0.0564 0.0662 0.0632 0.0060 9.45
stdev 0.0077 0.0064 0.0025
cov% 11.49 11.3990 3.79
1.22 average 0.0276 0.0355 0.0367 0.0361 0.0049 13.62
stdev 0.0037 0.0040 0.0027
cov% 13.29 11.19 7.31
Within day average COV 7.37% Between-days average COV 11.72%

87
Table 7c. Reproducibility of ferric thiocyanate assay for hydroperoxides: t-Butyl
hydroperoxides. 5 replicates per day.
t-Butyl Hydroperoxide
Final conc. With-in a day (absorbance) Between Days
(µM) day 1 day 2 day 3 average stdev %cv
7.15 average 0.1699 0.2436 0.1986 0.2015 0.0331 16.45
stdev 0.0067 0.0054 0.0047
cov% 3.95 2.22 2.38
3.58 average 0.0827 0.1199 0.1193 0.1073 0.0213 19.86
stdev 0.0045 0.0041 0.0022
cov% 5.46 3.46 1.81
2.14 average 0.0518 0.0844 0.0565 0.0642 0.01764 27.46
stdev 0.0023 0.0053 0.0008
cov% 4.52 6.22 1.43
1.43 average 0.0335 0.0457 0.0410 0.0400 0.0062 15.37
stdev 0.0055 0.0049 0.0043
cov% 16.39 10.64 10.56
Within day average COV 5.75% Between-days average COV 19.78%
Handling issues, quirks and precautions:
The ferric thiocyanate reaction gives results only at very low hydroperoxide
concentrations; hydroperoxide levels above the detection limit oxidize the complex and
the reaction appears not to run. Consequently, when samples give very low optical
absorbance with this reaction, they should be diluted sequentially and retested until a
reactive concentration is found. Only when no reactions are found even at lipid
concentrations below micromoles per reaction tube should a sample be considered to be
without hydroperoxides. In fact, we recommend that a range of concentrations routinely
be analyzed for each sample to make sure calculations are made in the linear response

88
range for the reaction. All solvents need to be sparged with argon and the reaction should
be completed in the dark.
5.3. Cayman Hydroperoxide Kit (Thiocyanate Assay)
The Cayman Assay kit may be run using a microplate reader or
spectrophotometer. The plate reader was chosen for this assay so that an assay for high
throughput could be evaluated. The first task was plate reader optimization. The Cayman
Assay states to run the assay at 500 nm. The plate reader came with a UV filter of 492
nm. In order to test whether this UV filter could be used, wavelengths were scanned
between 200 nm – 650 nm and between 200 nm – 800 nm. The highest point of the peak
for both was 504-507 nm, and it was only slight lower than absorbance at 492 nm
measured on another spectrophotometer. It was decided that 492 nm UV filter could be
used, though it must be noted that it is not the optimum wavelength. The plate reader
lamp energy used for this assay was 10,000; at energies higher than 20,000 absorbance
values began to decrease.
Sensitivity and linearity of response:
The Cayman Kit supplied a lipid hydroperoxide standard, 13-
hydroperoxyoctadecadienoic acid (13-HpODE), to construct a calibration curve. A
calibration curve using 13-HpODE was constructed from two different kits to compare
reproducibility. The calibration curves were run several months apart, and show similar
response (Figure 7). The dynamic range was between 0.5 – 5 nmols per assay which
matched the claim on the Cayman assay kit. Above 5 nmols per assay was not tested, so

89
it cannot be verified if this is the true upper limit. Samples with < 0.5 nmoles could not
be distinguished from the blank absorbance.
Figure 7. Reproducibility of standards and kits supplied for Cayman ferric thiocyanate
assay of hydroperoxides. Average of three replicates; two different kits run several
months apart.
When tested over the same concentration range (0 nmoles – 5nmoles per assay) to
compare responses, CuOOH showed slightly higher reactivity than t-BuOOH (Figure 8).
Both hydroperoxides had markedly lower reaction than the 13-HpODE standards (Figure
9), demonstrating that once again, the reaction response varied with the structure of the
hydroperoxides. This means that in samples with unknown or mixed hydroperoxides, it
cannot be determined whether differences in peroxide values result from differences in
peroxide structures or peroxide levels. There was a solubility problem with t-butyl
hydroperoxide which is water-soluble, but water interferes with this assay. t-BuOOH
appeared to dissolve in chloroform:methanol, but the possibility that the lower reaction
response of t-BuOOH resulted from incomplete solubilization cannot be excluded.
0.00
0.05
0.10
0.15
0.20
0 1 2 3 4 5 6
ab
so
rban
ce (
492 n
m)
nmol per assay
13-HpODE 1st kit
13-HpODE 2nd kit
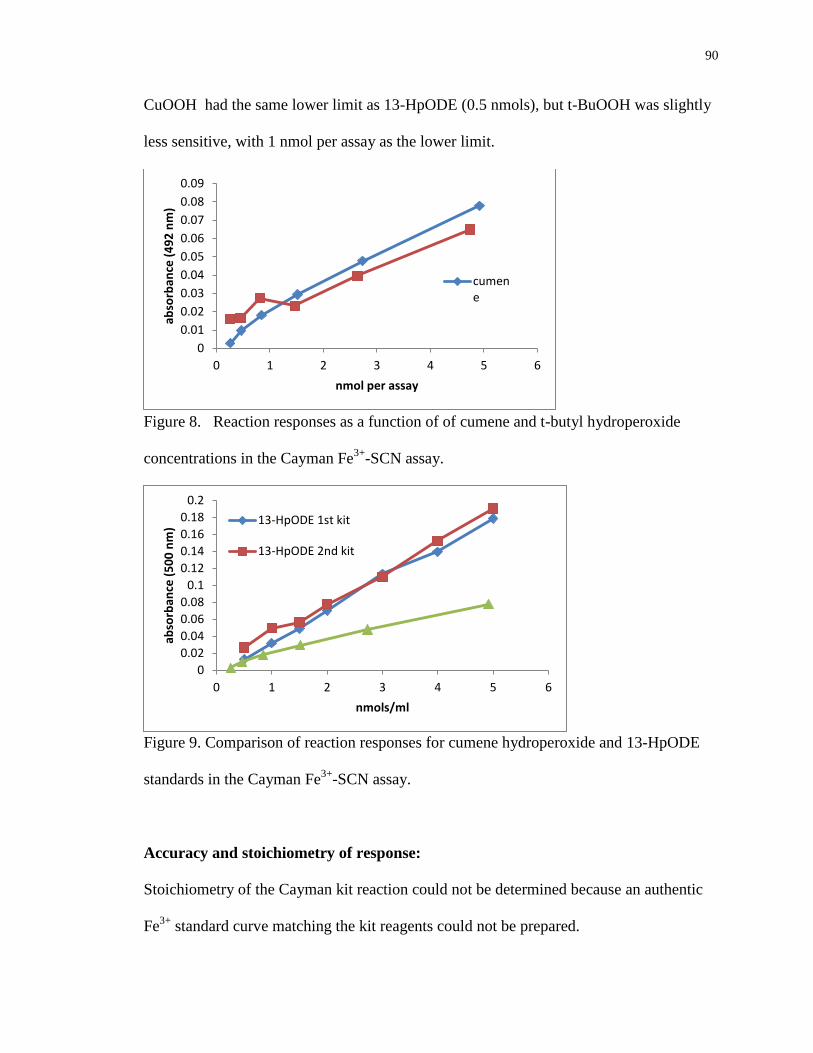
90
CuOOH had the same lower limit as 13-HpODE (0.5 nmols), but t-BuOOH was slightly
less sensitive, with 1 nmol per assay as the lower limit.
Figure 8. Reaction responses as a function of of cumene and t-butyl hydroperoxide
concentrations in the Cayman Fe3+
-SCN assay.
Figure 9. Comparison of reaction responses for cumene hydroperoxide and 13-HpODE
standards in the Cayman Fe3+
-SCN assay.
Accuracy and stoichiometry of response:
Stoichiometry of the Cayman kit reaction could not be determined because an authentic
Fe3+
standard curve matching the kit reagents could not be prepared.
0
0.01
0.02
0.03
0.04
0.05
0.06
0.07
0.08
0.09
0 1 2 3 4 5 6
abso
rban
ce (
49
2 n
m)
nmol per assay
cumene
0
0.02
0.04
0.06
0.08
0.1
0.12
0.14
0.16
0.18
0.2
0 1 2 3 4 5 6
abso
rban
ce (
50
0 n
m)
nmols/ml
13-HpODE 1st kit
13-HpODE 2nd kit

91
Reproducibility of response:
Within-day variability for lipid standards (13-HpODE) was low -- 3.5% for the
first kit with and 4.6% for the second kit (data not shown). Cumene and t-butyl
hydroperoxides showed similar reproducibility with within-day cov of ~3.6% (Table 8).
Between-day reproducibility was expectably somewhat lower: 5.3% for CuOOH and 6%
for t-BuOOH. This reproducibility is still well within acceptable limits for assays (usually
considered to be 10%), and was better than the original thiocyanate method.
Handling issues, quirks and precautions:
The solvent (chloroform) must be deoxygenated. The kit recommends use of
nitrogen, but argon is heavier and does not carry oxygen contamination. High background
absorbance (blank) indicates that solvent should be sparged longer with argon. The
standard lipid hydroperoxide (13-HpODE) should be stored at -80 C and held on ice
during preparation of standard curves to prevent degradation. Running a standard curve
with each set of samples should not be necessary.
It is very important to keep the tubes with reagents capped tightly and to cover the
plates with aluminum foil after samples are added to prevent evaporation. A plastic cover
cannot be used because the solvent will dissolve it. The reaction should be run in the
dark. Tap the side of plates to eliminate any bubbles that form during dispensing. Inspect
plate bottoms to be sure there are no scratches that can interfere with readings.
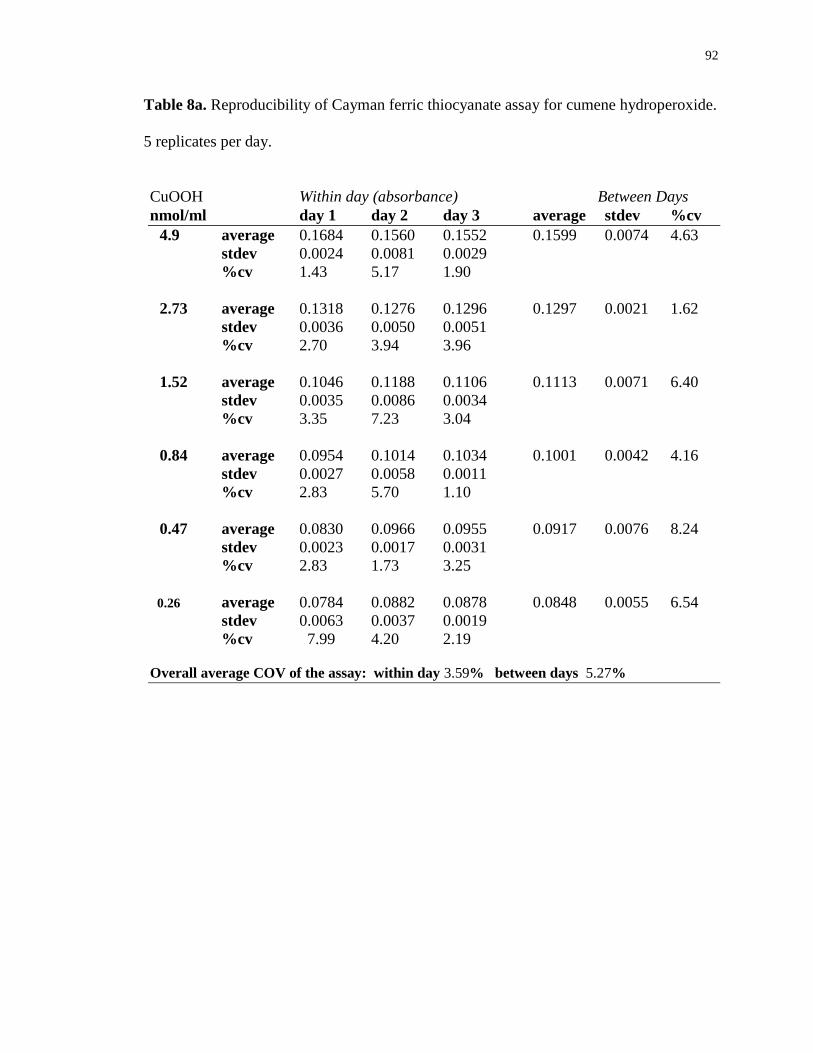
92
Table 8a. Reproducibility of Cayman ferric thiocyanate assay for cumene hydroperoxide.
5 replicates per day.
CuOOH Within day (absorbance) Between Days
nmol/ml day 1 day 2 day 3 average stdev %cv
4.9 average 0.1684 0.1560 0.1552 0.1599 0.0074 4.63
stdev 0.0024 0.0081 0.0029
%cv 1.43 5.17 1.90
2.73 average 0.1318 0.1276 0.1296 0.1297 0.0021 1.62
stdev 0.0036 0.0050 0.0051
%cv 2.70 3.94 3.96
1.52 average 0.1046 0.1188 0.1106 0.1113 0.0071 6.40
stdev 0.0035 0.0086 0.0034
%cv 3.35 7.23 3.04
0.84 average 0.0954 0.1014 0.1034 0.1001 0.0042 4.16
stdev 0.0027 0.0058 0.0011
%cv 2.83 5.70 1.10
0.47 average 0.0830 0.0966 0.0955 0.0917 0.0076 8.24
stdev 0.0023 0.0017 0.0031
%cv 2.83 1.73 3.25
0.26 average 0.0784 0.0882 0.0878 0.0848 0.0055 6.54
stdev 0.0063 0.0037 0.0019
%cv 7.99 4.20 2.19
Overall average COV of the assay: within day 3.59% between days 5.27%

93
Table 8b. Reproducibility of Cayman ferric thiocyanate assay for hydroperoxides:
t-butyl hydroperoxides. 5 replicates per day.
t-BuOOH Within day (absorbance) Between Days
nmol/ml day 1 day 2 day 3 average stdev %cv
4.75 average 0.1368 0.1498 0.1478 0.1448 0.007 4.83
stdev 0.0016 0.0058 0.00239
%cv 1.20 3.88 1.61
2.65 average 0.1166 0.1264 0.1156 0.1195 0.0060 4.99
stdev 0.0033 0.0059 0.00289
%cv 2.82 4.63 2.50
1.47 average 0.0998 0.1122 0.0974 0.1031 0.0079 7.70
stdev 0.0063 0.00130 0.0034
%cv 6.31 1.16 3.45
0.82 average 0.0994 0.1112 0.1112 0.1073 0.0068 6.35
stdev 0.0023 0.0034 0.0025
%cv 2.32 3.08 2.24
0.45 average 0.0912 0.0984 0.01 0.0965 0.0047 4.85
stdev 0.0048 0.0048 0.0024
%cv 5.22 4.90 2.45
0.25 average 0.0882 0.0998 0.01 0.096 0.0068 7.04
stdev 0.0121 0.0015 0.0022
%cv 13.78 1.49 2.24
Overall average COV of the assay: within day 3.63% between days 5.96%
94
5.4 Xylenol Orange – Pierce Assay Kit
Sensitivity of response:
The lower limit for cumene-OOH detection was 1-2 nmoles added, which agrees
with what the kit claims (Figure 10). Detection of t-Butyl-OOH was less sensitive, with a
lower limit of 7-8 nmoles added. The upper limit for the assay, based the instrument
limitations (most spectrophotometers are not accurate much above absorbance of 1.0-1.5)
was 45-50 nmoles for t-Butyl-OOH and 25-30 nmoles for cumene-OOH.
Linearity of response:
The Pierce kit warns that the hydrogen peroxide standard curve which they
recommend for aqueous systems is not linear over the entire concentration range of the
assay. Response curves for cumene and t-Butyl hydroperoxides and also the Fe3+
standard in the lipophilic system were not only non-linear, but were also difficult to fit
equations of any form (Figure 10).
Accuracy and stoichiometry of response:
A standard curve was generated from authentic Fe3+
to provide a more accurate
model of the reaction occurring in this solvent system. At low concentrations, the iron
standard and t-Butyl-OOH response curves were quite close. However, above about 25
nmol test compound in the reaction mixture, the iron response plateaued while the t-
Butyl-OOH response continued, albeit more slowly. The cumene-OOH response was far
greater than t-BuOOH or Fe3+
and markedly non-linear, especially at higher
concentrations. Thus, it is clear that much more complicated chemistry is occurring in the
CuOOH system. It is likely that Cu-O, which is a strong oxidizing agent, increases rate
of conversion of Fe2+
to Fe3+
at lower concentrations. At higher concentrations this

95
action is counterbalanced by peroxide bleaching of the XO-Fe complex; this is the region
where the curve slows and begins to level off.
The Pierce kit directions state that the Fe3+ and xylenol orange complex should
yield a purple color. Lab testing showed a bluish color only formed at 100-50 nmoles of
hydroperoxide added. At lower concentrations it turned into a muddy orange color. A
wavelengths scan (Figure 11) between 350-700 nm was run for just xylenol orange, and
then for cumene sample of 12.5 nmoles of added sample. At 560 nm there is a second
peak with a high enough absorbance for the cumene, which is the wavelength were the
Fe3+-
XO complex should be detected. This means that even though it is no longer a
blue/purple color a reaction is still occurring.
The irregularity of response and the huge difference in R group effect on
hydroperoxides reaction in this assay are of great concern. Both factors make it difficult
to actually calculate ROOH concentrations unless there is an exactly matched
hydroperoxide standard and concentrations are kept very low. Appropriate compounds to
use as standards for lipid hydroperoxides are a particular problem. C18-OOH standards
are commercially available at very high cost, but are not included in this kit (kit
recommends hydrogen peroxide). Until issues of standards can be resolved, we consider
this assay not acceptable for quantitative assays of lipid oxidation. It may, however, be
useful for comparative assays of comparable materials and, despite being a lipophilic
version, is probably more useful for hydrophilic systems than for lipid oxidation.
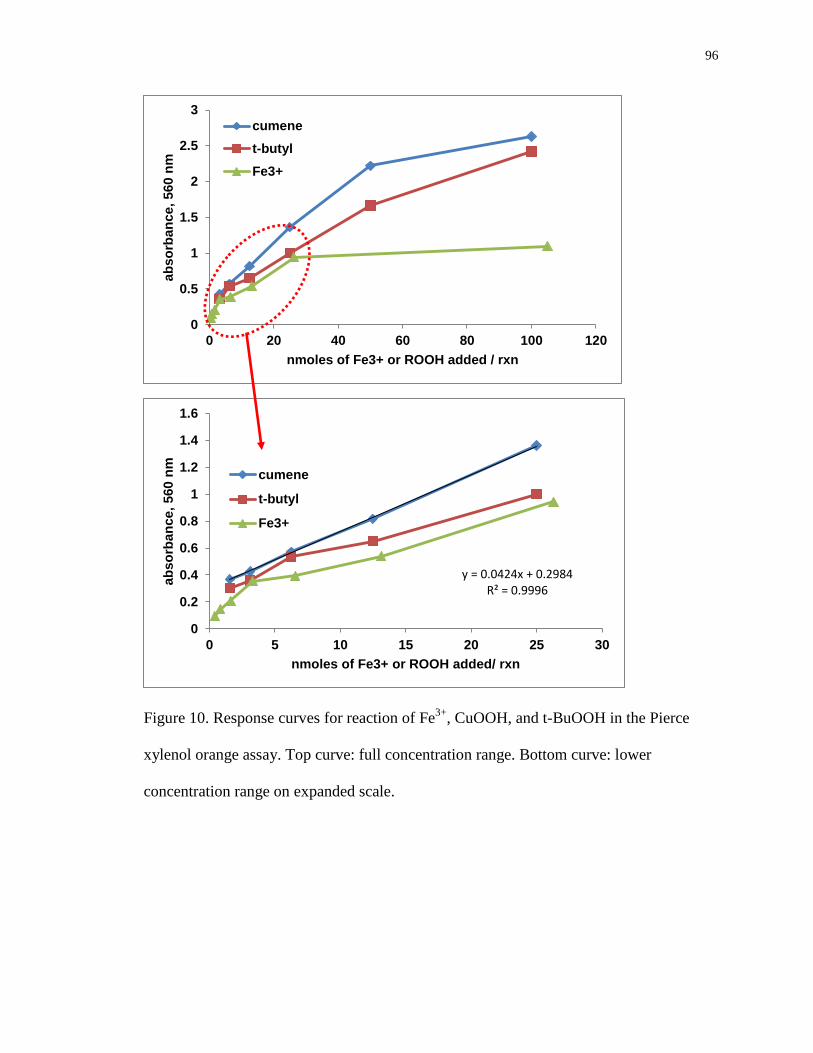
96
Figure 10. Response curves for reaction of Fe3+
, CuOOH, and t-BuOOH in the Pierce
xylenol orange assay. Top curve: full concentration range. Bottom curve: lower
concentration range on expanded scale.
0
0.5
1
1.5
2
2.5
3
0 20 40 60 80 100 120
ab
so
rban
ce,
560 n
m
nmoles of Fe3+ or ROOH added / rxn
cumene
t-butyl
Fe3+
y = 0.0424x + 0.2984 R² = 0.9996
0
0.2
0.4
0.6
0.8
1
1.2
1.4
1.6
0 5 10 15 20 25 30
ab
so
rban
ce,
560 n
m
nmoles of Fe3+ or ROOH added/ rxn
cumene
t-butyl
Fe3+

97
Figure 11. Optical spectra of xylenol orange blank and cumene hydroperoxide-XO.
Reproducibility of response:
Within day reproducibility of this assay is very good 1.4 and 2.5% for t-Butyl and
cumene hydroperoxides, respectively (Table 9). However, between-day variance is
notable larger than for the other assays. Possible explanation for variability are noted
below.
Handling issues, quirks and precautions:
Special note: High levels of peroxides bleach the dye and Fe-dye complexes,
causing inaccurate low absorbance readings. It is recommended that all samples be
analyzed over a range of dilutions, at least 1000x. If no reaction is obtained, continue
diluting sample to 106 dilution. If diluted samples have higher or similar readings to
undiluted samples, a bleaching effect has occurred and readings from the lowest
concentrations giving a color should be used for calculations.
0
0.5
1
1.5
2
2.5
3
250 350 450 550 650 750
ab
so
rba
nc
e
wavlength (nm)
cumene
xylenol orangeblank

98
Diluting cumene just in methanol creates substantial solubility problems that
result in lower absorbances than expected. Since cumene is somewhat soluble in water
(MSDS 1.5 g/ 100 ml), only the minimum methanol required to solubilize cumene-OOH
was used. Further dilution was then done with water, which gave higher absorbances.
Limiting methanol also minimized electron transfer differences between cumene and t-
Butyl hydroperoxides.

99
Table 9. Reproducibility of Pierce xylenol orange assay for hydroperoxides, using
standard cumene and t-Butyl hydroperoxides.
Cumene Hydroperoxide Within day (absorbance) Between Days
uM cumene-OOH day 1 day 2 day 3 average stdev %cv
250 average 1.4573 1.2746 1.3531 1.362 0.092 6.732
stdev 0.0664 0.0420 0.0536
%cv 4.5573 3.2953 3.9637
125 average 0.7959 0.8394 0.818 0.031 3.766
stdev 0.0230 0.0146
%cv 2.8952 1.7384
62.5 average 0.5902 0.5464 0.5815 0.573 0.023 4.052
stdev 0.0171 0.0028 0.0070
%cv 2.9030 0.5120 1.1994
31.25 average 0.4301 0.4089 0.4389 0.426 0.015 3.621
stdev 0.0127 0.0055 0.0094
%cv 2.9498 1.3400 2.1365
Within day ave COV 2.499 Between-day ave COV 4.543
t-Butyl Hydroperoxide
Within day (absorbance) Between Days
uM t-Butyl-OOH day 1 day 2 day 3 average stdev %cv
1000 average 2.34 2.49 2.43 2.42 0.08 3.17
stdev 0.04 0.05 0.09
%cv 1.92 1.81 0.37
500 average 1.55 1.82 1.62 1.67 0.14 8.50
stdev 0.02 0.03 0.03
%cv 1.09 1.78 2.06
125 average 0.62 0.71 0.62 0.65 0.05 8.16
stdev 0.01 0.02 0.003
%cv 1.53 2.18 0.45
31.25 average 0.35 0.37 0.36 0.36 0.01 2.56
stdev 0.01 0.001 0.004
%cv 2.36 0.30 1.02
Within day ave COV 1.40 Between-day ave COV 5.60

100
Pierce Xylenol Orange Summary:
Sensitivity and reproducibility of this assay are both lower than the parallel
xylenol orange assay in the Peroxy-Safe kit, and reaction responses are non-linear and
vary with hydroperoxide structure. Issues of solubility in this assay may make cumene-
OOH a poor choice for a standard (could not use methanol for dilution), while solubility
mismatch may eliminate t-Butyl hydroperoxide as an acceptable standard for lipid
hydroperoxides. In addition, high susceptibility of the XO-Fe3+
complex to bleaching by
ROOH means that a series of sample dilutions must be run for each assay to make sure
samples are in detection range. Until these issues can be resolved, we consider this assay
not acceptable for quantitative assays of lipid oxidation. It may, however, be useful for
comparative assays of comparable materials.
5.5. PeroxySafe Kit
Cumene and t-Butyl hydroperoxides were analyzed using the PeroxySafeTM
Standard kit from MP Biomedical, Solon, OH. Since all of the hydroperoxides tested
(including methyl linoleate) had to be diluted by several orders of magnitude for the STD
assay, there was no reason to test the higher sensitivity HSY kit that was designed more
for use with biological tissues. The kit assay was modified for delivery or reagents with a
micropipette instead of the calibrated autopipettors supplied with the kit. We found these
units to be inaccurate, irreproducible, and extremely wasteful of expensive reagents due
to the priming required, so we replaced them with direct pipetting of reagents using
micropipettors.

101
Sensitivity of response:
The technical sheets for all three SafeTest assays claim a working range of 0.01-
50 meq/kg. The working concentration range observed in lab testing was 2-12 nmols
ROOH in the sample added to the reaction, calculated against cumene hydroperoxide
standards provided in the kit (Figure 12). This corresponds to about 0.01 to 0.5 meq
ROOH/kg sample, so the assay is extremely sensitive but does not match the
manufacturer’s range specifications. Cumene and t-Butyl hydroperoxide had an upper
limit of about 9 nmoles per reaction and lower limit of < l nmoles/rxn.
Cumene-OOH response in the PeroxySafe assays was consistently about 12%
greater than the t-Butyl-OOH response (Figure 12). Whether this difference is a
solubility, steric, or chemical (e.g. inductive effects of chain length) issue is not yet
known. Chain length effects of R in ROOH need to be investigated further to determine
the potential variability among different lipid hydroperoxides. Variability of response
according to ROOH structure is not a problem when the same samples are being followed
over time or like samples are being compared. However, it is a distinct disadvantage and
can lead to erroneous conclusions when multiple sizes of ROOH are present (e.g. in
frying oils), when the nature of the hydroperoxides is unknown, or when samples with
different fatty acid composition are being compared.
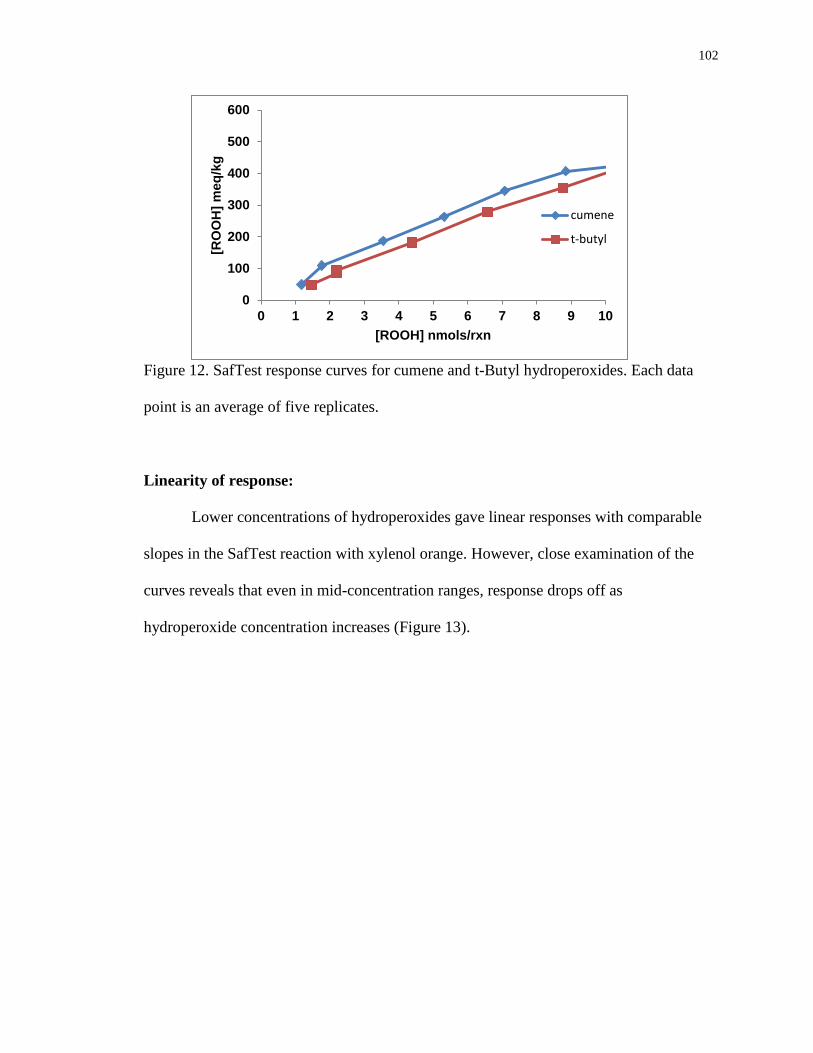
102
Figure 12. SafTest response curves for cumene and t-Butyl hydroperoxides. Each data
point is an average of five replicates.
Linearity of response:
Lower concentrations of hydroperoxides gave linear responses with comparable
slopes in the SafTest reaction with xylenol orange. However, close examination of the
curves reveals that even in mid-concentration ranges, response drops off as
hydroperoxide concentration increases (Figure 13).
0
100
200
300
400
500
600
0 1 2 3 4 5 6 7 8 9 10
[RO
OH
] m
eq
/kg
[ROOH] nmols/rxn
cumene
t-butyl
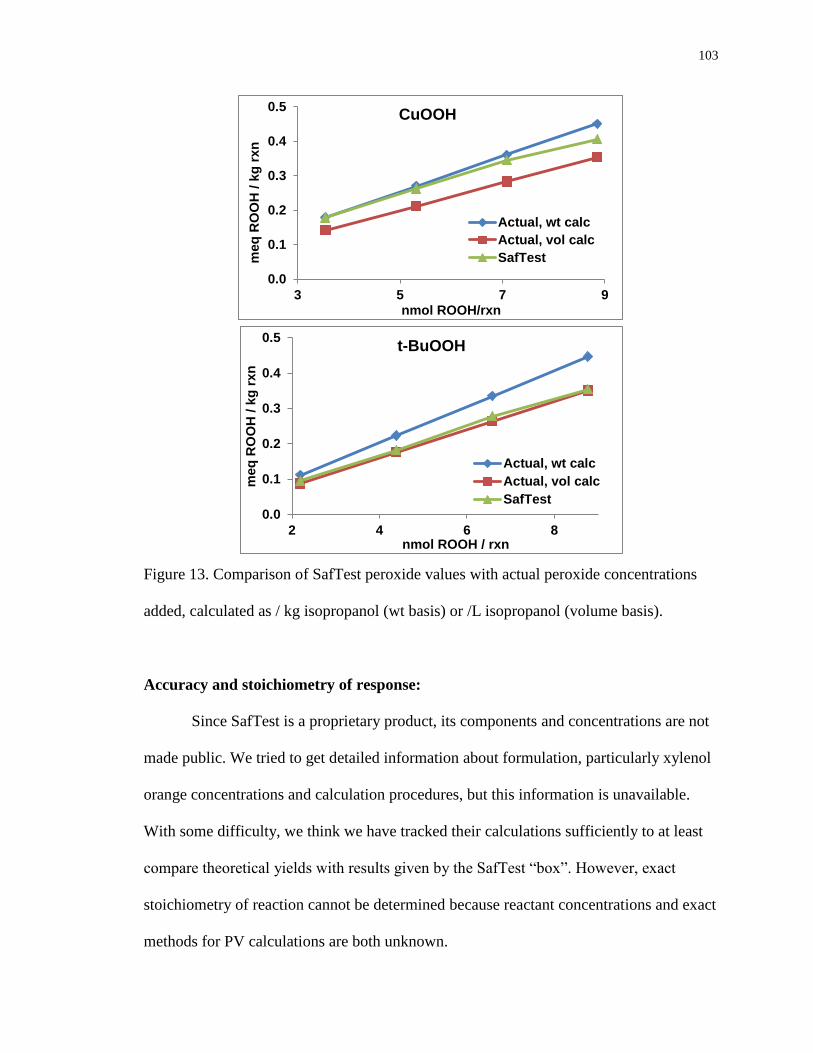
103
0.0
0.1
0.2
0.3
0.4
0.5
2 4 6 8
meq
RO
OH
/ k
g r
xn
nmol ROOH / rxn
t-BuOOH
Actual, wt calc
Actual, vol calc
SafTest
Figure 13. Comparison of SafTest peroxide values with actual peroxide concentrations
added, calculated as / kg isopropanol (wt basis) or /L isopropanol (volume basis).
Accuracy and stoichiometry of response:
Since SafTest is a proprietary product, its components and concentrations are not
made public. We tried to get detailed information about formulation, particularly xylenol
orange concentrations and calculation procedures, but this information is unavailable.
With some difficulty, we think we have tracked their calculations sufficiently to at least
compare theoretical yields with results given by the SafTest “box”. However, exact
stoichiometry of reaction cannot be determined because reactant concentrations and exact
methods for PV calculations are both unknown.
0.0
0.1
0.2
0.3
0.4
0.5
3 5 7 9
meq
RO
OH
/ k
g r
xn
nmol ROOH/rxn
CuOOH
Actual, wt calc
Actual, vol calc
SafTest

104
Particularly problematic is PV calculation method. PeroxySafe reports PVs as
meq ROOH /kg sample (i.e. isopropanol). Thus, for comparing actual concentrations of
ROOH added with those reported by these SafTests, methods for conversion must be
known. Since isopropanol has a density notably lower than water (0.786), conversion of
the initial sample to kg isopropanol should mean larger adjustment than volumetric
(conversion to liter isopropanol) since 1 kg isopropanol = 1272 ml. The exact basis for
the SafTest calculations is not clear (even from the company). Evaluating raw data
printed out from the SafTest unit suggests that weights added to a sample are adjusted for
isopropanol density (0.786) and multiplied by 40,000 dilution (the number of sample vol
units/L, or 1000/0.025) to obtain the final meq/kg reported by the instrument. This gives a
net multiplication factor of 50890 for conversion. However, some data were apparently
only multiplied by a factor of 40000, which is simple volume conversion to ROOH /L
isopropanol.
Obviously, the two conversions give different results, as shown in Table 10 and
Figure 13. For weight conversions, hydroperoxide concentrations were underpredicted by
SafTest, cumene-OOH only slightly but t-Butyl-OOH by up to 26%. In contrast, volume
conversions overpredicted hydroperoxide concentrations, by up to 21% for t-Butyl
hydroperoxide. It can be argued that these differences are very small on an absolute
basis, but the inconsistencies and uncertainties are certainly sufficient to rule out SafTest
as an accurate assay for absolute quantitation of hydroperoxides.

105
Table 10 . Detection efficiency of Peroxy-Safe assay for lipid hydroperoxides.
actual ROOH (meq/kg ROOH) measured ROOH
CuOOH calc by wt calc by vol SafTest
nmol added *50890 % SafTest *40000 % SafTest (meq/kg)
3.54 0.1803 100.91 0.1417 79.32 0.1787
5.31 0.2705 102.71 0.2126 80.73 0.2633
7.08 0.3605 104.40 0.2834 82.06 0.3453
8.86 0.4507 111.00 0.3542 87.25 0.4060
t-BuOOH
2.19 0.1116 117.08 0.0877 92.03 0.0953
4.39 0.2232 122.88 0.1755 96.59 0.1817
6.58 0.3349 120.16 0.2632 94.45 0.2787
8.77 0.4465 126.01 0.3509 99.04 0.3543
Reproducibility of response:
Reproducibility and linearity drops off at less than 2 nmols/rxn and greater than 9
nmols/rxn (for cumene-OOH), so reproducibility tests (5 replicates each concentration *
3 days) were conducted within these concentration limits. Reproducibility data is reported
Table 11. The SafTest software flags samples on the computer screen when the
coefficient of variation (%CV) is greater than 10%. This indicates the assay should be
repeated, perhaps with dilution. The average within-day reproducibility for t-Butyl
hydroperoxide was 2.74% and between days was 7.1 %. The average reproducibility for
cumene hydroperoxide was 2.66% within-day 4.65% between days. Within-day
reproducibility was lower because a single batch of standards and reagents were used
within a very short time (minutes), whereas even with great care in handling and argon
sparging of reagents, reagents changed slightly between days.

106
Table 11a. Reproducibility of Peroxy-Safe assay for lipid hydroperoxides.
Cumene Hydroperoxide Within days (meq/kg) Between Days (meq/kg)
nmols/rxn day 1 day 2 day 3 average stdev %cov
3.54 average 0.20 0.17 0.19 0.19 0.01 6.97
stdev 0.01 0.003 0.01
%cv 5.10 1.70 3.20
5.32 average 0.25 0.28 0.26 0.26 0.01 4.96
stdev 0.01 0.01 0.01
%cv 3.50 2.700 3.100
7.09 average 0.33 0.36 0.35 0.35 0.02 4.43
stdev 0.003 0.01 0.01
%cv 0.90 2.80 2.400
8.86 average 0.40 0.40 0.42 0.41 0.01 2.26
stdev 0.01 0.01 0.01
%cv 2.50 2.50 1.50
Within day Ave %COV 2.66 Between Days Ave % COV 4.65
Table 11b. Reproducibility of Peroxy-Safe assay for lipid hydroperoxides.
t-Butyl Hydroperoxide Within days (meq/kg) Between Days (meq/kg)
nmols/rxn day 1 day 2 day 3 average stdev %cov
2.193 average 0.11 0.09 0.10 0.10 0.01 10.51
stdev 0.003 0.003 0.003
%cv 2.90 3.50 3.20
4.396 average 0.18 0.17 0.20 0.18 0.01 7.81
stdev 0.01 0.01 0.01
%cv 4.00 2.70 2.80
6.589 average 0.28 0.26 0.30 0.28 0.02 6.51
stdev 0.01 0.01 0.004
%cv 2.30 2.70 1.30
8.770 average 0.36 0.34 0.36 0.35 0.01 3.57
stdev 0.01 0.02 0.01
%cv 1.30 4.60 1.40
Within day Ave %COV 2.73 Between days Ave %COV 7.10

107
Handling issues, quirks and precautions:
The PeroxySafe test is very sensitive, so dilutions in Prep Reagent are normally
required to bring expected ROOH concentrations into working range of the assay when
analyzing food oils or lipid extracts. In fact, however, the directions to dilute is a gross
understatement of the requirement because excessively high levels of hydroperoxides
bleach the Fe-XO complex and can eliminate detectable reaction almost altogether. In
such cases, not even the Lo or Hi messages from SafeTests may catch the error. To avoid
missing hydroperoxides, we thus recommend, especially when working with unknowns
(e.g. food oils or lipid extracts), that samples be diluted to at least three concentrations
that are each at least one order of magnitude different to make sure the sample is
detected. Frequently, even further dilution is required.
MP Bio uses cumene hydroperoxide as their standard. When standards are fresh,
the slope of the regression equation for the standard curve is very close to 1, but during
even short-term storage there was a gradual and continual decrease in the slope of the
SafTest standard curves. MPBio revealed that the standards were “stabilized” cumene
hydroperoxide. There is no mention of this problem with the directions of the kit, but
when the standard response drops, the SafTest overestimates very low peroxide
concentrations and increasingly underestimates actual peroxide values as the LOOH
concentration increases. An example of this is shown for a standard curve with m=0.79 in
Figure 14. Thus, for accurate and reproducible results with this assay, it is critical to
monitor the slope of the standard curve daily, and if necessary, substitute authentic
CuOOH standards for the MP Bio reagents. The standard curve of the calibrators is

108
considered adequate as long as the slope remains close to 1; actual acceptable values
must be determined by the deviation from absolute quantitation tolerable for each
individual application.
Figure 14. SafTest reported values for CuOOH reaction vs theoretical values (weights of
standards) assuming that SafTest calculations are based on a sample weight of 25 µl
isopropanol. Other calculation procedures attempted to account for sample weight do not
give values anywhere close to reported PVs. Slope of standards: 0.79.
SafTest Summary:
There are numerous advantages to the PeroxySafe test. It is fast, easy, with
minimal sample preparation since reagents are prepared and standardized. Unlike
iodometric titration where only one sample can be run at a time, it is very easy to run
multiple samples in this case. However, it has several important shortcomings. First, the
autodispensers supplied with the kit are inaccurate so they need to be replaced with
micropipettes. Also, it is a very sensitive assay (advantage), but this also means most

109
food extracts and oils must be diluted by 10-100 or more times to bring the response into
range (excess peroxide leads to low or no response). Failure to dilute sufficiently can fail
to detect hydroperoxides. Most importantly, however, the stoichiometry is unclear
because reagent concentrations and exact calculation methods in the kit are unknown and
the response level varies with the structure of ROOH. What this means is the assay may
be used to determine or follow relative hydroperoxide concentrations in samples of the
same or similar composition and structure, but it cannot provide absolute hydroperoxide
concentrations and cannot be used to compare hydroperoxides of mixed, unknown, or
very different structures. There is also the negative issue of high kit cost and short
lifetime of reagents to consider.
5.6. Triphenylphosphine/ HPLC Assay of Cumene Hydroperoxide
Nakamura & Maeda published a method that claimed stoichiometric oxidation of
triphenylphosphine (TPP) to triphenylphosphine oxide (TPPO) by hydroperoxides and
detection of products by HPLC (Nakamura & Maeda, 1991). Their procedure was
adapted and preliminary testing on cumene hydroperoxide was completed.
Several modifications were made to the procedure. The original assay agitated the
mixture constantly at 30 C. Testing showed that this mixing was not necessary – HPLC
peak areas of tubes heated in a water bath with and without shaking or vortexing were the
same (data not shown). The original method used a 30 minute reaction time even though
the reaction reached a plateau at about 10 minutes. Reactions of cumene hydroperoxide
after 10 and 30 minutes gave the same response, but to ensure a complete reaction all
subsequent reactions were run for 20 minutes.
110
A reaction curve for cumene hydroperoxide constructed over the range of 0.005
nmoles (5 pmoles) to 10 nmoles showed that upper limit of reaction about 5 nmoles
(curve departed from linear above this concentration) and lower limit of 5 pmoles (Figure
15). The response was linear even at the lowest concentrations and showed good
reproducibility: within-day variation 0.5-1 % and between day variability 4-5% (Table
12). The 13% COV for one concentrations was likely caused by pipetting error since all
other concentrations gave low variation.
TPP reactions with t-BuOOH and methyl linoleate hydroperoxides could not be
analyzed. T-BuOOH was too hydrophilic to dissolve in cyclohexane (even as little as 50
ul in 1000 ul). MLOOH was soluble but the HPLC had technical problems that were not
resolved before completion of this project. Nakamura found good correlation between
this HPLC method and iodometric titration for detecting hydroperoxides in various oils
and methyl linoleate (Nakamura & Maeda, 1991). At low oxidation levels, the two
methods showed good agreement, but at higher hydroperoxide levels the TPP reaction
leveled off and peroxide values were lower than those obtained by iodometry. The
discrepancy was attributed to differences between the reducing abilities of KI in acidic
medium (chloroform:acetic acid) vs TPP in cyclohexane. Further evaluation and
development of this assay seems warranted.

111
Figure 15. Response curve for cumene hydroperoxide with triphenylphosphine. Each
point is the average of three analyses.
Table 12. HPLC peak area of TPPO formed in reaction of cumene hydroperoxide with
TPP. Average of 3 analyses.
nmol CuOOH Peak Area Std Dev COV (%)
2 2073147 37221 1.80
1 1096038 65464 5.97
0.5 605149 27424 4.53
0..2 345071 45955 13.32
0.1 199145 9577 4.81
0.05 144258 8254 5.7
y = 901706x + 73675 R² = 0.9982
0
500000
1000000
1500000
2000000
2500000
3000000
3500000
4000000
4500000
5000000
0 1 2 3 4 5 6
Peak A
rea
nmoles of cumene reacted
TPP Rxn with CuOOH

112
5.7. Application of Assays to Determination of Hydroperoxides in Oxidized Methyl
Linoleate
5.7.1. Iodometric Titration
The titration method successfully differentiated increasing levels of
hydroperoxides in methyl linoleate oxidized for 4, 9, and 13 days with very low
variability (Table 13). Results of this project show that when reaction conditions are
carefully controlled, particularly deoxygenation, and adequate agitation, the iodometric
titration method is the most accurate method for quantitating hydroperoxides, even if it
has sensitivity limitations, so methyl linoleate PV’s determined by this method were used
as a standard against which all other assays were compared.
Table 13. Methyl Linoleate – Iodometric Titration. Three different concentrations; three
replicates
Titration w/ TS Day 4 Day 9 Day 13
Average meq/kg ML 304.012 1313.211 3153.201
Stdeva 6.182 27.894 39.389
cv% 2.033 2.124 1.250
5.7.2. PeroxySafeTM
Xylenol Orange Assay
The PeroxySafe assay showed greater variability with methyl linoleate than with
the two test hydroperoxides (CuOOH and t-BuOOH), and the variability increased with
oxidation -- 6.29% cov on day 4 and >10% after day 9 (Table 14). Greater variability
may be expected for ML since it is a natural material and probably does not oxidize
homogeneously throughout the sample. However, there probably are also reaction issues
also contributing to the variability since the peroxide values normalized to 1 kg varied

113
with sample size. Especially with higher oxidation (longer incubation time), peroxide
values generally increased with sample size and the normalized peroxide values were far
in excess of what would be theoretically possible for the weights of ML analyzed. The
stoichiometry of the PeroxySafe assay is nominally two mols Fe3+
generated per mol
hydroperoxide, and the calculated PVs must be adjusted for this. However, for the
PeroxySafe PVs to be comparable to the Iodometric titration PVs requires assumption of
a stoichiometry of about 4. If this is accurate, then the ML alkoxyl radicals react with the
isopropanol in the SafTest Prep Reagent, augmenting the overall reaction. This is perhaps
not surprising since the redox potential of ML alkoxyl radicals is higher than Cu-O and
t-Bu-O and isopropanol is particularly prone to formation of hydroperoxides. Two
additional Fe3+
could be generated by the following reactions:
LO + IPA LOH +
IPA
Fe2+
+ IPA + H
+ IPA
+ Fe
3+
IPA + O2
OOIPA
OOIPA + Fe
2+ Fe
3+ +
OOIPA
Variable and uncertain stoichiometry is a serious problem with this and the other optical
assays for hydroperoxides.
A second potential source of error leading to erroneously high lipid peroxide
values is that this assay uses cumene hydroperoxide to prepare standard curves. Reaction
response of CuOOH is much less than ML hydroperoxides, so using the CuOOH
standards supplied with the kit will significantly overestimate peroxide levels in the lipid.
Removing this excess calculation may drop the values to the 2:1 stoichiometry expected
for this reaction.

114
Table 14. Detection of ML hydroperoxides by the PeroxySafeTM
assay. Values are
averages of three replicates.
Day 4 Day 9 Day 13
µmole added meq/kg ML µmole added meq/kg ML µmole added meq/kg
0.03 1473 0.008 5096 0.008 11370
0.05 1605 0.010 4545 0.009 12713
0.06 1716 0.013 4755 0.013 13064
0.08 1636 0.200 5852 0.015 14545
Avg 1608 Avg 5062 Avg 12923
Stdev 101.16 Stdev 573.45 Stdev 1304.93
COV (%) 6.29 COV(%) 11.32 COV(%) 10.10
5.7.3. Pierce Xylenol Orange Assay
The Iodometric titration gave peroxide values that varied little with ML samples
size analyzed; PeroxySafe assay showed greater variability but peroxide values were
sufficiently comparable to justify averaging values from different sample sizes. In
contrast, PVs varies markedly with sample size in the Pierce xylenol orange assay, and
detected values were more than an order of magnitude lower than the other two assays
(Table 15). Sample sizes had to be reduced with incubation time to keep the PVs in
detection range, and bleaching occurred at lipid concentrations ≥0.30 µmoles ML leading
to lower apparent PVs on all three days. In hindsight, ML samples should have been
diluted at least another few orders of magnitude to drop below the bleaching limit.
These results demonstrate quite pointedly that a sample concentration range
must be analyzed for this assay to ensure accurate results; they also illustrate the
inaccuracies that would result from using a single fixed sample size for analysis of all
oxidation ranges. This would hold whether sampling products with unknown oxidation
levels off the shelf or following oxidation of a sample over time.

115
Table 15. Detection of ML hydroperoxides by the Pierce Xylenol Orange assay. Values
are averages of three replicates.
Day 4 Day 9 Day 13
µmole added meq/kg ML µmole added meq/kg ML µmole added meq/kg ML
0.06 41.16 0.03 86.30 0.03 192.05
0.15 47.93 0.06 43.25 0.06 274.67
0.30 41.99 0.15 102.96 0.30 222.18
3.01 20.16 0.3 105.47 0.50 148.30
6.04 10.91 1.0 61.36 30.19 2.32
5.7.4. Ferric Thiocyanate Assay
That the ferric thiocyanate method is very sensitive and works best at nanomolar
hydroperoxide concentrations was shown clearly in reactions of this assay with oxidized
ML (Table 16). Responses as a function of ML concentration were linear (R2=0.9998)
and most accurate when the hydroperoxide levels were lowest (Day 4). Although the raw
peroxide values generated in the assay are higher than iodometric titration PV’s, when
adjusted for 2:1 stoichiometry, the net values were notably lower than for iodometric
titration. Concentration curves departed from linear and the coefficient of variation
increased as oxidation progressed and hydroperoxides increased. Thus, as was shown for
xylenol orange assays, appropriate extensive dilutions are critical for obtaining accurate
results from this assay.

116
Table 16. Detection of ML hydroperoxides by the ferric thiocyanate assay. Values are
averages of three replicates.
Day 4 Day 9 Day 13
µmole added meq/kg ML µmole
added
meq/kg ML µmole
added
meq/kg
ML
0.01 172.16 0.01 1763.15 0.01 3833.40
0.06 370.28 0.04 2079.51 0.03 5034.85
0.10 584.66 0.06 2066.46 0.04 3758.27
0.30 593.21 0.1 1776.68 0.06 4199.89
0.60 613.70
Day 4 Day 9 Day 13
average meq/kg ML 597.19 1970.88 4331.01
Stedeva 14.92 176.97 648.31
cov% 2.50 8.98 14.97
5.7.5. Cayman Kit - Thiocyanate Assay
Results show that reaction only works at the lowest hydroperoxide concentrations
and becomes increasingly inaccurate as oxidation progresses and samples must be diluted
further and further to keep the assay in range. On each analysis day, dilution curves
increased to some maximum then decreased as samples were progressively diluted. Initial
dilutions abate some of the color quenching by the excess hydroperoxides, while at
concentrations below peak, hydroperoxide levels were too low for efficient reaction –
hydroperoxides had to diffuse too far to reach an iron atom. Saturation and FeSCN
quenching was seen even at the lowest hydroperoxide levels. As was seen before, the
concentration needed to accurately analyze hydroperoxides change with the incubation
day and level of oxidation. This is a distinct disadvantage because appropriate dilution for
each sample must be determined independently by serial dilution. Our results suggest that
samples should be diluted until the PVs reach a peak and then decrease. The peak value
should then be used as the most accurate reflection of the peroxide contents. However,

117
this practice adds an additional complication: multiplying results by very large dilution
factors gives peroxide values that are far in excess of what is possible for the materials. If
these high values results because the [lipid] hydroperoxides are reacting with solvents to
create new radicals and hydroperoxides, as has been discussed above, the assay is too
inaccurate and too uninterpretable to be used with foods where PV’s of at least 0.5-1 are
characteristic of “fresh” materials and oxidized foods reach PV’s of 10 or more.
Table 17. Detection of ML hydroperoxides by the Cayman ferric thiocyanate assay.
Values are averages of three replicates.
Day 4 Day 9 Day 13
nmole added meq/kg ML nmole added meq/kg ML nmole added meq/kg ML
30.19 146.47 1.50 1051.55 0.01 753191.50
60.38 181.73 3.02 546.64 0.03 130817.47
167.72 192.73 6.04 972.26 0.15 30336.30
301.90 139.52 30.19 541.84 0.76 4898.87
754.75 125.03 60.38 465.48 1.50 4118.56
3.02 2236.62

118
5.8. Comparison of Assays
The concentration ranges detected by each assay are listed in Table 18. The
triphenylphosphine assay is the most sensitive, detecting picomoles of hydroperoxides,
while Iodometric titration is the only assay that accurately quantitates high concentrations
of hydroperoxides. What is more, it does so directly with minimal sample dilution.
Table 18. Comparison of detection ranges for various hydroperoxide assays.
Assay ROOH Detection Range
Iodometric Titration 2-200 µmoles added
PeroxySafe 2-12 nmoles added
Xylenol Orange – Pierce 0.8- 50 nmoles added
Ferric Thiocyanate 5- 90 nmoles added
Cayman Assay( Ferric thiocyanate) 0.5- 5 nmols added
Comparison of hydroperoxides detected in common samples of oxidized methyl
linoleate are presented in Table 19. Iodometric titration with thiosulfate (TS) is used as
the base against which other assays are compared. Assay values are PVs determined
directly from the assay without consideration of reaction stoichiometry. Comparing these
values, all of the optical assays except the Pierce assay greatly overestimate peroxide
levels. Samples probably require further dilution for accurate analysis in the Pierce assay.
Adjusting these values for expected stoichiometry or using the maximum PV obtained in
dilution series brings comparative levels of the assays into better agreement with
iodometric titration, although now values are generally lower. Overall, these results
suggest that carefully controlled iodometric titration is the best and most accurate assay,
and also the only one that yields absolute concentrations of hydroperoxides. This assay

119
thus continues to be the gold standard, and efforts to refine endpoint detection should be
given high research priority.
Table 19. Comparison of methyl linoleate hydroperoxide levels detected by the various
assays.
Assay values Adjusted for stoichiometry
Day 4 Day 9 Day 13 Day 4 Day 9 Day 13
TS 304 1313 3153
Peroxy Saf 1608 5063 12923
assume 2 Fe/LOOH 804 2532 6462
assume 4 Fe/LOOH 402 1266 3231
Pierce 42 105 222
FeSCN
ave PV, 2 Fe/LOOH 597 1971 4331 299 986 2166
use max PV 614 2030 5035 307 1015 2518
Cayman 193 1052 7532 97 526 3766

120
6. SUMMARY AND CONCLUSIONS
Hydroperoxide quantification assays have been used for decades. Nevertheless, as
the results of this project have demonstrated, they remained plagued by handling,
reaction, and stoichiometry problems. One of the biggest issues is when a scientist selects
an assay blindly - whether standardized methods, methods cited in literature, and kits
purchased – without thinking about the sensitivity, stoichiometry, detection ranges, and
side reactions of the assay. In this study, protocols were evaluated with all these issues, as
well as any handling quirks and limitations, in mind.
Detection range of assays is crucial, as shown in the comparison of detection
ranges for the different assays (Table 18). The xylenol orange and ferric thiocyanate
assays were first developed to detect trace hydroperoxide levels in solvents or biological
tissues, and only later were adapted to food. Lipid extracts of food samples must be
extensively diluted to reach these trace detection ranges; with inadequate dilution,
samples can appear to have no or low lipid oxidation even in fact hydroperoxide levels
are quite high.
Along with inappropriate detection range, assaying a single sample size can also
give incorrect results, especially when degree of oxidation is unknown or oxidation is
being followed in samples over time – the amount of sample required for the assay is
constantly changing and must be determined empirically for each sample. To find the PV
accurately, samples must be serially diluted until PVs reach a peak (bleaching effect
eliminated) and then continually decreases, indicating that molecular migration rather
than reactivity now controls the reaction. The peak PV in such a dilution series can be
taken as the most accurate reflection of the actual peroxide value.

121
In terms of handling, critical factors include:
All solutions, solvents, and reagents must be deaerated to exclude oxygen and limit
side redox reactions.
Light exposure must be limited to prevent hydroperoxide and reagent degradation.
The iodometric titration method has always been considered the gold standard of
hydroperoxide assays but not very sensitive, empirical, and difficult to make
reproducible. Results of this study agree with all these points but show that with strict
control (ie: removal of oxygen, rigorous stirring, protection from light), accurate and
highly reproducible results are attainable. Most importantly, the iodometric titration is
only assay tested where the stoichiometry is clear (1:1) and independent of hydroperoxide
structure, and potential side reactions can be eliminated as long as oxygen is excluded. It
may be possible to overcome the issue of low sensitivity due to weak endpoint
electrochemical titration, as will be further discussed in the future work section. The
triphenylphosphine assay also shows promise because of its high sensitivity (0.5 nmol),
selectivity and simple stoichiometry, but needs further evaluation.
Both assays using ferrous iron to decompose hydroperoxides, followed by
complexation of the generated Fe3+
by some agent have complicated stoichiometry that is
unclear, greater than 1:1, and changes with conditions, solvent, hydroperoxide level, and
hydroperoxide structure. As hydroperoxide concentrations increase, both reactions
become increasingly affected by side reactions with solvent that augment apparent
hydroperoxide levels and also bleaching of the iron complexes that decrease apparent
PVs; hence, there is always significant uncertainly in the hydroperoxide levels being
detected. These factors present significant limitations when using these assays to obtain

122
absolute hydroperoxide concentrations (not possible) or comparing samples that differ in
composition (different peroxide structures) or oxidation levels. Results of this study
suggest that the xylenol orange and Fe3+
thicyanate assays can be used only for
determination of relative concentrations in foods and only when samples are serially
diluted to appropriate levels.
7. FUTURE WORK
A major recommendation is to find methods for improving the sensitivity of the
iodide reaction (thiosulfate titration). One option is to use electrochemical instead of
visual endpoints. A second is to adapt procedures for colorimetric assays. The two major
drawbacks of the iodometric titration method are the need to eliminate oxygen and
insensitive visual endpoints. Several papers have proposed methods adapting the iodide
reaction to spectrophotometric methods. The method described by Lovaas (Løvaas, 1992)
was investigated because the author claims to greatly reduce the interference of oxygen,
and the assay appeared fast and simple to perform. Compared to other versions of the
assay; it was completed in low acid and and Fe2+
was added to accelerate I3
chromophore formation. We found many problems with this assay, but it provides a
model for redesigning reactions that can be quantitated by optical end points.
Add further investigation of the TPP assay to provide a more accurate alternative
for detection of low hydroperoxide concentrations. It would be particularly important to
determine stoichiometry and effects of hydroperoxide structure. Another issue to
investigate is a replacement for the solvent cyclohexane, since it could not solubilize t-
butyl hydroperoxide.

123
8. REFERENCES
Akasaka, K., Suzuki, T., Ohrui, H., & Meguro, H. (1987). Study on aromatic phosphines
for novel fluorometry of hydroperoxides (I) -synthesis and spectral properties of
diphenyl aryl phosphines and their oxides. Analytical Letters, 20(5), 731-745.
Amer, M. M., Ahmed, A. K. S., & Said, F. (1961). The iodometric determination of the
peroxide value of rancid oils and fats. Journal of Pharmaceutical Sciences of United
Arab Republic, 2, 1-11.
American Oil Chemists' Society Recommended Practice Cd 8b-90; revised 1991.
Baldwin, R. R., Bear, R.S., and Rundle, R. E. (1944). J. Amer. Chem. Soc. 66, 11-115.
Barrera-Arellano,D., & Esteves, W. (1992) Oxidative Stability of Potato Chips
Determined by Rancimat, J. Am. Oil. Chem. Soc. 69, 335-337.
Barthel, G., & Grosch, W. (1974). Peroxide value determination—Comparison of some
methods. Journal of the American Oil Chemists' Society, 51(12), 540-544.
Bauer-Plank, C., & Steenhorst-Slikkerveer, L. (2000). Analysis of triacylglyceride
hydroperoxides in vegetable oils by nonaqueous reversed-phase high-performance
liquid chromatography with ultraviolet detection. Journal of the American Oil
Chemists' Society, 77(5), 477-482.
Bolland, J. L., Sundralingam, A., Sutton, D. A., & Tristram, G. R. (1941). Analytical
methods in rubber chemistry. IV. The determination of peroxidic oxygen.
Transactions, Institution of the Rubber Industry, 17, 29-32.
Brooks, D. D., & Berner, D. L. (1990). Iso-octane as an alterantive solvent for peroxide
value determination: Study 1, poster presentation at AOCS Annual Meeting,
Baltimore, MD.
Burat, K. M., & Bozkurt, O. (1996). Improvement of calibration curve for determining
peroxide values of food lipids by the modified ferrous oxidation-xylenol orange
method. Journal of AOAC International, 79(4), 995-997.
Chapman, R. A., & McFarlane, W. D. (1943). A colorimetric method for the
determination of fat-peroxides and its applications. Canadian Journal of Research,
21, Sec. B.(7), 133-139.
Dobarganes, M. C., & Velasco, J. (2002). Analysis of lipid hydroperoxides. European
Journal of Lipid Science and Technology, 104(7), 420-428.
124
Eymard, S., & Genot, C. (2003). A modified xylenol orange method to evaluate
formation of lipid hydroperoxides during storage and processing of small pelagic
fish. European Journal of Lipid Science and Technology, 105(9), 497-501.
Fiedler, U. (1974). A coulometric method for the determination of low peroxide values of
fats and oils. Journal of the American Oil Chemists' Society, 51, 101-103.
Foo, S. Y., Cuppett, S., & Schlegel, V. (2006). Evaluation of SafTestTM
methods for
monitoring frying oil quality. JAOCS, 83(1), 15-20.
Frankel, E. N. (1985). Chemistry of autoxidation: Mechanism, products and flavor
significance. In D. B. Min, & T. H. Smouse (Eds.), Flavor chemistry of fats and oils
(pp. 1-38). USA: American Oil Chemists' Society.
Frankel, E. N. (1998). Methods to determine extent of oxidation, ch5. Lipid oxidation
(pp. 79-97). Dundee, Scotland: The Oily Press.
Frankel, E. N., Neff, W. E., Rohwedder, W. K., Khambay, B. P. S., Garwood, R. F., and
Weedon, B. C. L. (1977) Analysis of autoxidized fats by gas chromatography-
mass spectrometry: I. Methyl Oleate. Lipids 12, 901-907.
Frankel, E. N., Neff, W. E., Rodwedder, W. K., Khambay, B. P. S., Garwood, R. F., &
Weedon, B. C. L. (1977) Analysis of autoxidized fats by gas chromatography-
mass spectrometry: III. Methyl linolenate. Lipids 12, 1055-1061.
Frankel, E. N., Neff, W. E., & Bessler, T. R. (1979) Analysis of autoxidized fats by gas
chromatography-mass spectrometry: V. Photosensitized oxidation. Lipids 14, 961-
967.
Frankel, E. N., Neff, W. E., & Selke, E. (1984) Analysis of autoxidized fats by gas
chromatography-mass spectrometry. IX. Homolytic vs heterolytic cleavage of
primary and secondary oxidation products. Lipids 19, 790-800.
Fukuzawa, K., Fujisaki, A., Akai, K., Tokumura, A., Terao, J., & Gebicki, J. M. (2006).
Measurement of phosphatidylcholine hydroperoxides in solution and in intact
membranes by the ferric–xylenol orange assay. Analytical Biochemistry, 359(1),
18-25.
Gay, C., Collins, J., & Gebicki, J. M. (1999b). Hydroperoxide assay with the ferric-
xylenol orange complex. Analytical Biochemistry, 273(2), 149-155.
Gay, C. A., & Gebicki, J. M. (2002). Perchloric acid enhances sensitivity and
reproducibility of the Ferric–Xylenol orange peroxide assay. Analytical
Biochemistry, 304(1), 42-46.

125
Gay, C. A., & Gebicki, J. M. (2003). Measurement of protein and lipid hydroperoxides in
biological systems by the ferric–xylenol orange method. Analytical Biochemistry,
315(1), 29-35.
Gay, C., Collins, J., & Gebicki, J. M. (1999a). Determination of iron in solutions with the
Ferric–Xylenol orange complex. Analytical Biochemistry, 273(2), 143-148.
Gay, C., & Gebicki, J. M. (2000). A critical evaluation of the effect of sorbitol on the
Ferric–Xylenol orange hydroperoxide assay. Analytical Biochemistry, 284(2), 217-
220.
Gebicki, J. M., & Guille, J. (1989). Spectrophotometric and high-performance
chromatographic assays of hydroperoxides by the iodometric technique. Analytical
Biochemistry, 176, 360-364.
Gordon, V. C. (2005). Rapid testing for fats and oils and food products. Food
Technology, 16(9), 594-595.
Grau, A., Codony, R., Rafecas, M., Barroeta, A. C., & Guardiola, F. (2000). Lipid
hydroperoxide determination in dark chicken meat through a ferrous oxidation-
xylenol orange method. Journal of Agricultural and Food Chemistry, 48(9), 4136-
4143.
Gray, J. (1978). Measurement of lipid oxidation: A review. Journal of the American Oil
Chemists' Society, 55(6), 539-546.
Gupta, B. L. (1973). Microdetermination techniques for H2O2 in irradiated solutions.
Microchemical Journal, 18(4), 363-374.
Hara, S., & Totani, Y. (1988). A highly sensitive method for the micro-determination of
lipid hydroperoxides by potentiometry. Journal of the American Oil Chemists'
Society, 65(12), 1948-1950.
Hermes-Lima, M., Willmore, W. G., & Storey, K. B. (1995). Quantification of lipid
peroxidation in tissue extracts based on fe(III)xylenol orange complex formation.
Free Radical Biology and Medicine, 19(3), 271-280.
Hicks, M., & Gebicki, J. M. (1979). A spectrophotometric method for the determination
of lipid hydroperoxides. Analytical Biochemistry, 99(2), 249-253.
Hills, L. G., & Thiel, C. C. (1945). The ferric thiocyanate method of estimating peroxide
in the fat of of butter, milk, and dried milk. Journal of Dairy Research, 14, 340-353.
Hornero-Méndez, D., Pérez-Gálvez, A., & Mínguez-Mosquera, M. (2001). A rapid
spectrophotometric method for the determination of peroxide value in food lipids

126
with high carotenoid content. Journal of the American Oil Chemists' Society, 78(11),
1151-1155.
International IDF Standards (1991). International Dairy Federation, IDF - Square
Vergote 41, Brussels, Belgium, sec. 74A:1991.
Jiang, Z., Hunt, J. V., & Wolff, S. P. (1992). Ferrous ion oxidation in the presence of
xylenol orange for detection of lipid hydroperoxide in low density lipoprotein.
Analytical Biochemistry, 202(2), 384-389.
Jiang, Z., Woollard, A. C. S., & Wolff, S. P. (1990). Hydrogen peroxide production
during experimental protein glycation. FEBS Letters, 268(1), 69-71.
Jiang, Z., Woollard, A., & Wolff, S. (1991). Lipid hydroperoxide measurement by
oxidation of Fe2+
in the presence of xylenol orange. comparison with the TBA assay
and an iodometric method. Lipids, 26(10), 853-856.
Japan Oil Chemists’ Society, Standard Method for Analysis of Fats and Oil 2 4 12-71,
Peroxide Value.
Kamal-Eldin, A., & Pokorny, J. (2005). Lipid oxidation products and methods used for
their analysis In A. Kamal-Eldin, & J. Pokorny (Eds.), Analysis of lipid oxidation
(pp. 1-7). Champaign, Illinois: AOCS Press.
Kolthoff, I. M., & Medalia, A. I. (1951). Determination of organic peroxides by reaction
with ferrous iron. Analytical Chemistry, 23(4), 595-603.
Lea, C.H. (1931). Proc. Royal Soc. London 108B:175.
Lea, C. H. (1946). The determination of the peroxide values of edible fats and oils: The
iodimetric method. Journal of Society of Chemical Industry, 65, 286-291.
Lea, C. H. (1952). Methods for determining peroxide in lipids. Journal of the Science of
Food and Agriculture, 3(12), 586-594.
Leray, C. (2011). Introduction to lipid peroxidation . Retrieved March/7, 2012, from
http://www.cyberlipid.org/perox/oxid0002.htm#2 .
Lezerovich, A. (Oct. 1985). Determination of peroxide value of conventional difference
and difference-derivative spectrophotometry. JAOCS, 62(10), 1495-1500.
Lipid Oxidation: Challenges in Food Systems, Ed. Nienaber, U., Logan, A., and Pan, X.,
American Oil Chemists Society, Champaign, IL, in press.

127
Lips, A., Chapman, R. A., & McFarlane, W. D. (1943). The application of the ferric
thiocyanate method to the determination of incipient rancidity in fats and oils. Oil &
Soap, , 240-243.
Løvaas, E. (1992). A sensitive spectrophotometric method for lipid hydroperoxide
determination. Journal of the American Oil Chemists' Society, 69(8), 777-783.
Love, J. (1895). Factors affecting lipid oxidation: Metal catalysts and chelators. In D. B.
Min, & T. H. Smouse (Eds.), Flavor chemistry of fats and oils (pp. 61-78). USA:
American Oil Chemists' Society.
McClements, D. J., & Decker, E. A. (2008). Lipids. S. Damodaran, K. L. Parkin & O. R.
Fennema (Eds.), Fennema's food chemistry (Fourth ed., pp. 155-216). Florida: CRC
Press, Taylor & Francis Group.
Mehlenbacher, V.C., “The Analysis of Fats and Oils,” Garrard Press, Champaign, IL,
1960.
Mihaljevic, B., Katusin-Razem, B., & Razem, D. (1996). The reevaluation of the ferric
thiocyanate assay for the lipid hydroperoxides with special consideration of the
mechanistic aspects of the response. Free Radical Biology and Medicine, 21(1), 53-
63.
MPBiomedical < http://www.mpbio.com>;Copyright 2012 MP Biomedicals LLC.
Nakamura, T., & Maeda, H. (1991). A simple assay for lipid hydroperoxides based on
triphenylphosphine oxidation and high-performance liquid chromatography. Lipids,
26(9), 765-768.
Navas, J. A., Tres, A., Codony, R., Boatella, J., Bou, R., & Guardiola, F. (2004).
Modified ferrous oxidation-xylenol orange method to determine lipid
hydroperoxides in fried snacks. European Journal of Lipid Science and Technology,
106(10), 688-696.
Nawar, W. W. (1986). Lipids. Food Chemistry. O. R. Fennema. New York, Academic:
225-320.
Nielsen, N. S., Timm-Heinrich, M., & Jacobsen, C. (2003). Comparison of wet-chemical
methods for determination of lipid hydroperoxides. Journal of Food Lipids, 10, 35-
50.
Nouros, P.G.,Georgiou, C.A., and M.G. Polissiou, Anal. Chim. Acta 389 (1999) 239.
Nourooz-Zadeh, J., Tajaddini-Sarmadi, J., Birlouez-Argon, I., & Wolff, S. P. (1995).
Measurement of hydroperoxides in edible oils using the ferrous oxidation in xylenol
orange assay. Journal of Agricultural and Food Chemistry, 43(1), 17-21.

128
Nourooz-Zadeh, J., Tajaddinisarmadi, J., & Wolff, S. P. (1994). Measurement of plasma
hydroperoxide concentrations by the ferrous oxidation-xylenol orange assay in
conjunction with triphenylphosphine. Analytical Biochemistry, 220(2), 403-409.
Official Methods and Recommended Practices of the American Oil Chemists’ Society, 4th
Edn., edited by D. Firestone, American Oil Chemists’ Society, Champaign, 1997,
Method Cd 8-53.
Osawa, C. C., Gonçalves, L. A. G., & Ragazzi, S. (2007). Determination of
hydroperoxides in oils and fats using kits. Journal of the Science of Food and
Agriculture, 87(9), 1659-1666.
Osawa, C. C., Gonçalves, L. A. G., & Ragazzi, S. (2008). Evaluation of the quality of pet
foods using fast techniques and official methods. Cienc. Tecnol. Aliment, 28, 1-14.
Pokorný, J. (2005). Volumetric analysis of oxidized lipids In A. Kamal-Eldin, & J.
Pokorný (Eds.), Analysis of lipid oxidation (pp. 8-16). Champaign, Illinois: AOCS
Press.
Prior, E., & Loliger, J. (1994). Spectrophotometric and chromatographic assays. In J. C.
Allen, & R. J. Hamilton (Eds.), Rancidity in foods (pp. 104-127). London (UK):
Blackie Academic & Professional.
Richards, M. P., & Feng, Y. (2000). Choosing the proper organic solvent for the
determination of lipid hydroperoxides by the ferric thiocyanate assay. Analytical
Biochemistry, 278(2), 232-235.
Schaich, K.M., & Borg, D.C. 1980. EPR studies in autoxidation. In: Autoxidation in
Food and Biological Systems (Simic, M.G. and Karel, M., eds.), Plenum Publishing
Corp., New York, pp.45-70.
Schaich, K.M. 1992. Metals and lipid oxidation: Contemporary issues. Lipids 27: 209-
218.
Schaich, K. M. (2005). Lipid oxidation in fats and oils: An integrated view
. In F. Shahidi (Ed.), Bailey's industrial fats and oils (pp. 2681-2767). New York:
John Wiley.
Schaich, K. M. (2006). Lipid oxidation in specialty oils. In F. Shahidi (Ed.),
Nutraceutical and specialty oils and their coproducts (pp. 401-448). New York:
Taylor & Francis Group, LLC.
Schaich, K. M. (2008). Chapter 8: Co-oxidations of oxidizing lipids: Reactions with
proteins. In A. Kamal-Eldin, & D. Min (Eds.), Lipid oxidation pathways (Vol. 2 ed.,
pp. 183-274) AOCS Press.

129
Schaich, K. M. (2009). Lipid oxidation: A chemical stabilization challenge for packaging.
In K. L. Yam (Ed.), The Wiley Encyclopedia of Packaging Technology (3rd ed., pp.
659-674). New York: John Wiley & Sons, Inc.
Schaich, K. M. (2012). Lipid oxidation. In N. A. M. Eskin (Ed.), Biochemistry of Foods
(3rd Ed., ). in press: Elsevier, New York.
Shahidi, F., & Wanasundara, U. N. (2002). Methods for measuring oxidative rancidity in
fats and oils. In Casimir C. Akoh & David B. Min (Eds.), Food Science and
Technology 117 (Food Lipids) (pp. 465-487). Marcel Dekker, Inc
Shahidi, F. (1998). Indicators for evaluation of lipid oxidation and off-flavor
development in foods. In E.T. Contis et al. (Eds.), Food Flavors: Formation, Analysis
and Packaging Influences Vol 40 (pp. 55-68), Elsevier Science B.V.
Shantha, N. C., & Decker, E. A. (1994). Rapid, sensitive, iron-based spectrophotometric
methods for determination of peroxide values of food lipids. Journal of AOAC
International, 77(2), 421-424.
Skoog, D. A., West, D. M., & Holler, F. J. (1998). Ch. 14: Applications of
Oxidation/Reduction titration . Fundamentals of analytical chemistry (5th ed., pp.
331-356). New York: W.B. Saunders Company.
Standard Methods for the Analysis of Oils, Fats, and Derivatives, IUPAC Standard
Method 2.501: Determination of Peroxide Value. International Union of Pure and
Applied Chemistry, 7th
ed., Pergamon, Oxford (UK) 1992).
Stine, C. M., Harland, H. A., Coulter, S. T., & Jenness, R. (1954). A modified peroxide
test for detection of lipid oxidation in dairy products. Journal of Dairy Science,
37(2), 202-208.
Stuffins, C. B., & Weatherall, H. (1945). Determination of the peroxide value of oils and
fats. Analyst, 70(836), 403-409.
Sully, D. (1954). A modified iodimetric determination of organic peroxides. Analyst,
79(935), 86-90.
Swoboda, P. A. T., & Lea, C. H. (1958). Determination of the peroxide value of edible
fats by colorimetric iodometric procedures. Chemistry and Industry, , 1090-1091.
Takagi, T., Mitsuno, Y., & Masumura, M. (1977). Determination of peroxide value by
the colorimetric iodine method with protection of iodide as cadium comples.
LIPIDS, 13(2), 147-151.

130
Tian, K., & Dasgupta, P. K. (1999). Automated measurement of lipid hydroperoxides in
oil and fat samples by flow injection photometry. Analytical Chemistry, 71(10),
2053-2058.
Uri, N. (1961). Physico-chemical aspects of autoxidation. Vol. 1. Autoxidation and
Antioxidants. W. O. Lundberg. New York, Interscience: 55-106}.
Wagner, C. D., Clever, H. L., & Peters, E. D. (1947). Evaluation of ferrous thiocyanate
colorimetric method. Analytical Chemistry, 19(12), 980-982.
Wheeler, D.H. (1932). Peroxide formation as a measure of autoxidative determination.
Oil Soap, 9(4), 89-97.
Wolff, Simon P. (1994). Ferrous ion oxidation in presence of ferric ion indicator xylenol
orange for measurement of hydroperoxides. Methods in Enzymology, 233 (pp. 182-
189) Academic Press, Inc.
Yanishlieva, N., & Popov, A. (1972). Statistische Auswertung einer modifizierten
Methode zur Bestimmung der Peroxidzahl von Lipiden, Nahrung 16, 121-122.
Yamada, K., Terao, J., & Matsushita, S. (1987). Electrochemical detection of
phospholipid hydroperoxides in reverse-phase high performance liquid
chromatography. Lipids, 22(2), 125-128.
Yamamoto, Y., Brodsky, M. H., Baker, J. C., & Ames, B. N. (1987). Detection and
characterization of lipid hydroperoxides at picomole levels by high-performance
liquid chromatography. Analytical Biochemistry, 160(1), 7-13.
Yildiz, G., Wehling, R. L., & Cuppett, S. L. (2003). Comparison of four analytical
methods for the determination of peroxide value in oxidized soybean oils. Journal of
the American Oil Chemists' Society, 80(2), 103-107.
Young, C. A., Vogt, R. R., & Nieuwland, J. A. (1936). Ind. Eng. Chem., Anal. Ed., 8,
198.