Evaluation of a Model of Granulopoiesis Leukokinetic ... · Experimental Evaluation of a Model of...
15
Leukokinetic Studies. IX. Experimental Evaluation of a Model of Granulopoiesis D. R. Boggs, … , G. E. Cartwright, M. M. Wintrobe J Clin Invest. 1965; 44(4):643-656. https://doi.org/10.1172/JCI105177. Research Article Find the latest version: http://jci.me/105177-pdf
-
Upload
duongthien -
Category
Documents
-
view
213 -
download
0
Transcript of Evaluation of a Model of Granulopoiesis Leukokinetic ... · Experimental Evaluation of a Model of...

Leukokinetic Studies. IX. ExperimentalEvaluation of a Model of Granulopoiesis
D. R. Boggs, … , G. E. Cartwright, M. M. Wintrobe
J Clin Invest. 1965;44(4):643-656. https://doi.org/10.1172/JCI105177.
Research Article
Find the latest version:
http://jci.me/105177-pdf
Journal of Clinical InvestigationVol. 44, No. 4, 1965
Leukokinetic Studies. IX. Experimental Evaluation of a
Model of Granulopoiesis *D. R. BOGGS,t J. W. ATHENS, G. E. CARTWRIGHT,AND M. M. WINTROBE
(From the Department of Medicine, University of Utah College of Medicine,Salt Lake City, Utah)
Kinetic models of granulopoiesis have beenconstructed from data obtained by labeling neu-trophilic granulocytes with tritiated thymidine(1, 2), with radioactive phosphorus (3), andwith diisopropyl fluorophosphate (DFP32) (4).In many respects these models are remarkablysimilar in their portrayal of the concatenated com-partments of normal granulopoiesis. However,certain questions, particularly concerning thestructure of the proliferating compartment of themarrow, remain unresolved.
Our experiments were designed to test thevalidity of several of the assumptions in themodel proposed by Warner and Athens (4),which is based on the interpretation of the threephases in the DFP32 curve obtained in normalhuman subjects. This model has the advantageof adequately describing the data curves obtainedfrom tritiated thymidine and radioactive phos-phorus labeling as well as from DFP32 labeling.
Dogs were used in these studies since certainof the experiments could not be carried out inhuman subjects. The blood granulocyte specificactivity (BGSA) curve obtained following in-jection of DFP32 was determined in normal dogs,and the effect upon this curve of changes in thesystem induced by vinblastine sulfate, endotoxin,cortisone, and infection has been assessed. Al-though we previously have reported certain stud-ies on canine cells labeled in vitro with DFP32(5), most of the studies on the suitability ofDFP32 as a cell label have been carried out withcells from human subjects (6). Therefore, it isnecessary to describe briefly additional studies ofthe suitability of DFP32 as a label for dog cells.
* Submitted for publication June 15, 1964; acceptedDecember 24, 1964.
This investigation was supported by research grantAM-04489 from the National Institute of Arthritis andMetabolic Diseases, Bethesda, Md.
t Leukemia Society Scholar.
Methods
Animals. Dogs of either sex and weighing from 9 to 32kg were given antihelminthic therapy and distemper vac-cine and observed for 10 days before use. All studieswere done in unanesthetized animals.
Labeling procedures. Tritiated DFP (HW-DFP) andDFP` were obtained commercially.' The specific ac-tivity of DFP3` was approximately 200 ,uc per ml, andthe concentration of DFP`2 in propylene glycol diluentwas approximately 1 mg per ml. Each batch of materialwas assayed in our laboratory (6). DFP` was injectedrapidly into a foreleg vein. To evaluate the effect ofdifferent dosages upon the configuration of the BGSAcurve, DFP` in amounts ranging from 0.02 mg per kgto 0.4 mg per kg was given to groups of dogs. The ini-tial BGSA was directly proportional to the dosage ofDFP3' (r = 0.78), and no alteration in curve configurationwas observed over this range of dosage. Therefore, ex-
cept as otherwise noted, in subsequent studies 4.5 mg ofDFP3' was given to each dog, since this amount re-sulted in suitable radioactivity levels. In certain of thestudies, blood was labeled in vitro and returned to thecirculation of the donor (5). All blood samples for leu-kocyte isolation and determination of specific activity wereobtained by jugular puncture.
The techniques of separating dog granulocytes fromwhole blood and determining their specific activity(counts per minute per milligram leukocyte nitrogen)have been reported (5).
Radioautographs were prepared by incubating 1 ml ofblood or aspirated sternal marrow for 1 hour with 1 A&g ofH3-DFP, 256 mc per mmole. Radioautographs of bloodand bone marrow were also prepared following the in-travenous administration of 4.5 mg of H'-DFP. Allsmears were fixed in methanol, dipped in Kodak NTB-2emulsion, developed after 1 to 5 months of exposure, andstained with Wright's stain. Net grains per cell weredetermined by subtracting from the number of grains inthe individual cell, the mean number of grains in 500 cell-free areas of the slide, of the same size as the cell understudy.
Initial labeling conditions. Neutrophilic granulocyteswere the only leukocytes that were labeled when bloodwas incubated in vitro with H'-DFP (Figure 1).
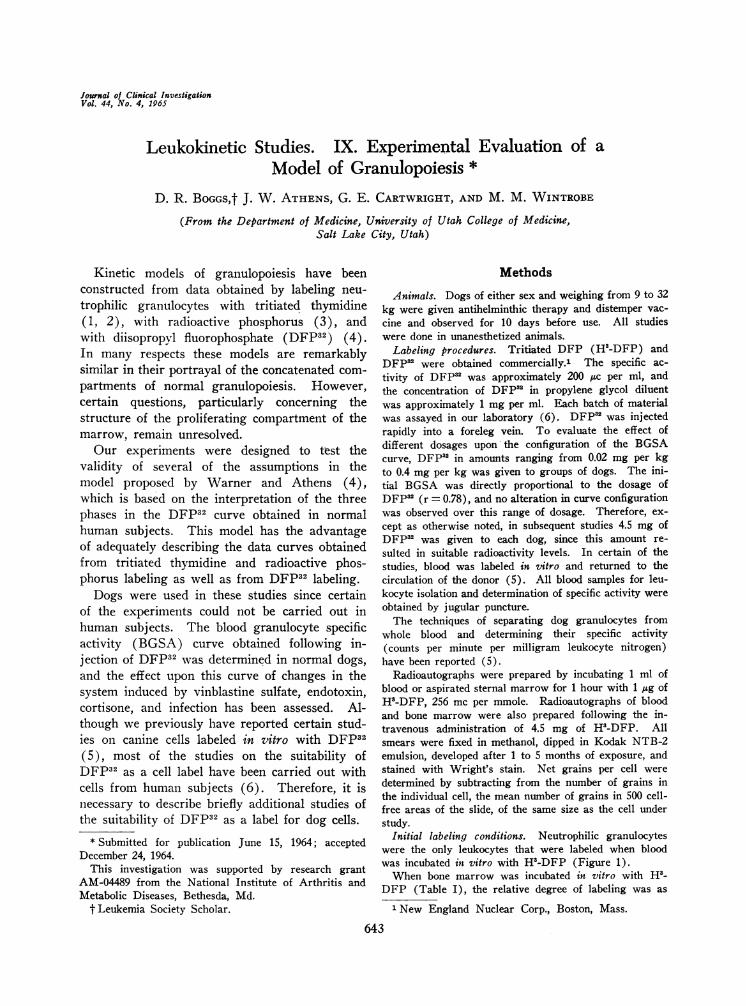
When bone marrow was incubated in vitro with H'-DFP (Table I), the relative degree of labeling was as
1 New England Nuclear Corp., Boston, Mass.
643

D. R. BOGGS, J. W. ATHENS, G. E. CARTWRIGHT,AND M. M. WINTROBE
100 60r
x
CO80 x
~~41 X
4. 60 / * G E S0~6 /a JUVENILES0"'NO *Z.OS/NOPHILS
X MONOCYTES_4 4
-
X0 LYMPHOCYTES2 BACAGQOUND
20
0 4 8 12 16 20 24 28 3Z
GRAINS PER CELLFIG. 1. THE DEGREEOF LABELING OF VARIOUS TYPES OF BLOOD GRANULOCYTESBY TRITIATED
DIISOPROPYL FLUOROPHOSPHATE(DFP). The number of grains in 500 segmented neutrophils,juvenile neutrophils, monocytes, and lymphocytes and in 200 eosinophils in one smear fromblood incubated in vitro with H'-DFP was averaged. Background radioactivity was determinedby counting 500 cell-free areas of a size equal to that of the cells counted.
follows: segmented neutrophils, 1.0; juvenile neutrophils,0.93; metamyelocytes, 0.73; myelocytes, 1.59; promyelo-cytes, 0.09; and myeloblasts, 0.09.
When H3-DFP was injected intravenously, the rela-tive degree of labeling of the myeloid cells in the bonemarrow was similar to that observed following the invitro labeling of marrow cells although the absolutedegree of labeling was less. The relative degree of la-beling of blood segmented neutrophils: marrow segmentedneutrophils: marrow myelocytes was 1: 0.8:1.4, 4 hoursafter the injection of H3-DFP.
The time during which DFP is available for labelingwas evaluated by injecting 4.5 mg of DFP'2 intravenouslyinto four dogs. Blood was removed from the dogs 0.5,2, and 4 hours later. Plasma was separated and incu-bated with unlabeled whole blood. Granulocytes iso-lated from the 0.5-hour plasma mixture contained a barelydetectable label, and granulocytes isolated from the 2-and 4-hour plasma mixtures contained no label. Thus,the availability time of DFP"2 for labeling is 0.5 hoursor less.
Evaluation of the labeling method. The leukocyte iso-lates were essentially free of erythrocytes and plate-lets by morphologic criteria. However, to determinewhat if any radioactivity was contributed to the finalleukocyte isolate by labeled erythrocytes or pieces oferythrocytes, labeled platelets or pieces of platelets, or
labeled plasma, the following studies were performed.The specific activity of isolated erythrocytes and plate-
lets and of plasma was compared to that of leukocytes
in four dogs for a 3-week period following administra-tion of DFP'2. The specific activity of erythrocytes,platelets, or plasma rarely exceeded 10% of the specificactivity of leukocytes, and their curve of decline inspecific activity differed in configuration from that ofleukocytes. In addition, erythrocytes, platelets, andplasma, labeled with DFP"2 both in vivo and in vitro,were added to unlabeled whole blood and leukocytes sepa-rated from the mixture. These leukocytes isolated didnot contain significant radioactivity.
Peritoneal exudates were induced in four dogs duringphase IV of the BGSAcurve, and the specific activitiesof leukocyte isolates from blood and exudate were com-pared. If non-neutrophil sources of radioactivity werecontaminating blood leukocyte isolates, then the degreeof contamination should have been different in exudateleukocyte isolates. The mean specific activity of exudateleukocytes (198 cpm per mg N) did not differ signifi-cantly from that of blood leukocytes (187 cpm per mgN). The ratio of neutrophils to lymphocytes, mono-cytes, and eosinophils was ten times greater in the exu-date than it was in blood. A few erythrocytes werepresent in the exudate (12,000 per mm8), but the specificactivity of exudate leukocyte isolates was essentially thesame when measured before and after erythrocyte lysis(mean SA of 205 and 198 cpm per mg N, respectively).
Methylprednisolone, 40 mg, and endotoxin, 4 ,ug, weregiven intravenously to groups of dogs during phase IVof the BGSAcurve. If lymphocytes, monocytes, or eo-sinophils were contributing radioactivity to the leukocyte
644
GRANULOPOIESIS 645
TABLE I
Grain counts* over marrow neutrophils and marrow neutrophil precursors after in vitro incubation withtH3-DFP
%of cells with graincounts above background
More than10 grains
Nett grain count Above abovehighest highest
Type of cell Mean Range backgroundt background
Polymorphonuclear 29.2 7-63 99.4 83.8Juvenile 27.3 6-58 98.6 77.8Metamyelocyte 21.4 0-47 94.0 70.6Myelocyte 46.5 6-126 98.8 92.0Promyelocyte 2.7 0-48 8.2 2.0Myeloblast 2.7 0-18 8.5 0
* Mean grain count for polymorphonuclear, juvenile, metamyelocyte, myelocyte, and promyelocyte determined bycounting 500 of each type of cell and for myeloblast by counting 200 cells.
t Background determined from counting 500 blank areas on the slide equivalent in size to the cell in question. Netgrain count determined by subtracting mean background from gross cellular grain count.
isolate, administration of these drugs, which markedlyreduce the concentration of these cells in blood, shouldreduce their contribution. Before prednisolone or endo-toxin, the mean BGSA was 381 cpm per mg N, andBGSAwas not significantly different (399 cpm per mgN) 4 hours after these drugs were administered.
Thus, no evidence was obtained to suggest that any
non-neutrophil source was contributing radioactivity toBGSAmeasurements.
Although no evidence has been obtained that DFPaelutes from or damages human granulocytes (6), severalstudies were done to investigate the possibility thatDFP5' elutes from or damages canine granulocytes.Blood samples were allowed to stand at room temperaturefor varying periods of time, and isolated granulocyteswere washed four, five, or six times. These procedureshad no influence on the specific activity of the granulo-cytes that were isolated. It would be expected that ifDFPU elutes from or damages granulocytes, the degreeof elution or damage might increase as the amount oflabel in the cell increases. As mentioned above, it was
found that over a 20-fold range in DFPU dosage, the ini-tial level of BGSAwas directly proportional to the amountof DFP2 administered, and the configuration of thecurves was unaltered. Two dogs were each given fourinjections of 4.5 mg of DFPU at 3-day intervals. Thespecific activity of the blood granulocytes increased aftereach injection, and the configuration of the curve fol-lowing the fourth injection was similar to that whichfollowed a single injection. To determine if labeled cellsbehaved functionally like unlabeled cells, a peritoneal exu-
date was induced in four dogs. The specific activity ofthe cells in the exudate was not significantly differentfrom the specific activity of the cells in the blood.
The possibility that a metabolite of a DFP-'-labeledprotein is reutilized was explored by measuring the pro-portion of granulocyte radioactivity extractable with pro-tein or with lipid. This was done during the first weekafter the administration of DFP3 and again during thethird week after labeling (Table II). The method of
Folch, Lees, and Stanley (7) was used for lipid extrac-tion. The method of Jandorf and McNamara (8) wasused for protein extraction. The proportion of radio-activity extractable with lipid increased with time. Theproportion extractable with protein decreased with time.
No untoward effects of DFP3' administration (6) wereobserved in any of the dogs. The mean granulocytecount in the group of 14 dogs used to establish the nor-mal BGSA curve was 11,800 per mm' with a deter-mined range of 6,000 to 18,000. Blood granulocyte val-ues were measured three to seven times per week in eachdog. No consistent changes were observed as a conse-quence of the procedure. Sternal marrow differentialcounts both before and 1 week after the administrationof DFP5' were as follows (mean values in per cent oftotal myeloid cells counted): myeloblasts, 1; promyelo-cytes, 5; myelocytes, 15; metamyelocytes, 37; juvenileneutrophils, 37; and segmented neutrophils, 5.
Results
Control BGSA curve
Fourteen dogs were given 4.5 mg of DFP32,and the BGSAwas determined 1, 3, 6, and 10hours later, at daily intervals thereafter for 2
TABLE II
Fractionation of granulocyte radioactivity
%of total radioactivity in
Protein Lipid
During first 94 3week after DFPn (61-115)* (1-5)
During third 65 32week after DFP' (50-88) (20-59)
* Figures in parentheses refer to range.

D. R. BOGGS, J. W. ATHENS, G. E. CARTWRIGHT,AND M. M. WINTROBE
TABLE III
The blood granulocyte specific activity (BGSA) curve in control dogs and in dogs given vinblastinesulfate (VLB), cortisone, and endotoxin and with infection
Phases in BGSAcurve
No. of I + II III III-IV IVdogs duration t4 intercept slope
days hrs %of T,* %decrease/BGSA day
Control Meant 14 4.8 46 16 3.7(3.0-7.1) (32-60) (8-30) (1-7)
Vinblastine sulfate4Given:DFP"2 1 hr before VLB Mean 8 3.4§ 21§ 13 4.0
(1.0-4.5) (14-27) (6-23) (0-10)DFP32 2 days after VLB Mean 4 2.3§ 24§ 24 2.0
(1.0-4.0) (12-33) (10-43) (1-3)DFP'2 6 days after VLB Mean 5 4.6 42 21 1.8
(3.5-6.0) (25-76) (10-45) (1-3)DFP3B 14 days after VLB Mean 4 7.0§ 24§ 10 2.2
(6.5-7.5) (16-31) (5-13) (1-5)Endotoxin
Given 1 hr or 2 days after Mean 8 3.7§ 35§ 22 2.5DFPB2 (3.0-5.3) (27-51) (12-48) (0-12)
Cortisone acetateGiven daily, starting 5 Mean 5 4.4 40 9 2.8
days before DFP32 (4.0-5.0) (35-47) (5-14) (1-4)Pulmonary infections
Dog 131During infection 2.4 20 20 3.2After recovery 4.3 48 22 2.5
Dog 122During infection 2.3 28 12 2.2
* T. refers to the initial BGSAdetermination, done 1 to 3 hours after administering DFP32.t Numbers in parentheses refer to ranges.t Dogs that developed diarrhea (9) were excluded from this analysis.§ Differs from normal with p = <0.05 by t test.
weeks, and then three to five times a week for a
total period of study of at least 4 weeks. Theresultant mean curve is presented in Figure 2.On a milligram per kilogram basis, this dosageaveraged 15 times that given to man (6). Thislarge dose in the dog proved necessary to attainan initial BGSAcomparable to that attained inman.
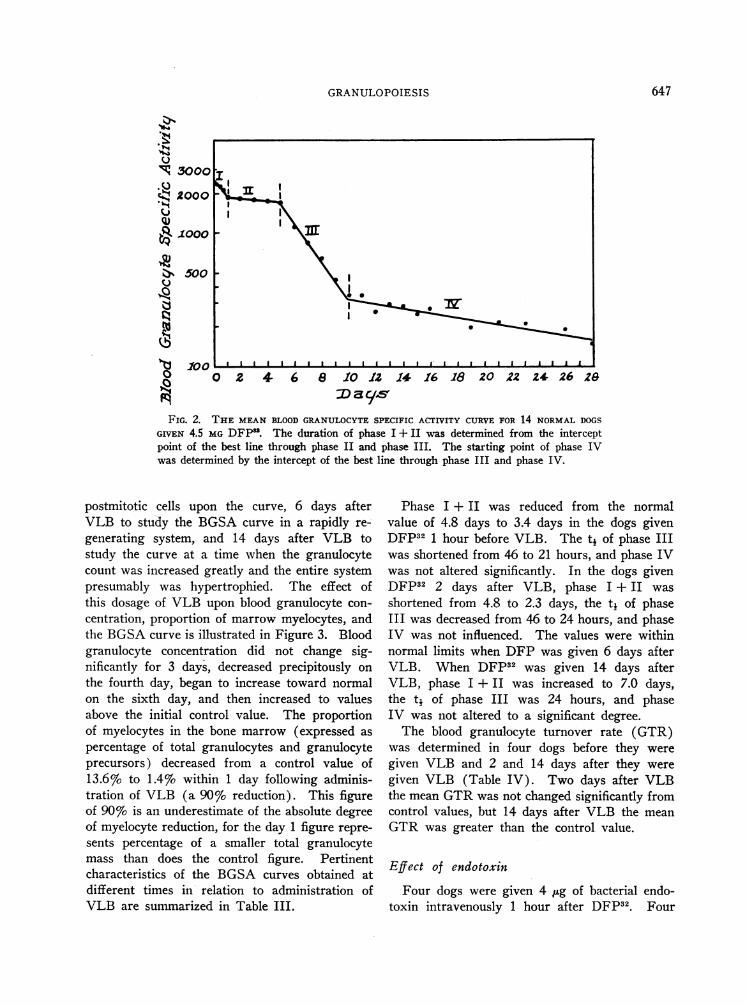
Four phases could be distinguished. Duringthe first day the BGSAdeclined 20%o (phase I).The specific activity of the granulocytes then re-
mained relatively stable, declining only 2% per
day, until the fifth day (phase II). This was
followed by a rapid exponential decline in BGSA(phase III). Finally, the slope of the curve
slowed abruptly to a mean decline of 4%o per
day (phase IV).
The mean and the range of the duration ofphase I + II, the tj of phase III, the level atwhich the phase III-IV intercept occurred, andthe slope of phase IV are given in Table III.A significant inverse relationship was found be-tween the duration of phase I + II and the t4of phase III in these studies on normal animals(r = -0.82, p = < 0.001).
Effect of vinblastine sulfate (VLB)
Dogs were given DFP32 at four different timesin relation to administration of 0.2 mg per kg ofVLB: 1 hour before VLB to eliminate the con-tribution of the mitotic pool to the BGSAcurve, 2days after VLB to determine the effect of a de-creased mitotic pool and a reduced number of
646
GRANULOPOIESIS
'*I
VI 3000.QC4 2000
q)e 1000
k 500M
0t
o .1000N
0 2 4 6 8 10 12 14 16 18 20 22 24 26 28DayC1sv
FIG. 2. THE MEANBLOODGRANULOCYTESPECIFIC ACTIVITY CURVEFOR 14 NORMALDOGSGIVEN 4.5 MGDFP1. The duration of phase I + II was determined from the interceptpoint of the best line through phase II and phase III. The starting point of phase IVwas determined by the intercept of the best line through phase III and phase IV.
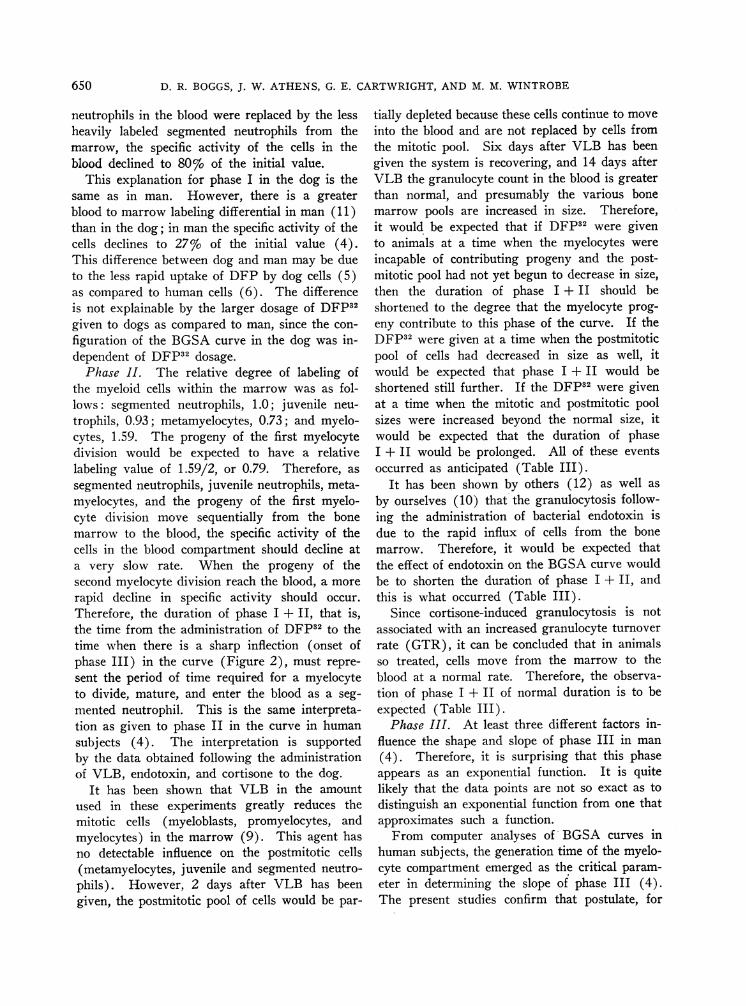
postmitotic cells upon the curve, 6 days afterVLB to study the BGSAcurve in a rapidly re-generating system, and 14 days after VLB tostudy the curve at a time when the granulocytecount was increased greatly and the entire systempresumably was hypertrophied. The effect ofthis dosage of VLB upon blood granulocyte con-centration, proportion of marrow myelocytes, andthe BGSAcurve is illustrated in Figure 3. Bloodgranulocyte concentration did not change sig-nificantly for 3 days, decreased precipitously onthe fourth day, began to increase toward normalon the sixth day, and then increased to valuesabove the initial control value. The proportionof myelocytes in the bone marrow (expressed aspercentage of total granulocytes and granulocyteprecursors) decreased from a control value of13.6%o to 1.4% within 1 day following adminis-tration of VLB (a 90%0 reduction). This figureof 90%o is an underestimate of the absolute degreeof myelocyte reduction, for the day 1 figure repre-sents percentage of a smaller total granulocytemass than does the control figure. Pertinentcharacteristics of the BGSA curves obtained atdifferent times in relation to administration ofVLB are summarized in Table III.
Phase I + II was reduced from the normalvalue of 4.8 days to 3.4 days in the dogs givenDFP32 1 hour before VLB. The tj of phase IIIwas shortened from 46 to 21 hours, and phase IVwas not altered significantly. In the dogs givenDFP32 2 days after VLB, phase I + II wasshortened from 4.8 to 2.3 days, the tj of phaseIII was decreased from 46 to 24 hours, and phaseIV was not influenced. The values were withinnormal limits when DFP was given 6 days afterVLB. When DFP32 was given 14 days afterVLB, phase I + II was increased to 7.0 days,the tj of phase III was 24 hours, and phaseIV was not altered to a significant degree.
The blood granulocyte turnover rate (GTR)was determined in four dogs before they weregiven VLB and 2 and 14 days after they weregiven VLB (Table IV). Two days after VLBthe mean GTRwas not changed significantly fromcontrol values, but 14 days after VLB the meanGTR was greater than the control value.
Effect of endotoxin
Four dogs were given 4 /Lg of bacterial endo-toxin intravenously 1 hour after DFP32. Four
647

D. R. BOGGS, J. W. ATHENS, G. E. CARTWRIGHT,AND M. M. WINTROBE
zaqyFIG. 3. THE EFFECT OF VINBLASTINE SULFATE UPON
THE BLOOD GRANULOCYTESPECIFIC ACTIVITY CURVE (A),BLOOD NEUTROPHIL CONCENTRATION(B), AND PROPORTION
OF MYELOCYTESIN BONEMARROW(C).
other dogs were given the same amount 2 daysafter DFP32. Since the effect on the BGSAcurve of endotoxin given at these two times was
the same, the results in the two groups are com-
bined in Table III.Phase I + II was reduced from the normal
value of 4.8 to 3.7 days. The tj of phase III was
reduced from 46 to 35 hours. The increase inthe phase III-IV intercept was not statisticallysignificant (p = < 0.5).
Effect of cortisone
Cortisone acetate, 125 mg per day, was ad-ministered intramuscularly to 12 dogs. A sus-
tained granulocytosis developed in all dogs (TableIV).
The GTRwas studied before and after 7 daysof cortisone administration in seven dogs (TableIV). As demonstrated previously in man (10),the GTRwas within normal limits during corti-sone-induced granulocytosis.
On the seventh day of cortisone, DFP32 wasgiven intravenously to five dogs, the cortisonewas continued, and the BGSAcurve was deter-mined. The resultant BGSA curve was withinnormal limits (Table III).
Effect of spontaneously occurring infection
Three dogs developed infection characterized bycough, purulent nasal discharge, -signs of pulmo-nary consolidation, and granulocytosis. This pro-vided an opportunity to study the influence of in-fection on the BGSAcurve.
Dog 131 was first studied while acutely ill.During the period of this study the granulocytecount ranged from 21,000 to 36,000 per mm3.Two months after the illness had subsided, atwhich time the granulocyte count was normal(10,000 per mm3) and remained so, a secondBGSAcurve was obtained (Table III). Duringthe acute illness, phase I + II was decreased, andthe t4 of phase III was only 20 hours. Afterrecovery the BGSA curve was within normallimits.
The illness in dog 122 was severe and eventu-ally fatal. The granulocyte count increased pro-gressively and attained a value of 44,000 per mm3at the time of death. DFP32 was given intra-venously 16 days before death at which time thegranulocyte count was 15,000 per mm3. As indog 131, phase I + II was shortened, and the tjof phase III was decreased (Table III).
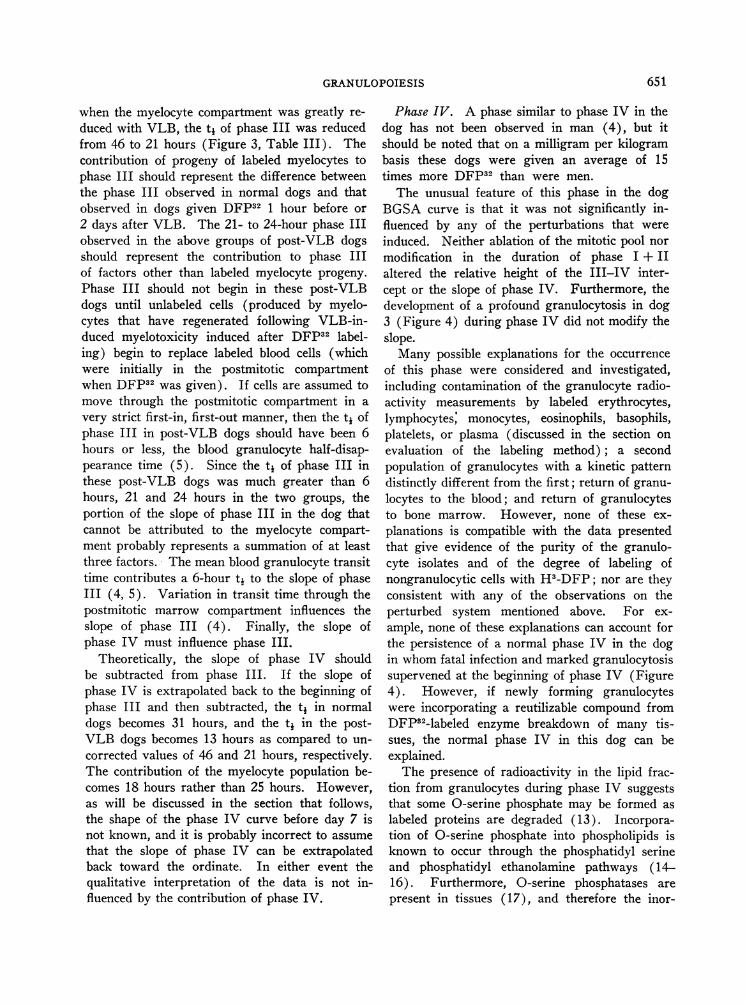
DFP32 had been given to dog 3 as a normalcontrol (Figure 4). In this animal the apparentonset of the illness occurred after phases I, II,and III had been completed. The developmentof profound granulocytosis had no influence onthe slope of phase IV.
Interpretation of the four phases of the BGSAcurve
From the initial labeling conditions determinedwith H3-DFP and from information that is avail-
648

GRANULOPOIESIS
3620 ADAYS
2t
20
1016 t
K14 't
11
k100
2%II
0
able concerning the mechanisms by which VLB(9), endotoxin (10), and cortisone (10) perturbthe granulopoietic system, certain deductions can
be drawn concerning the interpretation of each ofthe four phases of the BGSAcurve.
Phase I. During phase I the specific activityof the granulocytes declined to 80% of the initial
TO INFLUENCE
(T.) value. This can be explained by the ob-servation that, after the intravenous administra-tion of H3-DFP, the segmented neutrophils in theblood labeled to a greater degree (relative labelingindex of 1.0) than did the segmented neutrophilsin the bone marrow (relative labeling index of0.8). Therefore, as the more heavily labeled
TABLE IV
Blood granulocyte turnover rate* (from studies of infused autologous, DFP32-labeled granulocytes)before and after VLB and cortisone
Total bloodGranulocyte granulocyte Granulocyte
count pool 4 turnover rate
/mm$ blood X 10 ceUs/kg hrs X 107 cells/X 10$ kg/day
Vinblastine sulfate(4 dogs)
Control Meant 6.1 122 5.9 335(3.6-10.3) (60-191) (5.4-6.9) (185-460)
2 days post-VLB Mean 5.0 148 8.Ot 306(2.6-8.8) (49-318) (7.1-8.5) (115-661)
14 days post-VLB Mean 11.2t 193t 6.1 527t(9.5-12.9) (125-265) (4.6-8.6) (400-747)
Cortisone(7 dogs)
Control Mean 5.6 88 5.3 301(3.0-8.4) (53-112) (3.8-6.3) (157-468)
On day 7 of cortisone Mean 13.8t 162t 7.6t 352administration (8.7-30.1) (67-269) (6.0-10.2) (136-438)
* Granulocyte turnover rate is defined from studies employing granulocytes labeled in vitro and reinfused. GTR= (.693/ti) X total blood granulocyte pool X 24 hours.
t Numbers in parentheses refer to range.t Differs from control value by p = <0.05, t test.
(.1
.110
I0f
FIG. 4. THE FAILURE OF MARKEDGRANULOCYTOSISACCOMPANYINGINFECTIONTHE CONFIGURATIONOF PHASE IV.
649
D. R. BOGGS, J. W. ATHENS, G. E. CARTWRIGHT,AND M. M. WINTROBE
neutrophils in the blood were replaced by the lessheavily labeled segmented neutrophils from themarrow, the specific activity of the cells in theblood declined to 80%o of the initial value.
This explanation for phase I in the dog is thesame as in man. However, there is a greater
blood to marrow labeling differential in man (11)than in the dog; in man the specific activity of thecells declines to 27% of the initial value (4).This difference between dog and man may be dueto the less rapid uptake of DFPby dog cells (5)as compared to human cells (6). The differenceis not explainable by the larger dosage of DFP32
given to dogs as compared to man, since the con-
figuration of the BGSAcurve in the dog was in-dependent of DFP32 dosage.
Phase II. The relative degree of labeling ofthe myeloid cells within the marrow was as fol-lows: segmented neutrophils, 1.0; juvenile neu-
trophils, 0.93; metamyelocytes, 0.73; and myelo-cytes, 1.59. The progeny of the first myelocytedivision would be expected to have a relativelabeling value of 1.59/2, or 0.79. Therefore, as
segmented neutrophils, juvenile neutrophils, meta-myelocytes, and the progeny of the first myelo-cyte division move sequentially from the bonemarrow to the blood, the specific activity of thecells in the blood compartment should decline ata very slow rate. When the progeny of thesecond myelocyte division reach the blood, a more
rapid decline in specific activity should occur.
Therefore, the duration of phase I + II, that is,the time from the administration of DFP32 to thetime when there is a sharp inflection (onset ofphase III) in the curve (Figure 2), must repre-
sent the period of time required for a myelocyteto divide, mature, and enter the blood as a seg-
mented neutrophil. This is the same interpreta-tion as given to phase II in the curve in humansubjects (4). The interpretation is supportedby the data obtained following the administrationof VLB, endotoxin, and cortisone to the dog.
It has been shown that VLB in the amountused in these experiments greatly reduces themitotic cells (myeloblasts, promyelocytes, andmyelocytes) in the marrow (9). This agent hasno detectable influence on the postmitotic cells(metamyelocytes, juvenile and segmented neutro-phils). However, 2 days after VLB has beengiven, the postmitotic pool of cells would be par-
tially depleted because these cells continue to moveinto the blood and are not replaced by cells fromthe mitotic pool. Six days after VLB has beengiven the system is recovering, and 14 days afterVLB the granulocyte count in the blood is greaterthan normal, and presumably the various bonemarrow pools are increased in size. Therefore,it would be expected that if DFP32 were givento animals at a time when the myelocytes wereincapable of contributing progeny and the post-mitotic pool had not yet begun to decrease in size,then the duration of phase I + II should beshortened to the degree that the myelocyte prog-eny contribute to this phase of the curve. If theDFP32 were given at a time when the postmitoticpool of cells had decreased in size as well, itwould be expected that phase I + II would beshortened still further. If the DFP32 were givenat a time when the mitotic and postmitotic poolsizes were increased beyond the normal size, itwould be expected that the duration of phaseI + II would be prolonged. All of these eventsoccurred as anticipated (Table III).
It has been shown by others (12) as well asby ourselves (10) that the granulocytosis follow-ing the administration of bacterial endotoxin isdue to the rapid influx of cells from the bonemarrow. Therefore, it would be expected thatthe effect of endotoxin on the BGSAcurve wouldbe to shorten the duration of phase I + II, andthis is what occurred (Table III).
Since cortisone-induced granulocytosis is notassociated with an increased granulocyte turnoverrate (GTR), it can be concluded that in animalsso treated, cells move from the marrow to theblood at a normal rate. Therefore, the observa-tion of phase I + II of normal duration is to beexpected (Table III).
Phase III. At least three different factors in-fluence the shape and slope of phase III in man(4). Therefore, it is surprising that this phaseappears as an exponential function. It is quitelikely that the data points are not so exact as todistinguish an exponential function from one thatapproximates such a function.
From computer analyses of BGSA curves inhuman subjects, the generation time of the myelo-cyte compartment emerged as the critical param-eter in determining the slope of phase III (4).The present studies confirm that postulate, for
650
GRANULOPOIESIS
when the myelocyte compartment was greatly re-
duced with VLB, the tj of phase III was reducedfrom 46 to 21 hours (Figure 3, Table III). Thecontribution of progeny of labeled myelocytes tophase III should represent the difference betweenthe phase III observed in normal dogs and thatobserved in dogs given DFP32 1 hour before or
2 days after VLB. The 21- to 24-hour phase IIIobserved in the above groups of post-VLB dogsshould represent the contribution to phase IIIof factors other than labeled myelocyte progeny.
Phase III should not begin in these post-VLBdogs until unlabeled cells (produced by myelo-cytes that have regenerated following VLB-in-duced myelotoxicity induced after DFP32 label-ing) begin to replace labeled blood cells (whichwere initially in the postmitotic compartmentwhen DFP32 was given). If cells are assumed tomove through the postmitotic compartment in a
very strict first-in, first-out manner, then the tj ofphase III in post-VLB dogs should have been 6hours or less, the blood granulocyte half-disap-pearance time (5). Since the tj of phase III inthese post-VLB dogs was much greater than 6hours, 21 and 24 hours in the two groups, theportion of the slope of phase III in the dog thatcannot be attributed to the myelocyte compart-ment probably represents a summation of at leastthree factors. The mean blood granulocyte transittime contributes a 6-hour t4 to the slope of phaseIII (4, 5). Variation in transit time through thepostmitotic marrow compartment influences theslope of phase III (4). Finally, the slope ofphase IV must influence phase III.
Theoretically, the slope of phase IV shouldbe subtracted from phase III. If the slope ofphase IV is extrapolated back to the beginning ofphase III and then subtracted, the tj in normaldogs becomes 31 hours, and the t4 in the post-VLB dogs becomes 13 hours as compared to un-
corrected values of 46 and 21 hours, respectively.The contribution of the myelocyte population be-comes 18 hours rather than 25 hours. However,as will be discussed in the section that follows,the shape of the phase IV curve before day 7 isnot known, and it is probably incorrect to assume
that the slope of phase IV can be extrapolatedback toward the ordinate. In either event thequalitative interpretation of the data is not in-fluenced by the contribution of phase IV.
Phase IV. A phase similar to phase IV in thedog has not been observed in man (4), but itshould be noted that on a milligram per kilogrambasis these dogs were given an average of 15times more DFP32 than were men.
The unusual feature of this phase in the dogBGSAcurve is that it was not significantly in-fluenced by any of the perturbations that wereinduced. Neither ablation of the mitotic pool normodification in the duration of phase I + IIaltered the relative height of the III-IV inter-cept or the slope of phase IV. Furthermore, thedevelopment of a profound granulocytosis in dog3 (Figure 4) during phase IV did not modify theslope.
Many possible explanations for the occurrenceof this phase were considered and investigated,including contamination of the granulocyte radio-activity measurements by labeled erythrocytes,lymphocytes' monocytes, eosinophils, basophils,platelets, or plasma (discussed in the section onevaluation of the labeling method); a secondpopulation of granulocytes with a kinetic patterndistinctly different from the first; return of granu-locytes to the blood; and return of granulocytesto bone marrow. However, none of these ex-planations is compatible with the data presentedthat give evidence of the purity of the granulo-cyte isolates and of the degree of labeling ofnongranulocytic cells with H3-DFP; nor are theyconsistent with any of the observations on theperturbed system mentioned above. For ex-ample, none of these explanations can account forthe persistence of a normal phase IV in the dogin whomfatal infection and marked granulocytosissupervened at the beginning of phase IV (Figure4). However, if newly forming granulocyteswere incorporating a reutilizable compound fromDFP32-labeled enzyme breakdown of many tis-sues, the normal phase IV in this dog can beexplained.
The presence of radioactivity in the lipid frac-tion from granulocytes during phase IV suggeststhat some O-serine phosphate may be formed aslabeled proteins are degraded (13). Incorpora-tion of O-serine phosphate into phospholipids isknown to occur through the phosphatidyl serineand phosphatidyl ethanolamine pathways (14-16). Furthermore, O-serine phosphatases arepresent in tissues (17), and therefore the inor-
651
D. R. BOGGS, J. W. ATHENS, G. E. CARTWRIGHT,AND M. M. WINTROBE
V i
MITOTIC MARROWPOOL PooT MITOTIC MARPOWPOOLI-F--
IMYELOCYTE
?PflOMYELOCyrES I
? MYEOALASTSI-? UNIDENTIFIED
PROGENITORS
PARRALLYI SELF-PER-
PETUATINGCOMPARTMENT
< MATURA-TO RAGE-.
Hi< sroqAG;E >
META- I
MYELOCYTEI JUVENILE SEGMENTEDI
I
I I
FIRST I/- FIRsr our s YS-rEA? wIrH SOMETrAM3/rTIME VAR/AT/ON.
BLOODPOOL
CVIRCLATINCPOOL
P O
RANDOMLOSS
*
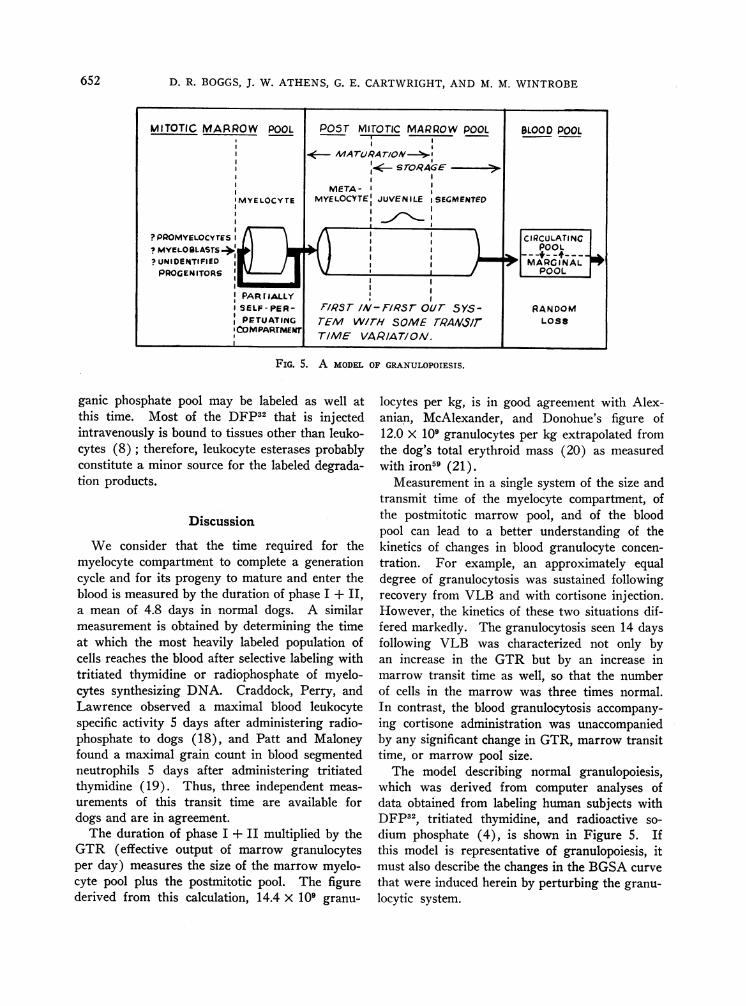
FIG. 5. A MODELOF GRANULOPOIESIS.
ganic phosphate pool may be labeled as well atthis time. Most of the DFP32 that is injectedintravenously is bound to tissues other than leuko-cytes (8); therefore, leukocyte esterases probablyconstitute a minor source for the labeled degrada-tion products.
Discussion
We consider that the time required for themyelocyte compartment to complete a generationcycle and for its progeny to mature and enter theblood is measured by the duration of phase I + II,a mean of 4.8 days in normal dogs. A similarmeasurement is obtained by determining the timeat which the most heavily labeled population ofcells reaches the blood after selective labeling withtritiated thymidine or radiophosphate of myelo-cytes synthesizing DNA. Craddock, Perry, andLawrence observed a maximal blood leukocytespecific activity 5 days after administering radio-phosphate to dogs (18), and Patt and Maloneyfound a maximal grain count in blood segmentedneutrophils 5 days after administering tritiatedthymidine (19). Thus, three independent meas-urements of this transit time are available fordogs and are in agreement.
The duration of phase I + II multiplied by theGTR (effective output of marrow granulocytesper day) measures the size of the marrow myelo-cyte pool plus the postmitotic pool. The figurederived from this calculation, 14.4 X 10⁹ granu-
locytes per kg, is in good agreement with Alex-anian, McAlexander, and Donohue's figure of12.0 X 109 granulocytes per kg extrapolated fromthe dog's total erythroid mass (20) as measuredwith iron59 (21).
Measurement in a single system of the size andtransmit time of the myelocyte compartment, ofthe postmitotic marrow pool, and of the bloodpool can lead to a better understanding of thekinetics of changes in blood granulocyte concen-tration. For example, an approximately equaldegree of granulocytosis was sustained followingrecovery from VLB and with cortisone injection.However, the kinetics of these two situations dif-fered markedly. The granulocytosis seen 14 daysfollowing VLB was characterized not only byan increase in the GTR but by an increase inmarrow transit time as well, so that the numberof cells in the marrow was three times normal.In contrast, the blood granulocytosis accompany-ing cortisone administration was unaccompaniedby any significant change in GTR, marrow transittime, or marrow pool size.
The model describing normal granulopoiesis,which was derived from computer analyses ofdata obtained from labeling human subjects withDFP32, tritiated thymidine, and radioactive so-dium phosphate (4), is shown in Figure 5. Ifthis model is representative of granulopoiesis, itmust also describe the changes in the BGSAcurvethat were induced herein by perturbing the granu-locytic system.
652
I
II

GRANULOPOIESIS
At least three morphologically distinguishablemitotic compartments are recognized in granulo-cyte production, the myeloblast compartment, pro-myelocyte compartment, and myelocyte compart-ment. One of the primary differences betweenthe model portrayed in Figure 5 and the usualscheme proposed for granulocyte production isthe type of mitosis taking place in the myelocytecompartment.
The classic scheme of granulocyte productionincorporates a theoretic and morphologically un-identified stem cell compartment. The progenyof mitosis in the stem cell compartment may eithermature and enter the myeloblast compartment orremain as stem cells. Under homeostatic condi-tions of granulocyte production, one-half of theprogeny of stem cell mitosis matures and entersthe myeloblast compartment, and one-half remainsstem cells to perpetuate the system. Once a cellmatures beyond the stem cell compartment, allsubsequent mitoses are of a different type inwhich all progeny must mature and enter thenext compartment. This scheme is depicted inFigure 6-A. In this scheme each stem cell mitosisusually results in one-half of the cells producedentering the next compartment, whereas a mitosisin subsequent compartments results in all cellsproduced entering the next compartment.
The scheme proposed herein (Figure 6-B)differs from the classic scheme (Figure 6-A) inthat at any mitotic compartment level the progenymay remain in that compartment to divide again,or they may mature and enter the next compart-ment. It is proposed that in the myelocyte com-partment, under homeostatic conditions, approxi-mately one-half of the mitotic progeny maturesand one-half remains in the myelocyte compart-ment to perpetuate the compartment. A compart-ment wherein all mitotic progeny must mature hasbeen referred to previously as an "open" com-partment, and a compartment wherein mitoticprogeny may either mature or remain in the com-partment has been referred to as a "semi-closed"compartment (4). It should be emphasized thatthe actual process of mitosis is the same in thesecompartments and that the subsequent behaviorof the progeny determines the nature of the popu-lation.
The hypothesis of a myelocyte compartmentthat approaches self-perpetuation was formulated
FIG. 6. THREE SCHEMESOF MITOSIS IN MARROWCOM-
PARTMENTS. The classic scheme that is usually assumedis illustrated in Figure 6-A. The hypothesis of a seriesof partially self-perpetuating mitotic compartments is il-lustrated in 6-B. A modified classic scheme that is alsocompatible with our data is illustrated in 6-C.
to explain the exponential slope of phase III ofthe BGSAcurve in man (4) or dog. The slopeof phase III would be uninfluenced by eradicationof the myelocyte compartment if all postmitoticmyelocytes matured as shown in Figure 6-A.Since marked reduction of the myelocyte com-partment with VLB shortened the t4 of phaseIII, it is apparent that phase III is influenced bythe myelocyte compartment. Therefore, our dataare not compatible with the scheme depicted inFigure 6-A. However, if the number of mitoticcompartments is expanded to include at leastthree such compartments within the morphologicboundaries of the myelocyte compartment, then ascheme other than a self-perpetuating myelocytecompartment is compatible with our data (Figure6-C).
Killmann and co-workers (22) have empha-sized a further unknown with respect to the typeof mitosis taking place in various compartments.They termed a myelocyte mitosis that results in
.653
D. R. BOGGS, J. W. ATHENS, G. E. CARTWRIGHT,AND M. M. WINTROBE
the formation of two myelocytes which must thenmature in order to leave the compartment, "homo-morphogenic" division, and a myelocyte mitosisthat results in the postmitotic appearance of twometamyelocytes, "heteromorphogenic" division.If heteromorphogenic mitosis exists, then mito-sis in our self-perpetuating myelocyte compart-ment would be an asymmetric mitosis, that is, atthe completion of a myelocyte mitosis one of theprogeny would be a metamyelocyte and the othera myelocyte. Although either homomorphogenicor heteromorphogenic mitosis will fit our data, wehave illustrated homomorphogenic mitosis in themodels portrayed in Figures 5 and 6.
A myelocyte compartment approaching self-perpetuation is an unproven hypothesis. How-ever, this hypothesis represents the simplest modelthat will explain the exponential slope of phaseIII in the BGSAcurve. This model is compat-ible with the labeling curves observed followingadministration of H3-thymidine or radiophosphateas leukocyte labels (4) and will account for the"lost" myelocytes in the "myelocyte-sink" pro-posed by Patt and Maloney (2). Furthermore,with the series of compartments approaching self-perpetuation depicted in Figure 6-B, the difficultyin demonstrating a fixed myeloblast to promyelo-cyte to myelocyte ratio (22) is obviated. If theassumption that promyelocytes and myeloblastsare precursors of myelocytes is correct, then thesecompartments can be considered reserve com-partments from which the granulocytic system canbe enlarged rapidly or from which lost myelocytesare replaced rapidly.
Assuming that the model in Figure 6-B or inFigure 6-C is correct, then the slope contributedto phase III by the myelocyte defines the myelo-cyte generation time. Myelocyte generation timeso measured lies between 18 and 25 hours de-pending upon what assumption is adopted for sub-tracting phase IV from phase III. Lala, Ma-loney, and Patt (23) measured the generationtime for myelocytes in dogs by means of tritiatedthymidine labeling and mitotic indexes and foundit to lie between 10 and 19 hours.
The accelerated slope of phase III observedin infection, after endotoxin, and following re-covery from VLB as well as the inverse correla-tion of the slope of phase III with the durationof phase I + II in normal dogs deserves com-
ment. Interpretation of these changes is com-plicated, since details of the kinetic perturbationin these circumstances are less clearly defined thanin the myelocyte ablation studies. A comprehen-sive explanation for these phase III changes wassought by entertaining hypotheses that includeda changing myelocyte generation time, skippedmyelocyte mitoses, a random release marrow stor-age pool, and return of cells to blood and marrow.
An accelerated myelocyte generation time orskipped myelocyte mitosis could explain thephase III change observed in infection and duringhypertrophy following VLB, but could not ex-plain the similar phase III change observed whenDFP32 was given with or 2 days following endo-toxin administration. A random release storagepool is compatible with the phase III change ob-served with endotoxin and with infection but notwith that observed during hypertrophy followingVLB. Furthermore, if there were a random re-lease storage pool, a direct relationship betweenphase II and phase III should have been observedin studies of normal dogs rather than the inverserelationship found. Return of cells to blood or tomarrow is incompatible with all of the observa-tions in the perturbed system. None of thesehypotheses was tenable as an explanation forthe observed slope of phase III in all of the dif-ferent studies.
The following hypothesis is compatible withall of the observed changes in the slope of phaseIII. The postmitotic marrow pool is a first-infirst-out kinetic system (Figure 5). Under nor-mal circumstances segmented neutrophils are pref-erentially released to the blood, but juvenile neu-trophils are released if segmented neutrophils arenot readily available. The limited number ofsegmented neutrophils in dog marrow (5 % ofgranulocytic cells) leads to a variation in marrowtransit since a segmented neutrophil is older thana juvenile neutrophil (24). An 8-hour standarddeviation about the mean transit time throughthe postmitotic compartment will explain the por-tion of the phase III slope in normal dogs thatwas not accounted for by the myelocyte generationtime and the blood transit time. As the marrowstorage pool increases in size, the relative num-ber of juvenile neutrophils released decreases sothat an approximate age cohort of segmented neu-trophils is released and transit time variation is
654

GRANULOPOIESIS
reduced. This explains the inverse correlation ofthe slope of phase III with the duration of phaseI + II in normal dogs as well as the reduced t1in the hypertrophied system following recoveryfrom VLB. Exhaustion of the reserve of seg-mented neutrophils also reduces the variationabout the mean transit time, since under thesecircumstances juvenile neutrophils, again approxi-mating an age cohort, are released to the blood.This explains the accelerated phase III observedwith infection and after endotoxin.
Summary
This study was undertaken to evaluate previ-ously published kinetic interpretations of the bloodgranulocyte specific activity (BGSA) curve ob-tained from labeling human granulocytes withintravenously administered radioactive diisopropylfluorophosphate (DFP32).
Dogs were given DFP32 intravenously, and afour-phase curve of BGSAwas observed. TheBGSAdeclined 20% during the first day (phaseI) and then remained relatively stable, decliningonly 2% per day, until the fifth day (phase II).An exponential decline in BGSA then super-vened (phase III) and was in turn succeeded bya final, slowly declining curve (phase IV).
The BGSA curve in normal dogs was con-trasted with that observed when the granulo-poietic system was perturbed by the administra-tion of vinblastine sulfate, endotoxin, or corti-sone or by the development of infection. Amarked reduction of marrow mitotic cells by VLBwas associated with a shortened phase I + II andan increased slope of phase III. Hypertrophy ofthe granulocytic system accompanied recoveryfrom VLB administration and was associatedwith an increase in the duration of phase I + IIand an increase in the slope of phase III. Ac-celeration of mature granulocyte release from thebone marrow by administering endotoxin was as-sociated with a shortened phase I + II and an in-creased slope of phase III. Blood granulocytosisinduced by cortisone produced no change in theblood granulocyte turnover rate and was not as-sociated with any change in the BGSA curve.Pulmonary infection, accompanied by blood gran-ulocytosis, was associated with a shortened phaseI + II and an increased slope of phase III. None
of these situations was associated with any sig-nificant change in the characteristics of phase IV.
From these studies and studies of initial label-ing conditions, the following interpretation of eachof the four phases of the BGSAcurve was de-rived. Phase I represents replacement of cellsthat were in the blood when DFP32 was given,by marrow cells with a lesser degree of labeling.Phase II represents the sequential delivery to theblood of marrow cells that were in the postmitoticpool when DFP32 was given as well as theprogeny of the first myelocyte generation afterlabeling. Phase III reflects dilution of the labelby the results of mitosis. Its slope is determinedby at least three factors: the myelocyte generationtime, the variation in transit time through thepostmitotic marrow compartment, and the bloodtransit time. Phase IV probably represents re-utilization of a metabolite of DFP32-labeled en-zymes.
A model of granulopoiesis that adequately de-scribes the data presented consists of the follow-ing. Myelocytes are to a degree self-perpetuat-ing; that is, one-half of the progeny of myelocytemitosis may remain myelocytes and divide again,thus perpetuating the compartment, whereas theother one-half may mature. The postmitotic mat-uration and storage compartment of the marrowoperates primarily as an orderly first-in first-outkinetic system. Granulocytes leave the bloodprimarily through random loss, and the entiresystem is unidirectional.
AcknowledgmentsWeare grateful to Miss Helen Ashenbrucker for tech-
nical assistance and to Mr. George Trappett and Mr.Dale Chlarson for their animal husbandry. We are in-debted to Dr. J. G. Armstrong of the Eli Lilly ResearchLaboratories for the vinblastine sulfate, to Dr. E. Alpertof the Merck Sharp & Dohme Research Laboratoriesfor the cortisone acetate, and to Dr. F. H. Schultz of theWander Company for the endotoxin (Lipexal).
References1. Cronkite, E. P., and T. M. Fliedner. Granulopoiesis.
New Engl. J. Med. 1964, 270, 1347, 1403.2. Patt, H. M., and M. A. Maloney. A model of granu-
locyte kinetics. Ann. N. Y. Acad. Sci. 1964, 113,515.
3. Craddock, C. G., Jr. The physiology of granulocyticcells in normal and leukemic states. Amer. J.Med. 1960, 28, 711.
655
D. R. BOGGS, J. W. ATHENS, G. E. CARTWRIGHT,AND M. M. WINTROBE
4. Warner, H. R., and J. W. Athens. An analysis ofgranulocyte kinetics in blood and bone marrow.Ann. N. Y. Acad. Sci. 1964, 113, 523.
5. Raab, S. O., J. W. Athens, 0. P. Haab, D. R. Boggs,H. Ashenbrucker, G. E. Cartwright, and M. M.Wintrobe. Granulokinetics in normal dogs. Amer.J. Physiol. 1964, 206, 83.
6. Athens, J. W., A. M. Mauer, H. Ashenbrucker, G. E.Cartwright, and M. M. Wintrobe. Leukokineticstudies. I. A method for labeling leukocytes withdiisopropylfluorophosphate (DFP'). Blood 1959,14, 303.
7. Folch, J., M. Lees, and G. H. S. Stanley. A simplemethod for the isolation and purification of totallipides from animal tissues. J. biol. Chem. 1957,226, 497.
8. Jandorf, B. J., and P. D. McNamara. Distributionof radiophosphorus in rabbit tissues after injectionof phosphorus-labeled diisopropyl-fluorophosphate.J. Pharmacol. exp. Ther. 1950, 98, 77.
9. Boggs, D. R., J. W. Athens, 0. P. Haab, P. A. Can-cilla, S. 0. Raab, G. E. Cartwright, and M. M.Wintrobe. Leukokinetic studies. VII. Morphologyof the bone marrow and blood of dogs given vin-blastine sulfate. Blood 1964, 23, 53.
10. Athens, J. W., 0. P. Haab, S. 0. Raab, A. M. Mauer,H. Ashenbrucker, G. E. Cartwright, and M. M.Wintrobe. Leukokinetic studies. IV. The totalblood, circulating and marginal granulocyte poolsand the granulocyte turnover rate in normal sub-jects. J. clin. Invest. 1961, 40, 989.
11. Kurth, D., J. W. Athens, E. P. Cronkite, G. E. Cart-wright, and M. M. Wintrobe. Leukokinetic stud-ies. V. Uptake of tritiated diisopropylfluorophos-phate by leukocytes. Proc. Soc. exp. Biol. (N. Y.)1961, 107, 422.
12. Craddock, C. G., Jr., S. Perry, L. E. Ventzke, andJ. S. Lawrence. Evaluation of marrow granulo-cytic reserves in normal and disease states. Blood1960, 15, 840.
13. Plapp, F. W., and J. E. Casida. Hydrolysis of thealkylphosphate bond in certain dialkyl aryl phos-phorothioate insecticides by rats, cockroaches, andalkali. J. econ. Entom. 1958, 51, 800.
14. Nemer, M. J., and D. Elwyn. The conversion of se-rine to ethanolamine and its derivatives in the rat.J. biol. Chem. 1960, 235, 2070.
15. Mizuno, N. S., V. Perman, F. W. Bates, J. H.Sautter, and M. 0. Schultz. Life span of thrombo-cytes and erythrocytes in normal and thrombocy-topenic calves. Blood 1959, 14, 708.
16. Cartwright, G. E., J. W. Athens, and M. M. Wintrobe.The kinetics of granulopoiesis in normal man.Blood 1964, 24, 780.
17. Byrne, W. L. Glucose 6-phosphatase and phospho-serine phosphatase in The Enzymes, 2nd ed., P. D.Boyer, H. Lardy, and K. Myrback, Eds. NewYork and London, Academic Press, 1961, vol. 5,p. 73.
18. Craddock, C. G., S. Perry, and J. S. Lawrence. Thedynamics of leukopoiesis and leukocytosis, asstudied by leukopheresis and isotopic techniques.J. clin. Invest. 1956, 35, 285.
19. Patt, H. M., and M. A. Maloney. Kinetics of neu-trophil balance in The Kinetics of Cellular Pro-liferation, F. Stohlman, Jr., Ed. New York andLondon, Grune & Stratton, 1959, p. 201.
20. Alexanian, R., R. McAlexander, and D. Donohue.Effect of splenectomy upon bone marrow cellu-larity in the dog. Clin. Res. 1965, 13, 38.
21. Donohue, D. M., R. H. Reiff, M. L. Hanson, Y.Betson, and C. A. Finch. Quantitative measure-ment of the erythrocytic and granulocytic cells ofthe marrow and blood. J. clin. Invest. 1958, 37,1571.
22. Killmann, S-A., E. P. Cronkite, T. M. Fliedner, V.P. Bond, and G. Brecher. Mitotic indices of hu-man bone marrow cells. II. The use of mitoticindices for estimation of time parameters of pro-liferation in serially connected multiplicative cellu-lar compartments. Blood 1963, 21, 141.
23. Lala, P. K., M. A. Maloney, and H. M. Patt. Acomparison of two markers of cell proliferation inbone marrow. Acta haemat. (Basel) 1964, 31, 1.
24. Bond, V. P., T. M. Fliedner, E. P. Cronkite, J. R.Rubini, and J. S. Robertson. Cell turnover inblood and blood forming tissues studied with tri-tiated thymidine in The Kinetics of Cellular Pro-liferation, F. Stohlman, Jr., Ed. New York andLondon, Grune & Stratton, 1959, p. 188.
656


![[XLS] · Web viewAagman Hospital, Madhav Vatika,Sojitra Nagar-Limbu Ni Wadia Raiya Road,Rajkot 360007 2474083/2452193 2474083 WINTROBE HOSPITAL Ambari. G N B Road,,Opp.Agp Headquarters,Guwahati](https://static.fdocuments.in/doc/165x107/5aa09d9b7f8b9a7f178e54e2/xls-viewaagman-hospital-madhav-vatikasojitra-nagar-limbu-ni-wadia-raiya-roadrajkot.jpg)