"Evaluating the Impacts of Speed Limit Policy Alternatives ... · Evaluating the Impacts of Speed...
163
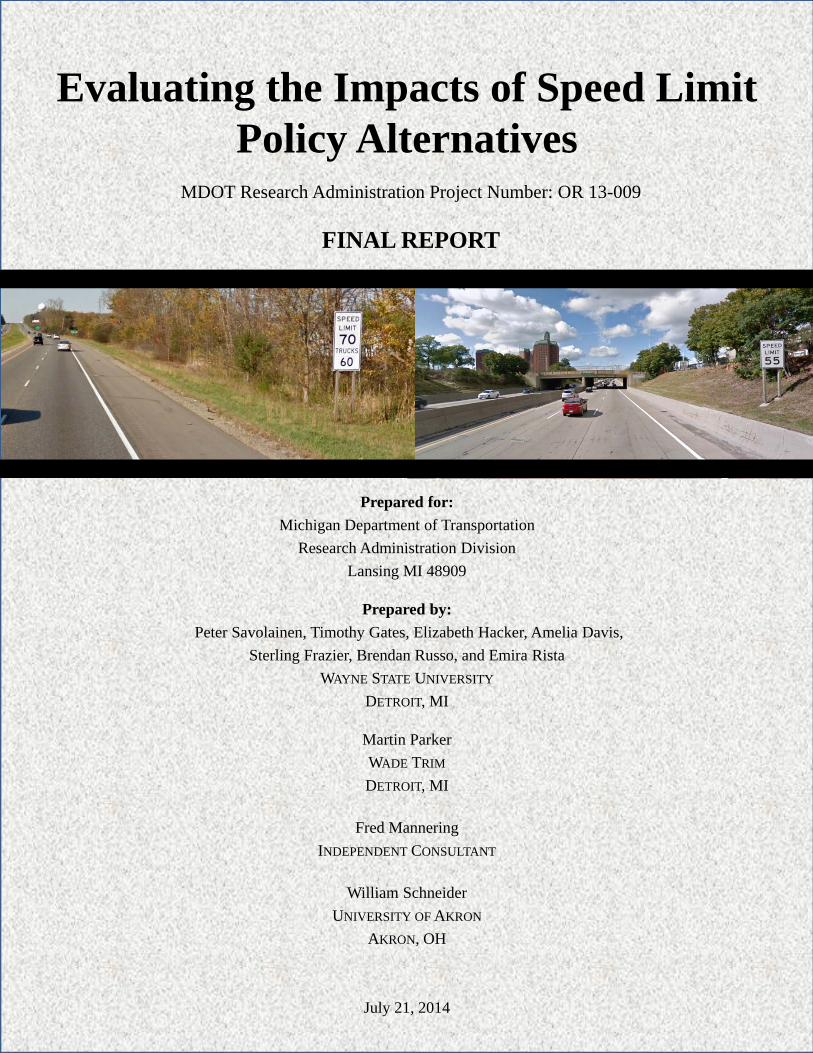
Evaluating the Impacts of Speed Limit Policy Alternatives Prepared for: Michigan Department of Transportation Research Administration Division Lansing MI 48909 Prepared by: Peter Savolainen, Timothy Gates, Elizabeth Hacker, Amelia Davis, Sterling Frazier, Brendan Russo, and Emira Rista W AYNE STATE UNIVERSITY DETROIT , MI Martin Parker W ADE TRIM DETROIT , MI Fred Mannering INDEPENDENT CONSULTANT William Schneider UNIVERSITY OF AKRON AKRON, OH July 21, 2014 MDOT Research Administration Project Number: OR 13-009 FINAL REPORT
Transcript of "Evaluating the Impacts of Speed Limit Policy Alternatives ... · Evaluating the Impacts of Speed...
Evaluating the Impacts of Speed Limit Policy Alternatives
Prepared for:
Michigan Department of Transportation
Research Administration Division
Lansing MI 48909
Prepared by:
Peter Savolainen, Timothy Gates, Elizabeth Hacker, Amelia Davis,
Sterling Frazier, Brendan Russo, and Emira Rista
WAYNE STATE UNIVERSITY
DETROIT, MI
Martin Parker
WADE TRIM
DETROIT, MI
Fred Mannering
INDEPENDENT CONSULTANT
William Schneider
UNIVERSITY OF AKRON
AKRON, OH
July 21, 2014
MDOT Research Administration Project Number: OR 13-009
FINAL REPORT

Evaluating the Impacts of Speed Limit Policy Alternatives
MDOT Research Administration Project Number: OR13-009
FINAL REPORT
by
Peter Savolainen Timothy Gates
Elizabeth Hacker Amelia Davis
Sterling Frazier Brendan Russo
Emira Rista WAYNE STATE UNIVERSITY
DETROIT, MI
Martin Parker WADE TRIM DETROIT, MI
Fred Mannering
INDEPENDENT CONSULTANT
William Schneider
UNIVERSITY OF AKRON AKRON, OH
July 21, 2014
i
1. Report No. RC-1609
2. Government Accession No. N/A
3. MDOT Project Manager Jason Firman
4. Title and Subtitle Evaluating the Impacts of Speed Limit Policy Alternatives
5. Report Date July 21, 2014
6. Performing Organization Code N/A
7. Author(s) Peter Savolainen, Timothy Gates, Elizabeth Hacker, Amelia Davis, Sterling Frazier, Brendan Russo, Emira Rista, Martin Parker, Fred Mannering, and William Schneider
8. Performing Org. Report No. N/A
9. Performing Organization Name and Address Wayne State University 5057 Woodward, Suite 13001 Detroit, Michigan 48202
10. Work Unit No. (TRAIS) N/A 11. Contract No. 2013-0070 11(a). Authorization No. Z2
12. Sponsoring Agency Name and Address Michigan Department of Transportation Research Administration 8885 Ricks Rd. P.O. Box 30049 Lansing MI 48909
13. Type of Report & Period Covered Final Report 02/26/2013 – 06/30/2014
14. Sponsoring Agency Code N/A
15. Supplementary Notes Project Title: Evaluating Differential and Non-Differential Freeway Truck and Bus Speed Limits 16. Abstract As of June 2014, Michigan is one of eight states with a differential speed limit in place on its rural freeways, which sets a maximum speed of 70 mph for passenger vehicles and 60 mph for trucks and buses. In select urban environments, these speed limits are both reduced to a uniform 55 mph limit. Legislation was introduced in early 2014 that proposed increases to these speed limits. In order to ascertain the potential impacts of these proposed speed limit increases, this research examined a broad range of traffic safety, operational, environmental, and economic data. This study involved a comprehensive state-of-the-art review of prior research on the relationships between traffic speed, safety, and crash risk. A survey was conducted of state agency practices with respect to speed limit establishment and another survey was conducted to obtain feedback on proposed changes from the trucking industry. National fatality data were collected and analyzed to ascertain the effects of speed limit policies on traffic fatalities, with specific emphasis on maximum speed limits and the effects of uniform vs. differential limits on urban and rural interstates. Further analyses were conducted at the disaggregate level to examine crash trends on Michigan freeways. These results were supplemented by the analysis of field speed data that were collected on freeways in Michigan, Indiana, and Ohio. Differences in mean speeds, 85th percentile speeds, and the standard deviation in speeds among passenger cars, trucks, and buses were examined with respect to the speed limit policies in place at each of 160 roadway locations. Based upon the results of the fatality and speed data analyses, a benefit-cost analysis of the proposed speed limit change was conducted in consideration of both road user and agency costs. Recommendations were presented to aid in decision-making related to speed limit policies. 17. Key Words Speed Limit, Speed Policy, Speed Differential, Operating Speed, Highway Safety, Crashes, Economics
18. Distribution Statement No restrictions. This document is available to the public through the Michigan Department of Transportation
19. Security Classification - report Unclassified
20. Security Classification - page Unclassified
21. No. of Pages 160
22. Price N/A

ii
DISCLAIMER
This publication is disseminated in the interest of information exchange. The Michigan
Department of Transportation (hereinafter referred to as MDOT) expressly disclaims any
liability, of any kind, or for any reason, that might otherwise arise out of any use of this
publication or the information or data provided in the publication. MDOT further disclaims any
responsibility for typographical errors or accuracy of the information provided or contained
within this information. MDOT makes no warranties or representations whatsoever regarding the
quality, content, completeness, suitability, adequacy, sequence, accuracy or timeliness of the
information and data provided, or that the contents represent standards, specifications, or
regulations.

iii
ACKNOWLEDGEMENT
The authors would like to thank the following members of the Research Advisory Panel for
providing valuable contributions to this project:
Jason Firman, MDOT, Project
Manager
Michael Townley, MDOT, Research
Manager
Mark Bott, MDOT
Susan Gorski, MDOT
Peggy Johnson, MDOT
Tracie Leix, MDOT
Patrick Morris, Michigan State
Police
Jack Rick, MDOT
Kyle Rudlaff, MDOT
Additionally, the authors would like to recognize the following individuals for providing data or
other valuable information to this project:
Dan Armentrout, Clinton County
Road Commission
Garrett Dawe, MDOT
Colin Forbes, MDOT
Dawn Gustafson, MDOT
Tim Haagsma, Kent County Road
Commission
Don Howe, MDOT
Larry Hummel, Van Buren County
Road Commission
Carla Kohoyda-Inglis, International
Center for Automotive Medicine
William Loehle, MDOT
David Morena, FHWA
Gary Piotrowicz, Road Commission
for Oakland County
Jacqueline Pethers, MDOT
Michael Prince, Michigan Office of
Highway Safety Planning
Scott Thayer, MDOT
Alonso Uzcategui, MDOT
Brad Wieferich, MDOT
Eileen Worden, Michigan
Department of Community Health
Acknowledgement is also given to other state departments of transportation and the Federal
Motor Carrier Safety Administration for providing safety data for use within the project.
iv
TABLE OF CONTENTS
EXECUTIVE SUMMARY .......................................................................................................... xi
PROBLEM AND OBJECTIVES .......................................................................................... xi
CRASH EVALUATION ..................................................................................................... xii
SPEED EVALUATION ..................................................................................................... xiii
ECONOMIC EVALUATION ............................................................................................ xiv
CONCLUSIONS AND RECOMMENDATIONS .................................................................. xv
CHAPTER 1: INTRODUCTION ................................................................................................... 1
STATEMENT OF PROBLEM ............................................................................................... 1
STUDY GOAL AND OBJECTIVES ...................................................................................... 3
SUMMARY OF TASKS ....................................................................................................... 3
CHAPTER 2: LITERATURE AND HISTORICAL REVIEW OF SPEED LIMITS AND THE
RELATIONSHIP BETWEEN SPEED AND SAFETY ..................................................................5
GENERAL OVERVIEW ................................................................................................................. 5
THE RELATIONSHIP BETWEEN SPEED, RISK, AND SAFETY ............................................. 6
SPEED, RISK, AND SAFETY TRENDS FOLLOWING SPEED LIMIT CHANGES ............... 11
EFFECTS OF SPEED LIMITS ON ACTUAL SPEEDS .............................................................. 15
SPEED LIMIT COMPLIANCE IN WORK ZONES .................................................................... 17
SPEED LIMIT COMPLIANCE IN SCHOOL ZONES ................................................................ 19
DIFFERENTIAL VERSUS UNIFORM LIMITS FOR TRUCKS AND BUSES ......................... 19
VEHICLE SPEED IMPACTS ON PEDESTRIANS AND BICYCLISTS ................................... 23
RECENT AND PROPOSED CHANGES TO STATE SPEED LIMIT POLICIES ...................... 25
FEEDBACK FROM THE TRUCKING INDUSTRY ................................................................... 30
LITERATURE SUMMARY ......................................................................................................... 31
CHAPTER 3: ANALYSIS OF NATIONAL- AND STATE-LEVEL TRAFFIC CRASH
DATA ...........................................................................................................................................32
ANALYSIS OF NATIONAL INTERSTATE FATALITY DATA .............................................. 32
STATISTICAL METHODS .......................................................................................................... 43
ANALYSIS RESULTS – RURAL INTERSTATE HIGHWAYS ................................................. 45
PAGE

v
ANALYSIS RESULTS – URBAN INTERSTATE HIGHWAYS ................................................ 53
SUMMARY OF ANALYSES FOR RURAL AND URBAN INTERSTATE HIGHWAYS ........ 58
ANALYSIS OF MICHIGAN FREEWAY CRASH DATA .......................................................... 59
CHAPTER 4: ANALYSIS OF FIELD SPEED DATA .................................................................70
DATA COLLECTION .........................................................................................................70
STATISTICAL METHODS ..................................................................................................77
SPEED DATA ANALYSIS RESULTS .................................................................................78
CHAPTER 5: BENEFIT/COST ANALYSIS ................................................................................84
INFRASTRUCTURE IMPACTS .................................................................................................. 84
SPEED LIMIT SIGNS ................................................................................................................... 84
ROADWAY GEOMETRIC FEATURES ..................................................................................... 86
CASE STUDY 1. HORIZONAL CURVE REALIGNMENT ON RURAL FREEWAY .............. 88
CASE STUDY 2. HORIZONTAL AND VERTICAL CURVE REALIGNMENT AT A RURAL
FREEWAY INTERCHANGE ....................................................................................................... 89
CASE STUDY 3. HORIZONTAL CURVE MODIFICATION AT BRIDGE WITH
SUBSTANDARD VERTICAL CLEARANCE ON RURAL FREEWAY .................................... 90
CASE STUDY 4. US-31 IN OCEANA COUNTY (RURAL FREEWAY CORRIDOR) .............. 92
CASE STUDY 5. US-131 IN MOTCALM COUNTY (RURAL FREEWAY CORRIDOR) ....... 92
CASE STUDY 6. I-94 IN BERRIEN AND VAN BUREN COUNTIES (RURAL FREEWAY
CORRIDOR) .................................................................................................................................. 93
CASE STUDY 7. I-94 IN ST. CLAIR SHORES (DENSE URBAN FREEWAY CORRIDOR) ... 94
CASE STUDY 8. I-196 IN GRAND RAPIDS (DENSE URBAN FREEWAY CORRIDOR) ...... 96
ADDITIONAL IMPACTS ON NON-FREEWAYS ..................................................................... 97
CASE STUDY 9. US-223, M-50, AND M-52 IN LENAWEE COUNTY (SIGNING AND
MARKING UPGRADES ONLY) .................................................................................................. 98
CASE STUDY 10. M-37 IN NEWAYGO COUNTY (EXTENSIVE GEOMETRIC
MODIFICATIONS) ....................................................................................................................... 99
CASE STUDY 11. US-2 IN MACKINAC COUNTY (MINIMAL GEOMETRIC
MODIFICATIONS) .................................................................................................................... 100
INFRASTRUCTURE COST SUMMARY .................................................................................. 100
FUEL CONSUMPTION IMPACTS ........................................................................................... 102
TRAVEL TIME IMPACTS ......................................................................................................... 106
IMPACTS ON TRAFFIC FATALITIES .................................................................................... 107

vi
BENEFIT/COST ANALYSIS ..................................................................................................... 109
NOISE IMPACTS ....................................................................................................................... 111
ADDITIONAL IMPACTS – AIR QUALITY ............................................................................. 114
CASE STUDY OF EMISSION IMPACTS ................................................................................. 116
RESULTS OF EMISSIONS CASE STUDY ............................................................................... 116
ADDITIONAL IMPACTS – PAVEMENT CONDITION ......................................................... 120
CHAPTER 6: CONCLUSIONS AND RECOMMENDATIONS ...............................................122
CONCLUSIONS ......................................................................................................................... 123
RECOMMENDATIONS ............................................................................................................. 126
AREAS FOR FUTURE RESEARCH ......................................................................................... 128
APPENDIX: FIELD SPEED DATA ...........................................................................................129
REFERENCES ............................................................................................................................138

vii
LIST OF TABLES
Table 1. Recent Changes to Speed Limit Policies by State .......................................................... 27
Table 2. Proposed Changes to Speed Limit Policies by State (as of January 2014) ..................... 29
Table 3. Trucking Industry Survey Results ...................................................................................30
Table 4. Annual Vehicle-Miles (Millions) for Rural and Urban Interstates by State ....................35
Table 5. Percentage of Annual Miles Traveled by Vehicle Type for Rural & Urban Interstates .36
Table 6. Seatbelt Use Rates by State (2013 Data) .........................................................................41
Table 7. Summary Statistics ..........................................................................................................42
Table 8. Model Results for Annual Rural Interstate Fatalities ......................................................50
Table 9. Model Results for Annual Rural Interstate Truck- and Bus-Involved Fatalities .............51
Table 10. Trends in the Percentage of Rural Interstate Fatalities by Speed Limit Policy .............52
Table 11. Model Results for Annual Urban Interstate Fatalities ...................................................55
Table 12. Trends in the Percentage of Urban Interstate Fatalities by Speed Limit Policy ............57
Table 13. Elasticities for Rural and Urban Interstate Fatality Models ..........................................58
Table 14. Average Freeway Directional Mileage and Vehicle-Miles of Travel, 2004 to 2012 ....60
Table 15. Average Number of Total, Injury, and Fatal Freeway Crashes, 2004 to 2012 ..............61
Table 16. Average Crash, Injury, and Fatality Rates on Michigan Freeways, 2004 to 2012 ........61
Table 17. Segment Information for Urban Freeway Crash Analysis .............................................65
Table 18. Urban Freeway Crashes Before and After Speed Limit Increase, by Site .....................66
Table 19. Aggregate Urban Freeway Crash Rates Before and After Speed Limit Increase ..........67
Table 20. Regression Model Results for Annual and Injury Crashes at Segments .......................69
Table 21. Summary Statistics of Dependent Variables for SURE Models ....................................79
Table 22. Summary Statistics of Independent Variables for SURE Models .................................79
Table 23. Seemingly Unrelated Regression Equations (SURE) Results for Passenger Vehicles .80
Table 24. Seemingly Unrelated Regression Equations (SURE) Results for Trucks/Buses ...........81
Table 25. Seemingly Unrelated Regression Equations (SURE) Results for All Vehicles ............82
Table 26. Infrastructure Costs Associated with Increased Speed Limits .....................................102
Table 27. Fuel Economy based on Mean Speed, by Speed Limit and Vehicle Type .................103
Table 28. Vehicle-Miles Traveled on MDOT Highways ............................................................105
Table 29. Estimated Annual Fuel Consumption Cost Increase ...................................................105
Table 30. Value-of-Time Unit Costs by Vehicle Type and Year ................................................106
Table 31. Estimated Annual Travel Time Savings ......................................................................107
Table 32. Changes in Estimated Annual Fatal Crashes and Associated Costs by Speed Limit
Policy Scenario ............................................................................................................................109
Table 33. Results of Systemwide Benefit/Cost Analysis by Speed Limit Policy Scenario .........110
PAGE
viii
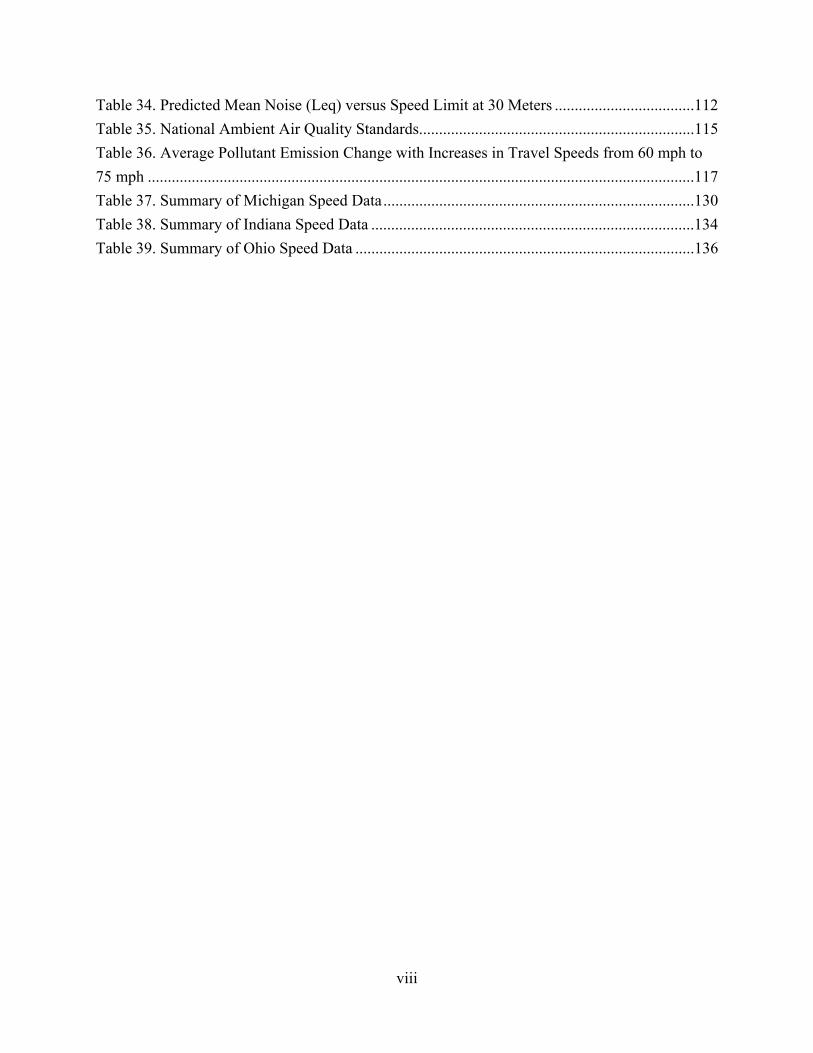
Table 34. Predicted Mean Noise (Leq) versus Speed Limit at 30 Meters ...................................112
Table 35. National Ambient Air Quality Standards.....................................................................115
Table 36. Average Pollutant Emission Change with Increases in Travel Speeds from 60 mph to
75 mph .........................................................................................................................................117
Table 37. Summary of Michigan Speed Data ..............................................................................130
Table 38. Summary of Indiana Speed Data .................................................................................134
Table 39. Summary of Ohio Speed Data .....................................................................................136
ix
LIST OF FIGURES
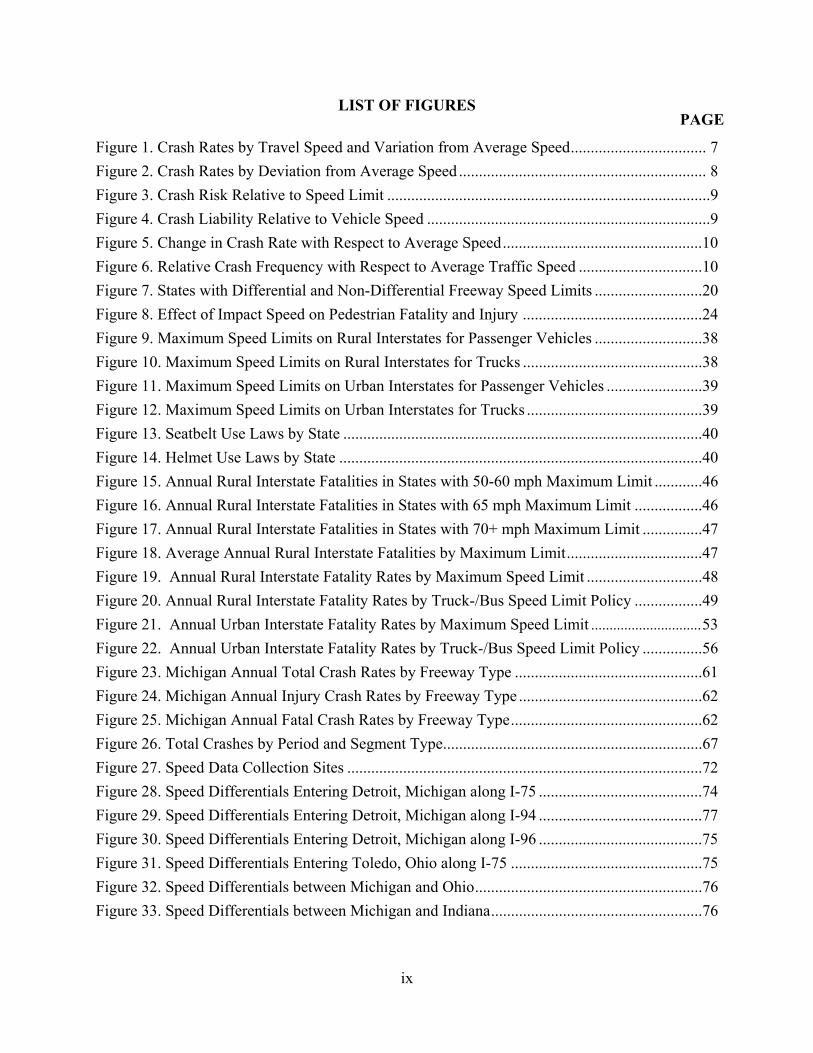
Figure 1. Crash Rates by Travel Speed and Variation from Average Speed .................................. 7
Figure 2. Crash Rates by Deviation from Average Speed .............................................................. 8
Figure 3. Crash Risk Relative to Speed Limit .................................................................................9
Figure 4. Crash Liability Relative to Vehicle Speed .......................................................................9
Figure 5. Change in Crash Rate with Respect to Average Speed ..................................................10
Figure 6. Relative Crash Frequency with Respect to Average Traffic Speed ...............................10
Figure 7. States with Differential and Non-Differential Freeway Speed Limits ...........................20
Figure 8. Effect of Impact Speed on Pedestrian Fatality and Injury .............................................24
Figure 9. Maximum Speed Limits on Rural Interstates for Passenger Vehicles ...........................38
Figure 10. Maximum Speed Limits on Rural Interstates for Trucks .............................................38
Figure 11. Maximum Speed Limits on Urban Interstates for Passenger Vehicles ........................39
Figure 12. Maximum Speed Limits on Urban Interstates for Trucks ............................................39
Figure 13. Seatbelt Use Laws by State ..........................................................................................40
Figure 14. Helmet Use Laws by State ...........................................................................................40
Figure 15. Annual Rural Interstate Fatalities in States with 50-60 mph Maximum Limit ............46
Figure 16. Annual Rural Interstate Fatalities in States with 65 mph Maximum Limit .................46
Figure 17. Annual Rural Interstate Fatalities in States with 70+ mph Maximum Limit ...............47
Figure 18. Average Annual Rural Interstate Fatalities by Maximum Limit ..................................47
Figure 19. Annual Rural Interstate Fatality Rates by Maximum Speed Limit .............................48
Figure 20. Annual Rural Interstate Fatality Rates by Truck-/Bus Speed Limit Policy .................49
Figure 21. Annual Urban Interstate Fatality Rates by Maximum Speed Limit .............................. 53
Figure 22. Annual Urban Interstate Fatality Rates by Truck-/Bus Speed Limit Policy ...............56
Figure 23. Michigan Annual Total Crash Rates by Freeway Type ...............................................61
Figure 24. Michigan Annual Injury Crash Rates by Freeway Type ..............................................62
Figure 25. Michigan Annual Fatal Crash Rates by Freeway Type ................................................62
Figure 26. Total Crashes by Period and Segment Type .................................................................67
Figure 27. Speed Data Collection Sites .........................................................................................72
Figure 28. Speed Differentials Entering Detroit, Michigan along I-75 .........................................74
Figure 29. Speed Differentials Entering Detroit, Michigan along I-94 .........................................77
Figure 30. Speed Differentials Entering Detroit, Michigan along I-96 .........................................75
Figure 31. Speed Differentials Entering Toledo, Ohio along I-75 ................................................75
Figure 32. Speed Differentials between Michigan and Ohio .........................................................76
Figure 33. Speed Differentials between Michigan and Indiana .....................................................76
PAGE

x
Figure 34. Typical Freeway Curve that may Warrant Additional Curve Warning Signage after
Speed Limit Increase ......................................................................................................................86
Figure 35. Expected Horizontal Curve Realignment, I-94 Berrien County ..................................89
Figure 36. Expected Interchange Geometric Modifications, I-94 Berrien County .......................90
Figure 37. Impact on Bridge Vertical Clearance Associated with Superelevation Increase, I-94
Kalamazoo County ........................................................................................................................91
Figure 38. Expanded Bridge Replacement Footprint to Achieve Vertical Clearance ...................91
Figure 39. Expected Major Geometric Upgrades on I-94 in Berrien and Van Buren Counties
after Speed Limit Increase from 70 to 80 mph ..............................................................................94
Figure 40. Horizontal Curve Requiring Realignment if Speed Limit is increased to 70 mph, I-94
Macomb County.............................................................................................................................95
Figure 41. Typical Necessary Passing Zone Modifications after Speed Limit Increase ...............98
Figure 42. Example Horizontal Curve, M-37 Newaygo County ...................................................99
Figure 43. Typical Cross-Section, US-2 Mackinac County ........................................................100
Figure 44. Predicted Impacts of Speed Limit Policy on Mean Speed and Mean Noise ..............113
Figure 45. Flow of Data and Anticipated Results of the Simulations .........................................118

xi
EXECUTIVE SUMMARY
The repeal of the National Maximum Speed Limit in 1995 returned all speed limit determination
authority to the individual states. Since then, a wide variety of speed limit policies were enacted
and modified, with nearly all states eventually choosing to raise maximum freeway speed limits
beyond previous federal limits. Recently, further speed limit policy modifications have resulted
in a general upward trend in many states, particularly for rural freeways and in western states.
Between April 2011 and January 2014, at least 14 states have increased speed limits or are
proposing to do so, with a majority of these increases involving rural freeways. The popularity
of differential speed limits between passenger vehicles and heavy vehicles (trucks/buses) has
also diminished over time, with eight states continuing to maintain such differentials, all but
three of which are located in the western United States.
With the trend of increasing speed limits continuing to expand throughout the United States, the
Michigan legislature proposed Senate Bill 896 in March of 2014. SB 896 proposed new
legislation that would create a new “Rural Freeway General Speed Limit” of 80 mph (currently
70 mph) and a new “Urban Freeway General Speed Limit” of 70 mph (currently ranging from 55
to 70 mph). The legislation also proposes to increase the maximum speed limit for trucks and
buses to 70 mph (currently 60 mph), thereby maintaining a differential speed limit between
passenger vehicles and trucks/buses on rural freeways. Additional speed limit increases have
been proposed for non-limited access roadways, as well.
PROBLEM AND OBJECTIVES
Research was necessary to determine the potential impacts of the speed limit changes proposed
by SB 896 to assist the Michigan Department of Transportation (MDOT) and the State of
Michigan with critical decisions related to the bill. Increasing the maximum speed limit on
Michigan roadways is expected to potentially impact various measures including: mean and 85th
percentile speeds, speed variance, fatality rates, road user costs, pavement condition, air quality,
noise, and trucking industry economics. Thus, in order to fully understand the impacts of these
proposed speed limit increases, a careful analysis was required, considering a broad range of
traffic safety, operational, environmental, and economic data. These data were available from a
variety of sources, including several states that have recently changed their passenger car speed
limits, their truck/bus speed limits, or both.

xii
The primary objective of this research was to examine available empirical evidence to estimate
the impacts of proposed speed limit changes on traffic safety, mobility, economics, and
environmental aspects in Michigan. To better understand the possible effects that may occur if
the proposed speed limit policies are enacted, several tasks were performed, including:
A comprehensive review of the literature and survey of state policy/practice;
Collection and analysis of national freeway fatality data, as well as disaggregate level
data for Michigan freeways, to determine speed limit policy impacts;
Collection and analysis of speed data from Michigan, Indiana, and Ohio to ascertain the
impacts of the different speed limit policies that exist between the three states; and
Analysis of the expected economic impacts associated with the proposed speed limit
changes, including both agency and road user costs.
CRASH EVALUATION
The comprehensive review of the literature and state agency policy/practices showed that higher
maximum speed limits tend to result in increases in traffic fatalities. This is particularly true for
rural freeways, which have the highest limits among all functional roadway classes in the United
States, ranging up to as high as 85 mph on select facilities in Texas. The research on differential
limits has generally been inconsistent, with some states demonstrating higher fatality rates and
others exhibiting lower rates as compared to states with uniform limits. One of the reasons that
many states have transitioned from differential to uniform limits has been due to the fact that
uniform limits have been shown to reduce the variance in travel speeds, which may in turn
reduce the risk of traffic crashes and resultant injuries/fatalities.
Fatal crash data from 1999 through 2011 were obtained and examined, with specific emphasis
placed on assessing the fatal crash impacts of maximum speed limits, in addition to the effects of
uniform vs. differential limits on urban and rural interstates. The results showed traffic fatalities
to increase consistently with maximum speed limits in rural environments. Compared to
interstates with 60 or 65 mph limits, fatalities increased by 31.0 percent in states with 70 mph
maximum limits and by 54.0 percent in states with maximum limits of 75 mph or above. Unlike
in rural areas, consistent trends between fatal crashes and maximum speed limits were not
observed on urban interstates. Rural truck- and bus-involved interstate fatalities were 20 percent
higher in states with uniform speed limits than in states with differential limits for such vehicles.

xiii
As in the case of maximum speed limits, fatality rates were not significantly different on urban
interstates between states with uniform and differential truck and bus limits. Single-vehicle
crashes were most prevalent on high-speed rural interstates. States with lower rural speed limits
experienced a higher percentage of rear-end collisions. Rear-end collisions were also more
prevalent on urban freeways.
To better understand differences in safety performance between urban and rural freeways, a
longitudinal study of freeway crashes was conducted for Michigan freeways over the period
from 2004 through 2012. Explicit comparisons were made between segments posted at a
uniform 55 mph and those urban and rural segments that were posted at 70 mph for passenger
vehicles and 60 mph for trucks and buses. The results showed that crash, injury, and fatality
rates were significantly higher in urban environments, particularly on those segments that were
posted at 55 mph. A review of crash data from urban freeways where speed limits had been
increased from 55 mph to 65 or 70 mph (60 mph for trucks/buses) during the study period
showed that total and injury crashes increased after these changes. These findings suggest that
increased crash risks in urban areas are largely reflective of lower design standards and more
challenging geometric conditions due to limited right-of-way.
SPEED EVALUATION
Spot speed studies were conducted at 160 freeway locations in Michigan, Indiana, and Ohio to
provide a comparison between the 10-mph differential (Michigan), 5-mph differential (Indiana),
and uniform speed limits (Ohio). These states provided an additional advantage of possessing
several freeways that pass between bordering states, thereby allowing for a controlled
comparison of speed limit impacts. These sites were split among urban and rural freeways and
were selected from various regions to provide geographic diversity.
Analysis of these speed data show that mean and 85th percentile travel speeds for passenger
vehicles were consistent among the three states at locations with a common limit of 55 mph or
70 mph. Conversely, truck and bus speeds were more variable, which is likely due to the existing
differential limits in Indiana (5 mph) and Michigan (10 mph). However, the differences in mean
and 85th percentile speeds were much less pronounced at 2.1 mph and 4.2 mph, respectively.
While the mean and 85th percentile truck and bus speeds were above the posted limit of 60 mph
in Michigan, compliance increased substantially in Indiana and Ohio.
xiv
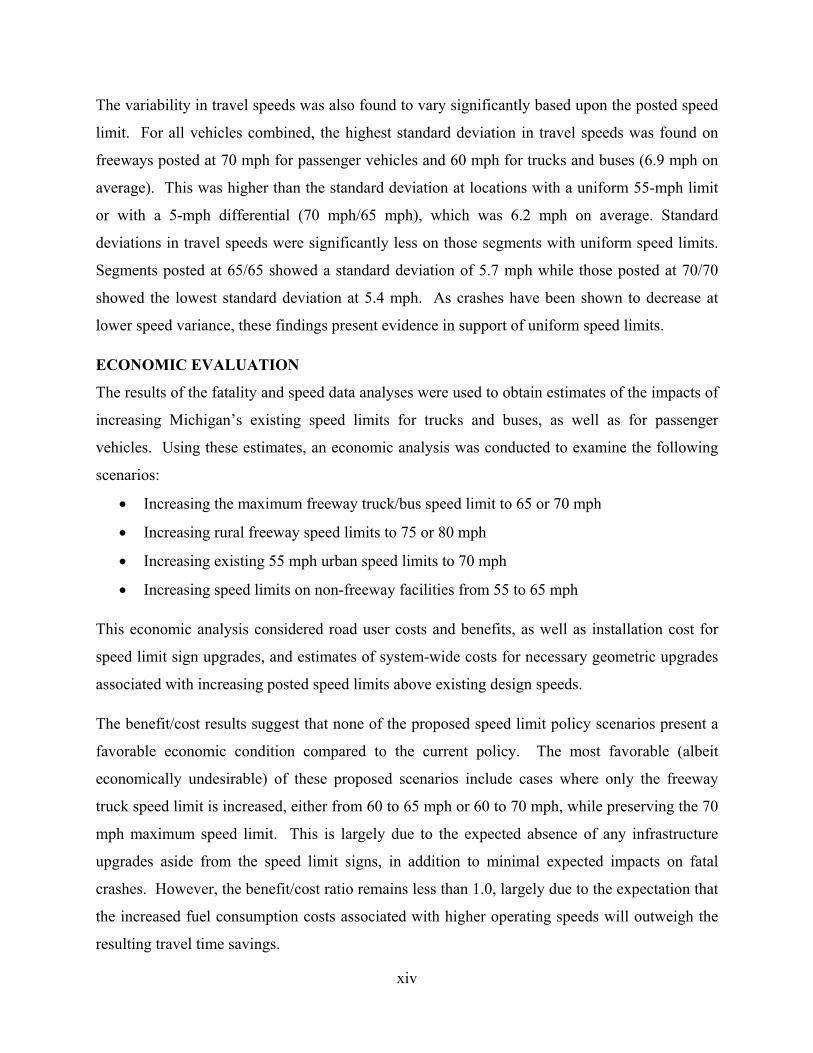
The variability in travel speeds was also found to vary significantly based upon the posted speed
limit. For all vehicles combined, the highest standard deviation in travel speeds was found on
freeways posted at 70 mph for passenger vehicles and 60 mph for trucks and buses (6.9 mph on
average). This was higher than the standard deviation at locations with a uniform 55-mph limit
or with a 5-mph differential (70 mph/65 mph), which was 6.2 mph on average. Standard
deviations in travel speeds were significantly less on those segments with uniform speed limits.
Segments posted at 65/65 showed a standard deviation of 5.7 mph while those posted at 70/70
showed the lowest standard deviation at 5.4 mph. As crashes have been shown to decrease at
lower speed variance, these findings present evidence in support of uniform speed limits.
ECONOMIC EVALUATION
The results of the fatality and speed data analyses were used to obtain estimates of the impacts of
increasing Michigan’s existing speed limits for trucks and buses, as well as for passenger
vehicles. Using these estimates, an economic analysis was conducted to examine the following
scenarios:
Increasing the maximum freeway truck/bus speed limit to 65 or 70 mph
Increasing rural freeway speed limits to 75 or 80 mph
Increasing existing 55 mph urban speed limits to 70 mph
Increasing speed limits on non-freeway facilities from 55 to 65 mph
This economic analysis considered road user costs and benefits, as well as installation cost for
speed limit sign upgrades, and estimates of system-wide costs for necessary geometric upgrades
associated with increasing posted speed limits above existing design speeds.
The benefit/cost results suggest that none of the proposed speed limit policy scenarios present a
favorable economic condition compared to the current policy. The most favorable (albeit
economically undesirable) of these proposed scenarios include cases where only the freeway
truck speed limit is increased, either from 60 to 65 mph or 60 to 70 mph, while preserving the 70
mph maximum speed limit. This is largely due to the expected absence of any infrastructure
upgrades aside from the speed limit signs, in addition to minimal expected impacts on fatal
crashes. However, the benefit/cost ratio remains less than 1.0, largely due to the expectation that
the increased fuel consumption costs associated with higher operating speeds will outweigh the
resulting travel time savings.
xv
CONCLUSIONS AND RECOMMENDATIONS
The results of this study show that speed limit policies require careful consideration of a variety
of factors. All proposed speed limit policy scenarios involving an increase in the maximum
speed limit will result in substantial infrastructure costs for the geometric modifications
necessary to increase the design speed to comply with state and federal requirements. The
majority of the MDOT highway network is currently designed for compliance with posted speed
limits of 70 mph on freeways and 55 mph on non-freeways and freeways in dense urban areas.
Consequently, system-wide increases in the posted speed limit beyond these levels will result in
geometric upgrade costs that will greatly outweigh any net user benefits, resulting in benefit/cost
ratios well below 1.0. This is especially true for urban freeways and non-freeways currently
posted at 55 mph where geometric modification costs are expected to be especially severe. With
respect to truck/bus speed limits, the results of this study showed that rural truck/bus fatal
crashes tended to be higher in states with uniform speed limits, though the speed studies
conducted as part of this project showed that speed variance was higher where differential limits
were in place.
Ultimately, increasing the maximum speed limits on freeways and non-freeways should only be
considered for sections of roadway where design speed compliance is maintained after the
increase to avoid costly geometric improvements. Furthermore, it is recommended that detailed
engineering and safety analyses be performed prior to increasing the posted speed limit for any
roadways under consideration.
1
CHAPTER 1:
INTRODUCTION
STATEMENT OF PROBLEM
Speed management has long been a concern of transportation agencies, dating back to research
from the 1960’s, which showed that vehicles traveling excessively below or above the average
speed of traffic were overrepresented in crashes on rural highways and interstates [1, 2].
Historically, there have been three major legislative decisions that have influenced speed limit
policies across the United States:
Establishment of the National Maximum Speed Limit (NMSL) – A national maximum
speed limit of 55 mph was established as part of the Emergency Highway Energy
Conservation Act of 1974.
Relaxation of the NMSL – In 1987, the NMSL was relaxed, allowing states to selectively
increase speed limits up to a maximum of 65 mph on rural interstate highways.
Repeal of the NMSL – In 1995, the NMSL was fully repealed, providing each state with
full authority to determine appropriate speed limits on all roadways.
Following each of these policy changes, various research studies were conducted to ascertain the
impacts of speed limits on traffic crashes and fatalities. In general, these studies showed higher
speed limits to adversely impact traffic safety by increasing the number and/or rate of traffic
fatalities [3-28]. Several studies suggested that speed limit increases did not consistently increase
or decrease safety [29-42] while others have suggested that speed limit increases improved
traffic safety and reduced traffic fatalities [33-36]. There remains considerable debate as to the
true impacts of speed limit policies on traffic crashes and fatalities. Several states have recently
enacted increases in speed limits on select segments of road facilities. This is in contrast to prior
initiatives, which generally included large-scale increases in speed limits on a statewide basis.
A related issue that has generated considerable debate is the establishment of maximum speed
limits for trucks and buses. States generally ascribe to one of two practices: the use of uniform
speed limit (USL) policies that set the same maximum speed limit for both passenger vehicles
2
and trucks; and the use of differential speed limit (DSL) policies that set a lower speed limit for
trucks in comparison to passenger vehicles. As in the broader speed limit debate, a strong
consensus has not emerged among whether USL or DSL policies are more appropriate, though
currently there are only 8 states with differential speed limits. The principal philosophical
arguments supporting uniform and differential speed limits are as follows:
Support for DSL policies – Given their larger size, trucks require greater time and
distance in order to come to a stop. This increased size also tends to result in more severe
injuries when trucks are crash involved. Fuel economy tends to degrade at higher speeds
and the environmental impacts tend to worsen.
Support for USL policies – Varying speed limits for passenger vehicles and trucks could
increase speed differences (i.e., variance) and thereby increase the potential for collisions.
Higher speed limits also tend to reduce travel times, creating potential economic benefits
to the freight industry.
The State of Michigan has used differential speed limits on freeways for many decades. Prior to
2006, on freeways with a maximum speed limit of 70 mph, the speed limit for trucks was 55 mph
and the minimum speed was 45 mph. After consideration of available crash information, vehicle
speed profiles, and economic impacts to the trucking industry and the State of Michigan, the
Michigan legislature passed bills (Enrolled House Bill 5104 and 5240) raising truck speeds on 70
mph freeways from 55 to 60 mph. More recently, legislation has been introduced (SB 896) that
proposes the creation of a new “Rural Freeway General Speed Limit” of 80 mph and a new
“Urban Freeway General Speed Limit” of 70 mph. The legislation also proposes a maximum
speed limit for trucks and buses of 70 mph.
In order to ascertain the impacts of these proposed speed limit increases, a careful analysis is
required of a broad range of traffic safety, operational, environmental, and economic data. Such
data are available from a variety of states, including several that have recently changed their
passenger car speed limits, their truck/bus speed limits, or both.

3
STUDY GOAL AND OBJECTIVES
The purpose of the proposed work is to assist the Michigan Department of Transportation
(MDOT) and the State of Michigan in determining the potential impacts of the following speed
limit changes:
Raising maximum freeway truck speed limits to 65 or 70 mph
Raising maximum urban freeway speed limits from 55 to 70 mph
Raising maximum rural freeway speed limits from 70 to 80 mph
Raising maximum speed limits on non-limited access roadways from 55 to 65 mph
The aforementioned speed limit increases are expected to impact various performance measures,
which include the following:
Mean Speeds
85th Percentile Speeds
Speed Variance/Standard Deviation
Fatality Rates
Road User Costs
Pavement Condition
Air Quality
Economics for Trucking Industry
It is imperative that a comprehensive policy analysis is conducted that identifies the potential
impacts of speed limit increases for various functional classes of roadways and for various
vehicle classes. Ultimately, the objective of this research is to examine empirical evidence in
order to estimate the impacts of speed limit changes on traffic safety, mobility, economics, and
environmental aspects of Michigan’s transportation system.
SUMMARY OF TASKS
The following tasks were performed in order to accomplish the aforementioned research
objectives:
Perform a comprehensive state-of-the-art review of research examining the relationships
between traffic speed, safety, and crash risk.
Survey state agencies to better understand the processes and procedures that have been
utilized in enacting speed limit increases.
Survey trucking companies to ascertain opinions on differential versus uniform speed
limit policies.
4
Collect and analyze national and Michigan-specific crash, injury, and fatality data to
ascertain the effects of speed limit policies on traffic fatalities while controlling for
potential confounding factors such as vehicle-miles of travel, weather, and temporal
trends.
Collect and analyze urban and rural freeway data in Michigan, Indiana, and Ohio in order
to ascertain differences in driver speed selection between states with varying speed limit
policies for trucks and buses.
Perform an economic analysis of various speed limit policy alternatives and estimate the
potential impacts of enacting such policies.
Provide recommendations for decision-making as it relates to speed limit policies,
including the development of strategies for selectively considering speed limit changes.
A full description of all work performed as a part of this research is provided in the chapters that
follow.

5
CHAPTER 2:
LITERATURE AND HISTORICAL REVIEW OF SPEED LIMITS AND THE
RELATIONSHIP BETWEEN SPEED AND SAFETY
The following review provides a historic overview of speed limits and a summary of studies that
reviewed the effects of speed limits on actual speeds. The impacts of speed limits on traffic
safety are an area that has generated much research, though a strong consensus has not emerged
to the relationship between speed and safety. The purpose of this literature review is to critically
assess prior research and summarize the findings.
GENERAL OVERVIEW
Maximum speed limits are posted to inform drivers of the highest speed that is considered safe
and reasonable for ideal traffic, road, and weather conditions. Speed limits also establish a basis
for the enforcement of legislation for unreasonably high travel speeds. Numerous research
studies have sought to examine the relationship between vehicle speeds and traffic safety, as well
as the effects of posted speed limits on the frequency and severity of crashes.
Much of the research on the effect of speed limits was motivated by the initial passage of the
Emergency Highway Energy Conservation Act in 1974, which mandated the 55 mph National
Maximum Speed Limit (NMSL) on interstate highways in the United States. The initial reason
for the change was to reduce fuel consumption in response to the Mid-East Oil Embargo.
However, the NMSL was extended, in part, due to a reduction in traffic fatalities that occurred
during this same time period. One issue that arose with the introduction of the NMSL was that
observed driving speeds did not necessarily reflect the new lower speed limits. This was
particularly true on interstate highways where posted speed limits were significantly below the
design speeds of these roadways.
The speed limit issue was revisited by subsequent research and legislation. The 1987 passage of
the Surface Transportation and Uniform Relocation Assistance Act (STURAA) permitted states
to increase speed limits from 55 to 60 or 65 mph on interstate highways in rural areas with

6
populations of less than 50,000. Following the enactment of the STURAA, a series of evaluation
studies showed increases in traffic crashes and/or fatalities in states where the speed limit had
been increased [3-10]. However, additional studies found either marginal or no changes in traffic
safety [29-31], while a few studies found safety improvements after speed limit increases [33,
34].
On November 28, 1995, the National Highway System Designation Act of 1995 gave states
complete freedom to set interstate speed limits. As a result of this legislation, many states have
raised interstate speed limits to 70 mph or more, providing ample opportunity to observe the
same highways under different speed limits and determine user responses to these limits. The
repeal of the NMSL in 1995 led to a series of additional studies, which produced some negative
[11-13] and neutral [14] safety findings, indicating that the increased speed limits did not have a
positive effect on injury or fatality rates.
The purpose of this literature review is to provide a detailed synopsis of research with emphasis
on the following topics:
The Relationship Between Speed, Risk, and Safety
Safety Trends Following Speed Limit Policy Changes
Effects of Speed Limits on Actual Speeds
Differential vs. Uniform Speed Limits for Trucks and Buses
Impacts of Speed Limits on Non-Motorized Users
Recent and Proposed Changes to State Speed Limit Policies
THE RELATIONSHIP BETWEEN SPEED, RISK, AND SAFETY
Speed management has long been a concern of transportation agencies, dating back to research
from the 1960’s, which showed vehicles traveling excessively below or above the speed limit to
be overrepresented in crashes on rural highways and interstates [1, 2]. The earliest, and perhaps
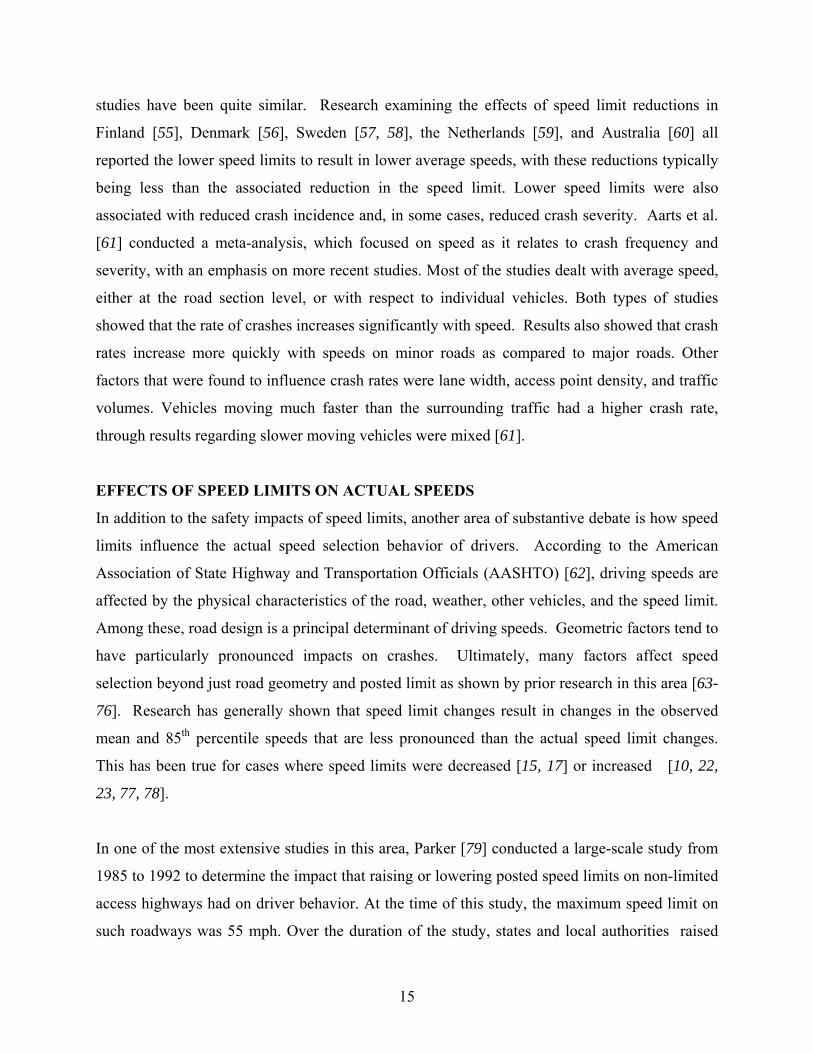
most cited work in this area is that of Solomon [1] and Cirillo [2]. Solomon [1] compared the
estimated speed (from police crash reports) of 10,000 crash-involved vehicles with field-
measured speeds from 29,000 control vehicles. Using these data, relative crash rates for 10-mph
speed categories were estimated. The results, illustrated in Figure 1, present the crash

7
involvement rate (per 100 million vehicle-miles of travel) with respect to travel speed (Figure 1a)
and with respect to variation from the average speed of traffic under similar conditions (Figure
1b). Collectively, these figures suggest that crash risk (i.e. possibility of being in a crash) is
greatest at very low speeds and very high speeds. Vehicles traveling approximately 6 mph above
the average speed exhibited the lowest crash rates.
Figure 1. Crash Rates by Travel Speed and Variation from Average Speed [1]
In 1968, Cirillo [2] conducted a similar study on rural and urban interstates, which focused on
two-vehicle, same-direction crashes. The results generally reflected this same trend, though the
lowest crash rate was about 12 mph above the average speed.
Subsequent research used speed data from traffic detectors, in combination with pre-crash speeds
based on crash reconstruction, and found similar trends [37]. However, 44 percent of these
crashes involved low-speed maneuvers (e.g., turning into or out of traffic) and an analysis of the
data excluding these maneuvers demonstrated crash risks were much less pronounced at low
speeds in comparison to prior research. This reflects one of the limitations of the work by
Solomon [1] and Cirillo [2], which is that many of the lower speed crashes result from slower
moving vehicles entering or exiting the roadway. Subsequent work by West and Dunn [38]
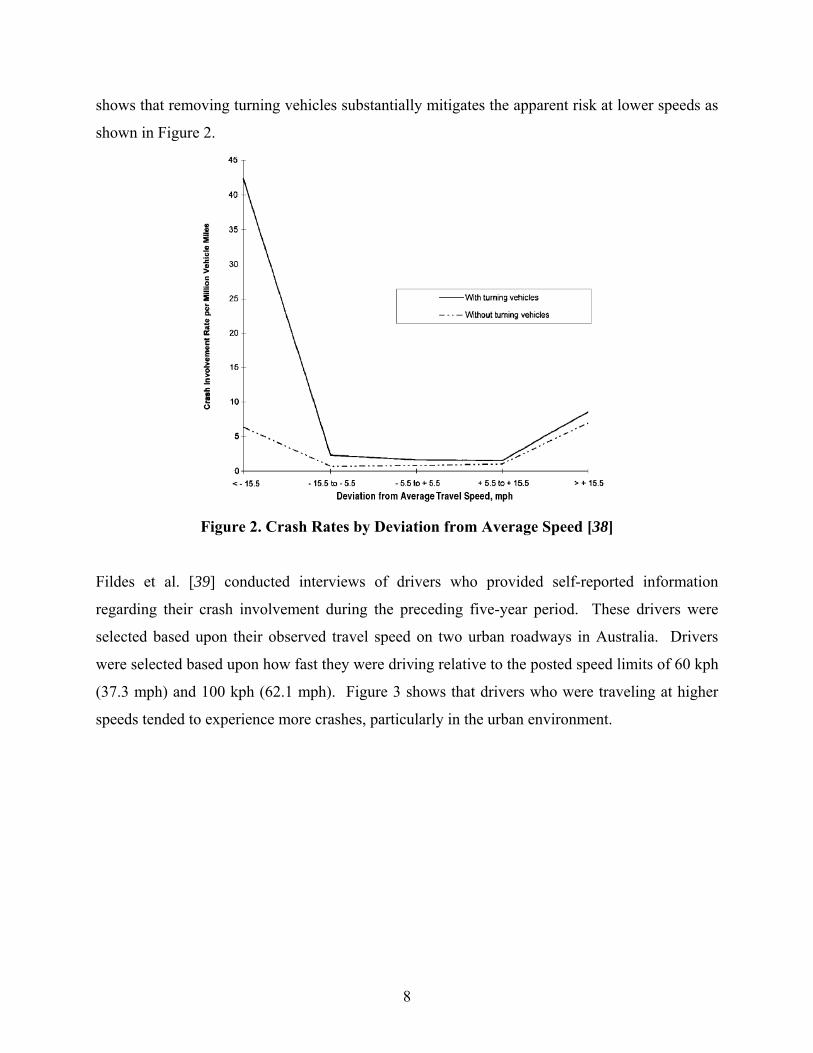
8
shows that removing turning vehicles substantially mitigates the apparent risk at lower speeds as
shown in Figure 2.
Figure 2. Crash Rates by Deviation from Average Speed [38]
Fildes et al. [39] conducted interviews of drivers who provided self-reported information
regarding their crash involvement during the preceding five-year period. These drivers were
selected based upon their observed travel speed on two urban roadways in Australia. Drivers
were selected based upon how fast they were driving relative to the posted speed limits of 60 kph
(37.3 mph) and 100 kph (62.1 mph). Figure 3 shows that drivers who were traveling at higher
speeds tended to experience more crashes, particularly in the urban environment.

9
Figure 3. Crash Risk Relative to Speed Limit [39]
However, it must be noted that the travel speeds under which the drivers were selected for the
interviews is not necessarily reflective of their travel speed prior to the crashes, which would
have occurred at an earlier time and likely on a different roadway. Two subsequent studies from
the United Kingdom [40, 41] utilized a similar self-reporting method and both found crashes to
increase consistently with driver speed as shown in Figure 4.
Figure 4. Crash Liability Relative to Vehicle Speed [40, 41]
Finch et al. [42] conducted a study in Switzerland, which showed fatal crashes to decrease by 12
percent when speed limits were lowered from 81 mph (130 kph) to 75 mph (120 kph). This
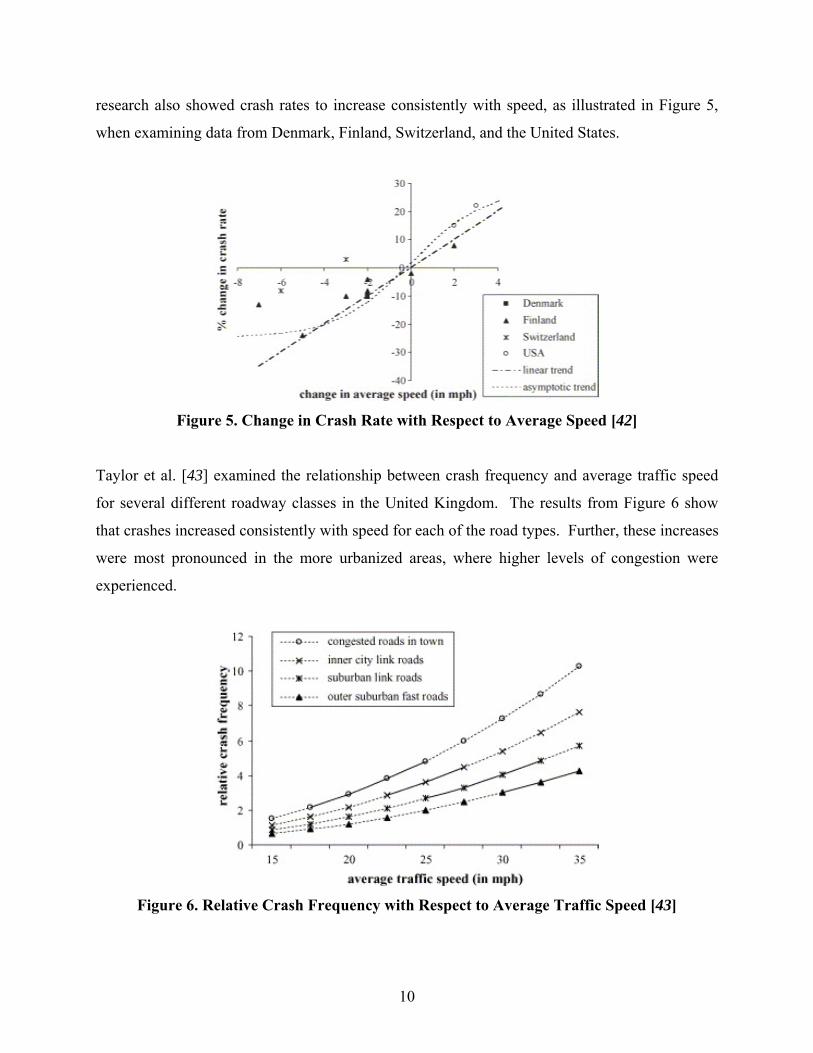
10
research also showed crash rates to increase consistently with speed, as illustrated in Figure 5,
when examining data from Denmark, Finland, Switzerland, and the United States.
Figure 5. Change in Crash Rate with Respect to Average Speed [42]
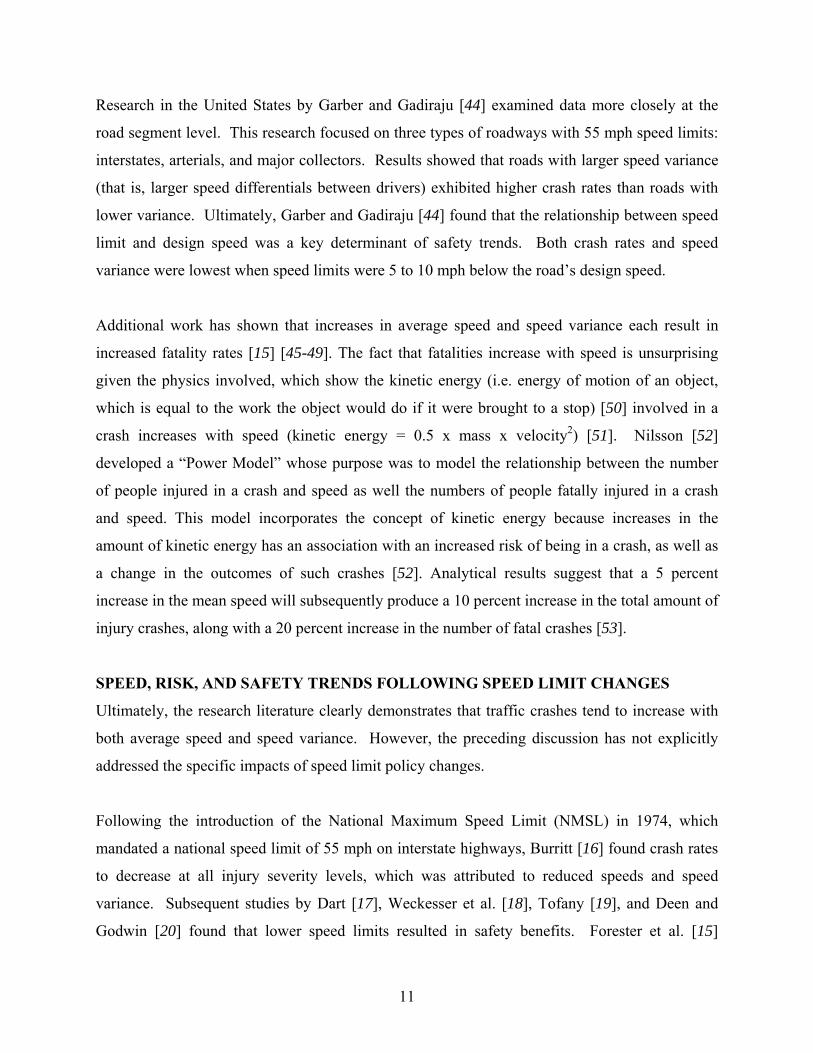
Taylor et al. [43] examined the relationship between crash frequency and average traffic speed
for several different roadway classes in the United Kingdom. The results from Figure 6 show
that crashes increased consistently with speed for each of the road types. Further, these increases
were most pronounced in the more urbanized areas, where higher levels of congestion were
experienced.
Figure 6. Relative Crash Frequency with Respect to Average Traffic Speed [43]
11
Research in the United States by Garber and Gadiraju [44] examined data more closely at the
road segment level. This research focused on three types of roadways with 55 mph speed limits:
interstates, arterials, and major collectors. Results showed that roads with larger speed variance
(that is, larger speed differentials between drivers) exhibited higher crash rates than roads with
lower variance. Ultimately, Garber and Gadiraju [44] found that the relationship between speed
limit and design speed was a key determinant of safety trends. Both crash rates and speed
variance were lowest when speed limits were 5 to 10 mph below the road’s design speed.
Additional work has shown that increases in average speed and speed variance each result in
increased fatality rates [15] [45-49]. The fact that fatalities increase with speed is unsurprising
given the physics involved, which show the kinetic energy (i.e. energy of motion of an object,
which is equal to the work the object would do if it were brought to a stop) [50] involved in a
crash increases with speed (kinetic energy = 0.5 x mass x velocity2) [51]. Nilsson [52]
developed a “Power Model” whose purpose was to model the relationship between the number
of people injured in a crash and speed as well the numbers of people fatally injured in a crash
and speed. This model incorporates the concept of kinetic energy because increases in the
amount of kinetic energy has an association with an increased risk of being in a crash, as well as
a change in the outcomes of such crashes [52]. Analytical results suggest that a 5 percent
increase in the mean speed will subsequently produce a 10 percent increase in the total amount of
injury crashes, along with a 20 percent increase in the number of fatal crashes [53].
SPEED, RISK, AND SAFETY TRENDS FOLLOWING SPEED LIMIT CHANGES
Ultimately, the research literature clearly demonstrates that traffic crashes tend to increase with
both average speed and speed variance. However, the preceding discussion has not explicitly
addressed the specific impacts of speed limit policy changes.
Following the introduction of the National Maximum Speed Limit (NMSL) in 1974, which
mandated a national speed limit of 55 mph on interstate highways, Burritt [16] found crash rates
to decrease at all injury severity levels, which was attributed to reduced speeds and speed
variance. Subsequent studies by Dart [17], Weckesser et al. [18], Tofany [19], and Deen and
Godwin [20] found that lower speed limits resulted in safety benefits. Forester et al. [15]

12
analyzed crash data from 1952 to 1979 and estimated that traffic fatalities decreased by 7,466 per
year as a result of the speed limit reduction. Conversely, Labrum [32] concluded that available
data could not allow for the determination of speed limit impacts due to concurrent changes in
other factors (e.g., fuel shortage, driver attitude, etc.), representing one of the few neutral
findings of this period.
In 1987, the NMSL law was relaxed, allowing states to raise their speed limits to 65 mph on rural
interstate highways. Much additional research was conducted following this, as many states
increased the speed limits on their rural interstates. Hoskin [21], Gallaher et al. [9], and
Upchurch [10] each found fatalities to increase in various states following these legislative
changes. Baum et al. [5] estimated a 15 percent increase in fatalities in states that increased
speed limits as part of a 38-state study. Subsequent research, which expanded this analysis to 48
states [6], estimated fatalities to increase by 29 percent and the risk of fatality in the event of a
crash to increase by 19 percent in states where the rural interstate limits were increased to 65
mph. Conversely, 12 percent fewer fatalities occurred in those states that retained the 55 mph
limit.
In contrast to the aforementioned research, Pant et al. [29] compared monthly crash rates on rural
interstates in Ohio and found no difference following the 1987 change in rural speed limits.
Similarly, Chang and Paniati [31] assessed monthly fatality data, but could not reach a
conclusion as to the impact of the 65 mph limit due to limited post-increase data.
Subsequent work by Lynn and Jernigan [22] noted increases in fatal crashes, fatalities, and
average and 85th percentile speeds on rural interstates in Virginia, though significant increases
were not found on urban interstates. The 85th percentile speed is the speed at which 85 percent
of people drive at any given location under good weather conditions. It is generally considered
to be the safe maximum speed limit for that area. Ossiander and Cummings [23] found a large
increase in fatal crash rates on rural highways in Washington State while urban rates remained
stable. In addition to these safety impacts, mean and 85th percentile speeds also increased by 5.5
and 6.4 mph, respectively. Interestingly, speed increases did not occur immediately, but over
time as drivers adapted to the new limits. Garber and Graham [24] estimated the 65 mph limit
13
to result in a 15 percent increase in fatalities on rural interstates and a 5 percent increase on rural
non-interstates. These results varied significantly between states, which likely reflects the effects
of other factors such as seasonal patterns, highway design improvements, the quality of
emergency medical care, traffic volumes, mandatory belt-use laws, etc. McKnight and Klein [7]
found a 22 percent increase in fatal crashes on 65 mph rural interstates. Similar increases were
also found in Iowa [4] following the speed limit increase.
In contrast to the broader research literature, Lave and Elias [33, 35] estimated that fatal crash
rates fell by 3.4 to 5.1 percent following the 1987 speed limit increase. They suggest that the
decrease in fatalities may have resulted from a shift in police resources from speed enforcement
on the interstates to other activities and other highways, in addition to changes in driver route
choice toward safer interstates. Similarly, Houston [36] found an increase in rural interstate
fatalities, but reductions in fatalities on rural non-interstates, all other roads, and the road system
overall. It should be noted however, that subsequent research by Greenstone [3] was unable to
validate these claims or reproduce the same results, finding fatality rates to increase by 30
percent on rural interstates and fall by 17 percent on urban non-interstates nationwide from 1982
to 1990.
Wagenaar et al. [8] reported increases of 19 percent in fatalities, 40 percent in serious injuries,
and 25 percent in moderate injuries on 65 mph rural highways in Michigan. The authors suggest
that spillover speeding (i.e., speeding on roadways near the site of the speed limit increase, and
potentially due to the increase) may have contributed to a concurrent 38 percent increase in
fatalities on 55 mph rural highways. Rock [25] found crashes, injuries, and fatalities to increase
on 65 mph rural highways in Illinois. Increases were also observed for each of these measures on
55 mph rural highways, providing further support of this spillover hypothesis.
The preceding discussion illustrates that most estimates suggest that the 1987 relaxation of the
NMSL generally showed fatality increases. The primary exceptions indicate three studies that
could not draw definitive conclusions [29-31] and several studies [33-36] that suggested higher
limits might have had positive impacts.
14
The safety impacts of speed limit policies were revisited after the repeal of the National
Maximum Speed Limit (NMSL) in 1995. This repeal gave states full authority to determine all
types of speed limits. In 1996, Taylor and Maleck [26] examined the impacts of increasing the
speed limit on 500 miles of rural freeway in Michigan from 65 to 70 mph. Results showed that,
after the speed limit was raised, the 50th and 85th percentile speeds increased by 2 mph in some
locations and less than 1 mph at most locations. In a follow up study [27], total crashes were
found to increase by 10.5 percent, severe crashes increased by 4.5 percent, and fatal crashes
decreased by 9.3 percent. Friedman et al. [28] conducted a 10-year follow up study on fatal
crashes in the United States (except for Massachusetts and Hawaii) subsequent to the repeal of
the NMSL in 1995, concluding that the increase in speed limits accounted for approximately
12,545 fatalities. Several additional studies found increases in fatality rates, including Farmer et
al. [11], Patterson et al. [12], and Haselton et al. [13]. Najjar et al. [14] conducted research in
Kansas, resulting in one of the few studies that did not find significant changes in crash and
fatality rates on rural and urban interstates.
Kockelman et al. [54] conducted one of the most recent comprehensive studies aimed at
estimating the impacts of raising speed limits on high-speed roads through a disaggregate-level
analysis of the relationships between speed limits, speed choice, crash frequency, and crash
severity. The results showed that vehicle speeds increase with speed limit increases, with the
average vehicle speed increasing by less than half of the amount of the speed limit increase.
Based on the results of this cross-sectional study, it was estimated that a 10-mph increase from
55 to 65 mph would result in an increase of approximately 3 percent in total crashes and 28
percent in fatal crashes. Increases from 65 to 75 were projected to increase total and fatal
crashes by 0.6 percent and 13 percent, respectively. In addition to speed limit impacts, other
roadway features also affected crash rates, such as horizontal curves and vertical grades. Road
segments with horizontal curves were found to have higher crash rates, when everything else was
held constant, the same was true for vertical grades.
In contrast to the United States, where most studies have evaluated the speed and safety effects
of raising speed limits on limited-access highways, international studies have primarily examined
the effects of reductions in speed limits. However, despite this difference, the results of the
15
studies have been quite similar. Research examining the effects of speed limit reductions in
Finland [55], Denmark [56], Sweden [57, 58], the Netherlands [59], and Australia [60] all
reported the lower speed limits to result in lower average speeds, with these reductions typically
being less than the associated reduction in the speed limit. Lower speed limits were also
associated with reduced crash incidence and, in some cases, reduced crash severity. Aarts et al.
[61] conducted a meta-analysis, which focused on speed as it relates to crash frequency and
severity, with an emphasis on more recent studies. Most of the studies dealt with average speed,
either at the road section level, or with respect to individual vehicles. Both types of studies
showed that the rate of crashes increases significantly with speed. Results also showed that crash
rates increase more quickly with speeds on minor roads as compared to major roads. Other
factors that were found to influence crash rates were lane width, access point density, and traffic
volumes. Vehicles moving much faster than the surrounding traffic had a higher crash rate,
through results regarding slower moving vehicles were mixed [61].
EFFECTS OF SPEED LIMITS ON ACTUAL SPEEDS
In addition to the safety impacts of speed limits, another area of substantive debate is how speed
limits influence the actual speed selection behavior of drivers. According to the American
Association of State Highway and Transportation Officials (AASHTO) [62], driving speeds are
affected by the physical characteristics of the road, weather, other vehicles, and the speed limit.
Among these, road design is a principal determinant of driving speeds. Geometric factors tend to
have particularly pronounced impacts on crashes. Ultimately, many factors affect speed
selection beyond just road geometry and posted limit as shown by prior research in this area [63-
76]. Research has generally shown that speed limit changes result in changes in the observed
mean and 85th percentile speeds that are less pronounced than the actual speed limit changes.
This has been true for cases where speed limits were decreased [15, 17] or increased [10, 22,
23, 77, 78].
In one of the most extensive studies in this area, Parker [79] conducted a large-scale study from
1985 to 1992 to determine the impact that raising or lowering posted speed limits on non-limited
access highways had on driver behavior. At the time of this study, the maximum speed limit on
such roadways was 55 mph. Over the duration of the study, states and local authorities raised
16
and lowered posted speed limits on short segments of roadways, typically less than two miles in
length. Data on driver behavior and crashes were collected from 22 states. These included 100
sites along non-limited access highways where the speed limits were either raised or lowered and
83 control sites where there were no changes made to speed limits. The range of speed limit
changes consisted of lowering the speed limit by 5, 10, 15, or 20 mph, or increasing the speed
limit by 5, 10, or 15 mph, with only one change made at each site. Interestingly, the difference in
speed after these changes was less than 1.5 mph on average. The study results clearly
demonstrated that drivers select their speeds on non-limited access highways primarily on the
basis of roadway geometry and traffic characteristics rather than the posted speed limits [79].
A meta-analysis of research from European countries and the United States, conducted by
Wilmot and Khanal [80], showed similar results. It was concluded that drivers ultimately choose
their speeds based on perception of safety rather than posted speed limits. Similarly, Feng [81]
prepared a synthesis of studies on speed and safety and emphasized the importance of speed
limits that are appropriate for the type of road, weather, and traffic conditions.
Kockelman et al. [54] found that speed limit increases tend to increase average vehicle speeds.
On average, speed increases were generally less than half of the amount of the actual speed limit
increase. Average speed and speed variability were largely influenced by highway design and
lane use characteristics more than posted speed limits. In fact, after controlling for these other
characteristics, variations in observed speed choices were largely unaffected by speed limits.
The findings discussed above are largely reflective of driver opinions on speed limits as shown
by recent surveys. Mannering [82] conducted a 2007 freeway user survey studying their normal
driving speed on interstate highways that have posted speed limits of 55 mph, 65 mph, and 70
mph. On average, drivers reported driving 11 mph over the speed limit on roads posted 55 mph,
9 mph over the speed limit on roads posted 65 mph and 8 mph over the speed limit on roads
posted 70 mph.
A national survey conducted by the United States Department of Transportation (USDOT) in
2003 [83] gathered information regarding driver attitudes and behaviors related to violating the
speed limit and other unsafe driving behaviors. Results showed that most drivers believe they
17
can drive 7 to 8 miles per hour above the posted speed limit before being pulled over. On
average, drivers felt that the ideal speed limit for a highway would be approximately 67 mph.
Approximately 40 percent of drivers stated they would drive over the speed limit on interstate
highways even if the speed limits were increased by 10 mph. While 51 percent of drivers
admitted to driving 10 mph over the posted speed limit, 68 percent felt that other drivers
violating the speed limit were a danger to their own personal safety. Drivers reported that the
most influential factors dictating their speed selection were weather, their perception of what
speeds were “safe”, the posted speed limit, traffic volume levels, and the amount of personal
driving experience they had on a particular road [83]. Collectively, the available empirical data
and information from drivers suggest that the posted speed limit has a relatively small influence
on speed selection in general.
SPEED LIMIT COMPLIANCE IN WORK ZONES
Working in close proximity to moving traffic is a potentially hazardous but necessary situation
when conducting roadwork. To alleviate potential risk, speed limits in work zones are typically
reduced to more safely accommodate construction workers, as well as motorists. Compliance
with posted work zone speed limits has been found to be a common issue and various
countermeasures have been evaluated aimed at reducing speeds through work zones.
In a study of four work zones in Missouri, Bham and Mojtaba determined that construction
activity in work zones significantly decreased the average speeds of passenger cars and trucks,
by 3.5 and 2.2 mph, respectively, as compared to times of inactivity. Speeds remained above the
posted speed limits regardless of whether activity was ongoing. Reduced lane widths were
revealed to be the most effective factors in reducing average speeds [84].
Debnath et al. reviewed four types of work zone speed control measures to determine the effect
each had on speed limit compliance. Enforcement measures, such as speed cameras or police
presence, were found to be the most effective methods of controlling work zone speeds while
informational measures including static and variable message signage were determined to yield
small to moderate effects. Several major causes of noncompliance to work zone speed limits
18
were noted as the drivers’ failure to notice signs and the public’s inadequate understanding of
roadwork risks and hazards [85].
Research conducted by Wasson et al. also found the presence of enforcement to be an effective
means of speed reduction. Results showed the mean speed decreased by approximately 5 mph
during periods of exceptionally high enforcement compared to no enforcement. Despite this
reduction, 75 percent of passing vehicles were observed exceeding the speed limit, even at
patrolled segments, and of those vehicles in violation, 25 percent were exceeding the limit by
more than 5 mph [86]. Additional work by Finley indicated that the presence of enforcement
dictates how sizeable the speed reduction is, in conjunction with the normal operating speeds of
the roadway and the current situation of the construction zone [87].
Brewer et al. examined the effectiveness of three devices, including speed display trailers,
changeable message signs, and orange-border speed limit signs. The results indicated that speed
display trailers, which detect and display a vehicle’s speed, were most effective in improving
compliance as compared to static speed limits signs [88]. McMurtry et al. also reviewed the
effectiveness of differing signage. The results showed that average speed reduction when using
static speed limit signs compared to variable speed limit signs was not statistically different at a
95 percent confidence level, but speed variation in general did decrease [89].
A study conducted in rural Missouri on three Interstate 70 short-term work zones wanted to
determine the effects of three speed limit signage possibilities; one with no posted speed limit
reduction, a 10 mph posted speed limit reduction, and a 20 mph speed limit reduction. They
found that the 85th percentile speeds were found to be 81, 62, and 48 mph, respectively. These
differences were statistically significant, indicating that the posted speed limit reduction was
effective in lowering speeds in the context of short-term work zones [90].
It was also discovered that compliance dropped with a greater decrease from the usual speed
limit to the posted work zone speed limit. In Missouri, a work zone speed limit of 50 mph saw
even less compliance than when set at 60 mph [84], and a study conducted in Australia supported
these findings [91]. Overall, several studies concluded that although certain measures can be

19
taken to try and slightly reduce speeds, motorists will regulate their speed as they feel necessary
[87, 88].
SPEED LIMIT COMPLIANCE IN SCHOOL ZONES
Several studies have examined the effects of reduced speed zones, such as school zones. One
study, conducted by McCoy and Heimann in Nebraska, assessed compliance with the posted
speed limit in school zones. They found that speeds in school zones were more heavily
influenced by the road characteristics and the posted speed limit on the road on which the school
zone was located than by the lower posted speed limit within the school zone [92]. Another
study, which was conducted in Washington State, found that a higher approach speed near a
school zone led to higher speeds within the school zone, depending on the type of signage used.
If a “flashing light” sign was being used, then there was a greater compliance with the posted
speed limit for the school zone [93]. A study conducted in Atlanta conducted by Young and
Dixon found that overall, the use of school zone signage had little to no effect on driver behavior
[94]. An Australian study conducted by Ellison et al. in 2011 found that speed limit violations
were among the highest in school zones among all type of road locations. They recommended
targeting the road environment rather than using other types of campaigns to change speeding
behavior [95].
DIFFERENTIAL VERSUS UNIFORM LIMITS FOR TRUCKS AND BUSES
Trucks and buses have long been a safety concern given their large size, which results in
restricted maneuverability, longer stopping distances, and higher impact forces in a collision.
Given these concerns, many states had initially implemented a differential speed limit (DSL),
where trucks and buses have a posted limit lower than passenger cars. While lower speed limits
for larger vehicles helps to mitigate concerns with respect to high impact forces in truck-involved
(the term truck-involved generally refers to trucks and buses) collisions, these differential limits
potentially increase the variability in travel speeds and may increase the potential for truck-
involved crashes. In light of this fact, numerous states have subsequently transitioned to a
uniform speed limit (USL), which establishes one maximum speed limit for all vehicles. There
are currently 8 states with DSLs in place as shown in Figure 7, including the state of Michigan.

20
Figure 7. States with Differential and Non-Differential Freeway Speed Limits
Research results are relatively mixed with respect to both the operational and safety differences
between USLs and DSLs. Freedman and Williams [96] analyzed data from eleven northeastern
states to ascertain the effects of DSLs on mean and 85th percentile speeds. Six of the states
maintained a uniform 55 mph limit, three states had uniform 65 mph limit, and two states
implemented a 65-mph/55-mph differential limit. Passenger car speeds were not significantly
different between the states. Truck speeds were close between the USL and DSL states, as well.
Compliance rates with the posted speed limits were also similar between the states. Similar
results were obtained by both Johnson and Murray [97] and Harkey and Mera [98]. Conversely,
Garber and Gadiraju [44] found that there were differences in the mean speeds of trucks in states
with DSLs and those with USLs. In addition, speed variances were found to be significantly
greater in the DSL states.
Historically, there has been extensive research as to the safety impacts of differential speed
limits. A study from the National Highway Users Conference in December 1963 indicated that
the majority of states posted lower speed limits for trucks than for cars, especially on high-speed
Legend: States with Differential Freeway Speed Limits
States with Uniform Freeway Speed Limits
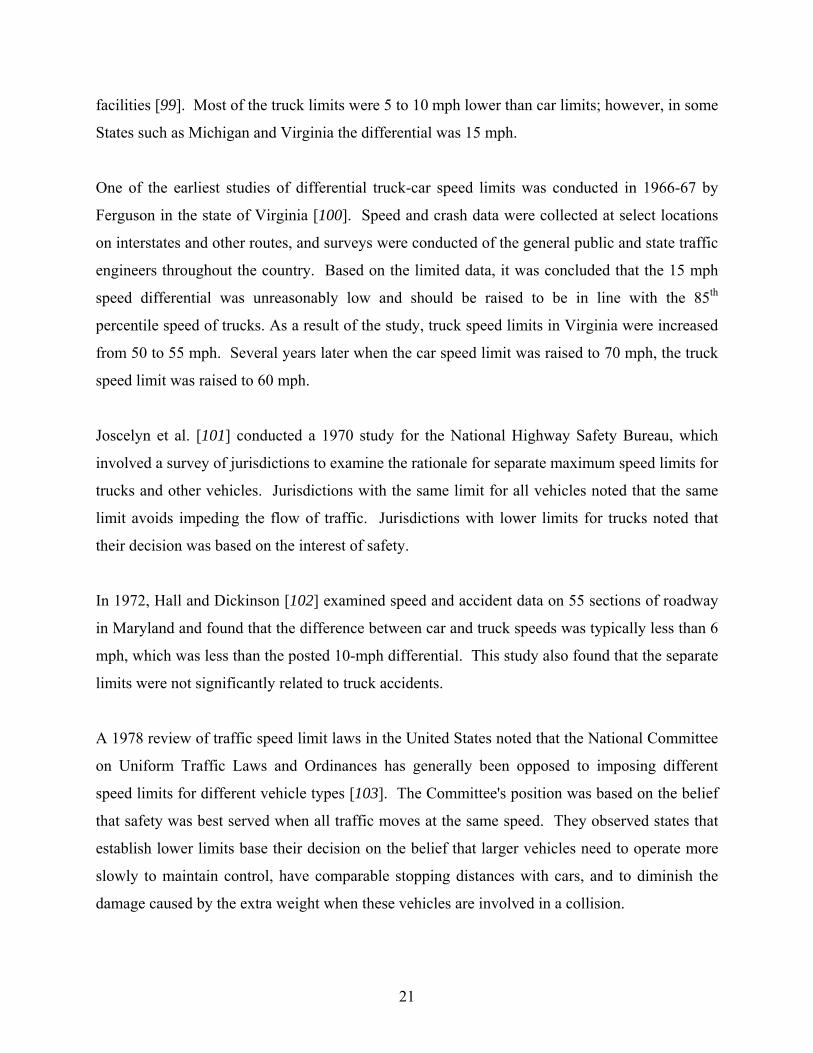
21
facilities [99]. Most of the truck limits were 5 to 10 mph lower than car limits; however, in some
States such as Michigan and Virginia the differential was 15 mph.
One of the earliest studies of differential truck-car speed limits was conducted in 1966-67 by
Ferguson in the state of Virginia [100]. Speed and crash data were collected at select locations
on interstates and other routes, and surveys were conducted of the general public and state traffic
engineers throughout the country. Based on the limited data, it was concluded that the 15 mph
speed differential was unreasonably low and should be raised to be in line with the 85th
percentile speed of trucks. As a result of the study, truck speed limits in Virginia were increased
from 50 to 55 mph. Several years later when the car speed limit was raised to 70 mph, the truck
speed limit was raised to 60 mph.
Joscelyn et al. [101] conducted a 1970 study for the National Highway Safety Bureau, which
involved a survey of jurisdictions to examine the rationale for separate maximum speed limits for
trucks and other vehicles. Jurisdictions with the same limit for all vehicles noted that the same
limit avoids impeding the flow of traffic. Jurisdictions with lower limits for trucks noted that
their decision was based on the interest of safety.
In 1972, Hall and Dickinson [102] examined speed and accident data on 55 sections of roadway
in Maryland and found that the difference between car and truck speeds was typically less than 6
mph, which was less than the posted 10-mph differential. This study also found that the separate
limits were not significantly related to truck accidents.
A 1978 review of traffic speed limit laws in the United States noted that the National Committee
on Uniform Traffic Laws and Ordinances has generally been opposed to imposing different
speed limits for different vehicle types [103]. The Committee's position was based on the belief
that safety was best served when all traffic moves at the same speed. They observed states that
establish lower limits base their decision on the belief that larger vehicles need to operate more
slowly to maintain control, have comparable stopping distances with cars, and to diminish the
damage caused by the extra weight when these vehicles are involved in a collision.

22
Following enactment of the STURAA, 12 of the 40 states that raised the maximum speed limit
retained lower limits for trucks than for cars. For example, Michigan retained the 55 mph limit
for trucks. In an effort to examine the effects of the differential speed limits, the National
Highway Traffic Safety Administration [104] conducted a study in 1988 that examined rural
interstate fatalities. This evaluation found few fatalities involving car and tractor-trailer crashes
on rural interstates. Due to the limited sample of fatal crashes, the effect of the differential limits
could not be determined.
A 1990 study by Baum et al. [105] assessed speed data on rural interstates with uniform and
different limits for cars and trucks. Average truck speeds were found to be 1.4 mph higher in
states with uniform 65 mph limits than in states with a 55 mph speed limit for trucks. The
primary statistics used were the 95th percentile truck speed and the percentage of trucks
exceeding 70 mph.
In 2005, Garber et al. [106] compared crash, traffic volumes, vehicles speeds, and other data
between the State of Virginia, which had transitioned from a DSL to a USL, and three groups of
comparison states: (1) states transitioning from USL to DSL; (2) states maintaining USL; and (3)
states maintaining DSL. The results showed differences between passenger vehicle and truck
speeds, but no consistent safety differences.
A 2008 study by Mannering [107] examined the effects of a 5 mph speed limit increase on crash
severity after rural interstate speed limits in Indiana were raised from 65 to 70 mph. The speed
limit for trucks and buses was also raised from 60 to 65 mph as Indiana remained a DSL state.
Using data from 2004 (the year before speed limits were raised) and 2006 (the year after speed
limits were raised), statistical models of the severity of different crash types were estimated. The
results showed that the speed limit increase did not have a significant effect on the severity of
accidents on interstate highways.
One study, conducted in Malaysia in 2011 by Saifizul et al., argued for the idea of incorporating
the gross vehicle weight (GVW) when setting the differential speed limit instead of doing this by
just the vehicle type or classification. The reasoning behind this was that their empirical analysis

23
indicated that there was a statistically significant relationship between the free flow speed of a
heavy vehicle and GVW, in that the mean free flow speed will decrease as GVW increases. It
should also be noted that as the speed of heavy vehicles increase, so does the braking distance.
Saifizul et al. noted that taking the GVW into consideration when setting the differential limit
may be more effective than setting it by vehicle classification only, and that when heavy vehicles
with high GVWs are driving at the 85th percentile speed, there is the potential risk for an
increased number of accidents [108].
The most recent evaluation of differential speed limits was completed in 2012 by Dixon et al.
[109] in Idaho, where a differential speed limit was introduced that reduced the truck limit from
75 to 65 mph. This research showed that truck mean speeds were reduced to 65.6 mph and that
the speed variance and violation rate (in terms of vehicles traveling 5+ mph over the posted
limit) were also reduced. The authors estimate that the DSL reduced crashes by 8.56 percent,
though this result was not significant at a 95-percent confidence level.
While there has been extensive research comparing DSLs and USLs, a strong consensus has not
emerged. A summary of the speed differences and crash impacts of differential speed limits for
trucks on freeways was previously provided in TRB Special Report 254 [51]. After examining
available studies, including research in Europe, the authors concluded, “a strong case cannot be
made on empirical ground in support of or opposition to differential speed limits.”
VEHICLE SPEED IMPACTS ON PEDESTRIANS AND BICYCLISTS
Another area of concern when discussing speed limits and vehicular speeds is pedestrian safety.
There have been a number of studies that have examined the impacts of vehicle speeds and speed
limits on pedestrian injury severity. Pasanen [110] found a direct relationship between the risk
of pedestrian fatality and impact speeds. At impact speeds of 20 mph, the probability of
pedestrian fatality was 5 percent. At 50 mph, nearly 100 percent of crash-involved pedestrians
were fatally injured. Andersen [111] reported similar results, as did Leaf and Preusser [112], the
results of which are shown in Figure 8.
24
Figure 8. Effect of Impact Speed on Pedestrian Fatality and Injury [112]
Pasanen [113] conducted a study in Finland, which estimated the hypothetical effects of lower
vehicular speeds on pedestrian fatality rates based on data from actual crashes. The speeds of the
approaching vehicles ranged from 11 mph to 39 mph, with the results suggesting that if the
approach speed was reduced to a maximum of 25 mph, the average death rate would have been
reduced by over 60 percent. A similar study in Australia estimated that the chances of survival
would range from 13 percent, if all drivers had traveled according to the speed limit, to 48
percent if all the drivers would have slowed down by 6 mph [111].
Research conducted by Jensen [114] in Denmark showed that after speed limits were introduced
in 1974, vehicle travel speeds were reduced by 4 mph on average and pedestrian crashes were
reduced by 25 percent. A similar trend occurred in 1985; when the urban speed limits were
reduced from 37 mph to 31 mph, pedestrian fatality rates dropped by 31 percent, serious injuries
by 4 percent, and slight injuries by 9 percent. Injury and fatality cases were plotted to determine
the effect of speed on rate of survival. It was shown that no fatalities occurred for speeds less
than 12 mph, 5 percent of fatalities occurred for speeds up to 31 mph, 20 percent of fatalities for
speeds up to 50 mph, and 35 percent of fatalities for up to 68 mph speeds. The function of
probability of fatality vs. speed was shown to be much less variable than those of serious injuries
and slight injuries vs. speed. The author concluded that this was indicative of the fact that even
for vehicles traveling at high speeds, the speed could be reduced to a level that would increase
25
the chances of survival for most collisions. There appears to be a clear link between the
traveling speed of a vehicle and the probability of injury or fatality for pedestrians, that is, the
higher the traveling speed, the higher the probability of an injury or fatality for a pedestrian
involved in a motor vehicle crash.
One analysis using accident data from 1997 to 2002 in North Carolina determined which factors
have the greatest effect on different severity outcomes for bicyclists involved in motor vehicle
crashes. The outcomes included fatal, incapacitating, non-incapacitating and possible or no
injury categories. There are several factors that influence the severity of an injury experienced
by a bicyclist in a motor vehicle accident, but the factor that had the largest effect was when the
speed of the vehicle prior to impact was more than 50 mph. This was found to increase the
probability of a fatal crash by 16-fold. The “threshold effect”, or the speed at which there is a
great increase in the probability of a fatality in an accident for a bicyclist is 20 mph [115].
Another study, conducted in the United States, found that the two most important variables that
affect non-motorist (i.e. pedestrians and bicyclists) injury severity are the age of the person and
the speed limit on the roadway on which the accident occurred, as speed limits that are higher
lead to higher injury severity levels [116]. The speed at which the driver is traveling appears to
have a very strong effect on injury severity for both pedestrians and bicyclists.
RECENT AND PROPOSED CHANGES TO STATE SPEED LIMIT POLICIES
The preceding sections outline a wide range of safety issues of importance in determining speed
limit policies. While the extant research literature has generally shown that speed limit increases
produce mixed results in terms of traffic safety impacts, many states have recently changed or
considered changing their speed limit policies. This section provides a brief summary of such
information.
Ten states have recently increased speed limits along some of their roadways since 2011. The
majority of these increases occurred along interstate highways. In general, these increases were
done selectively based upon traffic engineering, speed, and safety studies conducted by the state
departments of transportation. This is an important distinction as not all segments of a particular

26
roadway class are likely to be acceptable candidates for speed limit increases. In particular,
segments with extensive horizontal or vertical curvature, sight distance limitations, or other
features that may not comply with current design standards (e.g., design exceptions) may not be
suitable for speed limit increases. Similarly, locations at which the 85th percentile speed is
currently in compliance with the existing speed limit or locations where there is a history of
crashes may not be suitable candidates. Specific details of the recent policy changes follow and
a summary is provided in Table 1.
In Ohio, state legislators raised the speed limit on the Ohio Turnpike from 65 to 70 mph.
Other urban and rural interstates remained posted at 65 mph [117].
As a result of a 2010 bill, a 200-mile stretch of Louisiana’s I-49 speed limit was
increased from 70 mph to 75 mph. The increase was authorized by the state Department
of Transportation and Development after engineering and traffic investigations [118].
Kansas increased its rural freeway speed limits by 5 mph (to 75 mph) following 2011
legislation. A committee comprised of staff from the Kansas DOT was given authority of
selecting the divided, controlled access highways to receive the higher speed limit [119].
HB2192 allowed the Secretary of Transportation to set new speed limit on any separated
multilane highway effective as of July 1, 2011. Several criteria were used in selecting the
locations for increased speed limits from the 1,060 miles of eligible highways, including:
whether it was rural or urban area, if it had at-grade intersections, natural barriers,
commuter traffic, geometrics, surrounding state speed limits, district experience, traffic
volumes, legal issues or concerns, and crashes. A multi-agency task force was assembled
to determine the highways appropriate for a speed limit increase.
As a result of a 2012 bill passed by the state legislature, Texas became the first state in
the U.S. to enact a speed limit of 85 mph. While the Texas DOT concluded that speeds
this high could not be safely implemented on current highways, a new 41-mile toll road
was designed to handle the higher speeds and weights. Before opening, horizontal and
vertical geometry, and sight lines were extensively analyzed [120].
In Ohio, state legislators raised speed limits in non-urban areas by 5 mph. This included
sections of five non-urban freeways, each of which are now posted at 70 mph [117].
In Utah, speed limits on select rural freeways have raised from 75 mph to 80 mph.
Beginning in 2008, UDOT started conducting studies on portions of I-15 that were

27
temporarily set to 80 mph. Results showed that crashes slightly decreased. Speed studies
of highways posted at 75 mph, were also studied. UDOT concluded that most motorists
preferred to drive between 82 and 83 mph regardless of the posted speed limit. As of
September of 2013, 289 miles of highway in Utah were set to a speed limit of 80 mph
[121].
In September of 2013, the North Carolina DOT raised the speed limit of three major
highways from 65 mph to 70 mph (I-540 between U.S. 70 and I-40; All of N.C. Highway
540, including the Triangle Expressway; and N.C. Highway 147 between N.C. Highway
540 and I-40). These increases came as a result of traffic studies that included a review
of the current traveling speed, speed limits, crash data, and road characteristics such as
lane and shoulder widths [122].
Table 1. Recent Changes to Speed Limit Policies by State
State Type of Roadway Prior Speed New Speed Effective Date Ohio Ohio Turnpike 65 70 April 2011 Louisiana Select Rural Freeways 70 75 July 2011 Kansas Rural Freeways 70 75 July 2011 Indiana Tollway 55 70 February 2012 Arkansas Select Rural Highway 55 60; 65 June 2012 Texas Rural Freeways; Tollway 75; 80 80; 85 October 2012 Kentucky Select US Highway 55 65 October 2012 Ohio Select Rural Freeways 65 70 July 2013
North Carolina Select Rural Freeways 65 70 September 2013
Utah Select Rural Freeways 75 80 September 2013Alaska State Highway 55 65 November 2013Georgia Select Interstates 55 65 November 2013Illinois Tollway; Select Freeways 55; 65 70 January 2014
New Hampshire Select Interstates 65 70 January 2014
South Carolina Select State Highways 55 60 January 2014
Pennsylvania Rural Freeways 65 70 January 2014
Maine Select Interstates 55; 65 60; 70 May 2014
Wyoming Select Interstates 75 80 July 2014

28
In Illinois, the speed limit for ninety percent of interstate miles was raised from 65 mph
to 70 mph at the beginning of 2014. These roadways are made up of mostly rural
highways, with the exception of five short sections of the Illinois Tollway, which were
increased 15 mph to 70 mph. The Illinois DOT conducted traffic engineering studies and
examined 85th percentile speeds in support of these recommendations [123].
In 2013, the speed limit was increased along a 30-mile stretch of I-93 in New Hampshire
from 65 to 70 mph [124].
South Carolina increased the speed limit for a section of SC-170, from 55 to 60 mph. The
DOT examined this section of the route, which has no traffic lights and few exits, and
determined it was safe to increase the speed limit [125].
Pennsylvania increased rural freeway limits on select roadways in January 2014. The
Pennsylvania DOT will conduct a study of any candidate segments [126].
A follow-up survey was conducted of the DOTs from those states listed in Table 1 in order to
obtain feedback on any preliminary findings associated with the recent speed limit increases. A
brief summary follows:
Collectively, these states considered a range of factors in determining whether speed limit
increases were appropriate at specific locations. This includes consideration of the
existing 85th percentile speed, as well as whether there is a history of traffic crashes or
fatalities on the associated segment. As one example, in Louisiana, the speed limit
increases were conducted in accordance with the Louisiana DOT’s Engineering Directive
and Standard Manual VIII Establishment of Speed Zones.
Preliminary data from these states show that both mean and 85th percentile speeds
generally increased by 2 to 4 mph following the speed limit increase. This finding is
consistent with empirical research in this area.
Given how recently these increases were implemented, none of these states had been able
to determine whether or not the speed limit changes had any measureable effect on traffic
crashes.
The only documented cost elements provided by any of the responding states was for the
provision of new speed limit signage, which could include either sign replacement or the
use of a new speed limit plaque that was overlaid on the existing sign.

29
In addition to the preceding initiatives, each of which has been approved by state legislatures,
five states have recently implemented, or are in the process of implementing, speed limit
increases. These proposed changes, summarized in Table 2, are as follows:
Florida lawmakers proposed a bill that would allow the Florida DOT to selectively study
and, if permitted, raise speed limits. Driver feedback and safety data would be used to
prompt a speed study for candidate sections. The bill was focused on mostly rural
stretches of highway, such as I-10 and I-4. These four-lane highways would see a 5-mph
increase in the speed limit from 70 mph to 75 mph. Other four-lane highways with speed
limits currently set at 60 mph or 65 mph could see similar 5-mph increases [127].
Lawmakers in North Carolina are considering similar legislation to raise the maximum
speed limit for some interstates and highways from 70 mph to 75 mph. If the bill is
passed, NCDOT will then complete traffic studies and examine crash histories for
specific roadways to determine if the increase is reasonable and safe [128].
In New York State, interstate highways including the Thruway could see a 10 mph boost,
if permitted by the state transportation commissioner, from 65 mph to 75 mph [129].
In Missouri, lawmakers are considering allowing the speed limits along rural freeways, to
be increased from 70 mph up to 75 mph [130].
In Kentucky, non-limited access highways may also see an increase as lawmakers are
considering increasing the speed limits from 55 to 65 mph for state highways, such as
KY-80 [131].
Table 2. Proposed Changes to Speed Limit Policies by State (as of January 2014)
State Type of Roadway Current Speed Proposed Speed
Florida
Select Rural Freeways 70 75
Four-Lane Highways 60 65
65 70
New York Interstates 65 75
Missouri Rural Freeways 70 75
North Carolina Select Rural Freeways 70 75
3 Major Highways 65 70
Kentucky State Highways 55 65
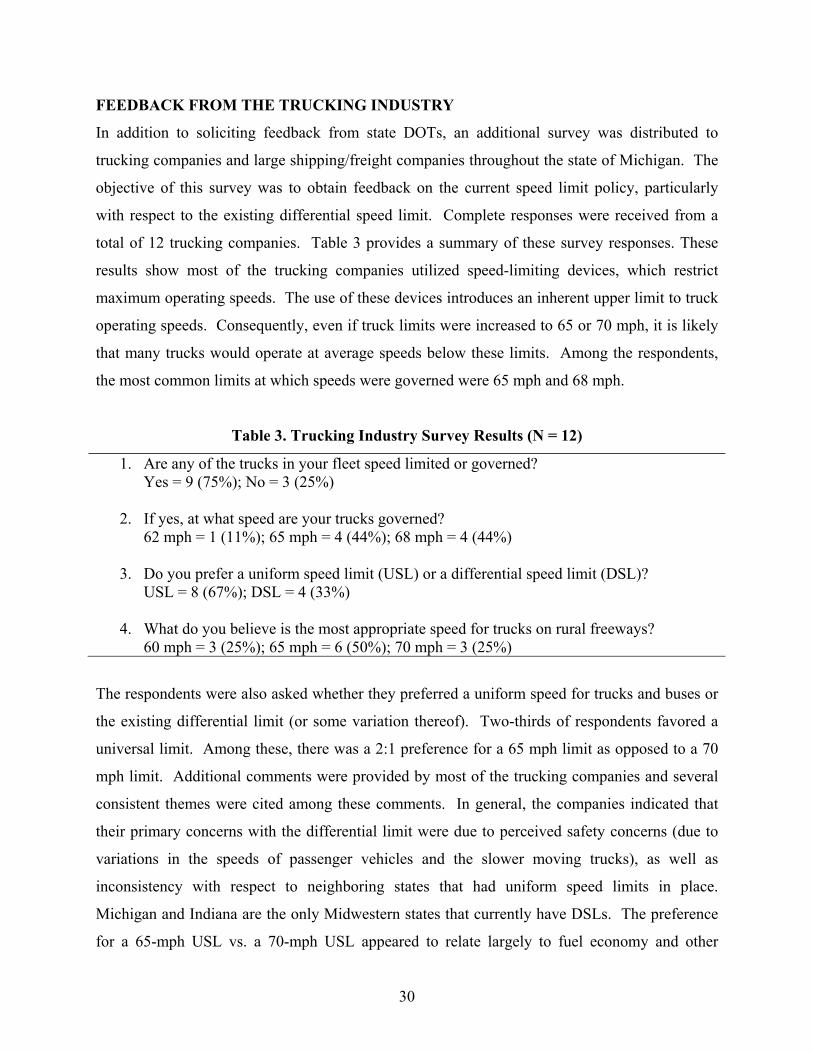
30
FEEDBACK FROM THE TRUCKING INDUSTRY
In addition to soliciting feedback from state DOTs, an additional survey was distributed to
trucking companies and large shipping/freight companies throughout the state of Michigan. The
objective of this survey was to obtain feedback on the current speed limit policy, particularly
with respect to the existing differential speed limit. Complete responses were received from a
total of 12 trucking companies. Table 3 provides a summary of these survey responses. These
results show most of the trucking companies utilized speed-limiting devices, which restrict
maximum operating speeds. The use of these devices introduces an inherent upper limit to truck
operating speeds. Consequently, even if truck limits were increased to 65 or 70 mph, it is likely
that many trucks would operate at average speeds below these limits. Among the respondents,
the most common limits at which speeds were governed were 65 mph and 68 mph.
Table 3. Trucking Industry Survey Results (N = 12)
1. Are any of the trucks in your fleet speed limited or governed? Yes = 9 (75%); No = 3 (25%)
2. If yes, at what speed are your trucks governed? 62 mph = 1 (11%); 65 mph = 4 (44%); 68 mph = 4 (44%)
3. Do you prefer a uniform speed limit (USL) or a differential speed limit (DSL)?
USL = 8 (67%); DSL = 4 (33%)
4. What do you believe is the most appropriate speed for trucks on rural freeways? 60 mph = 3 (25%); 65 mph = 6 (50%); 70 mph = 3 (25%)
The respondents were also asked whether they preferred a uniform speed for trucks and buses or
the existing differential limit (or some variation thereof). Two-thirds of respondents favored a
universal limit. Among these, there was a 2:1 preference for a 65 mph limit as opposed to a 70
mph limit. Additional comments were provided by most of the trucking companies and several
consistent themes were cited among these comments. In general, the companies indicated that
their primary concerns with the differential limit were due to perceived safety concerns (due to
variations in the speeds of passenger vehicles and the slower moving trucks), as well as
inconsistency with respect to neighboring states that had uniform speed limits in place.
Michigan and Indiana are the only Midwestern states that currently have DSLs. The preference
for a 65-mph USL vs. a 70-mph USL appeared to relate largely to fuel economy and other
31
vehicle operating costs. Several respondents cited the intermediate 65-mph limit provided for
an optimal balance of safety and economy.
LITERATURE SUMMARY
The preceding discussion illustrates a rich body of research literature that has assessed the effects
of speed and speed limit policies on traffic safety. This review also included surveys of state
departments of transportation (DOTs) and trucking companies in order to gain diverse insights as
to important issues associated with speed limit increases. The salient findings from this review
are summarized as follows:
The risk of traffic crashes increases as the variance in travel speeds (i.e., the variability
among vehicles at a particular road location) increases. This risk is most pronounced at
speeds that are significantly above the mean speed of traffic.
The risk of traffic crashes and fatalities, in particular, is greater at higher travel speeds.
The research literature has consistently shown the frequency and rate of traffic crashes,
injuries, and fatalities to increase at higher speed limits.
The literature is largely mixed with regard to the effects of differential speed limits.
While no consensus has developed with respect to prospective safety impacts, the
majority of states have gone toward uniform speed limits. Uniform limits have been
shown to reduce the variance in travel speeds, which in turn is expected to reduce the risk
of traffic crashes and resultant injuries/fatalities. Responses from the trucking industry
survey suggest that trucking companies are receptive to increasing the maximum
truck/bus limit, though the use of speed limiting devices and economic considerations
suggest there is a practical upper limit.
During the past four to five years, various states have enacted selective speed limit
increases. These increases have generally occurred on the limited access (i.e.,
interstate/freeway) highway network. In contrast to prior efforts, which were generally of
a larger scale, recent increases have been applied after careful study of existing traffic
crash and travel speed data.

32
CHAPTER 3:
ANALYSIS OF NATIONAL AND STATE-LEVEL TRAFFIC CRASH DATA
One of the principal objectives of this study was to examine the impacts of speed limit policies
on traffic safety. To this end, a series of statistical analyses were conducted at two levels of
aggregation:
1. A national-level assessment of fatal crash trends on interstate highways across all 50
states – A longitudinal analysis was conducted to examine trends in traffic fatalities
among states with various speed limit policies while controlling for other factors that may
be expected to influence fatalities at the aggregate level. Ultimately, the data collected
for these states allowed for a determination of how traffic fatalities have changed over
time and how these trends may relate to the speed limit policies that were in place.
2. A state-level assessment of traffic crash trends on freeways in Michigan – traffic crash,
injury, and fatality rates were examined for freeways throughout Michigan. The
emphases of this analysis were to discern differences in safety performance between three
freeway classes: urban freeways posted at 55 mph for all vehicles; urban freeways posted
at 70 mph for passenger vehicles and 60 mph for trucks/buses; and rural freeways posted
at 70 mph/60 mph for passenger vehicles and trucks/buses.
ANALYSIS OF NATIONAL INTERSTATE FATALITY DATA
An aggregate-level (i.e., national) analysis was conducted to analyze trends across all 50 states.
This analysis allows for an assessment of statewide trends in traffic fatalities while considering
changes in additional factors such as vehicle-miles of travel, population characteristics, and
safety-related legislation, policies, and programs. The following aggregate-level data were
obtained for all 50 states and the District of Columbia:
Fatality Data – The Fatality Analysis Reporting System (FARS) database provides
information for all traffic crashes that result in a fatal injury within 30 days of the crash.
For the purposes of this project, information for all interstate fatal crashes occurring in
each state dating back to 1999 were collected [132]. These crashes were aggregated by
interstate class (urban versus rural) and whether a truck or bus was involved in the crash.
33
Traffic Volume, Freeway Mileage, Vehicle Registration, and Driver Licensure Data –
The FHWA requires states to report Highway Performance Monitoring System (HPMS)
data on an annual basis. Data for total statewide vehicle-miles of travel were obtained for
each state from the FHWA annual series, Highway Statistics [133]. These data include
estimates of travel for all vehicle types, as well as estimates of the number of registered
vehicles and licensed drivers in each state. Table 4 shows the annual vehicle-miles in
millions for rural and urban interstates by state, and Table 5 shows the percentage of
annual miles traveled by vehicle type for rural and urban interstates for each state. The
most recent volume data available were for the year 2011. Consequently, the analysis
period was from 1999 to 2011. As volume estimates by vehicle class are only available
at the state level for 2009 and 2010, these values were averaged for each state across the
analysis period.
Speed Limit Policy Data – The policy for setting interstate speed limits for each state,
including whether differential speed limits are used, were obtained from the Insurance
Institute for Highway Safety (IIHS) and from state DOT or legislative records. Figures 9
and 10 show the maximum speed limits on rural interstates for passenger vehicles and
trucks/buses, respectively. Figures 11 and 12 show the maximum speed limits on urban
interstates for passenger vehicles and trucks/buses, respectively. It should be noted that
data for states with speed limits above 75 mph are very limited. Only Idaho, Texas, Utah,
and Wyoming have limits of 80 mph or above. In these states, the higher limits are in
effect at only select locations. Consequently, it not possible to distinguish specific trends
at these to speeds. For the purpose of the analysis, these states are coded in a 75-mph and
above category.
Occupant Protection Data – The type of seat belt use law (primary, secondary, or none)
and type of motorcycle helmet use law (universal, partial, or none) for each state was
determined for each year of the study period, and the most recent laws by state are shown
in Figures 13 and 14 for seatbelt laws and helmet laws, respectively. Additionally, the
National Highway Traffic Safety Administration (NHTSA) requires states to provide
annual statewide estimates of safety belt use, which generally become available each fall.
This information was obtained for the same time period, and the most recent snapshot of
seatbelt use by state (2013 Data) is shown in Table 6.
34
Population Data – Data for the driving age population of each state (ages 16 and older)
were obtained from the United States Census Bureau [134].
Climate Data – Statewide average yearly temperature and total precipitation data were
obtained from the National Oceanic and Atmospheric Administration (NOAA) [135].
Statewide averages were unavailable for Alaska and Hawaii.
Gasoline Price Data – Average annual gasoline prices were calculated for each state
based on data provided by the Energy Information Administration (EIA). These data
were converted from dollars per MMBtu to dollars per gallon using the procedure
recommended by the EIA.
Collectively, these data were aggregated for select states based upon historical interstate speed
limit policies. States were aggregated based upon the following policy factors:
Maximum rural interstate speed limit (60-65 mph, 70 mph, 75-80 mph)
Maximum urban interstate speed limit (50-60 mph, 65 mph, 70-75 mph)
Uniform versus differential speed limit (9-11 states w/rural DSLs, 4 states w/urban DSLs
during the study period)
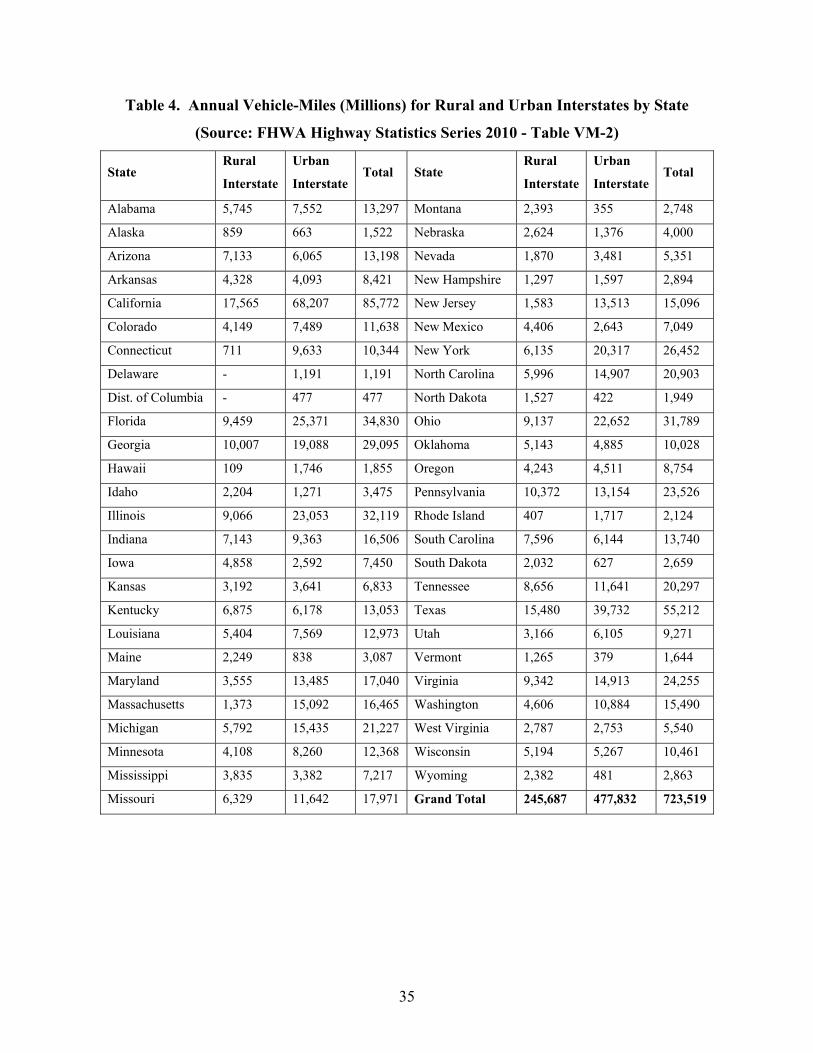
35
Table 4. Annual Vehicle-Miles (Millions) for Rural and Urban Interstates by State
(Source: FHWA Highway Statistics Series 2010 - Table VM-2)
State Rural
Interstate
Urban
Interstate Total State
Rural
Interstate
Urban
Interstate Total
Alabama 5,745 7,552 13,297 Montana 2,393 355 2,748
Alaska 859 663 1,522 Nebraska 2,624 1,376 4,000
Arizona 7,133 6,065 13,198 Nevada 1,870 3,481 5,351
Arkansas 4,328 4,093 8,421 New Hampshire 1,297 1,597 2,894
California 17,565 68,207 85,772 New Jersey 1,583 13,513 15,096
Colorado 4,149 7,489 11,638 New Mexico 4,406 2,643 7,049
Connecticut 711 9,633 10,344 New York 6,135 20,317 26,452
Delaware - 1,191 1,191 North Carolina 5,996 14,907 20,903
Dist. of Columbia - 477 477 North Dakota 1,527 422 1,949
Florida 9,459 25,371 34,830 Ohio 9,137 22,652 31,789
Georgia 10,007 19,088 29,095 Oklahoma 5,143 4,885 10,028
Hawaii 109 1,746 1,855 Oregon 4,243 4,511 8,754
Idaho 2,204 1,271 3,475 Pennsylvania 10,372 13,154 23,526
Illinois 9,066 23,053 32,119 Rhode Island 407 1,717 2,124
Indiana 7,143 9,363 16,506 South Carolina 7,596 6,144 13,740
Iowa 4,858 2,592 7,450 South Dakota 2,032 627 2,659
Kansas 3,192 3,641 6,833 Tennessee 8,656 11,641 20,297
Kentucky 6,875 6,178 13,053 Texas 15,480 39,732 55,212
Louisiana 5,404 7,569 12,973 Utah 3,166 6,105 9,271
Maine 2,249 838 3,087 Vermont 1,265 379 1,644
Maryland 3,555 13,485 17,040 Virginia 9,342 14,913 24,255
Massachusetts 1,373 15,092 16,465 Washington 4,606 10,884 15,490
Michigan 5,792 15,435 21,227 West Virginia 2,787 2,753 5,540
Minnesota 4,108 8,260 12,368 Wisconsin 5,194 5,267 10,461
Mississippi 3,835 3,382 7,217 Wyoming 2,382 481 2,863
Missouri 6,329 11,642 17,971 Grand Total 245,687 477,832 723,519

36
Table 5. Percentage of Annual Miles Traveled by Vehicle Type for Rural and Urban
Interstates (Source: FHWA Highway Statistics Series 2010 - Table VM-4)
State
Rural Interstates Urban Interstates
Passenger
Vehicles Buses
Single-
Unit
Trucks
Tractor
Trailer
Trucks
Passenger
Vehicles Buses
Single-
Unit
Trucks
Tractor
Trailer
Trucks
Alabama 75.2 0.7 5.6 18.5 88.4 0.4 3.3 8.0
Alaska 87.5 0.2 8.6 3.7 93.1 0.2 5.8 1.1
Arizona 74.2 0.7 3.0 22.1 88.6 0.8 3.8 6.9
Arkansas 62.6 1.1 2.7 33.6 78.9 0.6 2.0 18.6
California 74.4 0.2 5.0 20.5 93.5 0.1 2.4 4.1
Colorado 87.7 0.3 1.8 10.4 92.9 0.2 2.0 4.9
Connecticut 87.9 0.3 3.6 8.2 90.9 0.2 3.0 5.9
Delaware - - - - 87.3 1.2 5.3 6.3
Dist. of Columbia - - - - 94.7 0.6 4.0 0.7
Florida 82.1 0.6 3.8 13.6 91.7 0.5 2.9 4.9
Georgia 78.0 0.7 2.8 18.4 91.6 0.6 2.6 5.3
Hawaii 95.7 0.3 2.1 1.9 95.2 0.5 3.6 0.8
Idaho 70.4 0.3 25.7 3.6 55.5 0.4 5.2 38.9
Illinois 70.9 1.0 3.2 24.9 87.4 0.7 2.2 9.7
Indiana 65.0 1.1 3.5 30.4 73.7 0.9 2.9 22.5
Iowa 73.0 0.7 2.6 23.8 85.2 0.6 2.5 11.7
Kansas 75.1 0.2 2.6 22.1 91.1 0.1 2.5 6.4
Kentucky 75.6 0.8 2.6 21.0 88.4 0.6 1.9 9.1
Louisiana 76.7 0.4 6.0 16.9 80.3 0.4 5.8 13.5
Maine 84.5 0.3 3.3 11.9 88.1 0.5 3.0 8.4
Maryland 83.1 0.9 3.7 12.2 92.4 0.7 3.0 3.9
Massachusetts 90.0 5.8 1.7 2.5 93.4 1.1 2.0 3.5
Michigan 86.5 0.2 2.5 10.8 90.2 0.2 2.3 7.4
Minnesota 88.3 0.5 2.9 8.2 93.1 0.3 2.2 4.0
Mississippi 74.8 0.8 4.4 20.0 86.2 0.6 3.7 9.6
Missouri 65.9 0.7 3.9 29.5 83.6 0.5 3.6 12.3

37
Table 5. Percentage of Annual Miles Traveled by Vehicle Type for Rural and Urban
Interstates (Cont’d) (Source: FHWA Highway Statistics Series 2010 - Table VM-4)
State
Rural Interstates Urban Interstates
Passenger
Vehicles Buses
Single-
Unit
Trucks
Tractor
Trailer
Trucks
Passenger
Vehicles Buses
Single-
Unit
Trucks
Tractor
Trailer
Trucks
Montana 77.2 0.7 3.3 18.8 88.0 0.3 4.6 7.1
Nebraska 65.4 0.2 2.0 32.5 93.1 0.1 1.9 4.9
Nevada 75.6 0.6 2.7 21.1 92.3 0.5 2.0 5.3
New Hampshire 91.8 0.3 3.2 4.7 93.9 0.2 3.1 2.8
New Jersey 88.4 0.4 9.0 2.3 86.3 0.4 3.5 9.9
New Mexico 58.4 2.6 6.9 32.1 75.7 1.1 3.7 19.5
New York 84.4 0.5 2.1 13.0 90.7 0.8 2.8 5.7
North Carolina 78.8 0.6 3.2 17.4 86.4 0.6 3.1 9.9
North Dakota 78.8 1.4 6.0 13.8 86.3 1.1 4.7 7.9
Ohio 68.0 0.0 3.0 29.0 87.0 0.0 2.0 11.0
Oklahoma 67.0 0.5 5.2 27.5 87.6 0.4 5.2 6.9
Oregon 70.8 0.2 3.7 25.3 87.5 0.3 3.5 8.8
Pennsylvania 66.5 0.9 12.5 20.2 86.5 0.7 7.0 5.8
Rhode Island 86.7 0.6 3.1 9.6 95.3 0.6 2.8 1.3
South Carolina 82.4 0.7 2.4 14.5 91.4 0.4 2.3 5.9
South Dakota 78.2 0.3 18.4 3.1 86.7 0.1 9.8 3.4
Tennessee 71.7 0.3 5.3 22.7 80.9 0.2 2.8 16.1
Texas 69.9 0.3 4.6 25.2 89.5 0.2 3.3 7.0
Utah 58.6 1.3 8.8 31.4 81.2 0.3 8.9 9.7
Vermont 84.4 1.4 4.9 9.3 90.9 0.9 3.4 4.8
Virginia 80.8 0.7 1.5 17.0 92.1 0.6 1.3 6.1
Washington 83.0 0.3 5.5 11.3 90.6 0.2 4.3 4.9
West Virginia 78.7 0.9 3.9 16.5 84.1 0.8 3.5 11.6
Wisconsin 75.3 0.9 8.4 15.4 89.2 0.2 5.8 4.8
Wyoming 64.5 0.5 1.8 33.2 69.2 0.5 2.0 28.3
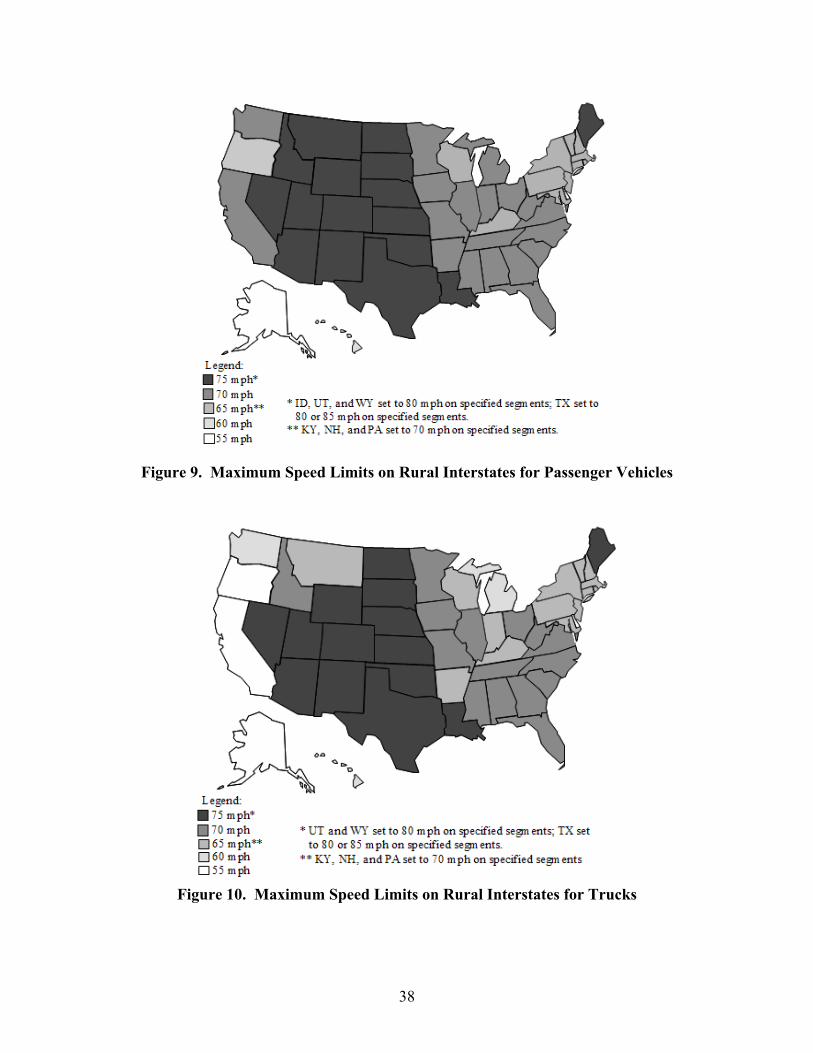
38
Figure 9. Maximum Speed Limits on Rural Interstates for Passenger Vehicles
Figure 10. Maximum Speed Limits on Rural Interstates for Trucks
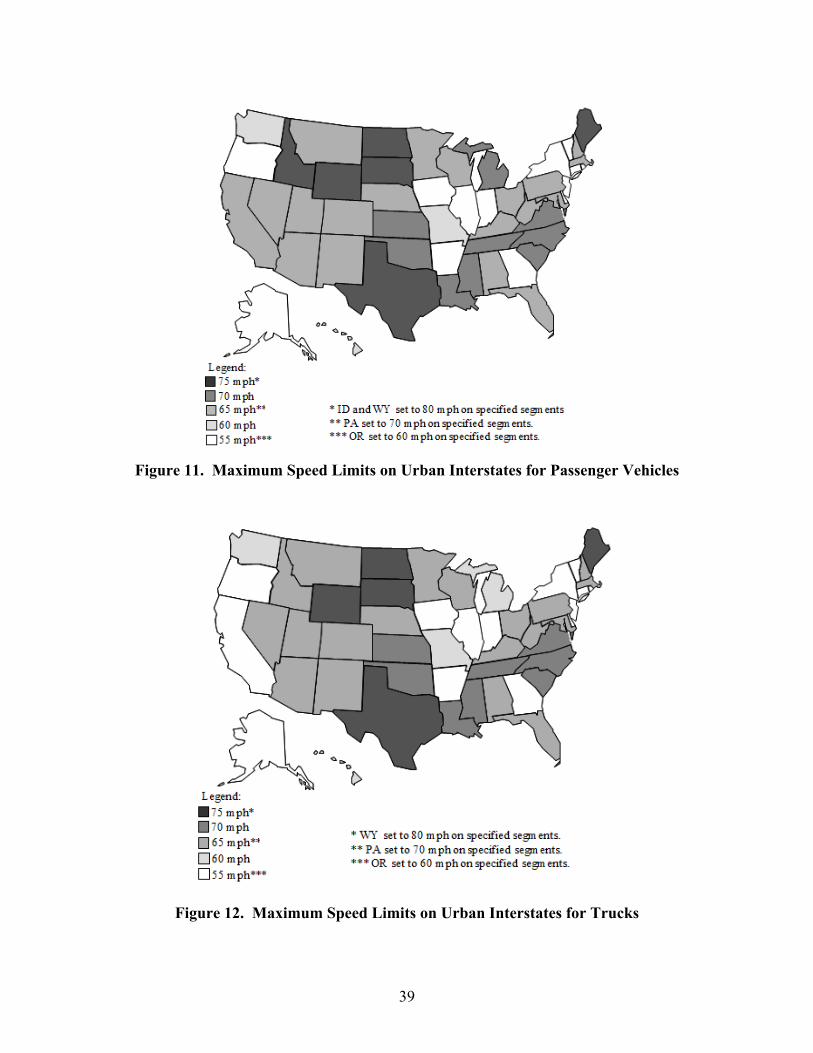
39
Figure 11. Maximum Speed Limits on Urban Interstates for Passenger Vehicles
Figure 12. Maximum Speed Limits on Urban Interstates for Trucks

40
Figure 13. Seatbelt Use Laws by State
Figure 14. Helmet Use Laws by State

41
Table 6. Seatbelt Use Rates by State (2013 Data) (Source: NHTSA Seatbelt Use in 2013 – Use Rates in the States and Territories)
State 2013 Seat Belt Use Rate (%)
State 2013 Seat Belt Use Rate (%)
Alabama 97.3 Montana 74.0 Alaska 86.1 Nebraska 79.1 Arizona 84.7 Nevada 94.8 Arkansas 76.7 New Hampshire 73.0 California 97.4 New Jersey 91.0 Colorado 82.1 New Mexico 92.0 Connecticut 86.6 New York 91.1 Delaware 92.2 North Carolina 88.6 Dist. of Columbia 87.5 North Dakota 77.7 Florida 87.2 Ohio 84.5 Georgia 95.5 Oklahoma 83.6 Hawaii 94.0 Oregon 98.2 Idaho 81.6 Pennsylvania 84.0 Illinois 93.7 Rhode Island 85.6 Indiana 91.6 South Carolina 91.7 Iowa 91.9 South Dakota 68.7 Kansas 80.7 Tennessee 84.8 Kentucky 85.0 Texas 90.3 Louisiana 82.5 Utah 82.4 Maine 83.0 Vermont 84.9 Maryland 90.7 Virginia 79.7 Massachusetts 74.8 Washington 94.5 Michigan 93.0 West Virginia 82.2 Minnesota 94.8 Wisconsin 82.4 Mississippi 74.4 Wyoming 81.9 Missouri 80.1 Nationwide 87.0
Table 7 presents summary statistics (minimum, maximum, mean, standard deviation) for each of
the previously described data sources that were assembled for use in the safety analysis.
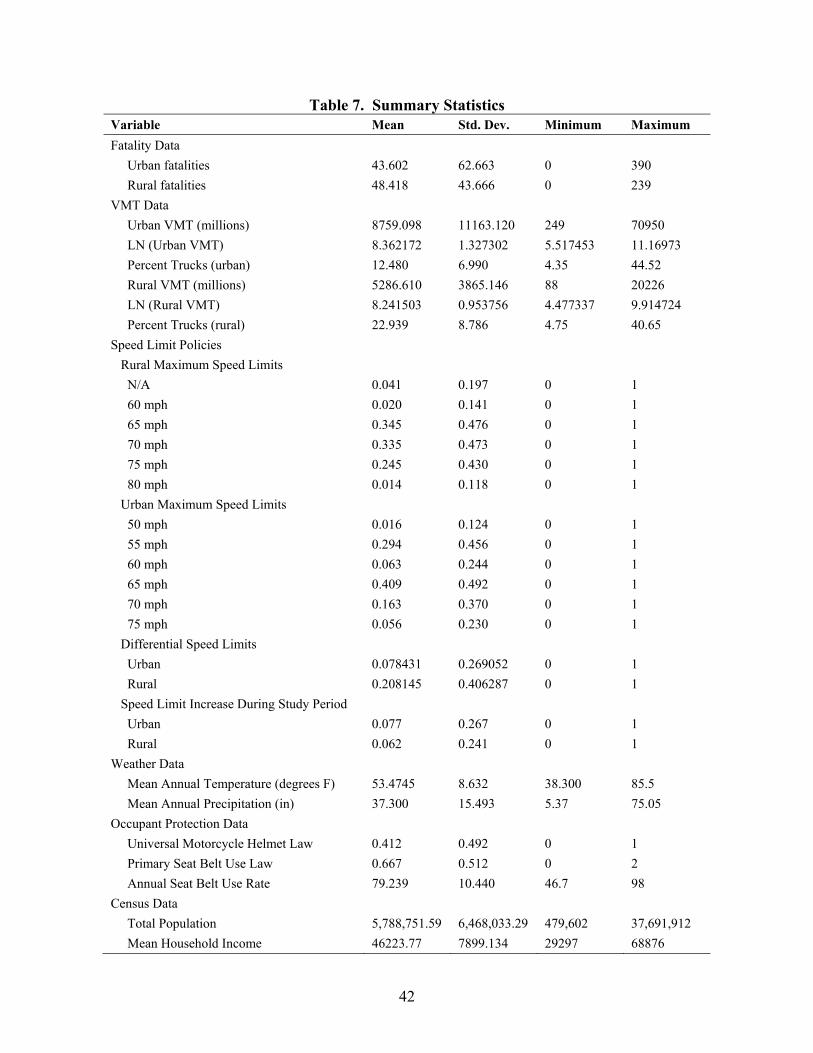
42
Table 7. Summary Statistics Variable Mean Std. Dev. Minimum Maximum
Fatality Data
Urban fatalities 43.602 62.663 0 390
Rural fatalities 48.418 43.666 0 239
VMT Data
Urban VMT (millions) 8759.098 11163.120 249 70950
LN (Urban VMT) 8.362172 1.327302 5.517453 11.16973
Percent Trucks (urban) 12.480 6.990 4.35 44.52
Rural VMT (millions) 5286.610 3865.146 88 20226
LN (Rural VMT) 8.241503 0.953756 4.477337 9.914724
Percent Trucks (rural) 22.939 8.786 4.75 40.65
Speed Limit Policies
Rural Maximum Speed Limits
N/A 0.041 0.197 0 1
60 mph 0.020 0.141 0 1
65 mph 0.345 0.476 0 1
70 mph 0.335 0.473 0 1
75 mph 0.245 0.430 0 1
80 mph 0.014 0.118 0 1
Urban Maximum Speed Limits
50 mph 0.016 0.124 0 1
55 mph 0.294 0.456 0 1
60 mph 0.063 0.244 0 1
65 mph 0.409 0.492 0 1
70 mph 0.163 0.370 0 1
75 mph 0.056 0.230 0 1
Differential Speed Limits
Urban 0.078431 0.269052 0 1
Rural 0.208145 0.406287 0 1
Speed Limit Increase During Study Period
Urban 0.077 0.267 0 1
Rural 0.062 0.241 0 1
Weather Data
Mean Annual Temperature (degrees F) 53.4745 8.632 38.300 85.5
Mean Annual Precipitation (in) 37.300 15.493 5.37 75.05
Occupant Protection Data
Universal Motorcycle Helmet Law 0.412 0.492 0 1
Primary Seat Belt Use Law 0.667 0.512 0 2
Annual Seat Belt Use Rate 79.239 10.440 46.7 98
Census Data
Total Population 5,788,751.59 6,468,033.29 479,602 37,691,912
Mean Household Income 46223.77 7899.134 29297 68876
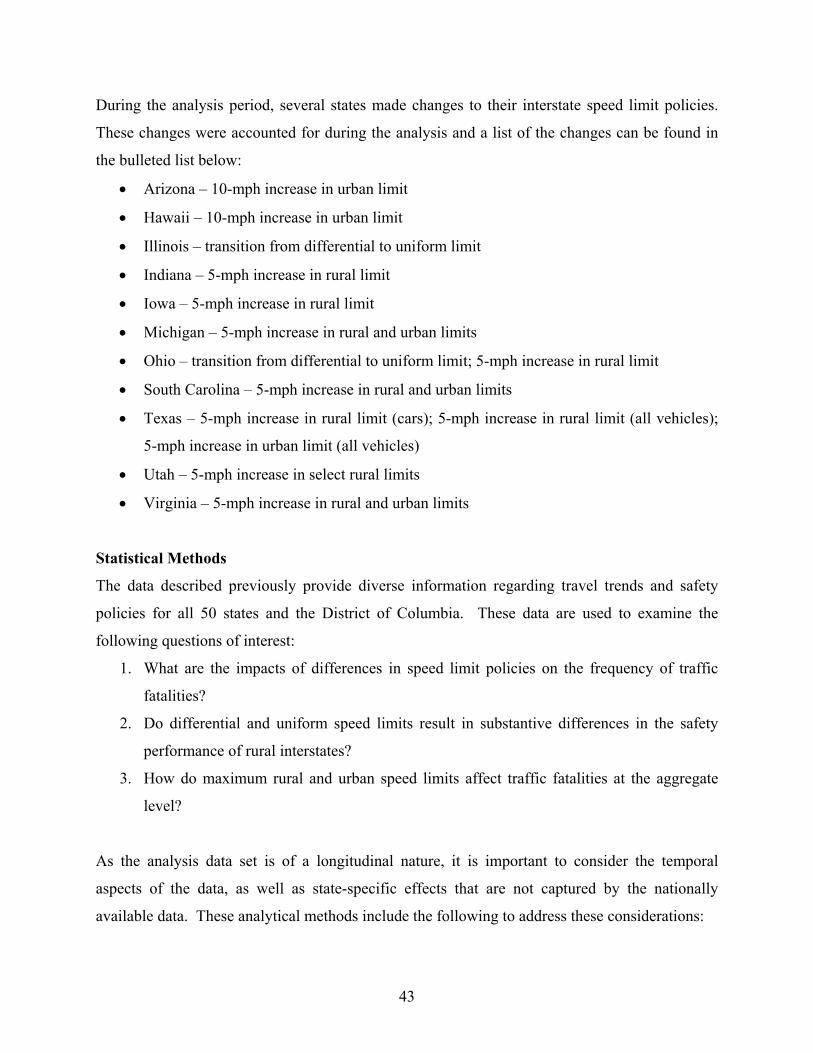
43
During the analysis period, several states made changes to their interstate speed limit policies.
These changes were accounted for during the analysis and a list of the changes can be found in
the bulleted list below:
Arizona – 10-mph increase in urban limit
Hawaii – 10-mph increase in urban limit
Illinois – transition from differential to uniform limit
Indiana – 5-mph increase in rural limit
Iowa – 5-mph increase in rural limit
Michigan – 5-mph increase in rural and urban limits
Ohio – transition from differential to uniform limit; 5-mph increase in rural limit
South Carolina – 5-mph increase in rural and urban limits
Texas – 5-mph increase in rural limit (cars); 5-mph increase in rural limit (all vehicles);
5-mph increase in urban limit (all vehicles)
Utah – 5-mph increase in select rural limits
Virginia – 5-mph increase in rural and urban limits
Statistical Methods
The data described previously provide diverse information regarding travel trends and safety
policies for all 50 states and the District of Columbia. These data are used to examine the
following questions of interest:
1. What are the impacts of differences in speed limit policies on the frequency of traffic
fatalities?
2. Do differential and uniform speed limits result in substantive differences in the safety
performance of rural interstates?
3. How do maximum rural and urban speed limits affect traffic fatalities at the aggregate
level?
As the analysis data set is of a longitudinal nature, it is important to consider the temporal
aspects of the data, as well as state-specific effects that are not captured by the nationally
available data. These analytical methods include the following to address these considerations:

44
Given that the number of annual interstate fatalities is best characterized as count data
(i.e., non-negative integers), negative binomial regression models represent an
appropriate modeling framework. These models can be used to examine how changes in
various explanatory variables affect the number of fatalities occurring during a particular
year in a specific state.
Regression models were estimated that captured the general decreasing trend in traffic
fatalities (over the period from 1999 to 2011) through the inclusion of a linear time trend.
This model formulation provided better fit as compared to a series of indicator variables
for the 13 time periods.
Random effects models were estimated, which can capture state-specific effects (e.g.,
certain states will tend to exhibit more crashes than other, similar states). This controls
for the fact that certain states may exhibit unique differences in geographic conditions,
safety policies, or other factors.
As noted above, in order to ascertain the effects of speed limit policies on fatal crashes, a series
of random effects negative binomial regression models were estimated as a part of this study.
The negative binomial model specification estimates the probability P(nit) of nit fatal crashes
occurring in state i during year t as:
!1 (1)
where , , Γ(∙) is a gamma function, and is given by:
ln (2)
where Xit is a vector of characteristics affecting the number of fatal crashes in state i during year
t, β is a vector of estimable coefficients; and exp( is a gamma-distributed error term with
mean one and variance α.
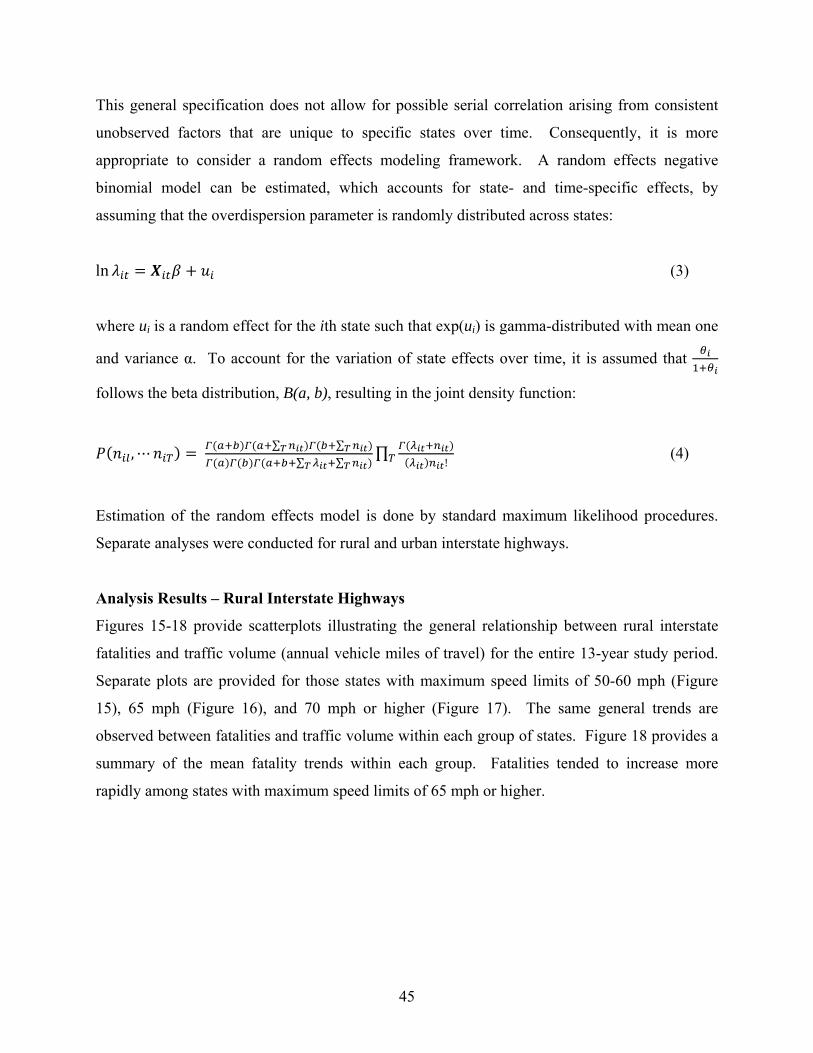
45
This general specification does not allow for possible serial correlation arising from consistent
unobserved factors that are unique to specific states over time. Consequently, it is more
appropriate to consider a random effects modeling framework. A random effects negative
binomial model can be estimated, which accounts for state- and time-specific effects, by
assuming that the overdispersion parameter is randomly distributed across states:
ln (3)
where ui is a random effect for the ith state such that exp(ui) is gamma-distributed with mean one
and variance α. To account for the variation of state effects over time, it is assumed that
follows the beta distribution, B(a, b), resulting in the joint density function:
, ⋯ ∑ ∑
∑ ∑∏
! (4)
Estimation of the random effects model is done by standard maximum likelihood procedures.
Separate analyses were conducted for rural and urban interstate highways.
Analysis Results – Rural Interstate Highways
Figures 15-18 provide scatterplots illustrating the general relationship between rural interstate
fatalities and traffic volume (annual vehicle miles of travel) for the entire 13-year study period.
Separate plots are provided for those states with maximum speed limits of 50-60 mph (Figure
15), 65 mph (Figure 16), and 70 mph or higher (Figure 17). The same general trends are
observed between fatalities and traffic volume within each group of states. Figure 18 provides a
summary of the mean fatality trends within each group. Fatalities tended to increase more
rapidly among states with maximum speed limits of 65 mph or higher.

46
Figure 15. Annual Rural Interstate Fatalities in States with 50-60 mph Maximum Limit
Figure 16. Annual Rural Interstate Fatalities in States with 65 mph Maximum Limit

47
Figure 17. Annual Rural Interstate Fatalities in States with 70+ mph Maximum Limit
Figure 18. Average Annual Rural Interstate Fatalities by Maximum Limit
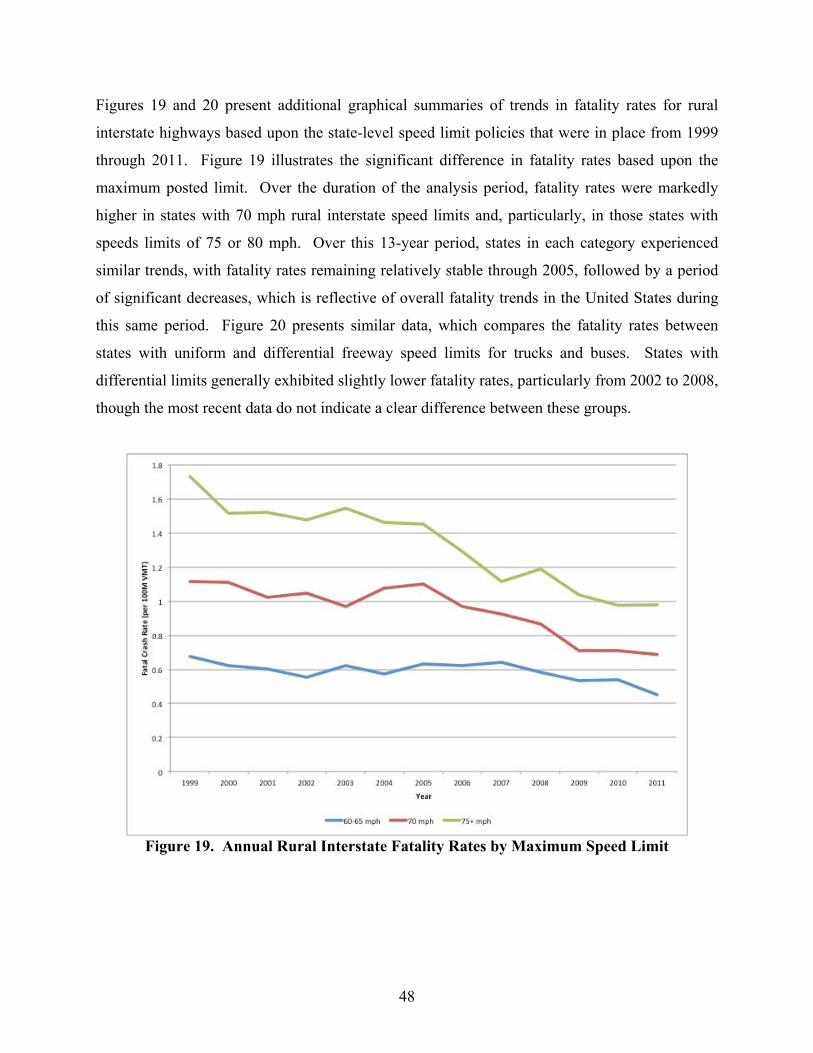
48
Figures 19 and 20 present additional graphical summaries of trends in fatality rates for rural
interstate highways based upon the state-level speed limit policies that were in place from 1999
through 2011. Figure 19 illustrates the significant difference in fatality rates based upon the
maximum posted limit. Over the duration of the analysis period, fatality rates were markedly
higher in states with 70 mph rural interstate speed limits and, particularly, in those states with
speeds limits of 75 or 80 mph. Over this 13-year period, states in each category experienced
similar trends, with fatality rates remaining relatively stable through 2005, followed by a period
of significant decreases, which is reflective of overall fatality trends in the United States during
this same period. Figure 20 presents similar data, which compares the fatality rates between
states with uniform and differential freeway speed limits for trucks and buses. States with
differential limits generally exhibited slightly lower fatality rates, particularly from 2002 to 2008,
though the most recent data do not indicate a clear difference between these groups.
Figure 19. Annual Rural Interstate Fatality Rates by Maximum Speed Limit
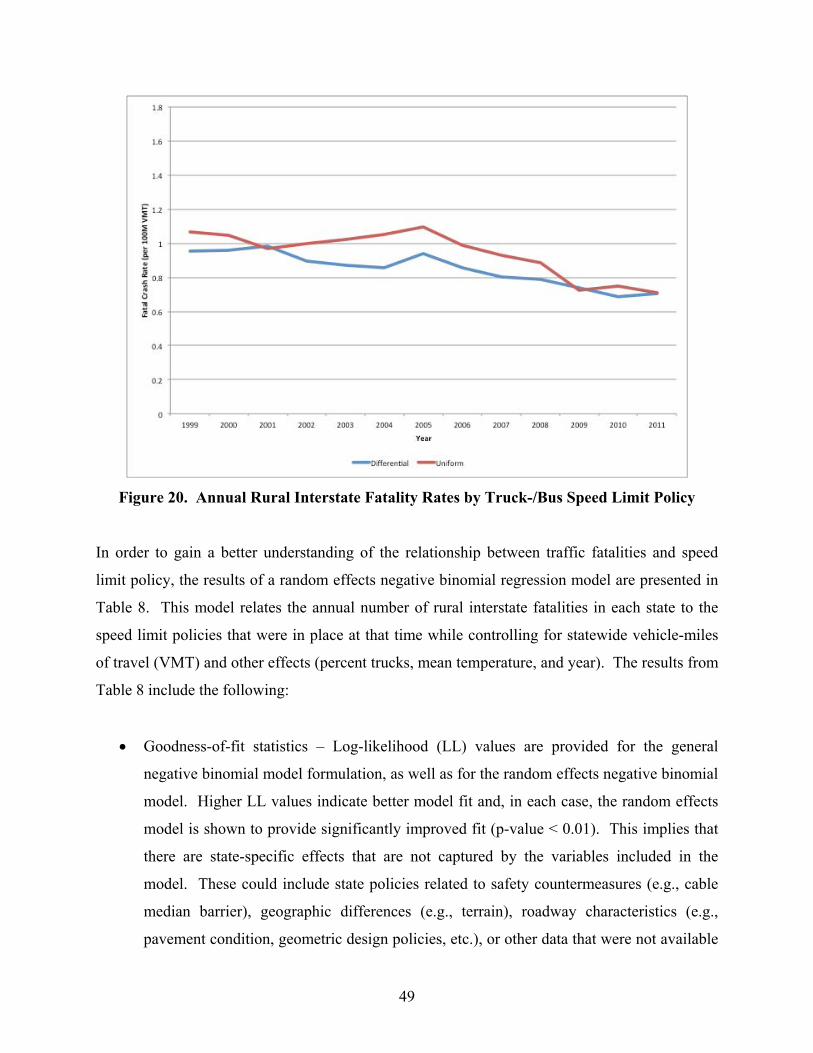
49
Figure 20. Annual Rural Interstate Fatality Rates by Truck-/Bus Speed Limit Policy
In order to gain a better understanding of the relationship between traffic fatalities and speed
limit policy, the results of a random effects negative binomial regression model are presented in
Table 8. This model relates the annual number of rural interstate fatalities in each state to the
speed limit policies that were in place at that time while controlling for statewide vehicle-miles
of travel (VMT) and other effects (percent trucks, mean temperature, and year). The results from
Table 8 include the following:
Goodness-of-fit statistics – Log-likelihood (LL) values are provided for the general
negative binomial model formulation, as well as for the random effects negative binomial
model. Higher LL values indicate better model fit and, in each case, the random effects
model is shown to provide significantly improved fit (p-value < 0.01). This implies that
there are state-specific effects that are not captured by the variables included in the
model. These could include state policies related to safety countermeasures (e.g., cable
median barrier), geographic differences (e.g., terrain), roadway characteristics (e.g.,
pavement condition, geometric design policies, etc.), or other data that were not available

50
for all states. This is an important point because the failure to account for the resultant
correlation in fatality trends within a state would potentially lead to biased parameter
estimates and incorrect inferences. In addition to the LL statistics, McFadden’s R-
squared is also provided as a basis for comparing model fit.
Predictor variables – Explanatory variables were retained if they were statistically
significant at a 95-percent confidence level. The model results include parameter
estimates, standard errors, t-statistics, and p-values for each such variable. When
interpreting these results, a positive coefficient indicates that fatalities tended to increase
as the related variable was increased. Conversely, variables with negative coefficients
experienced fewer fatalities on average.
Table 8. Model Results for Annual Rural Interstate Fatalities Log-likelihood values at convergence: McFadden R2
Negative binomial (NB) model -2362.213 0.804
Random effects NB model -2201.704 0.817
Variable Coefficient Std. Error T-stat P-value
Constant -4.058 0.475 -8.55 <0.0001
LN (VMT) 0.766 0.044 17.21 <0.0001
Percent Trucks 0.018 0.006 3.13 0.0018
70-mph Maximum Speed (1 if yes; 0 otherwise) 0.270 0.063 4.27 <0.0001
75-80 mph Maximum Speed (1 if yes; 0 otherwise) 0.432 0.079 5.49 <0.0001
Mean Temperature (degrees F) 0.012 0.004 2.81 0.0050
Study Year (1999 as baseline) -0.034 0.002 -16.90 <0.0001
a (beta distribution parameter) 17.257 4.310 4.00 0.0001
b (beta distribution parameter) 19.373 5.214 3.72 0.0002
In the case of the rural interstates, fatalities were found to consistently increase with the
maximum posted passenger car speed limit. The increase in fatalities from 60-65 mph to 70 mph
is more pronounced than the increase from 70 to 75 mph, particularly at higher traffic volumes.
In addition to analyzing trends in total traffic fatalities, additional analyses were conducted on
truck/bus-involved fatal crashes to ascertain any relationship to speed limit policies. Results of a
regression model for these types of crashes are shown in Table 9. The results show that
truck/bus fatal crashes also increase with maximum speed limit at similar rates to total fatal
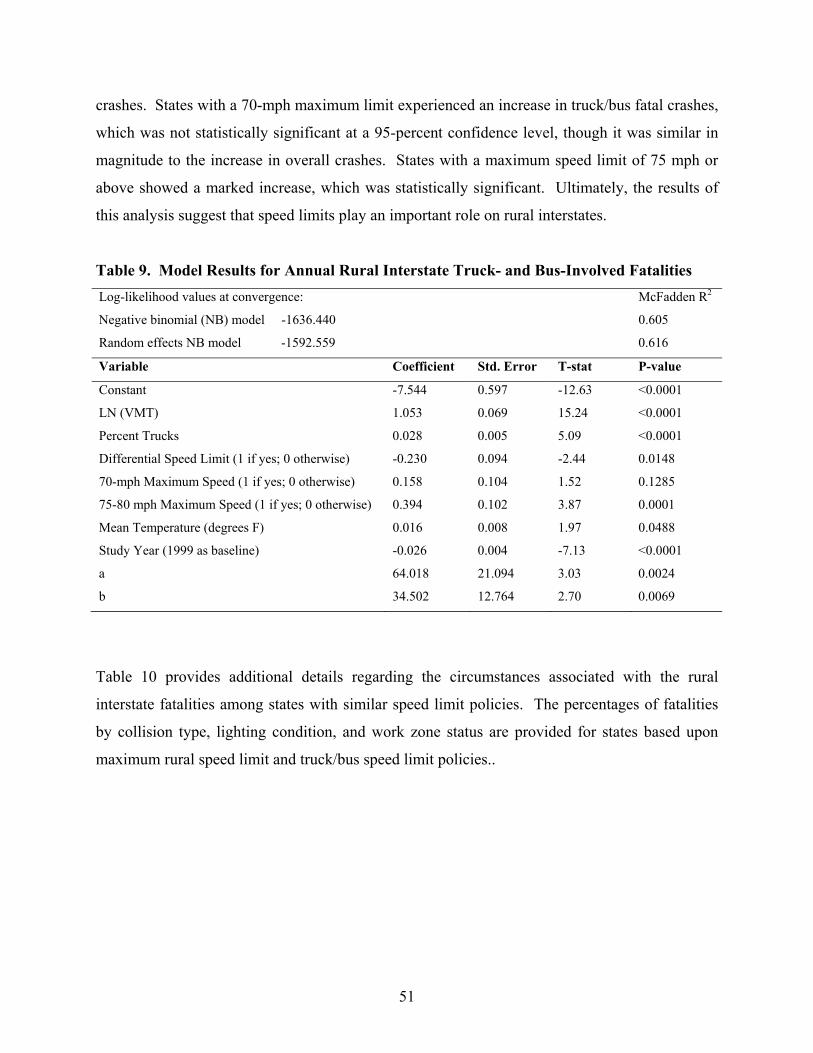
51
crashes. States with a 70-mph maximum limit experienced an increase in truck/bus fatal crashes,
which was not statistically significant at a 95-percent confidence level, though it was similar in
magnitude to the increase in overall crashes. States with a maximum speed limit of 75 mph or
above showed a marked increase, which was statistically significant. Ultimately, the results of
this analysis suggest that speed limits play an important role on rural interstates.
Table 9. Model Results for Annual Rural Interstate Truck- and Bus-Involved Fatalities
Log-likelihood values at convergence: McFadden R2
Negative binomial (NB) model -1636.440 0.605
Random effects NB model -1592.559 0.616
Variable Coefficient Std. Error T-stat P-value
Constant -7.544 0.597 -12.63 <0.0001
LN (VMT) 1.053 0.069 15.24 <0.0001
Percent Trucks 0.028 0.005 5.09 <0.0001
Differential Speed Limit (1 if yes; 0 otherwise) -0.230 0.094 -2.44 0.0148
70-mph Maximum Speed (1 if yes; 0 otherwise) 0.158 0.104 1.52 0.1285
75-80 mph Maximum Speed (1 if yes; 0 otherwise) 0.394 0.102 3.87 0.0001
Mean Temperature (degrees F) 0.016 0.008 1.97 0.0488
Study Year (1999 as baseline) -0.026 0.004 -7.13 <0.0001
a 64.018 21.094 3.03 0.0024
b 34.502 12.764 2.70 0.0069
Table 10 provides additional details regarding the circumstances associated with the rural
interstate fatalities among states with similar speed limit policies. The percentages of fatalities
by collision type, lighting condition, and work zone status are provided for states based upon
maximum rural speed limit and truck/bus speed limit policies..
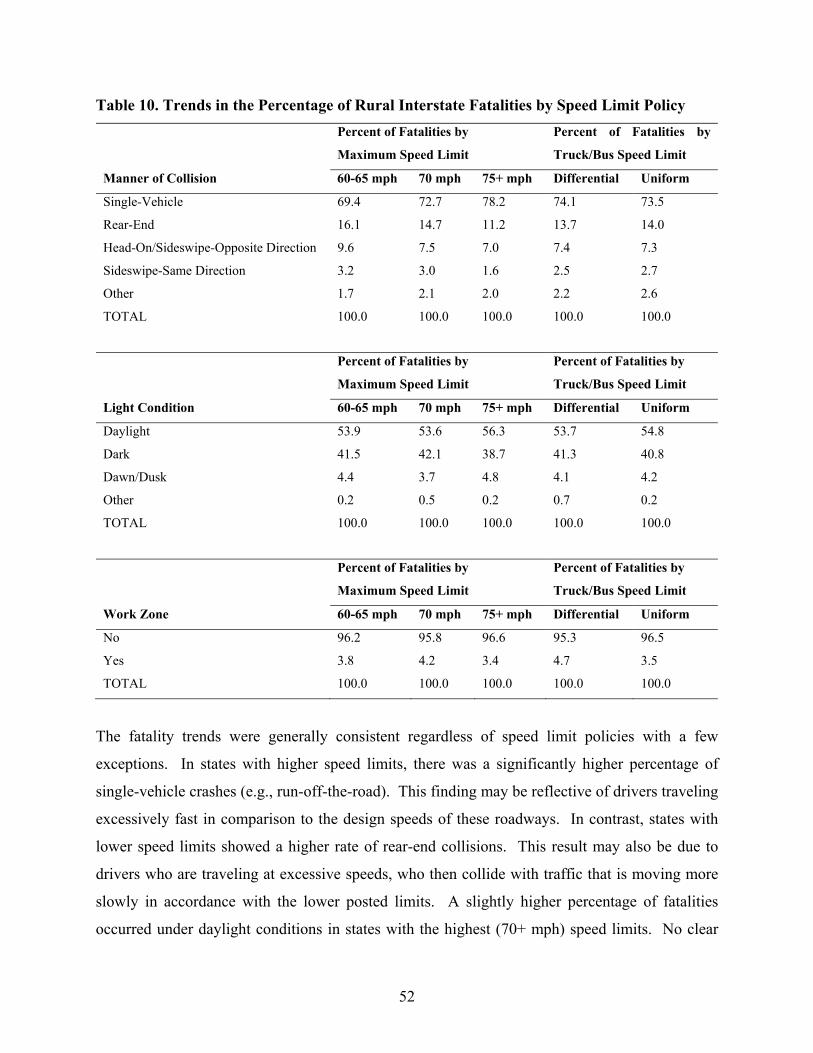
52
Table 10. Trends in the Percentage of Rural Interstate Fatalities by Speed Limit Policy
Percent of Fatalities by
Maximum Speed Limit
Percent of Fatalities by
Truck/Bus Speed Limit
Manner of Collision 60-65 mph 70 mph 75+ mph Differential Uniform
Single-Vehicle 69.4 72.7 78.2 74.1 73.5
Rear-End 16.1 14.7 11.2 13.7 14.0
Head-On/Sideswipe-Opposite Direction 9.6 7.5 7.0 7.4 7.3
Sideswipe-Same Direction 3.2 3.0 1.6 2.5 2.7
Other 1.7 2.1 2.0 2.2 2.6
TOTAL 100.0 100.0 100.0 100.0 100.0
Percent of Fatalities by
Maximum Speed Limit
Percent of Fatalities by
Truck/Bus Speed Limit
Light Condition 60-65 mph 70 mph 75+ mph Differential Uniform
Daylight 53.9 53.6 56.3 53.7 54.8
Dark 41.5 42.1 38.7 41.3 40.8
Dawn/Dusk 4.4 3.7 4.8 4.1 4.2
Other 0.2 0.5 0.2 0.7 0.2
TOTAL 100.0 100.0 100.0 100.0 100.0
Percent of Fatalities by
Maximum Speed Limit
Percent of Fatalities by
Truck/Bus Speed Limit
Work Zone 60-65 mph 70 mph 75+ mph Differential Uniform
No 96.2 95.8 96.6 95.3 96.5
Yes 3.8 4.2 3.4 4.7 3.5
TOTAL 100.0 100.0 100.0 100.0 100.0
The fatality trends were generally consistent regardless of speed limit policies with a few
exceptions. In states with higher speed limits, there was a significantly higher percentage of
single-vehicle crashes (e.g., run-off-the-road). This finding may be reflective of drivers traveling
excessively fast in comparison to the design speeds of these roadways. In contrast, states with
lower speed limits showed a higher rate of rear-end collisions. This result may also be due to
drivers who are traveling at excessive speeds, who then collide with traffic that is moving more
slowly in accordance with the lower posted limits. A slightly higher percentage of fatalities
occurred under daylight conditions in states with the highest (70+ mph) speed limits. No clear

53
trends emerged with respect to work zone related crashes and maximum speed limit policy.
There were also no significant trends that emerged between states with uniform and differential
limits.
Analysis Results – Urban Interstate Highways
In contrast to rural interstates, maximum speed limits were not found to have a significant impact
on urban interstate fatalities, at least at the aggregate level. Figure 21 shows average urban
interstate fatality trends over the same 13-year period (1999 through 2011), aggregated by the
maximum urban speed limit. Examining data for all 50 states (and the District of Columbia)
appears to indicate that states with a 70 or 75 mph limit have a higher fatality rate than those
states with limits of 65 mph or less. However, this result is driven largely by data for the state of
Texas. Removal of Texas from the dataset shows a much less pronounced difference,
particularly for the period from 2005 through 2011.
Figure 21a. Urban Fatality Rates including Texas

54
Figure 21b. Urban Fatality Rates excluding Texas
Figure 21. Annual Urban Interstate Fatality Rates by Maximum Speed Limit
Figure 22 provides a summary of fatality trends with respect to the truck/bus speed limit policies
that were in place in each state. In contrast to the rural facilities, the aggregate data show states
with differential limits to exhibit slightly higher fatality rates over the study period. However, as
in the case of maximum speed limits, this difference is driven almost entirely by the state of
Texas. Removing Texas from the sample results in fatality rates that are virtually
indistinguishable between those states with uniform and differential limits.
Table 11 provides the results of the random effects negative binomial regression model for urban
interstates. Consistent with the aggregate trends shown in Figures 21 and 22, maximum urban
speed limits were not found to exhibit significant differences in fatality trends. There was also
no significant difference in fatality rates between those states with uniform and differential limits
for trucks and buses. This was true regardless of whether Texas was included in the sample.
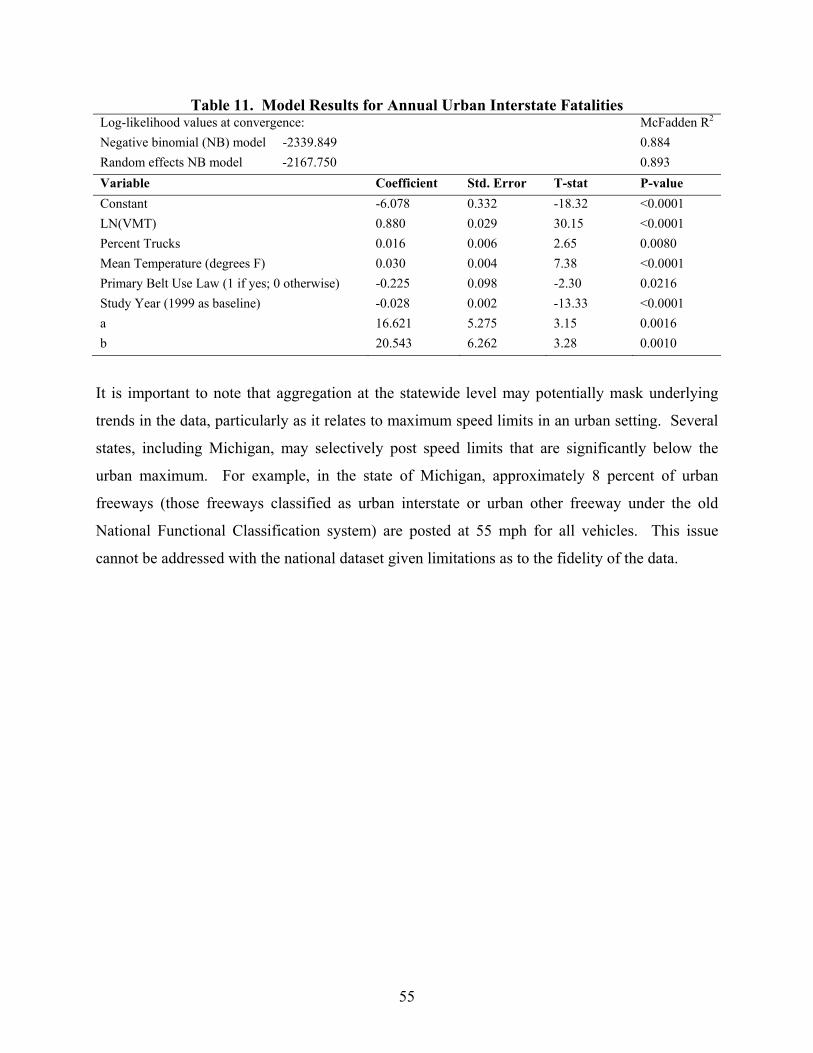
55
Table 11. Model Results for Annual Urban Interstate Fatalities Log-likelihood values at convergence: McFadden R2
Negative binomial (NB) model -2339.849 0.884
Random effects NB model -2167.750 0.893
Variable Coefficient Std. Error T-stat P-value
Constant -6.078 0.332 -18.32 <0.0001
LN(VMT) 0.880 0.029 30.15 <0.0001
Percent Trucks 0.016 0.006 2.65 0.0080
Mean Temperature (degrees F) 0.030 0.004 7.38 <0.0001
Primary Belt Use Law (1 if yes; 0 otherwise) -0.225 0.098 -2.30 0.0216
Study Year (1999 as baseline) -0.028 0.002 -13.33 <0.0001
a 16.621 5.275 3.15 0.0016
b 20.543 6.262 3.28 0.0010
It is important to note that aggregation at the statewide level may potentially mask underlying
trends in the data, particularly as it relates to maximum speed limits in an urban setting. Several
states, including Michigan, may selectively post speed limits that are significantly below the
urban maximum. For example, in the state of Michigan, approximately 8 percent of urban
freeways (those freeways classified as urban interstate or urban other freeway under the old
National Functional Classification system) are posted at 55 mph for all vehicles. This issue
cannot be addressed with the national dataset given limitations as to the fidelity of the data.

56
Figure 22a. Urban Fatality Rates including Texas
Figure 22b. Urban Fatality Rates excluding Texas
Figure 22. Annual Urban Interstate Fatality Rates by Truck-/Bus Speed Limit Policy
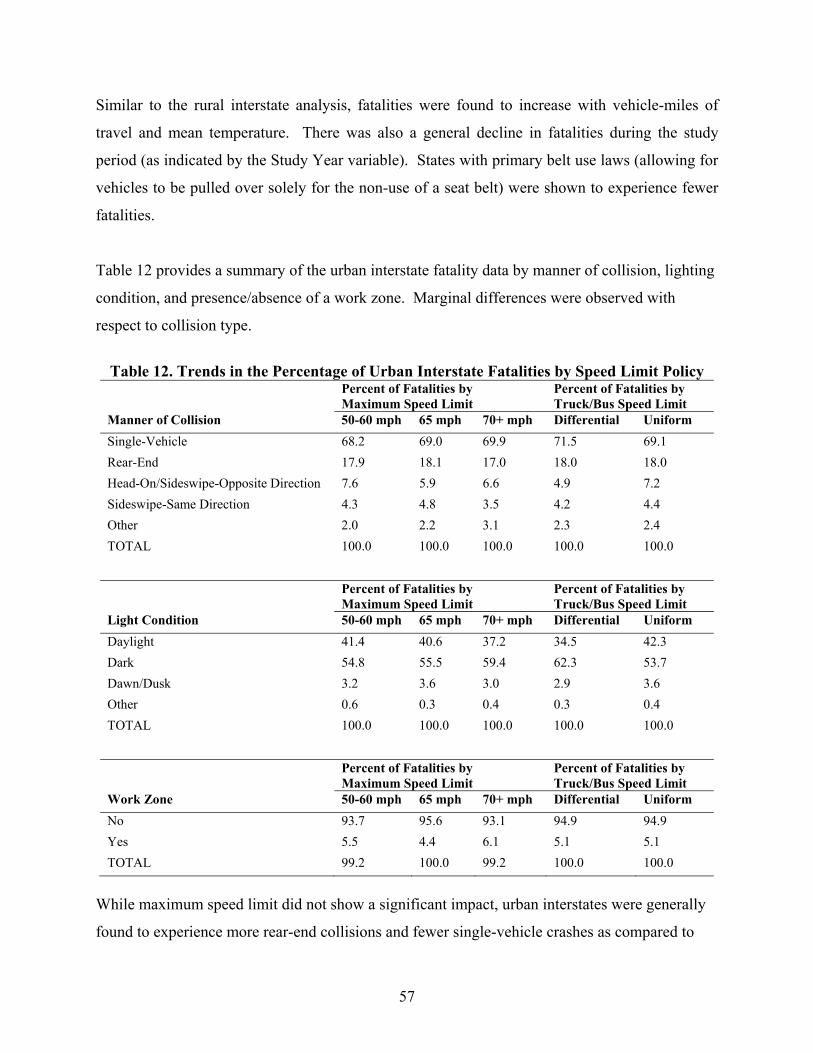
57
Similar to the rural interstate analysis, fatalities were found to increase with vehicle-miles of
travel and mean temperature. There was also a general decline in fatalities during the study
period (as indicated by the Study Year variable). States with primary belt use laws (allowing for
vehicles to be pulled over solely for the non-use of a seat belt) were shown to experience fewer
fatalities.
Table 12 provides a summary of the urban interstate fatality data by manner of collision, lighting
condition, and presence/absence of a work zone. Marginal differences were observed with
respect to collision type.
Table 12. Trends in the Percentage of Urban Interstate Fatalities by Speed Limit Policy Percent of Fatalities by
Maximum Speed Limit Percent of Fatalities by Truck/Bus Speed Limit
Manner of Collision 50-60 mph 65 mph 70+ mph Differential Uniform
Single-Vehicle 68.2 69.0 69.9 71.5 69.1
Rear-End 17.9 18.1 17.0 18.0 18.0
Head-On/Sideswipe-Opposite Direction 7.6 5.9 6.6 4.9 7.2
Sideswipe-Same Direction 4.3 4.8 3.5 4.2 4.4
Other 2.0 2.2 3.1 2.3 2.4
TOTAL 100.0 100.0 100.0 100.0 100.0
Percent of Fatalities by Maximum Speed Limit
Percent of Fatalities by Truck/Bus Speed Limit
Light Condition 50-60 mph 65 mph 70+ mph Differential Uniform
Daylight 41.4 40.6 37.2 34.5 42.3
Dark 54.8 55.5 59.4 62.3 53.7
Dawn/Dusk 3.2 3.6 3.0 2.9 3.6
Other 0.6 0.3 0.4 0.3 0.4
TOTAL 100.0 100.0 100.0 100.0 100.0
Percent of Fatalities by Maximum Speed Limit
Percent of Fatalities by Truck/Bus Speed Limit
Work Zone 50-60 mph 65 mph 70+ mph Differential Uniform
No 93.7 95.6 93.1 94.9 94.9
Yes 5.5 4.4 6.1 5.1 5.1
TOTAL 99.2 100.0 99.2 100.0 100.0
While maximum speed limit did not show a significant impact, urban interstates were generally
found to experience more rear-end collisions and fewer single-vehicle crashes as compared to
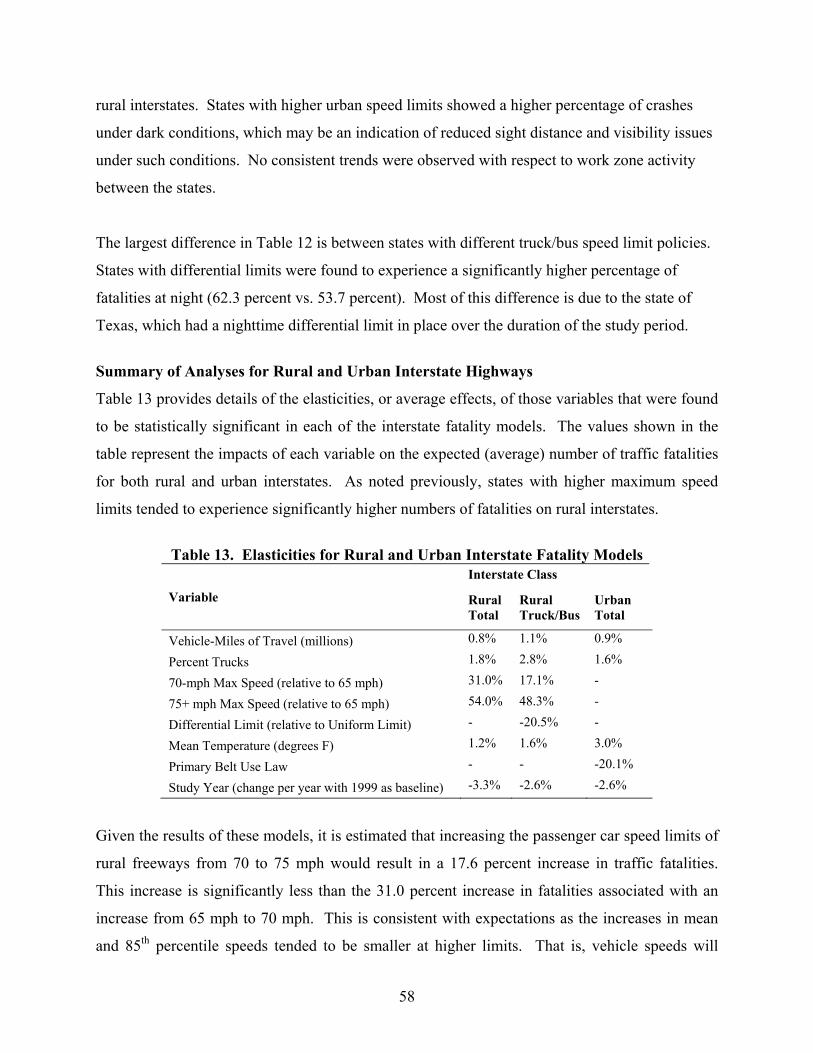
58
rural interstates. States with higher urban speed limits showed a higher percentage of crashes
under dark conditions, which may be an indication of reduced sight distance and visibility issues
under such conditions. No consistent trends were observed with respect to work zone activity
between the states.
The largest difference in Table 12 is between states with different truck/bus speed limit policies.
States with differential limits were found to experience a significantly higher percentage of
fatalities at night (62.3 percent vs. 53.7 percent). Most of this difference is due to the state of
Texas, which had a nighttime differential limit in place over the duration of the study period.
Summary of Analyses for Rural and Urban Interstate Highways
Table 13 provides details of the elasticities, or average effects, of those variables that were found
to be statistically significant in each of the interstate fatality models. The values shown in the
table represent the impacts of each variable on the expected (average) number of traffic fatalities
for both rural and urban interstates. As noted previously, states with higher maximum speed
limits tended to experience significantly higher numbers of fatalities on rural interstates.
Table 13. Elasticities for Rural and Urban Interstate Fatality Models
Variable
Interstate Class
Rural Total
Rural Truck/Bus
Urban Total
Vehicle-Miles of Travel (millions) 0.8% 1.1% 0.9%
Percent Trucks 1.8% 2.8% 1.6%
70-mph Max Speed (relative to 65 mph) 31.0% 17.1% -
75+ mph Max Speed (relative to 65 mph) 54.0% 48.3% -
Differential Limit (relative to Uniform Limit) - -20.5% -
Mean Temperature (degrees F) 1.2% 1.6% 3.0%
Primary Belt Use Law - - -20.1%
Study Year (change per year with 1999 as baseline) -3.3% -2.6% -2.6%
Given the results of these models, it is estimated that increasing the passenger car speed limits of
rural freeways from 70 to 75 mph would result in a 17.6 percent increase in traffic fatalities.
This increase is significantly less than the 31.0 percent increase in fatalities associated with an
increase from 65 mph to 70 mph. This is consistent with expectations as the increases in mean
and 85th percentile speeds tended to be smaller at higher limits. That is, vehicle speeds will

59
increase by a larger amount when speed limits are raised from 65 to 70 mph than from 70 to 75
mph. By this same rational, it is estimated that increasing rural speed limits to 80 mph would
result in an additional incremental increase in fatalities of approximately 10.0 percent. On
average, states with differential speed limits for trucks and buses experienced 20.5 percent fewer
truck/bus-involved fatal crashes on rural interstates. No significant differences were observed on
urban interstates for any of the speed limit policy variables.
With respect to the other variables of interest, fatalities were consistently higher in states with
higher average temperatures. This is likely capturing the effects of some nuances of driving
behavior in such states. Prior research has shown fatality rates to be lower in winter months and
under adverse weather conditions, which is likely to be attributable to lower travel speeds under
such conditions. States with a primary seat belt use law, which allows for motorists to be pulled
over and cited solely for non-belt use, exhibited significantly lower fatality rates on urban
interstates. While the belt use law variable was not significant in the other three models, this is
due in part to the correlation in belt use and year of the study because use rates have been
increasing consistently over time.
Several alternate model formulations were evaluated, which included factors such as gasoline
cost and mean household income. However, a model including only the temporal variable (i.e.,
year of analysis minus 1999) provided significantly improved fit and rendered these other
variables (e.g., gas cost, belt use, etc.) statistically insignificant. It should also be noted that
indicator variables were included to examine whether those states with speed limit changes
during the study period exhibited any general fatality trends. However, the fatality rates in these
states were not significantly different from those states that did not implement speed limit
increases.
ANALYSIS OF MICHIGAN FREEWAY CRASH DATA
The results of the longitudinal analysis of interstate fatality data presented previously revealed
some significant trends with respect to state speed limit policies. On rural roadways, fatalities
were shown to consistently increase at higher speeds, particularly at 75 mph or above. However,
on urban interstates, no significant differences were observed based upon maximum speed limits.
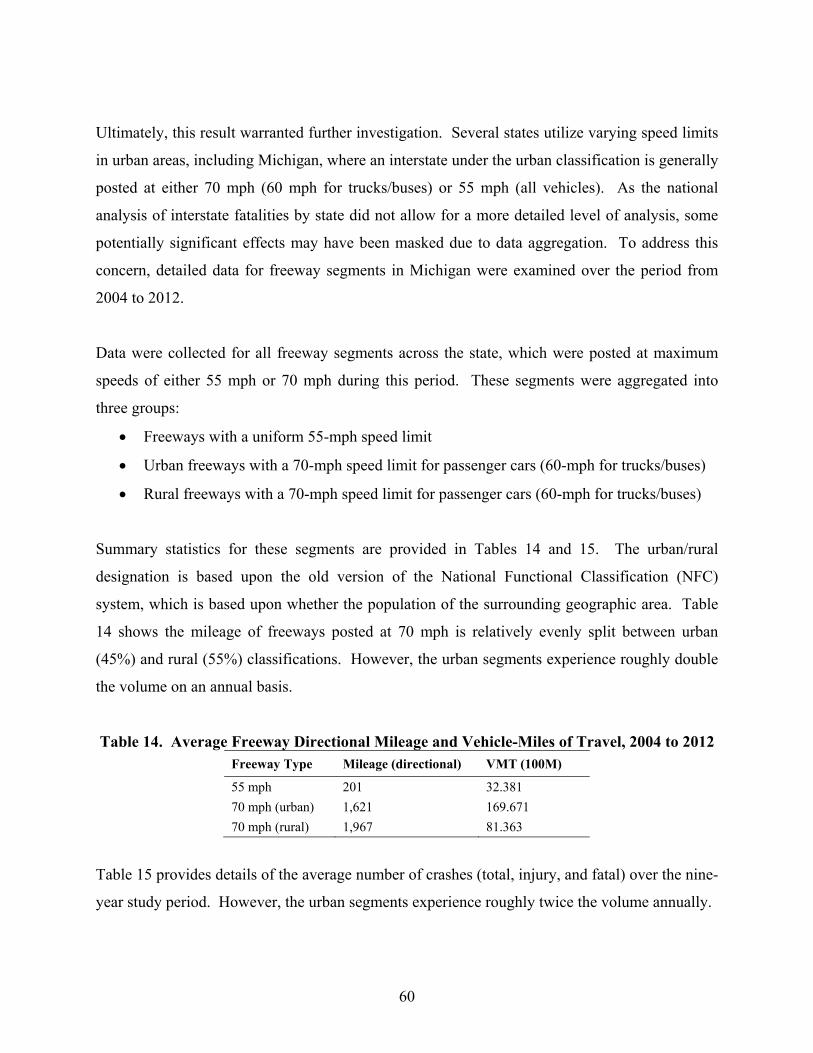
60
Ultimately, this result warranted further investigation. Several states utilize varying speed limits
in urban areas, including Michigan, where an interstate under the urban classification is generally
posted at either 70 mph (60 mph for trucks/buses) or 55 mph (all vehicles). As the national
analysis of interstate fatalities by state did not allow for a more detailed level of analysis, some
potentially significant effects may have been masked due to data aggregation. To address this
concern, detailed data for freeway segments in Michigan were examined over the period from
2004 to 2012.
Data were collected for all freeway segments across the state, which were posted at maximum
speeds of either 55 mph or 70 mph during this period. These segments were aggregated into
three groups:
Freeways with a uniform 55-mph speed limit
Urban freeways with a 70-mph speed limit for passenger cars (60-mph for trucks/buses)
Rural freeways with a 70-mph speed limit for passenger cars (60-mph for trucks/buses)
Summary statistics for these segments are provided in Tables 14 and 15. The urban/rural
designation is based upon the old version of the National Functional Classification (NFC)
system, which is based upon whether the population of the surrounding geographic area. Table
14 shows the mileage of freeways posted at 70 mph is relatively evenly split between urban
(45%) and rural (55%) classifications. However, the urban segments experience roughly double
the volume on an annual basis.
Table 14. Average Freeway Directional Mileage and Vehicle-Miles of Travel, 2004 to 2012 Freeway Type Mileage (directional) VMT (100M)
55 mph 201 32.381
70 mph (urban) 1,621 169.671
70 mph (rural) 1,967 81.363
Table 15 provides details of the average number of crashes (total, injury, and fatal) over the nine-
year study period. However, the urban segments experience roughly twice the volume annually.
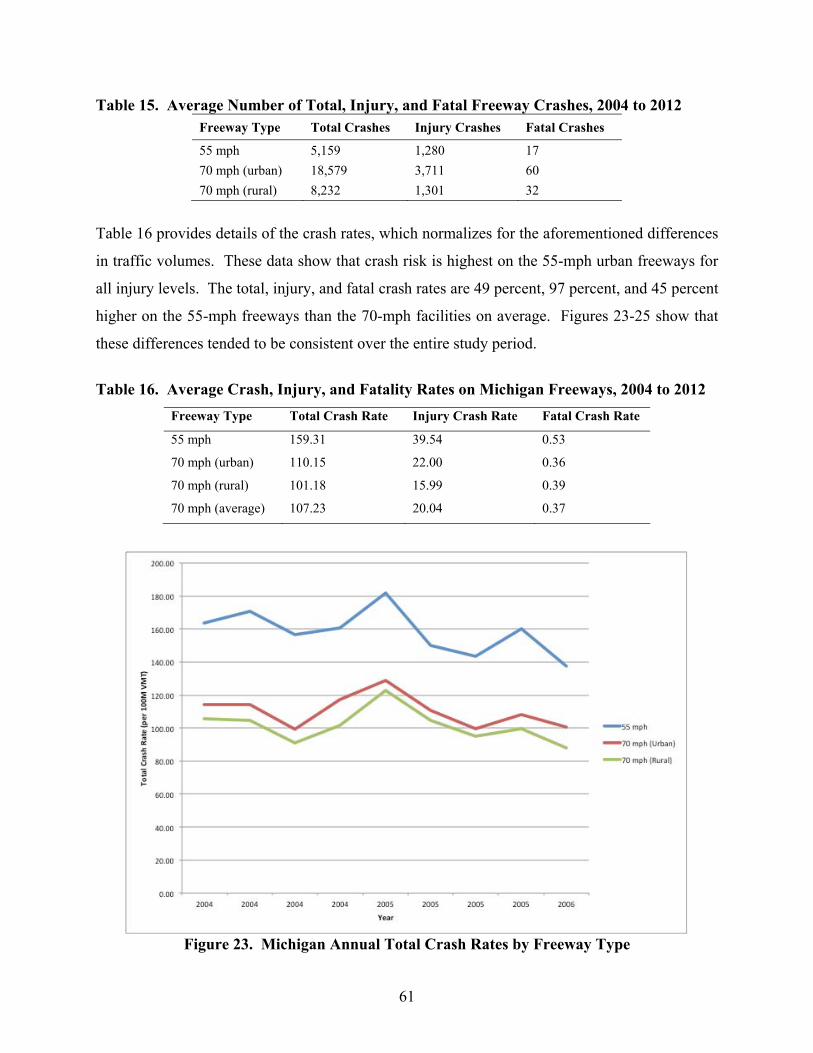
61
Table 15. Average Number of Total, Injury, and Fatal Freeway Crashes, 2004 to 2012 Freeway Type Total Crashes Injury Crashes Fatal Crashes
55 mph 5,159 1,280 17
70 mph (urban) 18,579 3,711 60
70 mph (rural) 8,232 1,301 32
Table 16 provides details of the crash rates, which normalizes for the aforementioned differences
in traffic volumes. These data show that crash risk is highest on the 55-mph urban freeways for
all injury levels. The total, injury, and fatal crash rates are 49 percent, 97 percent, and 45 percent
higher on the 55-mph freeways than the 70-mph facilities on average. Figures 23-25 show that
these differences tended to be consistent over the entire study period.
Table 16. Average Crash, Injury, and Fatality Rates on Michigan Freeways, 2004 to 2012
Freeway Type Total Crash Rate Injury Crash Rate Fatal Crash Rate
55 mph 159.31 39.54 0.53
70 mph (urban) 110.15 22.00 0.36
70 mph (rural) 101.18 15.99 0.39
70 mph (average) 107.23 20.04 0.37
Figure 23. Michigan Annual Total Crash Rates by Freeway Type
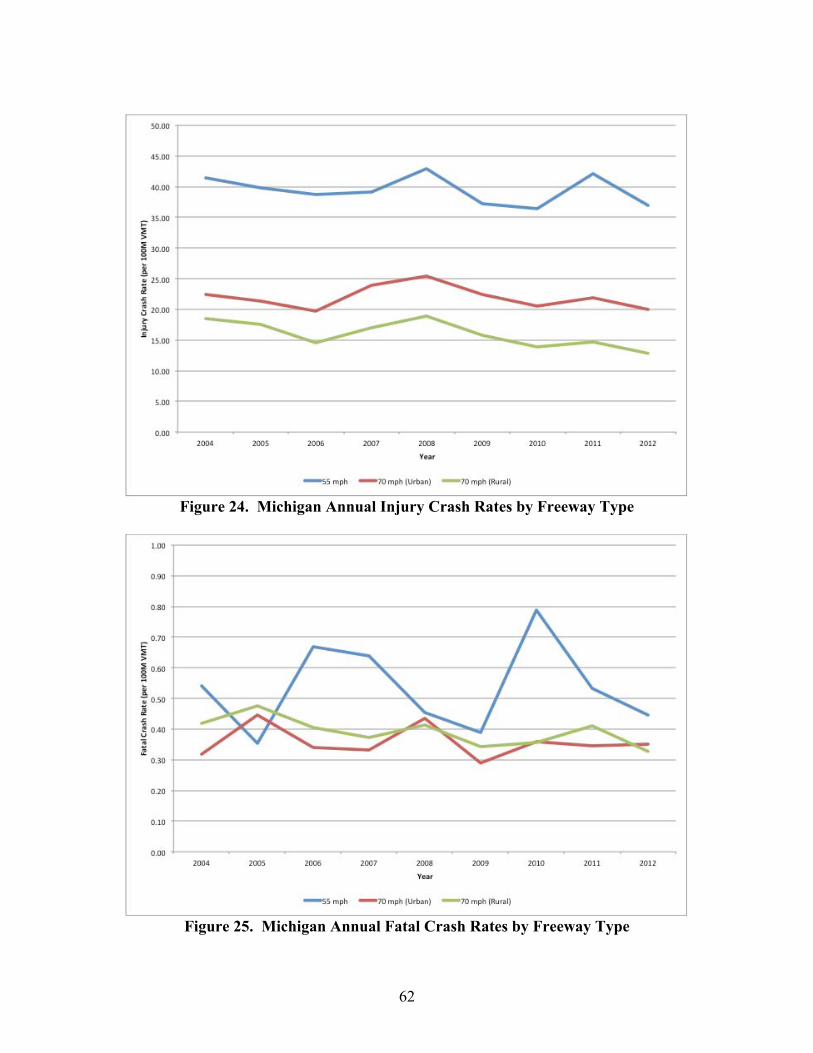
62
Figure 24. Michigan Annual Injury Crash Rates by Freeway Type
Figure 25. Michigan Annual Fatal Crash Rates by Freeway Type

63
There are several potential explanations for the higher rates on the 55-mph segments. These
segments are generally more urban in nature and include more frequent entry/exit ramps,
weaving behavior, and stop-and-go traffic. This likely explains why the urban 70-mph segments
exhibit higher crash rates than comparable rural segments.
The urban segments that are posted at 55-mph also tend to be older in nature and have generally
been designed for lower speeds, which is one of the principal determinants in establishing speed
limits. Despite the fact that these segments have lower design speeds, field speed studies
(described further in Chapter 4) show that mean speeds on the 55-mph segments are only 7 mph
lower than the 70-mph urban segments and the 85th percentile speeds are only 3-4 mph lower,
despite the 15-mph difference in posted limits. Furthermore, the 55-mph urban segments
exhibited variations in travel speeds that were significantly higher than those urban segments that
were posted at 70-mph.
These data suggest that increasing the speed limits of the 55-mph segments to 70-mph may
potentially reduce the rate of total, injury, and fatal crashes. However, it is imperative to note
that such increases would also require substantial infrastructure investments in order to bring
these 55-mph segments up to the same design standard as the 70-mph segments. In order to
investigate this issue further, additional analyses were conducted to assess safety performance at
a select group of urban freeways where speed limits were increased during the period from 2004
to 2012.
The passage of Michigan House Bill 5240 (Public Act 85) in 2006 mandated a freeway speed
limit of 70 mph for cars and 60 mph for trucks and buses unless it was determined that such
speeds were greater than reasonable or safe for a particular section of freeway. The mandate
included urban freeways, and consequently led to statewide speed limit increases on several
sections of urban freeways that had previously been posted at 55 or 65 mph.
To determine the safety impacts of recent speed limit increases on urban freeways in Michigan, a
case-control analysis of traffic crashes was performed. Of particular interest was the impact on
total, injury, and fatal crashes associated with increasing the speed limit from 55 mph to either 65
64
or 70 mph. Increasing the maximum urban freeway speed limit also introduced a differential
speed limit between cars and trucks/buses, the latter of which have been capped at 60 mph on
freeways since 2006. Thus, it was also important to investigate the impacts of the urban freeway
speed limit increase on truck/bus crashes.
It was first necessary to identify the sample of urban segments where speed limits were increased
from 55 mph for all vehicles to 65 mph or 70 mph for passenger vehicles (and 60 mph for
trucks/buses), as well as a sample of similar comparison segments where 70 mph/60 mph speed
limits were already in place. These segments were identified as follows:
Segments with an Increase: Urban freeway locations where the maximum speed limit
was increased from 55 mph to either 65 or 70 mph between 2007 and 2010. Note that the
truck/bus speed limit was capped at 60 mph on freeways after the change.
Comparison Segments: Urban freeway locations immediately adjacent to the treatment
segments with a maximum speed limit of 65 or 70 mph from 2004 to 2012. Note that the
truck/bus speed limit was increased from 55 to 60 mph on freeways statewide in 2006.
Segments where speed limits were increased were identified through a review of the 2004 to
2012 MDOT sufficiency files. The year in which the speed limit change occurred for each such
segment, along with the boundaries corresponding to each speed limit increase, was validated
through a review of traffic crash reports and archived media reports. The boundaries of each
control segment were determined by identifying the immediately adjacent segment(s) that most
closely matched the general roadway alignment and surrounding land use, terminating prior to
any freeway-to-freeway interchanges. Segments were excluded from the evaluation altogether if
reconstruction or other major modification (i.e., lane addition) was performed at approximately
the same time as the speed limit increase, as these modifications would likely affect crash
frequencies. Ultimately, a total of eight suitable segments were identified where limits were
increased, covering 22.72 centerline miles, which were paired with 40.84 centerline miles of
adjacent control segments. Table 17 provides further details of the freeway segments utilized in
the evaluation.
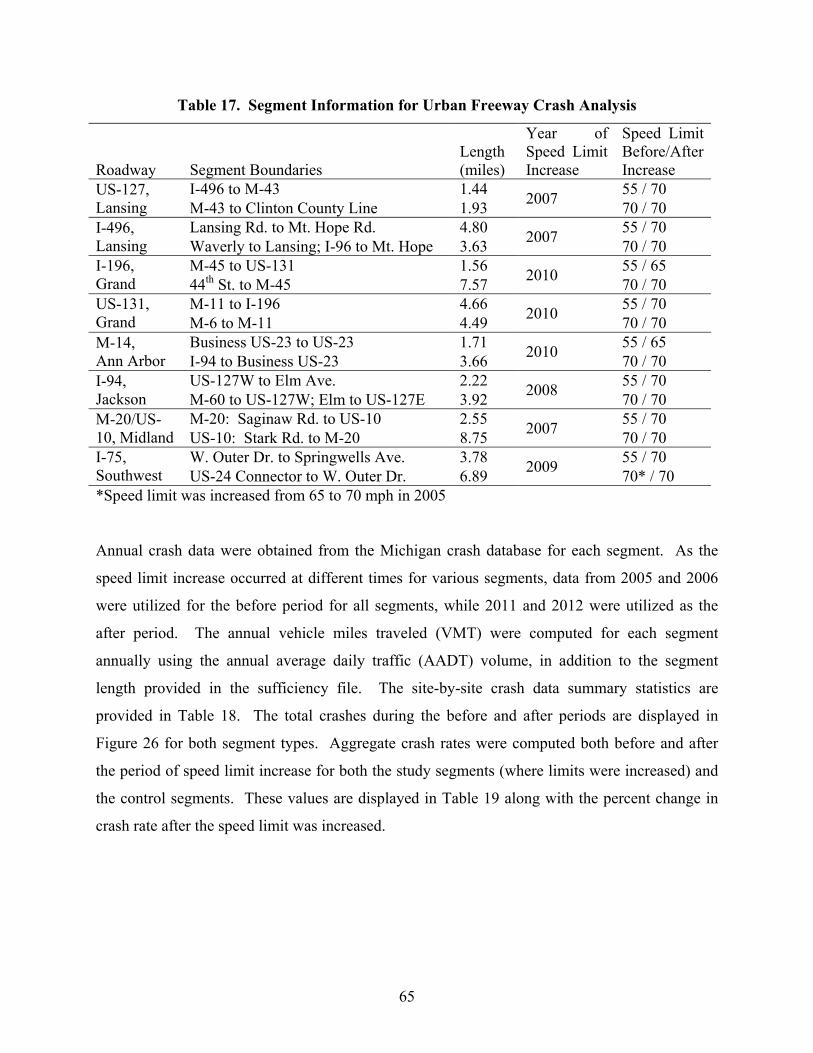
65
Table 17. Segment Information for Urban Freeway Crash Analysis
Roadway Segment Boundaries Length (miles)
Year of Speed Limit Increase
Speed Limit Before/After Increase
US-127, Lansing
I-496 to M-43 1.44 2007
55 / 70 M-43 to Clinton County Line 1.93 70 / 70
I-496, Lansing
Lansing Rd. to Mt. Hope Rd. 4.80 2007
55 / 70 Waverly to Lansing; I-96 to Mt. Hope 3.63 70 / 70
I-196, Grand
M-45 to US-131 1.56 2010
55 / 65 44th St. to M-45 7.57 70 / 70
US-131, Grand
M-11 to I-196 4.66 2010
55 / 70 M-6 to M-11 4.49 70 / 70
M-14, Ann Arbor
Business US-23 to US-23 1.71 2010
55 / 65 I-94 to Business US-23 3.66 70 / 70
I-94, Jackson
US-127W to Elm Ave. 2.22 2008
55 / 70 M-60 to US-127W; Elm to US-127E 3.92 70 / 70
M-20/US-10, Midland
M-20: Saginaw Rd. to US-10 2.55 2007
55 / 70 US-10: Stark Rd. to M-20 8.75 70 / 70
I-75, Southwest
W. Outer Dr. to Springwells Ave. 3.78 2009
55 / 70 US-24 Connector to W. Outer Dr. 6.89 70* / 70
*Speed limit was increased from 65 to 70 mph in 2005
Annual crash data were obtained from the Michigan crash database for each segment. As the
speed limit increase occurred at different times for various segments, data from 2005 and 2006
were utilized for the before period for all segments, while 2011 and 2012 were utilized as the
after period. The annual vehicle miles traveled (VMT) were computed for each segment
annually using the annual average daily traffic (AADT) volume, in addition to the segment
length provided in the sufficiency file. The site-by-site crash data summary statistics are
provided in Table 18. The total crashes during the before and after periods are displayed in
Figure 26 for both segment types. Aggregate crash rates were computed both before and after
the period of speed limit increase for both the study segments (where limits were increased) and
the control segments. These values are displayed in Table 19 along with the percent change in
crash rate after the speed limit was increased.

66
Table 18. Urban Freeway Crashes Before and After Speed Limit Increase, by Site
Roadway Section Period Total Injury Fatal Truck/Bus VMT
I-496/US-127, Lansing
Increase Before 417 96 1 24 275,214,445 After 532 109 2 19 260,577,050
Control Before 366 70 1 23 209,144,234 After 307 63 1 10 188,232,839
I-196, Grand Rapids
Increase Before 256 58 1 12 55,353,984 After 258 61 1 15 78,985,854
Control Before 592 107 3 22 289,460,106 After 443 92 3 12 287,264,281
US-131, Grand Rapids
Increase Before 867 200 1 75 338,625,784 After 947 212 0 36 349,873,917
Control Before 333 77 1 29 240,000,542 After 282 63 0 22 271,020,385
M-14, Ann Arbor
Increase Before 149 30 0 18 70,397,261 After 185 38 0 16 69,831,947
Control Before 96 15 0 8 91,246,224 After 106 21 0 7 89,425,481
I-94, Jackson
Increase Before 113 23 0 32 106,043,779 After 151 21 0 29 98,484,209
Control Before 184 32 0 29 154,346,382 After 145 25 0 14 144,376,298
M-20/US-10, Midland
Increase Before 37 4 0 3 27,365,466 After 52 10 0 1 29,809,086
Control Before 103 12 0 4 123,058,647 After 109 18 1 2 115,053,084
I-75, SW Detroit
Increase Before 405 91 3 102 299,996,019 After 420 112 0 80 261,397,451
Control Before 516 134 2 123 507,164,215 After 493 119 3 96 402,481,184
TOTAL Increase
Before 2244 502 6 266 1,172,996,738After 2545 563 3 196 1,148,959,514
Control Before 2190 447 7 238 1,614,420,350After 1885 401 8 163 1,497,853,552

67
Figure 26. Total Crashes by Period and Segment Type
Table 19. Aggregate Urban Freeway Crash Rates Before and After Speed Limit Increase
Crash Type Section
Rate Before
Rate After Change
Percent Change
Total Increase 191.30 221.50 30.20 15.8% Control 135.65 125.85 -9.81 -7.2%
Injury Increase 42.80 49.00 6.20 14.5% Control 27.69 26.77 -0.92 -3.3%
Fatal Increase 0.51 0.26 -0.25 -49.0% Control 0.43 0.53 0.10 23.2%
Truck/Bus Increase 22.68 17.06 -5.62 -24.8% Control 14.74 10.88 -3.86 -26.2%
Note: Crash rates represent crashes per 100 million VMT.

68
Table 19 presents several important findings. First, the rates for total and injury crashes
increased by 15.8 percent and 14.5 percent, respectively, following the speed limit increases at
these seven study sites. However, total and injury crash rates decreased by 7.2 percent and 3.3
percent, respectively, at the control segments during the same period. Thus, the impact of the
speed limit increases on total and injury crashes is even greater when accounting for the decrease
in crashes at the control segments over the same period.
In contrast, fatal crash rates decreased by 49.0 percent at the treatment segments and increased
by 23.2 percent at the comparison segments. However, these results must be viewed with
caution due to very small samples of fatal crashes. Truck and bus crashes were found to
decrease at both the treatment and comparison segments, by 24.8 percent and 26.2 percent,
respectively, resulting in a negligible net change.
To confirm the statistical validity of the crash rates presented in Table 19, the annual crash data
for both segment types were analyzed using negative binomial regression models. The results of
the model for total crashes and injury crashes are displayed in Table 20. For the total crash
models, the estimates for the “Period” variable confirm that crashes at the treatment segments
increased after the speed limit was increased, while the comparison segments showed a decrease
in total crashes during the same period. Compared to total crashes, the injury crash models
showed slightly different results, as the estimates for “Period” show a marginal increase in injury
crashes at the treatment segments after the speed limit was increased, while the comparison
segments showed only a small decrease in injury crashes during the same period. Models were
also generated for fatal crashes and truck/bus crashes. Although fatal crash occurrence decreased
at the treatment segments and increased at the comparison segments, these changes were not
found to be significant due to the small sample sizes. Similarly, comparison of the changes in
truck/bus crashes between the treatment and comparison segments found no significant
difference between the types of segments.
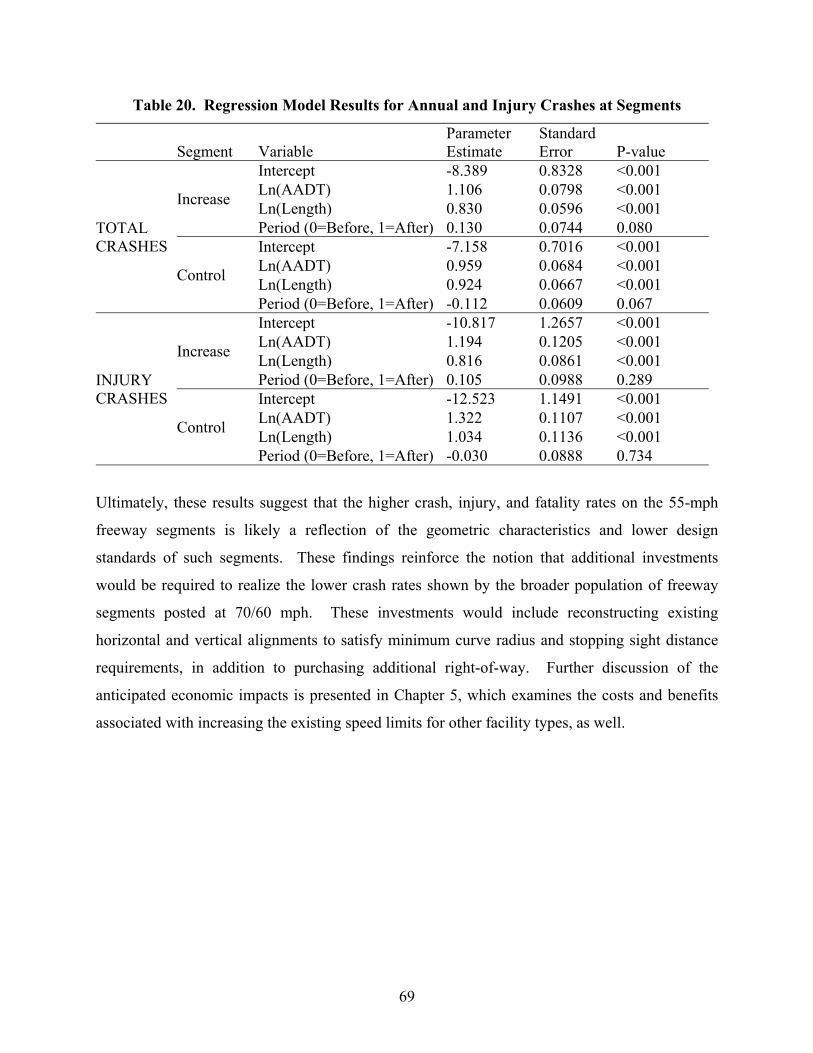
69
Table 20. Regression Model Results for Annual and Injury Crashes at Segments
Segment Variable
Parameter Estimate
Standard Error P-value
TOTAL CRASHES
Increase
Intercept -8.389 0.8328 <0.001 Ln(AADT) 1.106 0.0798 <0.001 Ln(Length) 0.830 0.0596 <0.001 Period (0=Before, 1=After) 0.130 0.0744 0.080
Control
Intercept -7.158 0.7016 <0.001 Ln(AADT) 0.959 0.0684 <0.001 Ln(Length) 0.924 0.0667 <0.001 Period (0=Before, 1=After) -0.112 0.0609 0.067
INJURY CRASHES
Increase
Intercept -10.817 1.2657 <0.001 Ln(AADT) 1.194 0.1205 <0.001 Ln(Length) 0.816 0.0861 <0.001 Period (0=Before, 1=After) 0.105 0.0988 0.289
Control
Intercept -12.523 1.1491 <0.001 Ln(AADT) 1.322 0.1107 <0.001 Ln(Length) 1.034 0.1136 <0.001 Period (0=Before, 1=After) -0.030 0.0888 0.734
Ultimately, these results suggest that the higher crash, injury, and fatality rates on the 55-mph
freeway segments is likely a reflection of the geometric characteristics and lower design
standards of such segments. These findings reinforce the notion that additional investments
would be required to realize the lower crash rates shown by the broader population of freeway
segments posted at 70/60 mph. These investments would include reconstructing existing
horizontal and vertical alignments to satisfy minimum curve radius and stopping sight distance
requirements, in addition to purchasing additional right-of-way. Further discussion of the
anticipated economic impacts is presented in Chapter 5, which examines the costs and benefits
associated with increasing the existing speed limits for other facility types, as well.
70
CHAPTER 4:
ANALYSIS OF FIELD SPEED DATA
While the fatality analysis presented in the preceding chapter provides details of fatality trends at
the national level, a related concern is how speed limit increases may affect travel speeds. The
principal speed measures that have historically been associated with traffic safety are the mean
speed, 85th percentile speed, and speed variance. Prior research has sought to relate these
measures to speed limit policies while controlling for the effects of roadway geometry, traffic
volumes, and other factors. One of the main objectives of this project was to examine the travel
speeds of passenger cars, trucks, and buses in states with differing speed limits, as well as to
determine the effects of differential vs. universal speed limits on travel speeds. Passenger
vehicle and truck/bus spot-speed data were collected from Michigan, as well as the neighboring
states of Ohio and Indiana. Collecting data from these three states proved advantageous for
several reasons:
Ohio and Indiana each share common freeways with Michigan, allowing for an
examination of how truck/bus and overall speeds change while controlling for similar
driving populations.
Ohio has a uniform speed limit, which will allow for an assessment of whether speed
variance is greater in comparison to differential states such as Michigan and Indiana.
Indiana’s differential speed limit is 5 mph lower for trucks/buses than passenger vehicles
whereas Michigan’s differential is 10 mph. Consequently, this study design will also
allow for a determination of how mean speed and speed variance differ with respect to
the magnitude of the differential.
DATA COLLECTION
The full-scale data collection effort took place during the summer/fall of 2013 with rural speed
data being collected from August through September of 2013, and urban speed data being
collected from October through November of 2013. Data collectors would arrive at the pre-
selected overpass of a given freeway and inspect the freeway for items that may affect speeds
such as construction, roadway conditions, curves, or police presence. If the section of freeway
was found to be inadequate, the site would be replaced with another site from a list of potential
back-up sites. Speeds were recorded at appropriate sites from various overpasses on the freeway
71
as vehicles traveled away from the overpass. This was done in an attempt to avoid affecting the
speed of the vehicles, as their speed would likely be influenced if they saw data collectors with
radar equipment. Video cameras were set up in order to record a 10-minute volume in each
direction. Speeds were recorded onto paper either by the radar-gun operator or by an assistant.
The device used for data was a “Pro Radar II” infrared lidar system, which was plugged in to an
external battery pack for increased mobility.
In order to ensure such representativeness, sites were selected from among candidate freeway
segments on the basis of volume data. Sites were selected along flat, tangent segments to reduce
the influence of geometric characteristics (e.g., horizontal and vertical alignment). Once the
speed data were collected, they were aggregated and appropriate sample statistics (e.g., mean
speed, 85th percentile speed, and speed variance) were calculated.
Urban and rural speed data were each collected at 20 sites in Indiana, 20 sites in Ohio, and 40
sites in Michigan; totaling 80 sites of rural speeds and 80 sites of urban speeds. Maps showing
the data collection site locations for Michigan, Indiana, and Ohio can be found in Figure 27. At
each respective site, data were collected in both directions of freeway. The speeds of 100
passenger vehicles and 50 trucks and buses were collected per direction per site. This totals
8,000 passenger vehicles and 4,000 trucks and buses per freeway setting in Michigan and 4,000
passenger vehicles and 2,000 trucks and buses per freeway setting in Indiana and Ohio. If local
lanes, as well as express lanes, were present on the freeway, 50 total vehicle speeds were also
collected on the local portion of the freeway regardless of vehicle type. It should be noted that
speed data were collected during free-flow conditions only.
Once the speed data were collected at all locations, they were aggregated and sample statistics
were calculated for each site including mean speed, 85th percentile speed, and speed standard
deviation separately for passenger vehicles, trucks/buses, and all vehicles combined.
Additionally, the percent of vehicles that were traveling at 5 mph and 10 mph over the speed
limit at a specific site were calculated. The summary of the spot-speed data for Michigan,
Indiana, and Ohio can be found in Appendix Tables 37, 38, and 39, respectively.
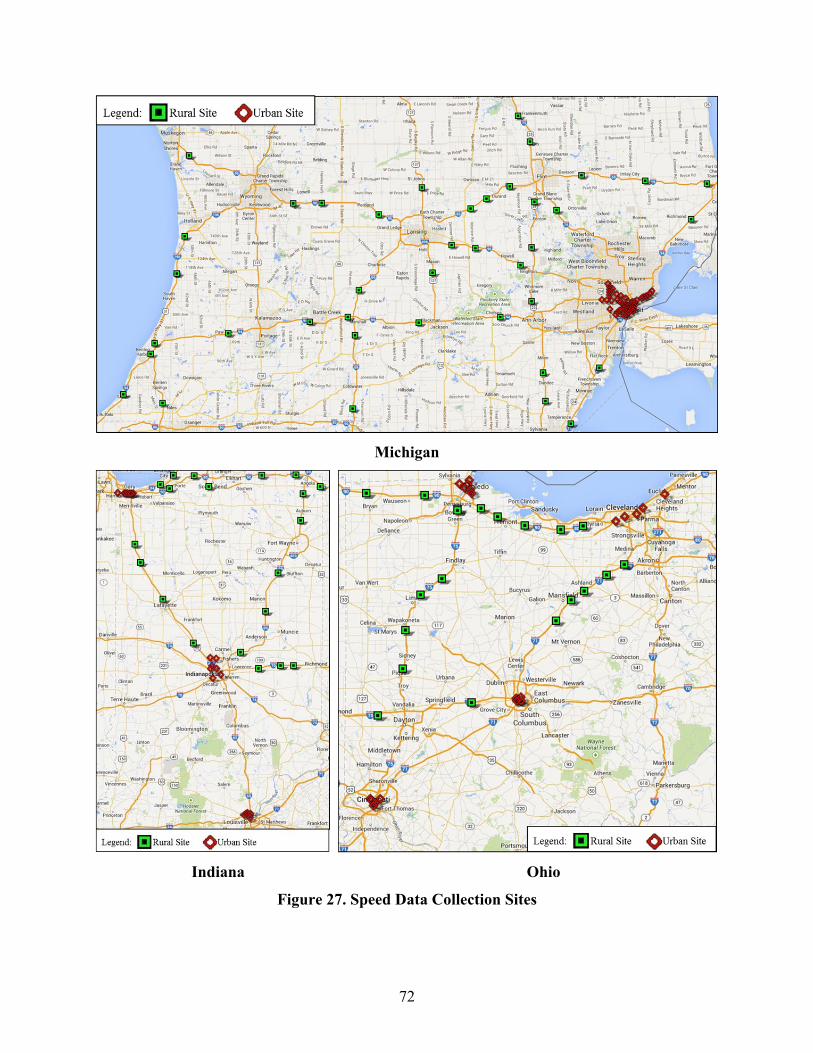
72
Michigan
Indiana Ohio
Figure 27. Speed Data Collection Sites
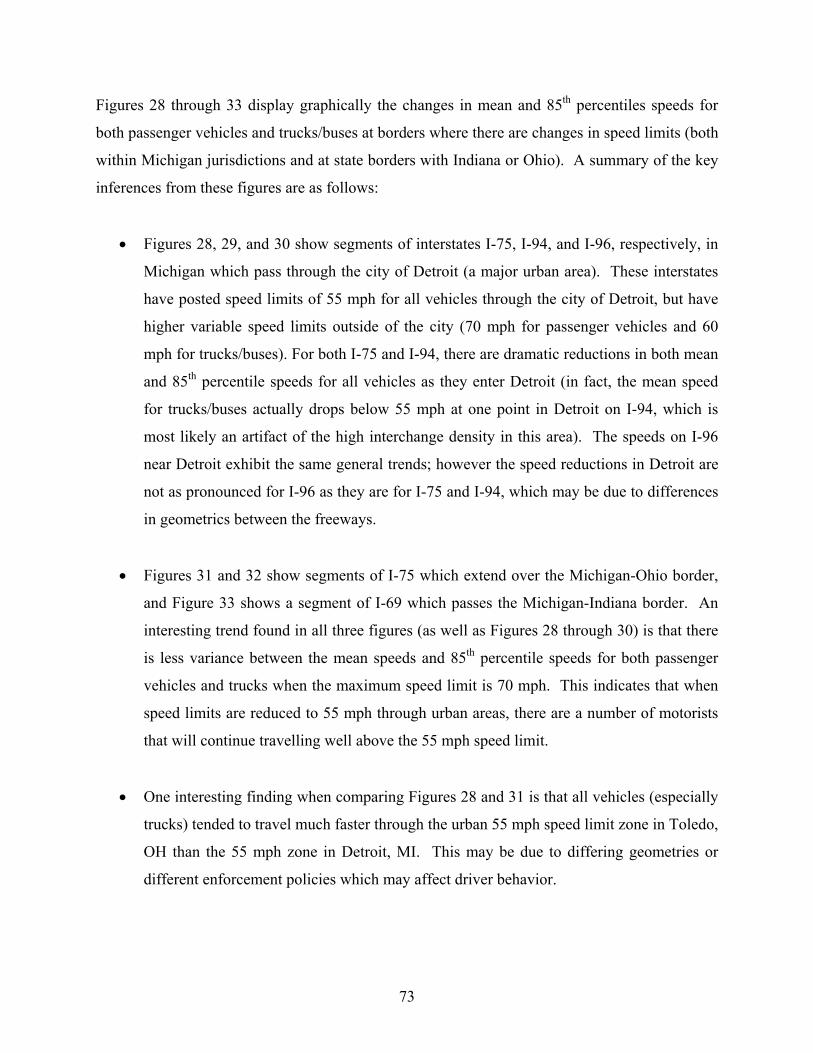
73
Figures 28 through 33 display graphically the changes in mean and 85th percentiles speeds for
both passenger vehicles and trucks/buses at borders where there are changes in speed limits (both
within Michigan jurisdictions and at state borders with Indiana or Ohio). A summary of the key
inferences from these figures are as follows:
Figures 28, 29, and 30 show segments of interstates I-75, I-94, and I-96, respectively, in
Michigan which pass through the city of Detroit (a major urban area). These interstates
have posted speed limits of 55 mph for all vehicles through the city of Detroit, but have
higher variable speed limits outside of the city (70 mph for passenger vehicles and 60
mph for trucks/buses). For both I-75 and I-94, there are dramatic reductions in both mean
and 85th percentile speeds for all vehicles as they enter Detroit (in fact, the mean speed
for trucks/buses actually drops below 55 mph at one point in Detroit on I-94, which is
most likely an artifact of the high interchange density in this area). The speeds on I-96
near Detroit exhibit the same general trends; however the speed reductions in Detroit are
not as pronounced for I-96 as they are for I-75 and I-94, which may be due to differences
in geometrics between the freeways.
Figures 31 and 32 show segments of I-75 which extend over the Michigan-Ohio border,
and Figure 33 shows a segment of I-69 which passes the Michigan-Indiana border. An
interesting trend found in all three figures (as well as Figures 28 through 30) is that there
is less variance between the mean speeds and 85th percentile speeds for both passenger
vehicles and trucks when the maximum speed limit is 70 mph. This indicates that when
speed limits are reduced to 55 mph through urban areas, there are a number of motorists
that will continue travelling well above the 55 mph speed limit.
One interesting finding when comparing Figures 28 and 31 is that all vehicles (especially
trucks) tended to travel much faster through the urban 55 mph speed limit zone in Toledo,
OH than the 55 mph zone in Detroit, MI. This may be due to differing geometries or
different enforcement policies which may affect driver behavior.
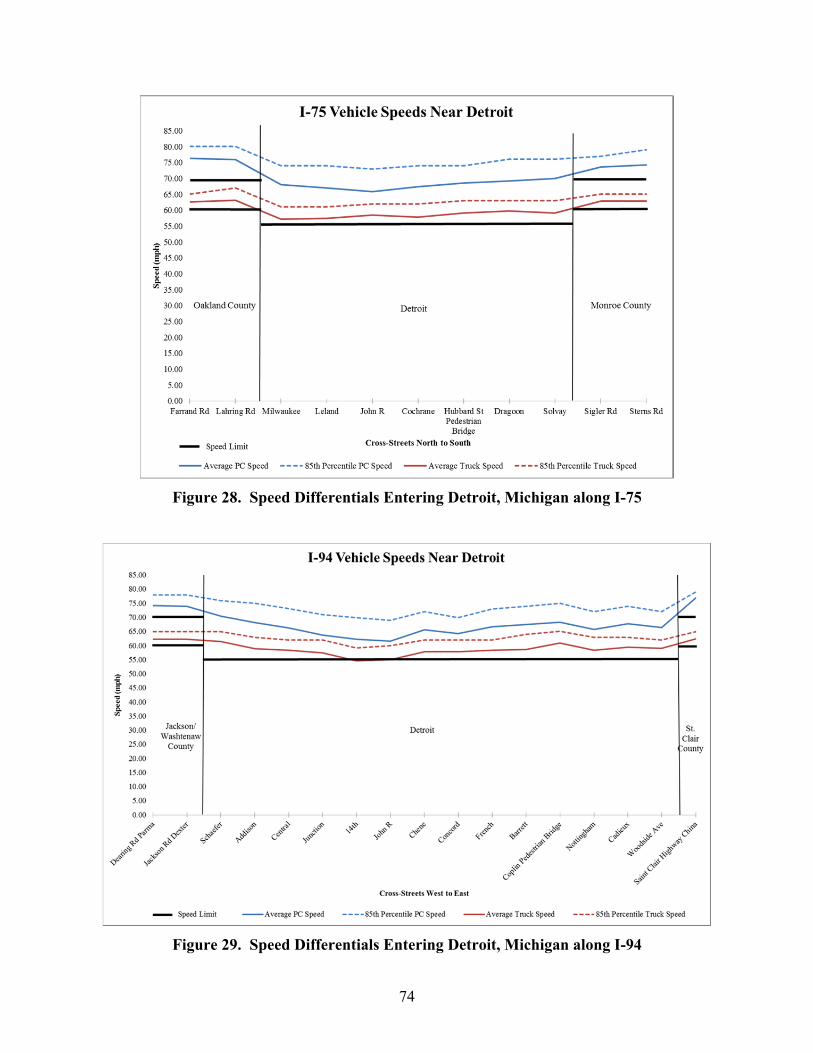
74
Figure 28. Speed Differentials Entering Detroit, Michigan along I-75
Figure 29. Speed Differentials Entering Detroit, Michigan along I-94
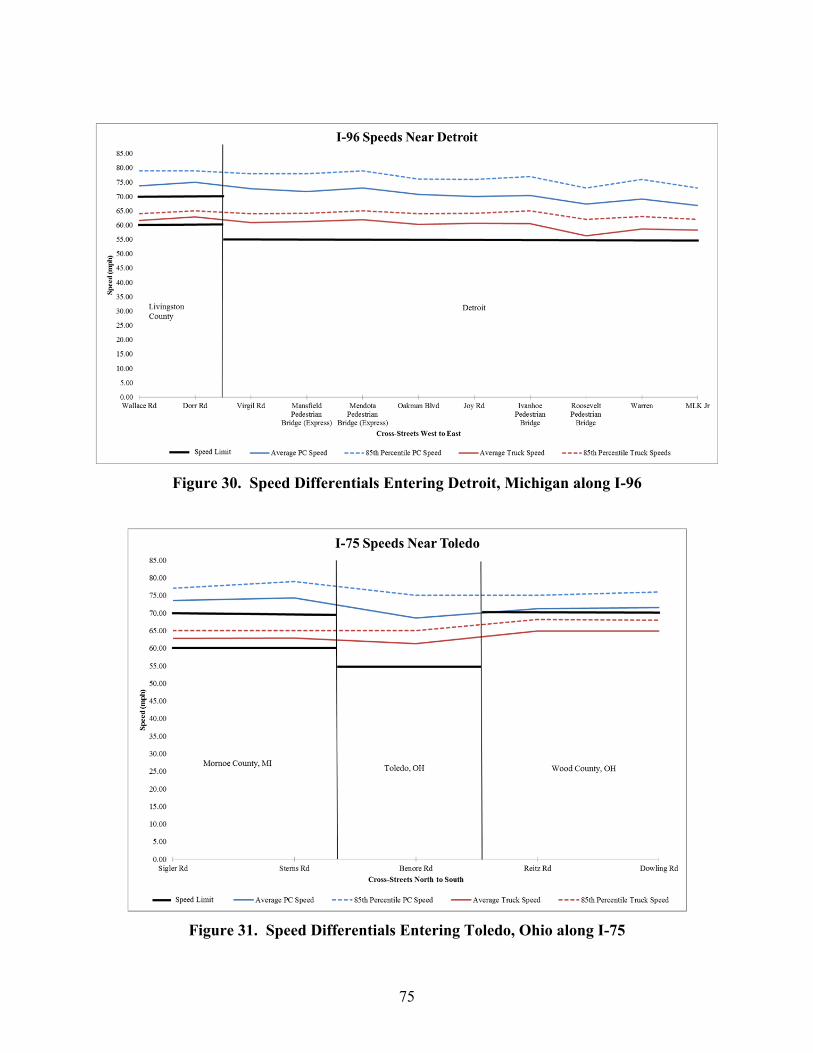
75
Figure 30. Speed Differentials Entering Detroit, Michigan along I-96
Figure 31. Speed Differentials Entering Toledo, Ohio along I-75

76
Figure 32. Speed Differentials between Michigan and Ohio
Figure 33. Speed Differentials between Michigan and Indiana

77
STATISTICAL METHODS
As noted previously, it is important to recognize that a speed limit change may affect not only
mean and 85th percentile speeds, but also the standard deviation (and variance) of speeds. This,
in turn, could result in substantive impacts on the overall safety of the highway. Consequently,
the focus of the speed data analysis was to determine the effects of speed limit policies on each
of the three performance measures noted above (mean speed, 85th percentile speed, and standard
deviation of speeds).
The typical approach to analyze such speed data has been to estimate separate models for mean
speed, 85th percentile speed, and speed variance. However, this approach is potentially
problematic because these measures are endogenous (i.e., mean/85th percentile speeds are a
function of speed variance and vice versa). Failure to account for this fact may result in biased
or inconsistent estimates for standard linear regression models. To circumvent these issues,
appropriate statistical analysis methods include the use of seemingly unrelated regression
equations (SURE) or three-stage least squares (3SLS). Such methods allow for an identification
of how speed limit policies and other variables simultaneously affect mean/85th percentile speeds
and speed variance, as well as how these speed variables affect one another. There are several
recent examples of these types of analyses in the research literature. A study by Boyle and
Mannering [136] assessed the mean and standard deviation of speeds over one-kilometer sections
of Interstate-90 in Washington State using 3SLS. The results showed that, for individual drivers,
increases in the standard deviation of speed tended to decrease mean speeds and vice versa. In
other work, Miller et al. [137] used SURE to examine the mean speed and standard deviation of
speed at nighttime work zones in Indiana. Mean speeds and standard deviations were affected by
a variety of roadway geometry and work zone characteristics.
For the purposes of this study, seemingly unrelated regression equations (SURE) were estimated
using the field-collected spot-speed data from Michigan, Indiana, and Ohio. This analysis was
focused on addressing the following questions of interest:
1. On freeways with the same maximum limit, how do speeds vary among states with
uniform speed limits and differential speed limits?
2. How do truck/bus and passenger vehicle speeds differ from one another?
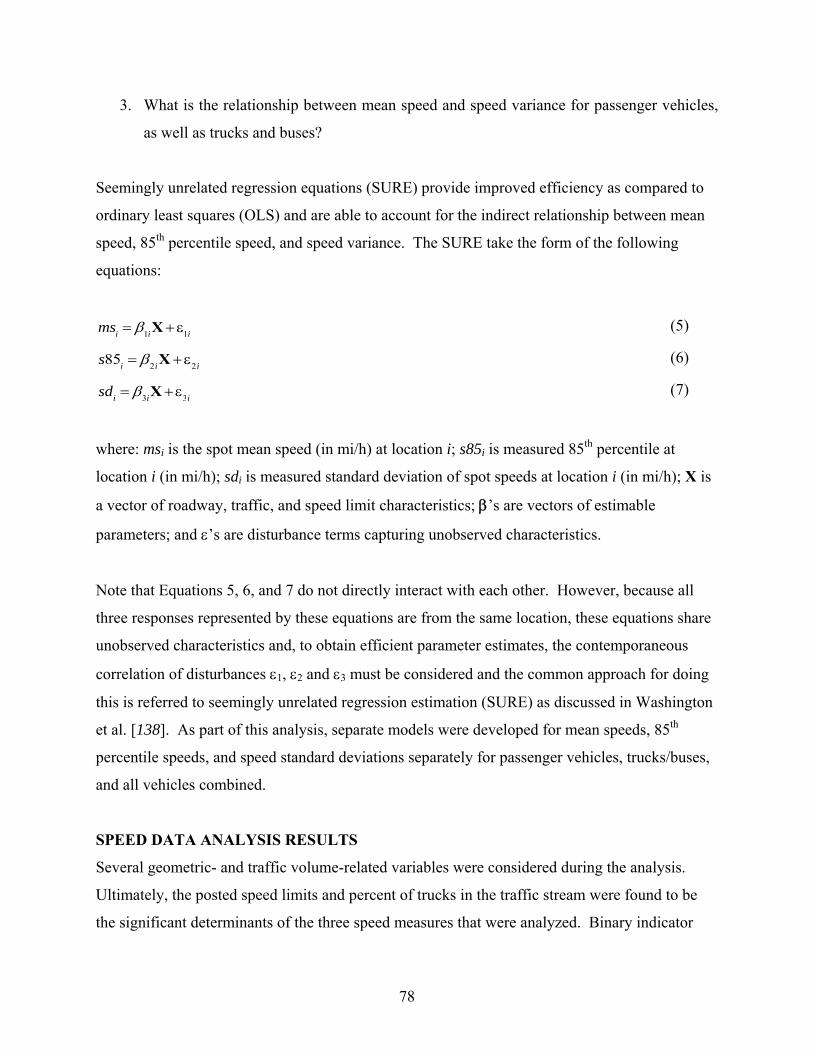
78
3. What is the relationship between mean speed and speed variance for passenger vehicles,
as well as trucks and buses?
Seemingly unrelated regression equations (SURE) provide improved efficiency as compared to
ordinary least squares (OLS) and are able to account for the indirect relationship between mean
speed, 85th percentile speed, and speed variance. The SURE take the form of the following
equations:
msi
1iX
1i (5)
s85i
2iX
2i (6)
sdi
3iX
3i (7)
where: msi is the spot mean speed (in mi/h) at location i; s85i is measured 85th percentile at
location i (in mi/h); sdi is measured standard deviation of spot speeds at location i (in mi/h); X is
a vector of roadway, traffic, and speed limit characteristics; ’s are vectors of estimable
parameters; and ’s are disturbance terms capturing unobserved characteristics.
Note that Equations 5, 6, and 7 do not directly interact with each other. However, because all
three responses represented by these equations are from the same location, these equations share
unobserved characteristics and, to obtain efficient parameter estimates, the contemporaneous
correlation of disturbances 1, 2 and 3 must be considered and the common approach for doing
this is referred to seemingly unrelated regression estimation (SURE) as discussed in Washington
et al. [138]. As part of this analysis, separate models were developed for mean speeds, 85th
percentile speeds, and speed standard deviations separately for passenger vehicles, trucks/buses,
and all vehicles combined.
SPEED DATA ANALYSIS RESULTS
Several geometric- and traffic volume-related variables were considered during the analysis.
Ultimately, the posted speed limits and percent of trucks in the traffic stream were found to be
the significant determinants of the three speed measures that were analyzed. Binary indicator
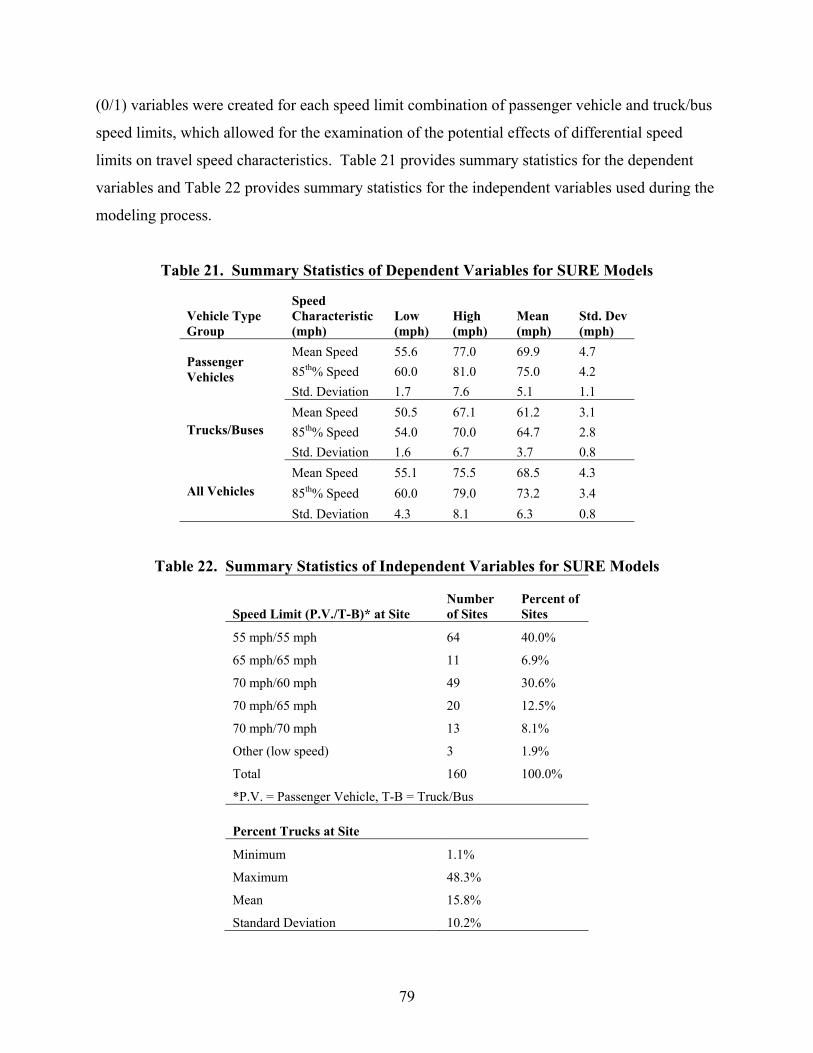
79
(0/1) variables were created for each speed limit combination of passenger vehicle and truck/bus
speed limits, which allowed for the examination of the potential effects of differential speed
limits on travel speed characteristics. Table 21 provides summary statistics for the dependent
variables and Table 22 provides summary statistics for the independent variables used during the
modeling process.
Table 21. Summary Statistics of Dependent Variables for SURE Models
Vehicle Type Group
Speed Characteristic (mph)
Low (mph)
High (mph)
Mean (mph)
Std. Dev (mph)
Passenger Vehicles
Mean Speed 55.6 77.0 69.9 4.7
85th% Speed 60.0 81.0 75.0 4.2
Std. Deviation 1.7 7.6 5.1 1.1
Trucks/Buses Mean Speed 50.5 67.1 61.2 3.1
85th% Speed 54.0 70.0 64.7 2.8
Std. Deviation 1.6 6.7 3.7 0.8
All Vehicles Mean Speed 55.1 75.5 68.5 4.3
85th% Speed 60.0 79.0 73.2 3.4
Std. Deviation 4.3 8.1 6.3 0.8
Table 22. Summary Statistics of Independent Variables for SURE Models
Speed Limit (P.V./T-B)* at Site Number of Sites
Percent of Sites
55 mph/55 mph 64 40.0%
65 mph/65 mph 11 6.9%
70 mph/60 mph 49 30.6%
70 mph/65 mph 20 12.5%
70 mph/70 mph 13 8.1%
Other (low speed) 3 1.9%
Total 160 100.0%
*P.V. = Passenger Vehicle, T-B = Truck/Bus
Percent Trucks at Site
Minimum 1.1%
Maximum 48.3%
Mean 15.8%
Standard Deviation 10.2%
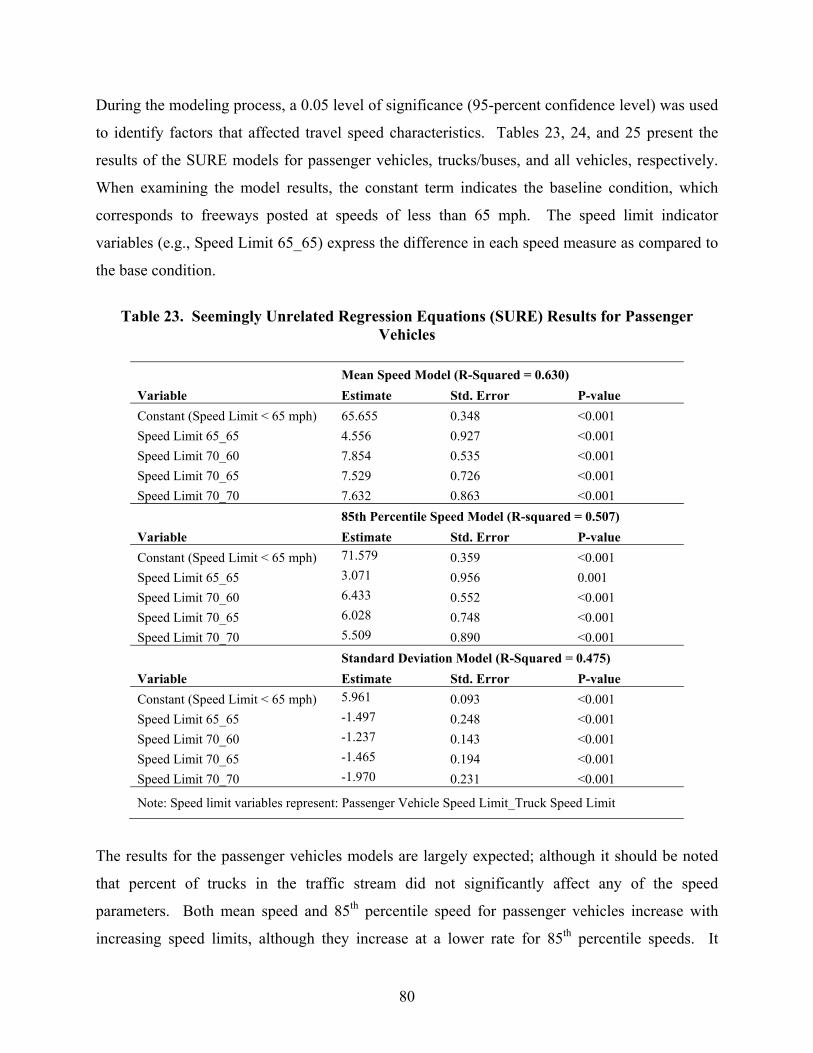
80
During the modeling process, a 0.05 level of significance (95-percent confidence level) was used
to identify factors that affected travel speed characteristics. Tables 23, 24, and 25 present the
results of the SURE models for passenger vehicles, trucks/buses, and all vehicles, respectively.
When examining the model results, the constant term indicates the baseline condition, which
corresponds to freeways posted at speeds of less than 65 mph. The speed limit indicator
variables (e.g., Speed Limit 65_65) express the difference in each speed measure as compared to
the base condition.
Table 23. Seemingly Unrelated Regression Equations (SURE) Results for Passenger
Vehicles
Variable
Mean Speed Model (R-Squared = 0.630)
Estimate Std. Error P-value
Constant (Speed Limit < 65 mph) 65.655 0.348 <0.001
Speed Limit 65_65 4.556 0.927 <0.001
Speed Limit 70_60 7.854 0.535 <0.001
Speed Limit 70_65 7.529 0.726 <0.001
Speed Limit 70_70 7.632 0.863 <0.001
Variable
85th Percentile Speed Model (R-squared = 0.507)
Estimate Std. Error P-value
Constant (Speed Limit < 65 mph) 71.579 0.359 <0.001
Speed Limit 65_65 3.071 0.956 0.001
Speed Limit 70_60 6.433 0.552 <0.001
Speed Limit 70_65 6.028 0.748 <0.001
Speed Limit 70_70 5.509 0.890 <0.001
Variable
Standard Deviation Model (R-Squared = 0.475)
Estimate Std. Error P-value
Constant (Speed Limit < 65 mph) 5.961 0.093 <0.001
Speed Limit 65_65 -1.497 0.248 <0.001
Speed Limit 70_60 -1.237 0.143 <0.001
Speed Limit 70_65 -1.465 0.194 <0.001
Speed Limit 70_70 -1.970 0.231 <0.001
Note: Speed limit variables represent: Passenger Vehicle Speed Limit_Truck Speed Limit
The results for the passenger vehicles models are largely expected; although it should be noted
that percent of trucks in the traffic stream did not significantly affect any of the speed
parameters. Both mean speed and 85th percentile speed for passenger vehicles increase with
increasing speed limits, although they increase at a lower rate for 85th percentile speeds. It
81
should be noted that the increases in both mean speed and 85th percentile speed were generally
consistent between the three states. The speed standard deviation for passenger vehicles is
generally higher than trucks or buses, though results indicated the smallest standard deviations
for passenger vehicles occurred when speed limits were uniform (65/65 or 70/70).
Table 24. Seemingly Unrelated Regression Equations (SURE) Results for Trucks/Buses
Variable
Mean Speed Model (R-Squared = 0.672)
Estimate Std. Error P-value
Constant 58.086 0.225 <0.001
Speed Limit 65_65 4.932 0.533 <0.001
Speed Limit 70_60 3.631 0.333 <0.001
Speed Limit 70_65 5.322 0.457 <0.001
Speed Limit 70_70 6.609 0.499 <0.001
Percent Trucks 0.029 0.005 <0.001
Variable
85th Percentile Speed Model (R-squared = 0.642)
Estimate Std. Error P-value
Constant 62.517 0.201 <0.001
Speed Limit 65_65 5.259 0.530 <0.001
Speed Limit 70_60 2.348 0.310 <0.001
Speed Limit 70_65 4.478 0.420 <0.001
Speed Limit 70_70 6.534 0.495 <0.001
Variable
Standard Deviation Model (R-Squared = 0.451)
Estimate Std. Error P-value
Constant 4.594 0.095 <0.001
Speed Limit 70_60 -0.842 0.110 <0.001
Speed Limit 70_65 -0.584 0.162 <0.001
Percent Trucks -0.033 0.005 <0.001
Note: Speed limit variables represent: Passenger Vehicle Speed Limit_Truck Speed Limit
The model results for trucks/buses indicate that both mean speed and 85th percentile speed are
much lower than passenger vehicles, which is expected, and the general trends between the
different speed limit groups are similar to the mean speeds and 85th percentile speeds for
passenger vehicles. It should be noted, however, that mean speeds were found to increase
slightly as the percent of trucks in the traffic stream increases, indicating that trucks tend to
travel faster together. The standard deviations for trucks/buses were found to be smaller than
passenger vehicles, and the speed limits were found to have smaller effects on standard deviation

82
for trucks/buses. This indicates truck/bus drivers tend to travel either slower or faster together,
regardless of speed limits.
The results for the models with all vehicles combined indicate that the general mean and 85th
percentile speed trends for each speed limit group are generally consistent with those found with
the passenger vehicle and truck/bus models. It should be noted that increasing percent of trucks
in the traffic stream was found to decrease the mean speed for all vehicles; an expected result as
trucks and buses tend to travel at slower speeds, and an increase in the percentage of these
vehicles in the traffic stream would tend to slow all vehicles as a whole. The speed standard
deviation for all vehicles was found to be higher than both passenger vehicles and trucks/buses.
Table 25. Seemingly Unrelated Regression Equations (SURE) Results for All Vehicles
Variable
Mean Speed Model (R-Squared = 0.595)
Estimate Std. Error P-value
Constant 64.908 0.339 <0.001
Speed Limit 65_65 4.728 0.873 <0.001
Speed Limit 70_60 7.140 0.501 <0.001
Speed Limit 70_65 7.067 0.595 <0.001
Speed Limit 70_70 7.175 0.818 <0.001
Percent Trucks -0.022 0.010 0.021
Variable
85th Percentile Speed Model (R-squared = 0.304)
Estimate Std. Error P-value
Constant 70.972 0.330 <0.001
Speed Limit 65_65 2.119 0.918 0.021
Speed Limit 70_60 4.477 0.523 <0.001
Speed Limit 70_65 3.833 0.552 <0.001
Speed Limit 70_70 3.351 0.854 <0.001
Variable
Standard Deviation Model (R-Squared = 0.280)
Estimate Std. Error P-value
Constant 6.164 0.077 <0.001
Speed Limit 65_65 -0.476 0.230 0.038
Speed Limit 70_60 0.695 0.128 <0.001
Speed Limit 70_70 -0.791 0.214 <0.001
Note: Speed limit variables represent: Passenger Vehicle Speed Limit_Truck Speed Limit

83
This is expected because when faster passenger vehicles are traveling with slower trucks, a larger
standard deviation will be measured. More interestingly, vehicles traveling at sites with the
highest differential in speed limits (70/60) were found to have the highest standard deviations,
while vehicles traveling at higher speed sites with uniform speed limits (65/65 and 70/70) were
found to have the lowest standard deviations with respect to all vehicles. It should be noted that
vehicles traveling at sites with uniform 55-mph speed limits and sites with 5-mph differential
limits (i.e., 70/65) exhibited similar standard deviations. Standard deviations at these sites
tended to be higher than at locations with uniform (65/65 or 70/70) speed limits.
Ultimately, the results of this analysis show that driver speed selection, as measured by mean and
85th percentile speeds, is generally consistent between states with similar posted speed limits.
This is particularly true of those freeways that are posted at 70 mph. The variability in travel
speeds, as measured by the site-specific standard deviation, is generally lowest at locations with
uniform speed limits, with the minimum occurring at locations posted at 70 mph). Speeds were
most variable at locations in Michigan with a 10-mph differential limit, as well as at urban
locations in all three states where the speed limits were posted at a uniform 55 mph. As truck
volumes increased, the overall variability in travel speeds tended to increase, though truck speeds
became more uniform. Based upon these results, it appears that the minimum variability in
travel speeds would occur at a uniform 70-mph limit. It is also interesting to note that passenger
cars speeds were marginally lower at sites that were posted at a uniform 70 mph (as compared to
locations with 5-mph or 10-mph differential limits). It is unclear whether these differences are
due to inherent driver behavior in response to speed limit policies, or a function of the fact that
these uniform limits were only present in the state of Ohio.
84
CHAPTER 5:
BENEFIT/COST ANALYSIS
One of the primary components of this research was to determine the economic impacts
associated with raising the speed limit on MDOT highways. Simply put, the primary question of
interest was, “Do the benefits of raising the speed limit outweigh the associated costs?” In order
to answer this question, a comprehensive benefit/cost evaluation was conducted to provide an
assessment of the economic impacts associated with raising speed limits on Michigan roadways.
The first step in the process was to identify potential economic factors that may be positively
(i.e., benefit) or negatively (i.e., cost) impacted by a speed limit increase during a typical
roadway life cycle, including both agency and non-agency costs and benefits. Only tangible
costs and benefits directly resulting from an increase in speed limit were considered, including:
Infrastructure
o Speed limit signs
o Roadway geometric components (e.g., horizontal and vertical alignment, sight
distances, guardrail lengths, auxiliary lanes and tapers, etc.)
o Additional non-freeway components (e.g., passing zones, speed reduction zones,
traffic signal clearance interval timing, etc.)
Fuel consumption
Travel time
Crashes
INFRASTRUCTURE IMPACTS
Speed Limit Signs
One of the most imminent agency-related costs associated with raising speed limits involves the
modification of existing speed limit signs. The most recent statewide speed limit policy change
in Michigan occurred in 2006 with the passage of House Bills 5104 and 5240, which raised
truck/bus speed limits on 70 mph freeways from 55 to 60 mph, minimum freeway speed limits
from 45 to 55 mph, and speed limits on certain freeways in urbanized areas from 55 to 65 or 70
mph. These policy changes necessitated modification to the speed limit signage on

85
approximately 1,850 centerline miles of affected freeways. The speed limit sign modifications
began shortly thereafter in 2006 and were performed by MDOT maintenance crews. According
to MDOT personnel, speed limit signs were typically modified using a sheeting overlay of the
speed limit, although in some cases it was necessary to replace the entire sign. These
modifications typically did not require modification to either the size of the sign or the signposts.
Traffic control during the sign modifications was also performed using MDOT forces and
typically involved a short duration shoulder closure, although lane closures were occasionally
required for replacements that occurred on or near ramps.
The total agency costs for the statewide freeway speed limit sign replacement associated with the
2006 policy change, including materials, labor, and traffic control, was approximately
$1,000,000 (2006 dollars), or approximately $540 per mile. A recent internal reassessment of
these sign modification costs by MDOT suggested that current (2014) costs to perform statewide
speed limit sign replacement (no overlays) on MDOT roadways by agency forces would be
approximately $1,350,000 ($730 per mile) on freeways and $400,000 ($63 per mile) on non-
freeways, including costs for maintenance of traffic and mobilization. Overlaying the signs with
new speed limit numbers rather than fully replacing the signs would reduce these costs by 75 to
80 percent. For purposes of the benefit/cost analysis, it was decided to conservatively assume
full replacement of all speed limit signs. It was also necessary to convert these current statewide
sign replacement cost to equivalent annualized values. Assuming a sign replacement life cycle
of 15 years and a 3 percent discount rate, the annualized statewide speed limit sign modification
costs were estimated at $113,100 and $33,500 for freeways and non-freeways, respectively.
The aforementioned statewide freeway speed limit sign replacement cost estimates may be
considered as a baseline minimum infrastructure cost. For policy changes that only involve
raising the truck/bus speed limit, it may be appropriate to consider the speed limit sign
modification costs as the primary cost incurred by the agency, as it would not be necessary to
subsequently increase the design speed of the affected roadways through substantial geometric
modification upon reconstruction. However, policy changes that include raising the passenger
vehicle speed limit on either freeways or non-freeways would typically include additional
infrastructure costs, which are detailed in the subsections that follow.
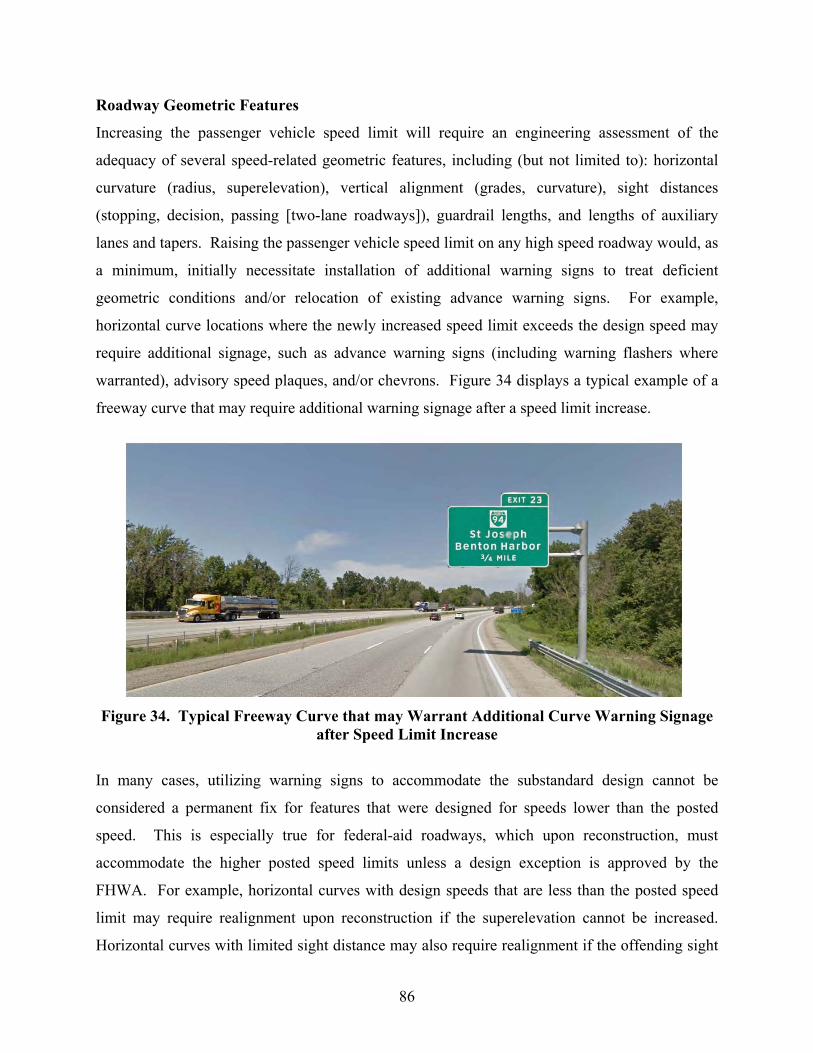
86
Roadway Geometric Features
Increasing the passenger vehicle speed limit will require an engineering assessment of the
adequacy of several speed-related geometric features, including (but not limited to): horizontal
curvature (radius, superelevation), vertical alignment (grades, curvature), sight distances
(stopping, decision, passing [two-lane roadways]), guardrail lengths, and lengths of auxiliary
lanes and tapers. Raising the passenger vehicle speed limit on any high speed roadway would, as
a minimum, initially necessitate installation of additional warning signs to treat deficient
geometric conditions and/or relocation of existing advance warning signs. For example,
horizontal curve locations where the newly increased speed limit exceeds the design speed may
require additional signage, such as advance warning signs (including warning flashers where
warranted), advisory speed plaques, and/or chevrons. Figure 34 displays a typical example of a
freeway curve that may require additional warning signage after a speed limit increase.
Figure 34. Typical Freeway Curve that may Warrant Additional Curve Warning Signage after Speed Limit Increase
In many cases, utilizing warning signs to accommodate the substandard design cannot be
considered a permanent fix for features that were designed for speeds lower than the posted
speed. This is especially true for federal-aid roadways, which upon reconstruction, must
accommodate the higher posted speed limits unless a design exception is approved by the
FHWA. For example, horizontal curves with design speeds that are less than the posted speed
limit may require realignment upon reconstruction if the superelevation cannot be increased.
Horizontal curves with limited sight distance may also require realignment if the offending sight
87
obstructions cannot be removed in order to achieve the required visibility. Similarly, vertical
curves may also require modification if inadequate stopping sight distance exists. Other
accommodations, such as guardrail runout length extensions, clear zone expansions, and
extension of auxiliary lanes and/or tapers, may also be required in order to comply with the
increased speed limit.
Geometric upgrades that expand the footprint of the existing roadway have right-of-way,
environmental, social, mobility, and construction quantity components that often substantially
exceed the cost of performing such upgrades within the existing roadway footprint. It is
expected that exceedingly large cost increases will be required to achieve geometric element
compliance with a higher posted speed limit, which will likely be prohibitive at many locations.
Although attainment of design exceptions allows for other mitigation strategies to be utilized
aside from full roadway realignment, MDOT cannot expect to frequently receive such
exceptions. It is important to note that current MDOT policy does not require upgrading
substandard geometric features during resurfacing projects unless a high crash pattern exists.
Under most circumstances, it is MDOT practice to design roadway geometric features using a
design speed that is 5 mph greater than the current posted speed limit for roadways on the
National Highway System [139]. This has resulted in a substantial portion of the existing
MDOT freeway system being designed for 75 mph design speeds, with most non-freeways and
freeways in dense urban areas typically designed for 60 mph, although many geometric elements
are constructed to even lower design speeds. Thus, compliance with higher posted speed limits
would present a very large budgetary burden on many road and bridge reconstruction projects,
increasing project costs far beyond that which would be incurred based on the current posted
speed limit.
A series of case studies have been prepared based on data provided by MDOT to demonstrate the
potential impacts of speed limit increases on geometric components. These case studies feature
rural and urban freeway sections and rural non-freeway sections. To illustrate the range of
potential geometric modifications and associated costs related to increasing the speed limit,
multiple examples are provided for each type of roadway facility, which include:

88
Examples of Affected Geometric Characteristics on Rural Freeways
1. Horizontal curve realignment (I-94, Mile Marker 22.5 in Berrien County)
2. Horizontal and vertical curve realignment at an interchange (I-94, Exit 16 in
Berrien County)
3. Horizontal curve re-grading at bridge with substandard vertical clearance (I-94,
Exit 85 in Kalamazoo County)
Freeway Corridor Examples
4. US-31 in Oceana County (Rural)
5. US-131 in Montcalm County (Rural)
6. I-94 in Berrien and Van Buren Counties (Rural)
7. I-94 in St. Clair Shores (Dense Urban)
8. I-196 in Grand Rapids (Dense Urban)
Rural Non-Freeway Corridor Examples
9. US-223, M-50, and M-52 in Lenawee County (Signing and marking costs only)
10. M-37 in Newaygo County (Extensive geometric modifications)
11. US-2 in Mackinac County (Minimal geometric modifications)
Case Study 1. Horizontal Curve Realignment on Rural Freeway
This case study example involves realignment of a horizontal curve on I-94 in Berrien County,
between Exits 22 and 23 near Stevensville. The existing curve possesses a radius of 2,300 ft,
which accommodates a 70 mph posted speed limit (75 mph design speed). The location has been
designated as a high crash location and a design speed exception would be highly unlikely. The
radius must be extended to 3,400 ft to accommodate an 80 mph posted speed limit (85 mph
design speed). Extending the radius in this manner will involve a substantial horizontal
realignment from the existing roadbed that will trigger additional project costs, including
reconstruction of a bridge, acquisition of new right-of-way, and wetland mitigation. As a result,
extending the curve radius to increase the design speed from 75 mph to 85 mph will
conservatively result in the following estimated additional primary project costs:
Bridge reconstruction: $3.0 million,
Construction of 0.6 miles of new roadway/roadbed: $2.0 million,
Right-of-way acquisition: $1 million, and
Wetland mitigation: $0.5 million.
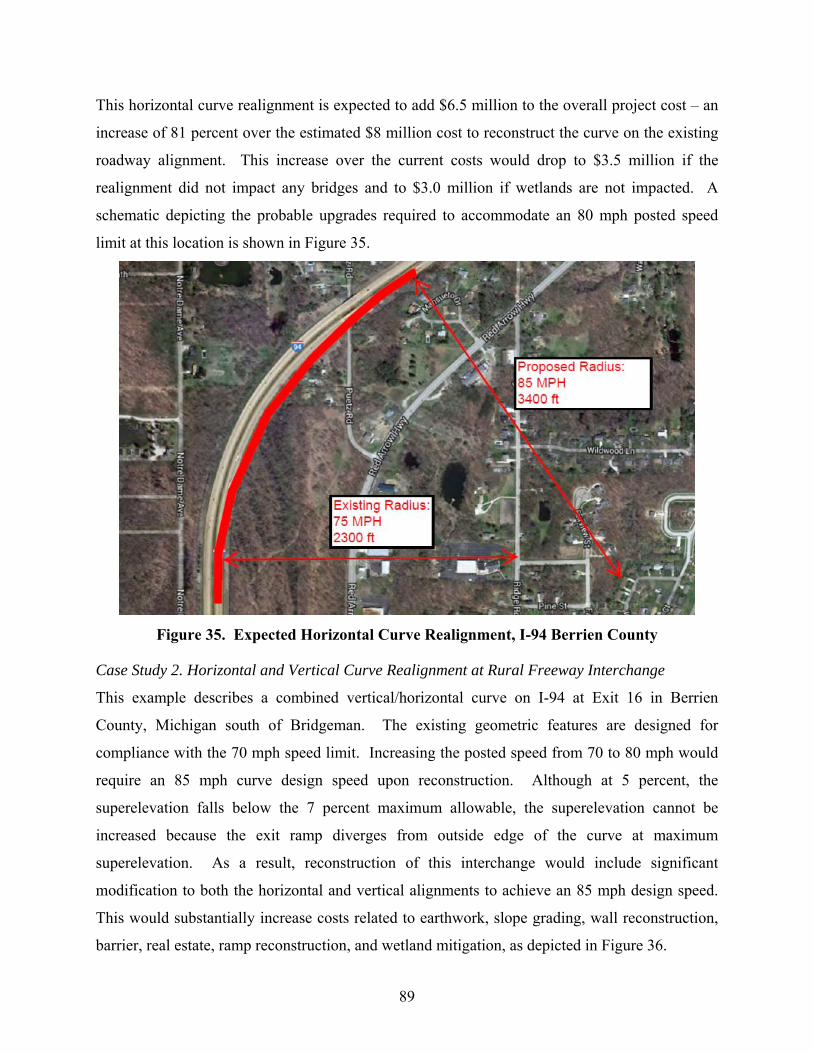
89
This horizontal curve realignment is expected to add $6.5 million to the overall project cost – an
increase of 81 percent over the estimated $8 million cost to reconstruct the curve on the existing
roadway alignment. This increase over the current costs would drop to $3.5 million if the
realignment did not impact any bridges and to $3.0 million if wetlands are not impacted. A
schematic depicting the probable upgrades required to accommodate an 80 mph posted speed
limit at this location is shown in Figure 35.
Figure 35. Expected Horizontal Curve Realignment, I-94 Berrien County
Case Study 2. Horizontal and Vertical Curve Realignment at Rural Freeway Interchange
This example describes a combined vertical/horizontal curve on I-94 at Exit 16 in Berrien
County, Michigan south of Bridgeman. The existing geometric features are designed for
compliance with the 70 mph speed limit. Increasing the posted speed from 70 to 80 mph would
require an 85 mph curve design speed upon reconstruction. Although at 5 percent, the
superelevation falls below the 7 percent maximum allowable, the superelevation cannot be
increased because the exit ramp diverges from outside edge of the curve at maximum
superelevation. As a result, reconstruction of this interchange would include significant
modification to both the horizontal and vertical alignments to achieve an 85 mph design speed.
This would substantially increase costs related to earthwork, slope grading, wall reconstruction,
barrier, real estate, ramp reconstruction, and wetland mitigation, as depicted in Figure 36.
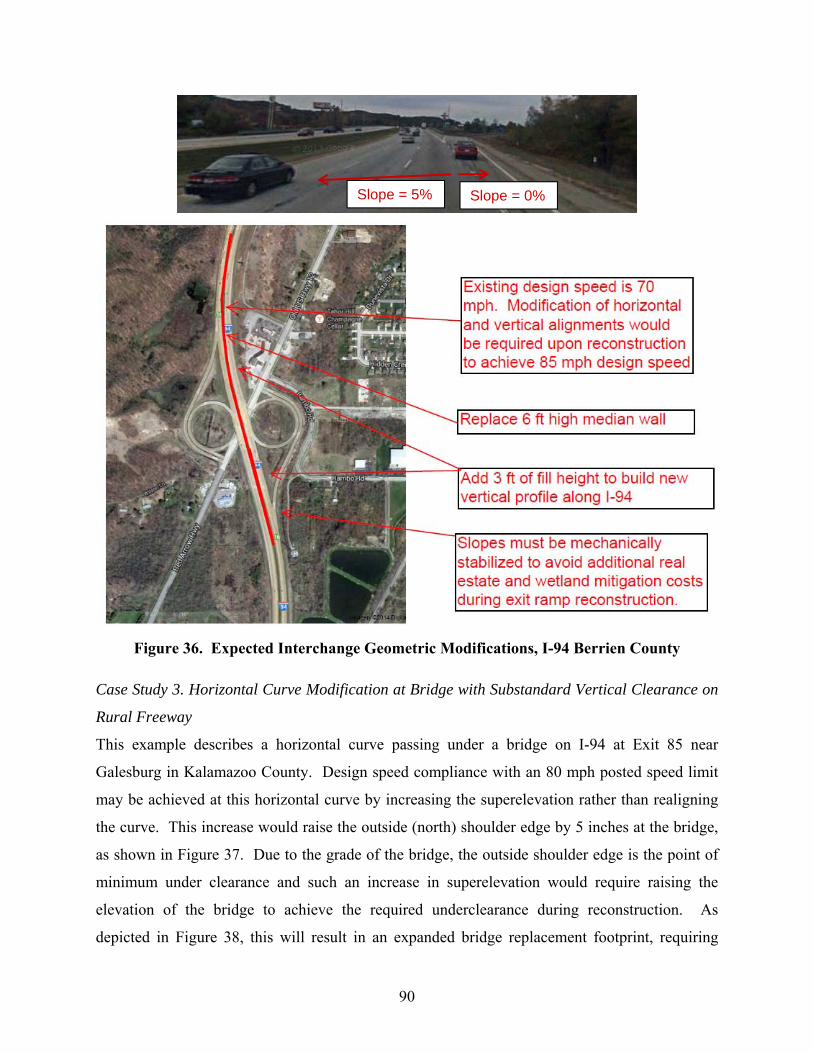
90
Figure 36. Expected Interchange Geometric Modifications, I-94 Berrien County
Case Study 3. Horizontal Curve Modification at Bridge with Substandard Vertical Clearance on
Rural Freeway
This example describes a horizontal curve passing under a bridge on I-94 at Exit 85 near
Galesburg in Kalamazoo County. Design speed compliance with an 80 mph posted speed limit
may be achieved at this horizontal curve by increasing the superelevation rather than realigning
the curve. This increase would raise the outside (north) shoulder edge by 5 inches at the bridge,
as shown in Figure 37. Due to the grade of the bridge, the outside shoulder edge is the point of
minimum under clearance and such an increase in superelevation would require raising the
elevation of the bridge to achieve the required underclearance during reconstruction. As
depicted in Figure 38, this will result in an expanded bridge replacement footprint, requiring
Slope = 5% Slope = 0%
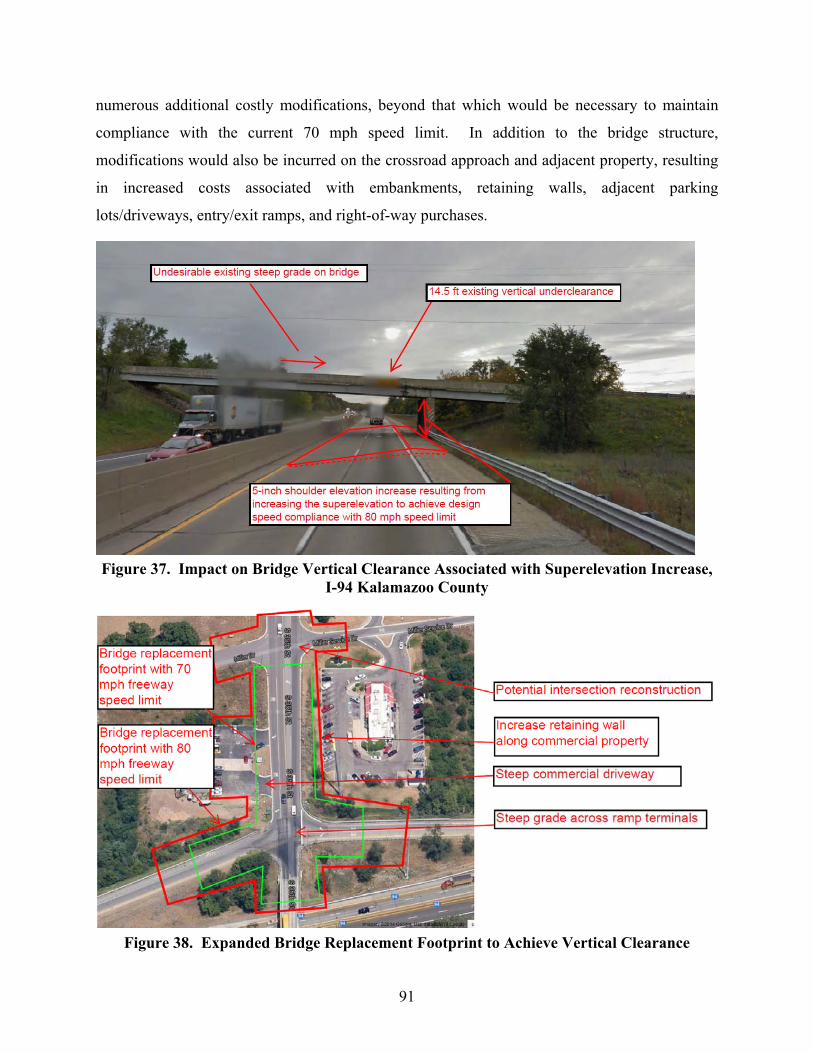
91
numerous additional costly modifications, beyond that which would be necessary to maintain
compliance with the current 70 mph speed limit. In addition to the bridge structure,
modifications would also be incurred on the crossroad approach and adjacent property, resulting
in increased costs associated with embankments, retaining walls, adjacent parking
lots/driveways, entry/exit ramps, and right-of-way purchases.
Figure 37. Impact on Bridge Vertical Clearance Associated with Superelevation Increase,
I-94 Kalamazoo County
Figure 38. Expanded Bridge Replacement Footprint to Achieve Vertical Clearance
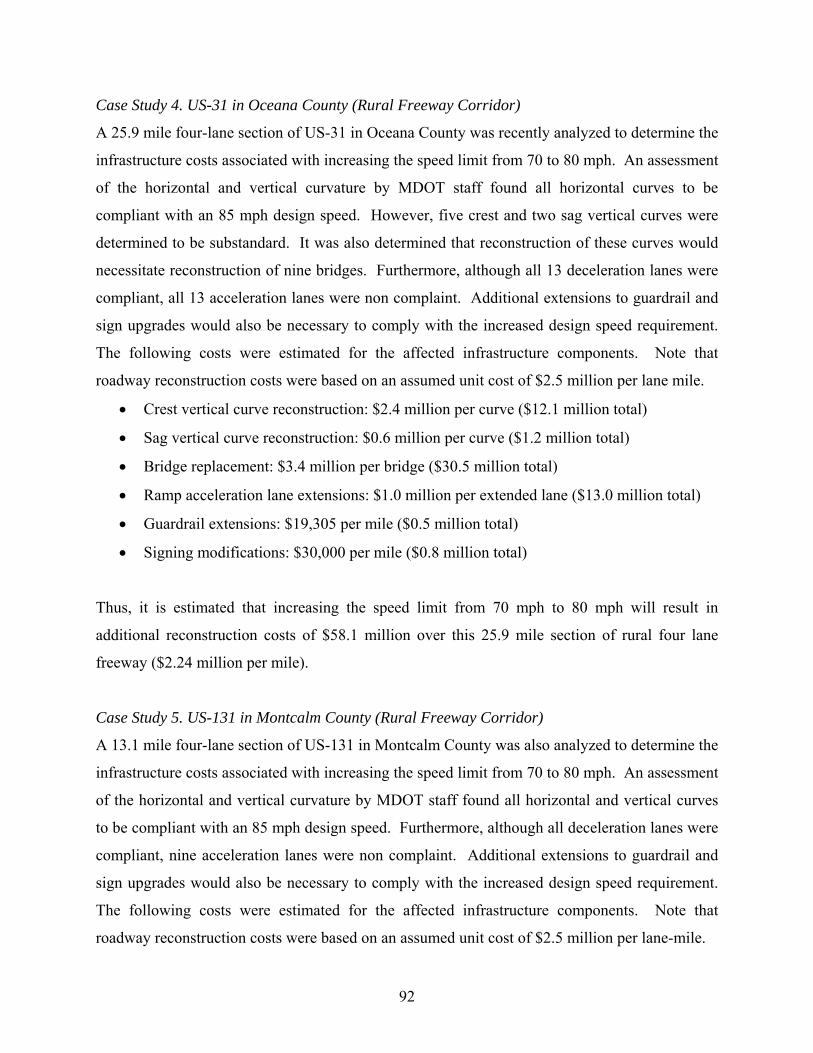
92
Case Study 4. US-31 in Oceana County (Rural Freeway Corridor)
A 25.9 mile four-lane section of US-31 in Oceana County was recently analyzed to determine the
infrastructure costs associated with increasing the speed limit from 70 to 80 mph. An assessment
of the horizontal and vertical curvature by MDOT staff found all horizontal curves to be
compliant with an 85 mph design speed. However, five crest and two sag vertical curves were
determined to be substandard. It was also determined that reconstruction of these curves would
necessitate reconstruction of nine bridges. Furthermore, although all 13 deceleration lanes were
compliant, all 13 acceleration lanes were non complaint. Additional extensions to guardrail and
sign upgrades would also be necessary to comply with the increased design speed requirement.
The following costs were estimated for the affected infrastructure components. Note that
roadway reconstruction costs were based on an assumed unit cost of $2.5 million per lane mile.
Crest vertical curve reconstruction: $2.4 million per curve ($12.1 million total)
Sag vertical curve reconstruction: $0.6 million per curve ($1.2 million total)
Bridge replacement: $3.4 million per bridge ($30.5 million total)
Ramp acceleration lane extensions: $1.0 million per extended lane ($13.0 million total)
Guardrail extensions: $19,305 per mile ($0.5 million total)
Signing modifications: $30,000 per mile ($0.8 million total)
Thus, it is estimated that increasing the speed limit from 70 mph to 80 mph will result in
additional reconstruction costs of $58.1 million over this 25.9 mile section of rural four lane
freeway ($2.24 million per mile).
Case Study 5. US-131 in Montcalm County (Rural Freeway Corridor)
A 13.1 mile four-lane section of US-131 in Montcalm County was also analyzed to determine the
infrastructure costs associated with increasing the speed limit from 70 to 80 mph. An assessment
of the horizontal and vertical curvature by MDOT staff found all horizontal and vertical curves
to be compliant with an 85 mph design speed. Furthermore, although all deceleration lanes were
compliant, nine acceleration lanes were non complaint. Additional extensions to guardrail and
sign upgrades would also be necessary to comply with the increased design speed requirement.
The following costs were estimated for the affected infrastructure components. Note that
roadway reconstruction costs were based on an assumed unit cost of $2.5 million per lane-mile.

93
Ramp acceleration lane extensions: $1.2 million per extended lane ($10.5 million total)
Guardrail extensions: $19,083 per mile ($0.25 million total)
Signing modifications: $30,000 per mile ($0.40 million total)
Thus, it is estimated that increasing the speed limit from 70 mph to 80 mph will result in
additional reconstruction costs of $11.2 million over this 13.1 mile section of rural four lane
freeway ($0.85 million per mile). The lack of vertical curve regalement and subsequent bridge
reconstruction work decreases the additional project costs by an estimated $1.39 million per mile
compared to the US-31 case study.
Case Study 6. I-94 in Berrien and Van Buren Counties (Rural Freeway Corridor)
An assessment of the estimated geometric upgrade costs was performed for a 66.8 mile section
of I-94 in Berrien and Van Buren Counties. Figure 39 presents an overview of locations along I-
94 that have been identified by MDOT as likely requiring major geometric upgrades upon
reconstruction if the speed limit was raised to 80 mph. The major geometric upgrades are
separated into three categories including conservative cost estimates as follows:
Horizontal curve realignment (N = 3 locations): includes earthwork, additional right-of-
way, and wetland mitigation costs of $3.5 million per location ($10.5 million total).
Crest vertical curve realignment (N = 5 locations): includes additional earthwork and
related costs of $4.8 million per location ($24.0 million total).
Horizontal curve modification requiring increased vertical clearance at a bridge (N = 8
locations): includes additional horizontal curve grading, bridge reconstruction, and
earthwork costs of $6 million per location ($48 million total).
Ramp acceleration lane extensions (N = 48 locations): $1.0 million per extended lane
($48.0 million total).
Guardrail extensions: $19,305 per mile ($1.3 million total).
Signing modifications: $30,000 per mile ($2.0 million total).
Thus, it is estimated that increasing the speed limit from 70 mph to 80 mph on will result in
additional reconstruction costs of $133.8 million over this 66.8 mile section of I-94 in Berrien
and Van Buren counties ($2.0 million per mile), which is consistent with the unit cost estimate
for US-31 in Oceana County.
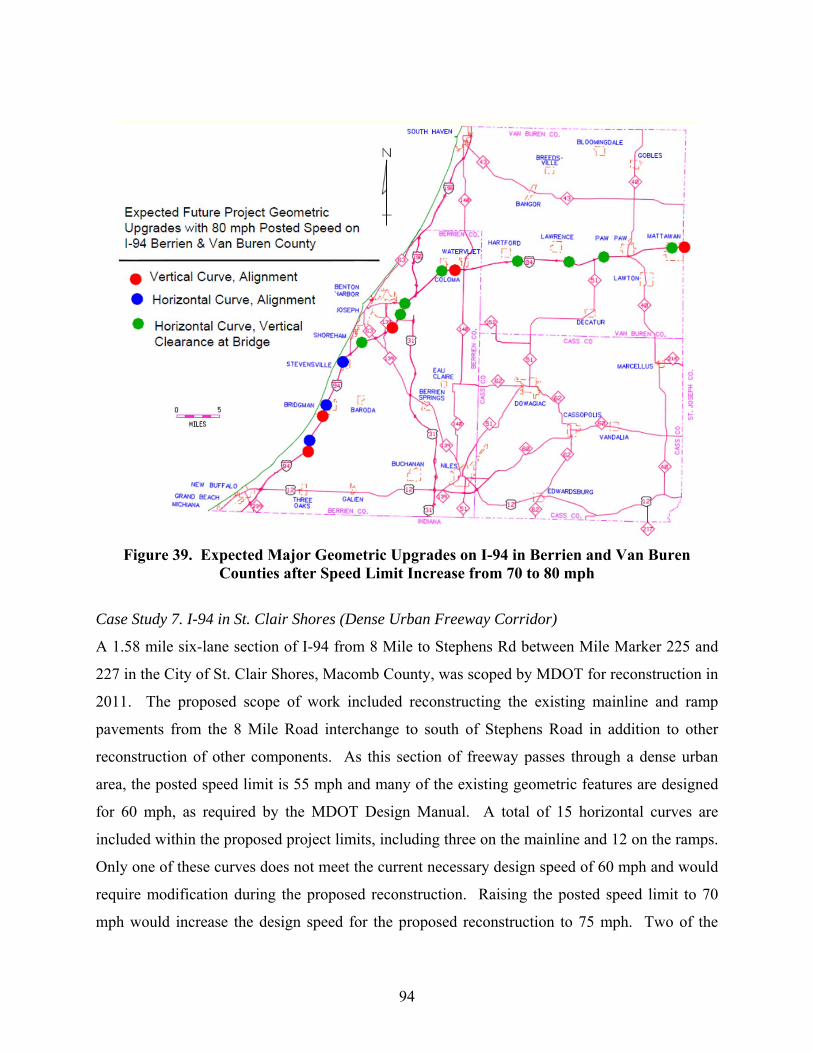
94
Figure 39. Expected Major Geometric Upgrades on I-94 in Berrien and Van Buren Counties after Speed Limit Increase from 70 to 80 mph
Case Study 7. I-94 in St. Clair Shores (Dense Urban Freeway Corridor)
A 1.58 mile six-lane section of I-94 from 8 Mile to Stephens Rd between Mile Marker 225 and
227 in the City of St. Clair Shores, Macomb County, was scoped by MDOT for reconstruction in
2011. The proposed scope of work included reconstructing the existing mainline and ramp
pavements from the 8 Mile Road interchange to south of Stephens Road in addition to other
reconstruction of other components. As this section of freeway passes through a dense urban
area, the posted speed limit is 55 mph and many of the existing geometric features are designed
for 60 mph, as required by the MDOT Design Manual. A total of 15 horizontal curves are
included within the proposed project limits, including three on the mainline and 12 on the ramps.
Only one of these curves does not meet the current necessary design speed of 60 mph and would
require modification during the proposed reconstruction. Raising the posted speed limit to 70
mph would increase the design speed for the proposed reconstruction to 75 mph. Two of the

95
three mainline horizontal curves and seven of the twelve ramp horizontal curves would not be in
compliance with a 75 mph design speed and would consequently require modification during
reconstruction. An example of a horizontal curve that would require realignment if the speed
limit is increased prior to reconstruction is shown in Figure 40.
Figure 40. Horizontal Curve Requiring Realignment if Speed Limit is increased to 70 mph,
I-94 Macomb County
Increasing the horizontal curve radii to achieve compliance with a 75 mph design speed will
require realignment of the freeway, which will have a significant impact on the project costs.
First, the necessary realignment will require additional right-of-way. As right-of-way costs are
time sensitive and highly location-specific, such costs are very difficult to estimate. Secondly,
the realignment will also include modification to the bridge and adjacent secondary roads to
accommodate the increased curve radii. For this particular project, the necessary realignment
would be extensive enough to impact two vehicle bridges and two pedestrian bridges, none of
which would require modification based on the current 60 mph design speed. The design speed
increase would also require extensive earth excavation and embankments to accommodate
realignment of the curves. A rough estimate of additional earthwork is between 1.5 million and
2.0 million cubic yards for this project. The following costs (exclusive of right-of-way) were
estimated for the infrastructure components for this project affected by increasing the speed limit
from 55 to 70 mph:

96
Vehicular bridge replacement: $5.0 million per bridge ($10.0 million total),
Pedestrian bridge replacement: $1.5 million per pedestrian bridge ($3.0 million total),
Realignment of secondary roads: $2.5 million total, assuming approximately 500 feet of
realignment in each direction, and
Additional earthwork: $4.7 to $6.0 per cubic yard ($7.0 to $12.0 million total).
Thus, it is estimated that increasing the speed limit from 55 mph to 70 mph will result in
additional project costs of $22.5 million to $27.5 million ($14.2 to $17.4 million per mile),
representing an increase of 100 to 122 percent over the estimated reconstruction cost of $22.4
million ($14.2 million) per mile at the current 55 mph speed limit. Total project costs for this
1.58 mile section would likely range from $44.9 to $49.9 million ($28.4 to $31.6 million per
mile). This likely underestimates the true cost for urban freeway realignment, as several required
cost components, including right-of-way purchases necessary to accommodate the necessary
horizontal realignment, additional design and construction engineering costs, and increased user
costs, were not included.
Case Study 8. I-196 in Grand Rapids (Dense Urban Freeway Corridor)
To obtain a more accurate reconstruction estimate inclusive of right-of-way costs, a 2.7 mile
segment of I-196 from M-45 to College Ave. through the City of Grand Rapids was also
assessed. A speed limit feasibility study for this dense urban freeway segment performed by
MDOT in 2002 was utilized to estimate the costs to increase the speed limit from 55 to 70 mph.
The estimate included geometric realignment and associated right-of-way costs, auxiliary lane
extensions, and reconstruction of affected bridges. After inflating the costs to 2014 dollars, it
was estimated that additional reconstruction costs of approximately $190 million ($70.4 million
per mile) were necessary to achieve a 75 mph design speed for this 2.7 mile section of corridor.
Although this additional cost is several times greater than that expected for rural freeways, it is
not unreasonable to expect such costs during reconstruction of urban freeways requiring
extensive realignment and subsequent right-of-way costs in order to achieve compliance with the
increased design speed.
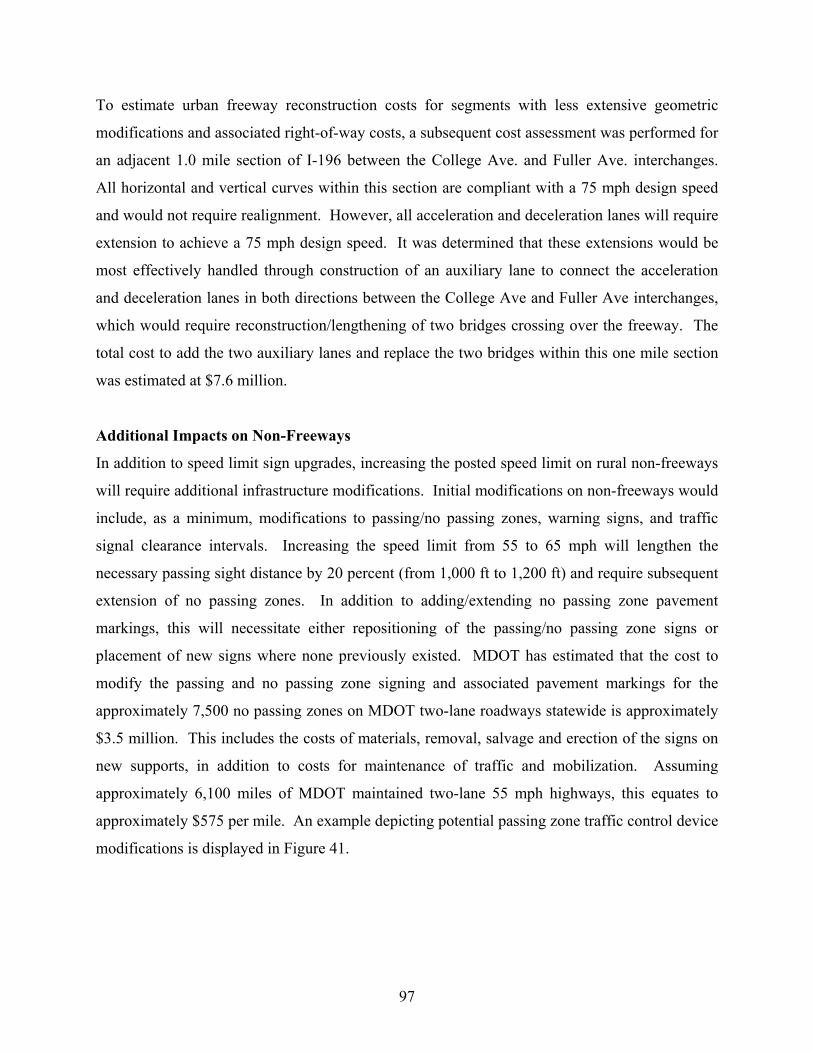
97
To estimate urban freeway reconstruction costs for segments with less extensive geometric
modifications and associated right-of-way costs, a subsequent cost assessment was performed for
an adjacent 1.0 mile section of I-196 between the College Ave. and Fuller Ave. interchanges.
All horizontal and vertical curves within this section are compliant with a 75 mph design speed
and would not require realignment. However, all acceleration and deceleration lanes will require
extension to achieve a 75 mph design speed. It was determined that these extensions would be
most effectively handled through construction of an auxiliary lane to connect the acceleration
and deceleration lanes in both directions between the College Ave and Fuller Ave interchanges,
which would require reconstruction/lengthening of two bridges crossing over the freeway. The
total cost to add the two auxiliary lanes and replace the two bridges within this one mile section
was estimated at $7.6 million.
Additional Impacts on Non-Freeways
In addition to speed limit sign upgrades, increasing the posted speed limit on rural non-freeways
will require additional infrastructure modifications. Initial modifications on non-freeways would
include, as a minimum, modifications to passing/no passing zones, warning signs, and traffic
signal clearance intervals. Increasing the speed limit from 55 to 65 mph will lengthen the
necessary passing sight distance by 20 percent (from 1,000 ft to 1,200 ft) and require subsequent
extension of no passing zones. In addition to adding/extending no passing zone pavement
markings, this will necessitate either repositioning of the passing/no passing zone signs or
placement of new signs where none previously existed. MDOT has estimated that the cost to
modify the passing and no passing zone signing and associated pavement markings for the
approximately 7,500 no passing zones on MDOT two-lane roadways statewide is approximately
$3.5 million. This includes the costs of materials, removal, salvage and erection of the signs on
new supports, in addition to costs for maintenance of traffic and mobilization. Assuming
approximately 6,100 miles of MDOT maintained two-lane 55 mph highways, this equates to
approximately $575 per mile. An example depicting potential passing zone traffic control device
modifications is displayed in Figure 41.

98
Figure 41. Typical Necessary Passing Zone Modifications after Speed Limit Increase
Increasing non-freeway speed limits will also require installation of new warning signs, such as
at curves or limited sight distances areas, and relocation of existing advance warning signage.
Immediate revision of yellow and red clearance intervals at traffic signals will also be required to
accommodate the increased speed limit. Other traffic signal modifications, such as detector
layout at actuated signals, may be applied during scheduled rehabilitation or reconstruction
activities. It will also be necessary to expand the speed reduction zones on the approach to
municipal speed zones and school speed zones, which in many cases will include modifying
current signs and/or installing new signs. Stopping sight distances will also be impacted,
particularly on roadways with excessive horizontal or vertical curvature. A broad range of
infrastructure related costs are expected for non-freeways, which are demonstrated by the
following three case studies prepared based on data provided by MDOT.
Case Study 9. US-223, M-50, and M-52, Lenawee County (Signing and Marking Upgrades Only)
MDOT recently estimated the costs for necessary modifications to the signing and pavement
markings for approximately 56 miles of non-freeway on US-223, M-50, and M-52 in Lenawee
County. The modifications included those associated with increasing the speed limit from 55 to
65 mph (as listed in the previous section, including speed limit signing) and included contracted
costs for materials, labor, preliminary engineering, construction engineering, mobilization and
maintaining traffic. The average cost was estimated at approximately $2100 per mile. As
expected, the costs varied based on roadway alignment, ranging from $400 per mile on
flat/straight sections to $4,000 per mile where extensive horizontal or vertical curvature exists.
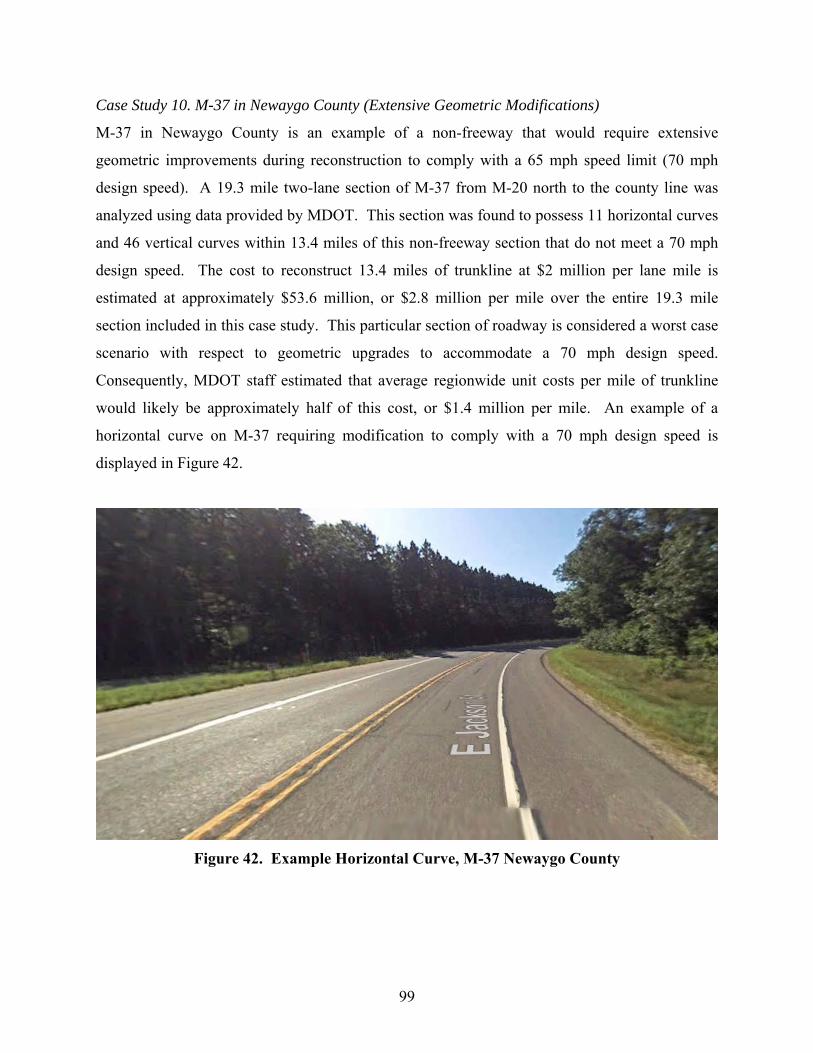
99
Case Study 10. M-37 in Newaygo County (Extensive Geometric Modifications)
M-37 in Newaygo County is an example of a non-freeway that would require extensive
geometric improvements during reconstruction to comply with a 65 mph speed limit (70 mph
design speed). A 19.3 mile two-lane section of M-37 from M-20 north to the county line was
analyzed using data provided by MDOT. This section was found to possess 11 horizontal curves
and 46 vertical curves within 13.4 miles of this non-freeway section that do not meet a 70 mph
design speed. The cost to reconstruct 13.4 miles of trunkline at $2 million per lane mile is
estimated at approximately $53.6 million, or $2.8 million per mile over the entire 19.3 mile
section included in this case study. This particular section of roadway is considered a worst case
scenario with respect to geometric upgrades to accommodate a 70 mph design speed.
Consequently, MDOT staff estimated that average regionwide unit costs per mile of trunkline
would likely be approximately half of this cost, or $1.4 million per mile. An example of a
horizontal curve on M-37 requiring modification to comply with a 70 mph design speed is
displayed in Figure 42.
Figure 42. Example Horizontal Curve, M-37 Newaygo County
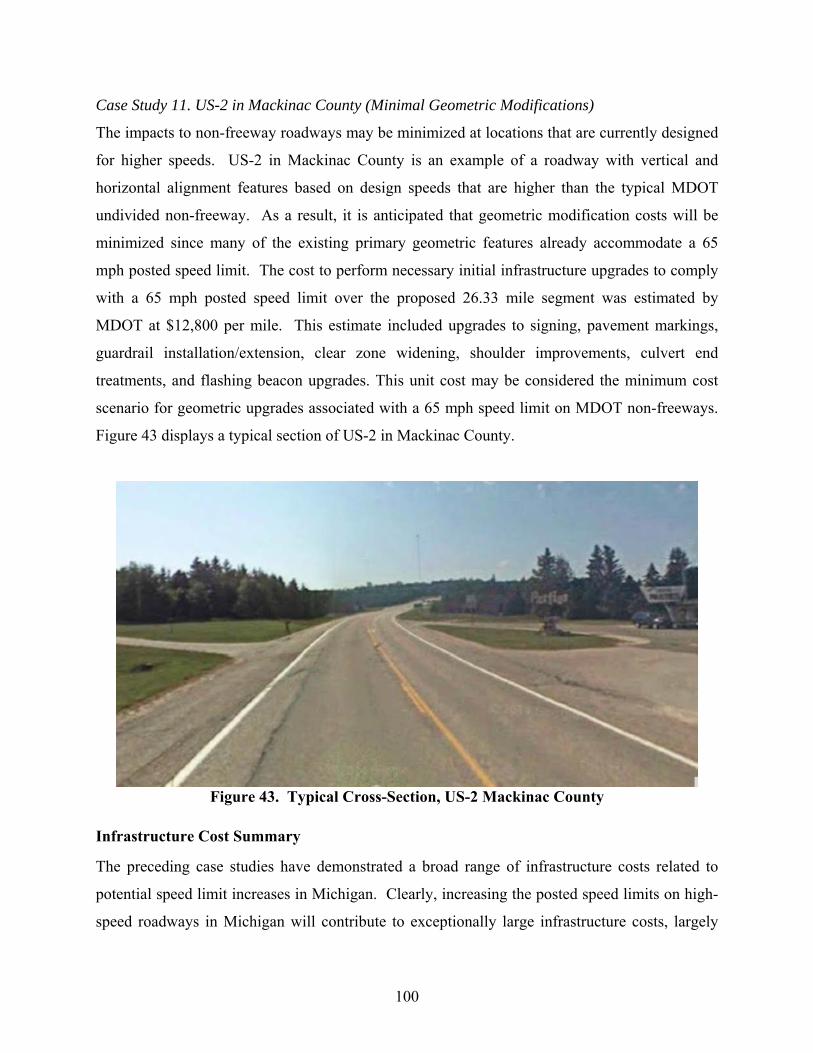
100
Case Study 11. US-2 in Mackinac County (Minimal Geometric Modifications)
The impacts to non-freeway roadways may be minimized at locations that are currently designed
for higher speeds. US-2 in Mackinac County is an example of a roadway with vertical and
horizontal alignment features based on design speeds that are higher than the typical MDOT
undivided non-freeway. As a result, it is anticipated that geometric modification costs will be
minimized since many of the existing primary geometric features already accommodate a 65
mph posted speed limit. The cost to perform necessary initial infrastructure upgrades to comply
with a 65 mph posted speed limit over the proposed 26.33 mile segment was estimated by
MDOT at $12,800 per mile. This estimate included upgrades to signing, pavement markings,
guardrail installation/extension, clear zone widening, shoulder improvements, culvert end
treatments, and flashing beacon upgrades. This unit cost may be considered the minimum cost
scenario for geometric upgrades associated with a 65 mph speed limit on MDOT non-freeways.
Figure 43 displays a typical section of US-2 in Mackinac County.
Figure 43. Typical Cross-Section, US-2 Mackinac County
Infrastructure Cost Summary
The preceding case studies have demonstrated a broad range of infrastructure costs related to
potential speed limit increases in Michigan. Clearly, increasing the posted speed limits on high-
speed roadways in Michigan will contribute to exceptionally large infrastructure costs, largely
101
due to geometric modifications required to achieve compliance with the increased design speeds.
This is especially true for freeways in dense urban areas, as the unit costs for infrastructure
modifications are expected to be substantially greater than those expected for rural freeways.
Determination of the actual statewide cost to upgrade the required geometric features for
compliance with an increased speed limit is a very difficult task requiring a detailed assessment
of the impacts on the relevant infrastructure components on all affected roadways. To overcome
this limitation, statewide costs associated with required geometric upgrades were estimated based
on extrapolation of the comprehensive infrastructure unit costs summarized in the preceding case
study examples. These unit costs broadly considered impacts to horizontal and vertical
curvature, bridges, acceleration and deceleration lanes, guardrail, signage, earthwork, wetland
mitigation, and right-of-way acquisition, among other impacts.
Infrastructure-related unit costs per centerline mile were developed for each of the three affected
facility types. Separate estimates were generated for each type of facility assuming minimal
versus extensive geometric modifications associated with the proposed speed limit increase. The
average of the high and low unit cost values was used to generate MDOT systemwide costs
based on the affected mileage within the 2012 statewide sufficiency file for each type of facility.
This includes 1,847 centerline miles of freeway currently posted at 70 mph, 91 centerline miles
of dense urban freeways currently posted at 55 or 65 mph, and 6,310 centerline miles of non-
freeways currently posted at 55 mph. The annualized MDOT systemwide cost estimates are also
provided in Table 26.
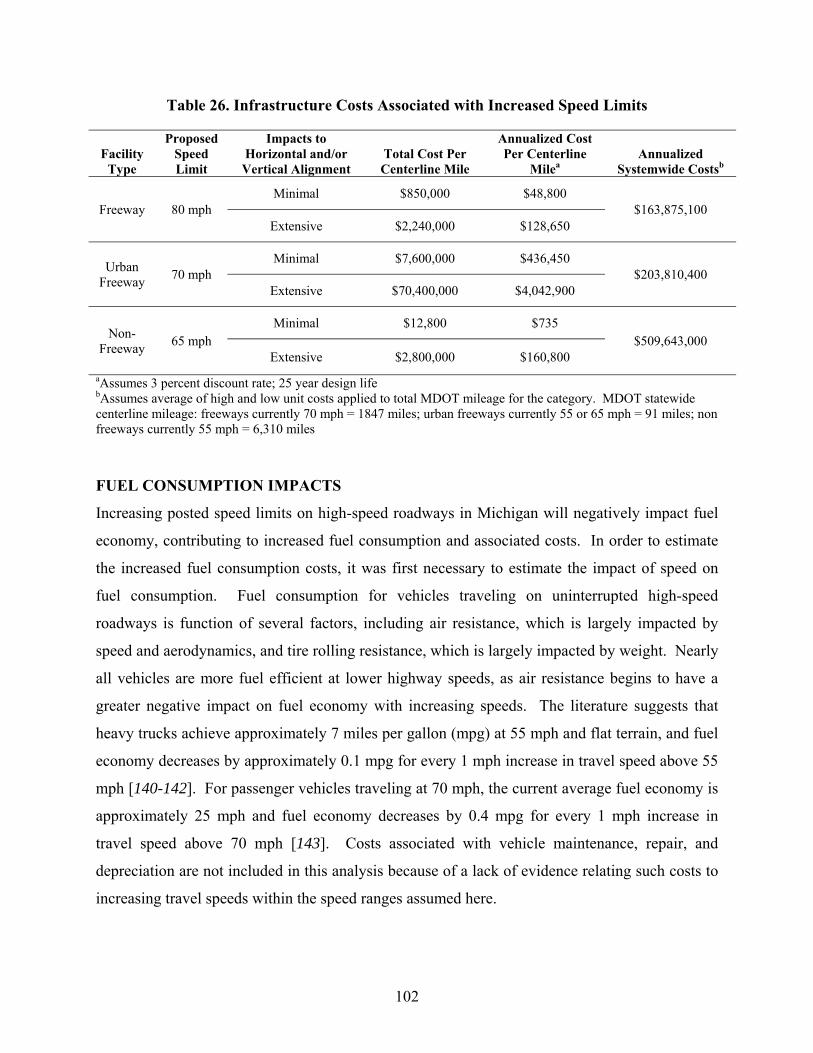
102
Table 26. Infrastructure Costs Associated with Increased Speed Limits
Facility Type
Proposed Speed Limit
Impacts to Horizontal and/or Vertical Alignment
Total Cost Per Centerline Mile
Annualized Cost Per Centerline
Milea Annualized
Systemwide Costsb
Freeway 80 mph Minimal $850,000 $48,800
$163,875,100 Extensive $2,240,000 $128,650
Urban Freeway
70 mph Minimal $7,600,000 $436,450
$203,810,400 Extensive $70,400,000 $4,042,900
Non-Freeway
65 mph Minimal $12,800 $735
$509,643,000 Extensive $2,800,000 $160,800
aAssumes 3 percent discount rate; 25 year design life bAssumes average of high and low unit costs applied to total MDOT mileage for the category. MDOT statewide centerline mileage: freeways currently 70 mph = 1847 miles; urban freeways currently 55 or 65 mph = 91 miles; non freeways currently 55 mph = 6,310 miles
FUEL CONSUMPTION IMPACTS
Increasing posted speed limits on high-speed roadways in Michigan will negatively impact fuel
economy, contributing to increased fuel consumption and associated costs. In order to estimate
the increased fuel consumption costs, it was first necessary to estimate the impact of speed on
fuel consumption. Fuel consumption for vehicles traveling on uninterrupted high-speed
roadways is function of several factors, including air resistance, which is largely impacted by
speed and aerodynamics, and tire rolling resistance, which is largely impacted by weight. Nearly
all vehicles are more fuel efficient at lower highway speeds, as air resistance begins to have a
greater negative impact on fuel economy with increasing speeds. The literature suggests that
heavy trucks achieve approximately 7 miles per gallon (mpg) at 55 mph and flat terrain, and fuel
economy decreases by approximately 0.1 mpg for every 1 mph increase in travel speed above 55
mph [140-142]. For passenger vehicles traveling at 70 mph, the current average fuel economy is
approximately 25 mph and fuel economy decreases by 0.4 mpg for every 1 mph increase in
travel speed above 70 mph [143]. Costs associated with vehicle maintenance, repair, and
depreciation are not included in this analysis because of a lack of evidence relating such costs to
increasing travel speeds within the speed ranges assumed here.

103
In order to estimate the impact of a proposed speed limit increase on fuel economy, it was
necessary to determine the increase in average travel speeds that would be expected to occur as a
result of the speed limit increase. As it was not possible to directly measure before-and-after
changes in mean speed associated with the possible speed limit policy changes in Michigan, such
changes were estimated based on data collected in Michigan, Ohio, and Indiana. Table 27
presents truck mean speeds during free flow conditions associated with freeway truck speed
limits of 55, 60, 65, and 70 mph and non-freeway speed limits of 55 and 65 mph as well as
passenger vehicle mean speeds during free flow conditions associated with freeway speed limits
of 55, 70, 75 and 80 mph and non-freeway speed limits of 55 and 65 mph.
Table 27. Fuel Economy based on Mean Speed, by Speed Limit and Vehicle Type
Facility Type Truck Speed Limit
(mph) Estimated Truck Mean
Speed (mph) Estimated Truck Fuel
Economy (mpg)
Freeway
55 58.38 6.66
60 62.01 6.30
65 63.70 6.13
70 64.99 6.00
Non-Freeway 55 56.00 6.90
65 59.00 6.60
Facility Type Passenger Veh. Speed
Limit (mph) Estimated Passenger Veh.
Mean Speed (mph) Estimated Passenger Veh.
Fuel Economy (mpg)
Freeway
55 65.66 26.74
70 73.51 23.60
75 75.81 22.68
80 78.11 21.76
Non-Freeway 55 58.00 29.80
65 61.00 28.60
The mean speed data were then utilized to estimate the fuel economy for trucks and passenger
vehicles, which are also displayed in Table 27. Note that the prediction models were
extrapolated to generate passenger vehicle mean speed estimates for speed limits of 75 mph and
80 mph. The 75 mph estimates showed good agreement with speed data provided by the
Louisiana DOT before-and-after raising the speed limit on I-49 from 70 to 75 mph. Similarly,
the estimated mean speeds associated with 65 mph speed limits on non-freeways were assumed
to increase by 3 mph over the 55 mph mean speeds based on research by Kockelman [54].
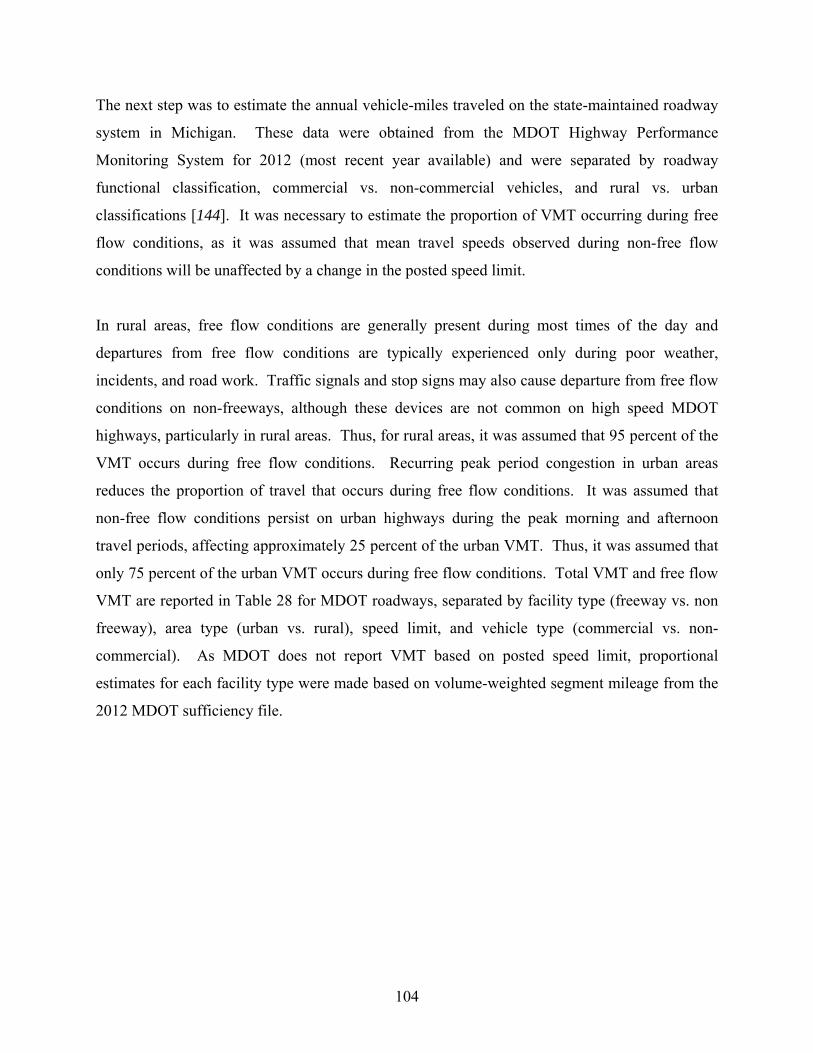
104
The next step was to estimate the annual vehicle-miles traveled on the state-maintained roadway
system in Michigan. These data were obtained from the MDOT Highway Performance
Monitoring System for 2012 (most recent year available) and were separated by roadway
functional classification, commercial vs. non-commercial vehicles, and rural vs. urban
classifications [144]. It was necessary to estimate the proportion of VMT occurring during free
flow conditions, as it was assumed that mean travel speeds observed during non-free flow
conditions will be unaffected by a change in the posted speed limit.
In rural areas, free flow conditions are generally present during most times of the day and
departures from free flow conditions are typically experienced only during poor weather,
incidents, and road work. Traffic signals and stop signs may also cause departure from free flow
conditions on non-freeways, although these devices are not common on high speed MDOT
highways, particularly in rural areas. Thus, for rural areas, it was assumed that 95 percent of the
VMT occurs during free flow conditions. Recurring peak period congestion in urban areas
reduces the proportion of travel that occurs during free flow conditions. It was assumed that
non-free flow conditions persist on urban highways during the peak morning and afternoon
travel periods, affecting approximately 25 percent of the urban VMT. Thus, it was assumed that
only 75 percent of the urban VMT occurs during free flow conditions. Total VMT and free flow
VMT are reported in Table 28 for MDOT roadways, separated by facility type (freeway vs. non
freeway), area type (urban vs. rural), speed limit, and vehicle type (commercial vs. non-
commercial). As MDOT does not report VMT based on posted speed limit, proportional
estimates for each facility type were made based on volume-weighted segment mileage from the
2012 MDOT sufficiency file.
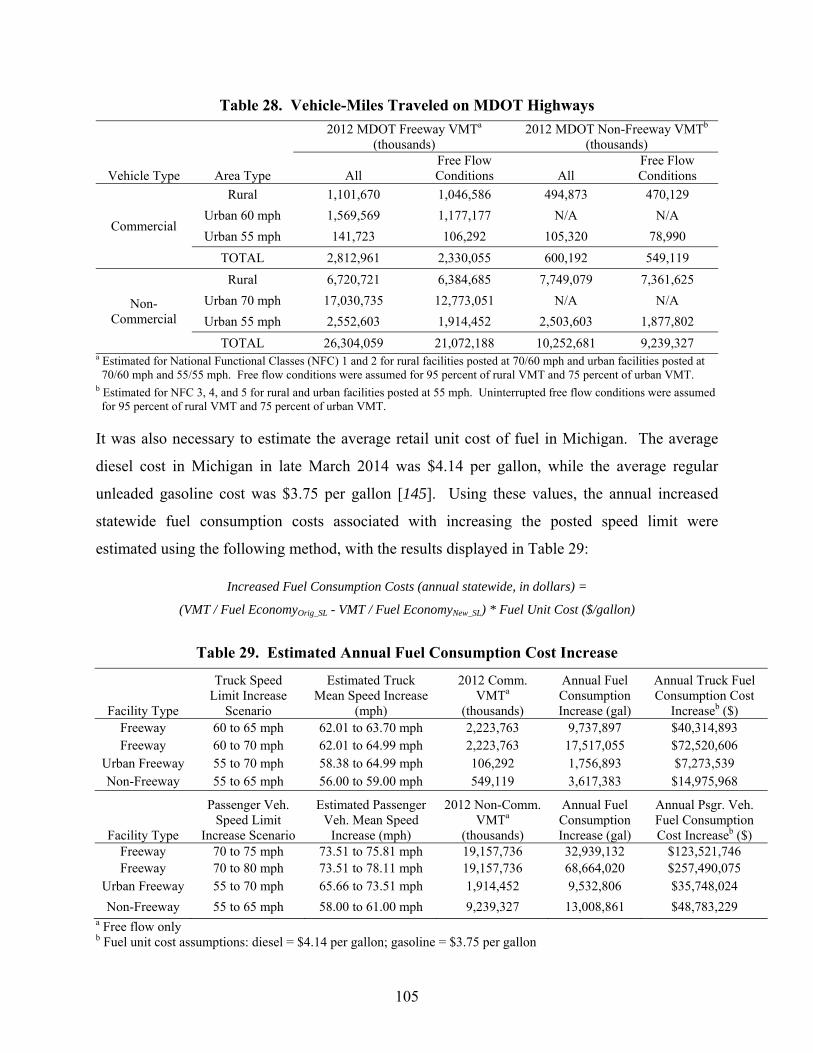
105
Table 28. Vehicle-Miles Traveled on MDOT Highways
2012 MDOT Freeway VMTa
(thousands) 2012 MDOT Non-Freeway VMTb
(thousands)
Vehicle Type Area Type All Free Flow Conditions All
Free Flow Conditions
Commercial
Rural 1,101,670 1,046,586 494,873 470,129
Urban 60 mph 1,569,569 1,177,177 N/A N/A
Urban 55 mph 141,723 106,292 105,320 78,990
TOTAL 2,812,961 2,330,055 600,192 549,119
Non-Commercial
Rural 6,720,721 6,384,685 7,749,079 7,361,625
Urban 70 mph 17,030,735 12,773,051 N/A N/A
Urban 55 mph 2,552,603 1,914,452 2,503,603 1,877,802
TOTAL 26,304,059 21,072,188 10,252,681 9,239,327 a Estimated for National Functional Classes (NFC) 1 and 2 for rural facilities posted at 70/60 mph and urban facilities posted at
70/60 mph and 55/55 mph. Free flow conditions were assumed for 95 percent of rural VMT and 75 percent of urban VMT. b Estimated for NFC 3, 4, and 5 for rural and urban facilities posted at 55 mph. Uninterrupted free flow conditions were assumed for 95 percent of rural VMT and 75 percent of urban VMT.
It was also necessary to estimate the average retail unit cost of fuel in Michigan. The average
diesel cost in Michigan in late March 2014 was $4.14 per gallon, while the average regular
unleaded gasoline cost was $3.75 per gallon [145]. Using these values, the annual increased
statewide fuel consumption costs associated with increasing the posted speed limit were
estimated using the following method, with the results displayed in Table 29:
Increased Fuel Consumption Costs (annual statewide, in dollars) =
(VMT / Fuel EconomyOrig_SL - VMT / Fuel EconomyNew_SL) * Fuel Unit Cost ($/gallon)
Table 29. Estimated Annual Fuel Consumption Cost Increase
Facility Type
Truck Speed Limit Increase
Scenario
Estimated Truck Mean Speed Increase
(mph)
2012 Comm. VMTa
(thousands)
Annual Fuel Consumption Increase (gal)
Annual Truck Fuel Consumption Cost
Increaseb ($)
Freeway 60 to 65 mph 62.01 to 63.70 mph 2,223,763 9,737,897 $40,314,893 Freeway 60 to 70 mph 62.01 to 64.99 mph 2,223,763 17,517,055 $72,520,606
Urban Freeway 55 to 70 mph 58.38 to 64.99 mph 106,292 1,756,893 $7,273,539 Non-Freeway 55 to 65 mph 56.00 to 59.00 mph 549,119 3,617,383 $14,975,968
Facility Type
Passenger Veh. Speed Limit
Increase Scenario
Estimated Passenger Veh. Mean Speed
Increase (mph)
2012 Non-Comm. VMTa
(thousands)
Annual Fuel Consumption Increase (gal)
Annual Psgr. Veh. Fuel Consumption Cost Increaseb ($)
Freeway 70 to 75 mph 73.51 to 75.81 mph 19,157,736 32,939,132 $123,521,746 Freeway 70 to 80 mph 73.51 to 78.11 mph 19,157,736 68,664,020 $257,490,075
Urban Freeway 55 to 70 mph 65.66 to 73.51 mph 1,914,452 9,532,806 $35,748,024
Non-Freeway 55 to 65 mph 58.00 to 61.00 mph 9,239,327 13,008,861 $48,783,229 a Free flow only b Fuel unit cost assumptions: diesel = $4.14 per gallon; gasoline = $3.75 per gallon

106
TRAVEL TIME IMPACTS
Any observed increases in the vehicle operating speeds will result in travel time savings for
motorists. It was first necessary to determine average hourly value-of-time estimates for typical
users of the Michigan highway network. MDOT provides separate value-of-time unit estimates
for passenger vehicles and commercial trucks for use with the Construction Congestion Cost
(CO3) estimation software [146]. The MDOT value-of-time unit estimates are based on the
FHWA publication Life-Cycle Cost Analysis in Pavement Design [147] and are currently
displayed in 2012 dollars. It was necessary to index these values to current conditions using a
ratio of the February 2014 Consumer Price Index (CPI) to the 2012 annual CPI, as follows:
234.781 / 229.594 = 1.0226 [148]. These values are displayed in Table 30.
Table 30. Value-of-Time Unit Costs by Vehicle Type and Year
User Costs (dollars per hour per vehicle)
Vehicle Type 2012 Feb 2014*
Passenger Vehicle $17.70 $18.10 Truck $31.22 $31.93
*Assumes increase of 2.26 percent from 2012 based on CPI.
It was also necessary to determine the annual net decrease in travel time that would be expected
to occur after increasing speed limits statewide. These values may be estimated based on the
estimated change in mean speeds and annual vehicle-miles traveled during free flow conditions,
displayed in the preceding section in Tables 27 and 28, respectively. The annual statewide
value-of-time savings associated with increasing the posted speed limit were estimated using the
following method with the results displayed in Table 31:
Travel Time Cost Savings (annual statewide, in dollars) =
(VMT / Mean SpeedOrig_SL - VMT / Mean SpeedNew_SL ) * User Cost ($/veh-hour)
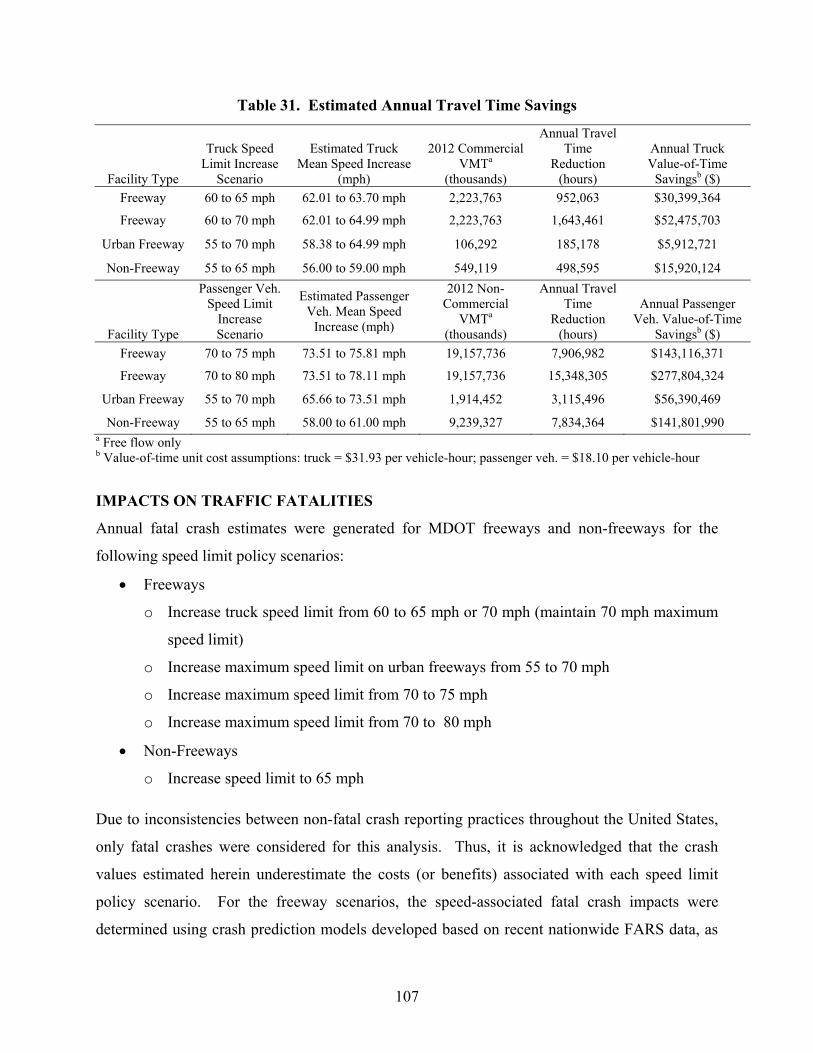
107
Table 31. Estimated Annual Travel Time Savings
Facility Type
Truck Speed Limit Increase
Scenario
Estimated Truck Mean Speed Increase
(mph)
2012 Commercial VMTa
(thousands)
Annual Travel Time
Reduction (hours)
Annual Truck Value-of-Time
Savingsb ($)
Freeway 60 to 65 mph 62.01 to 63.70 mph 2,223,763 952,063 $30,399,364
Freeway 60 to 70 mph 62.01 to 64.99 mph 2,223,763 1,643,461 $52,475,703
Urban Freeway 55 to 70 mph 58.38 to 64.99 mph 106,292 185,178 $5,912,721
Non-Freeway 55 to 65 mph 56.00 to 59.00 mph 549,119 498,595 $15,920,124
Facility Type
Passenger Veh. Speed Limit
Increase Scenario
Estimated Passenger Veh. Mean Speed
Increase (mph)
2012 Non-Commercial
VMTa (thousands)
Annual Travel Time
Reduction (hours)
Annual Passenger Veh. Value-of-Time
Savingsb ($)
Freeway 70 to 75 mph 73.51 to 75.81 mph 19,157,736 7,906,982 $143,116,371
Freeway 70 to 80 mph 73.51 to 78.11 mph 19,157,736 15,348,305 $277,804,324
Urban Freeway 55 to 70 mph 65.66 to 73.51 mph 1,914,452 3,115,496 $56,390,469
Non-Freeway 55 to 65 mph 58.00 to 61.00 mph 9,239,327 7,834,364 $141,801,990 a Free flow only b Value-of-time unit cost assumptions: truck = $31.93 per vehicle-hour; passenger veh. = $18.10 per vehicle-hour
IMPACTS ON TRAFFIC FATALITIES
Annual fatal crash estimates were generated for MDOT freeways and non-freeways for the
following speed limit policy scenarios:
Freeways
o Increase truck speed limit from 60 to 65 mph or 70 mph (maintain 70 mph maximum
speed limit)
o Increase maximum speed limit on urban freeways from 55 to 70 mph
o Increase maximum speed limit from 70 to 75 mph
o Increase maximum speed limit from 70 to 80 mph
Non-Freeways
o Increase speed limit to 65 mph
Due to inconsistencies between non-fatal crash reporting practices throughout the United States,
only fatal crashes were considered for this analysis. Thus, it is acknowledged that the crash
values estimated herein underestimate the costs (or benefits) associated with each speed limit
policy scenario. For the freeway scenarios, the speed-associated fatal crash impacts were
determined using crash prediction models developed based on recent nationwide FARS data, as
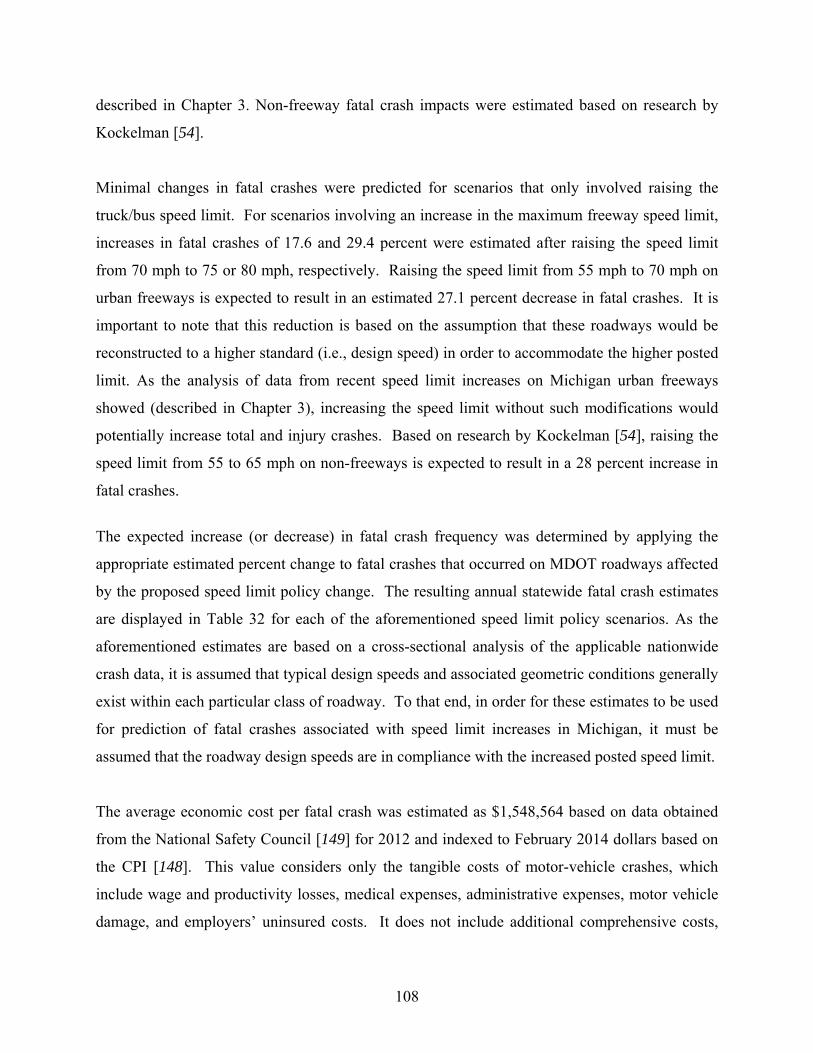
108
described in Chapter 3. Non-freeway fatal crash impacts were estimated based on research by
Kockelman [54].
Minimal changes in fatal crashes were predicted for scenarios that only involved raising the
truck/bus speed limit. For scenarios involving an increase in the maximum freeway speed limit,
increases in fatal crashes of 17.6 and 29.4 percent were estimated after raising the speed limit
from 70 mph to 75 or 80 mph, respectively. Raising the speed limit from 55 mph to 70 mph on
urban freeways is expected to result in an estimated 27.1 percent decrease in fatal crashes. It is
important to note that this reduction is based on the assumption that these roadways would be
reconstructed to a higher standard (i.e., design speed) in order to accommodate the higher posted
limit. As the analysis of data from recent speed limit increases on Michigan urban freeways
showed (described in Chapter 3), increasing the speed limit without such modifications would
potentially increase total and injury crashes. Based on research by Kockelman [54], raising the
speed limit from 55 to 65 mph on non-freeways is expected to result in a 28 percent increase in
fatal crashes.
The expected increase (or decrease) in fatal crash frequency was determined by applying the
appropriate estimated percent change to fatal crashes that occurred on MDOT roadways affected
by the proposed speed limit policy change. The resulting annual statewide fatal crash estimates
are displayed in Table 32 for each of the aforementioned speed limit policy scenarios. As the
aforementioned estimates are based on a cross-sectional analysis of the applicable nationwide
crash data, it is assumed that typical design speeds and associated geometric conditions generally
exist within each particular class of roadway. To that end, in order for these estimates to be used
for prediction of fatal crashes associated with speed limit increases in Michigan, it must be
assumed that the roadway design speeds are in compliance with the increased posted speed limit.
The average economic cost per fatal crash was estimated as $1,548,564 based on data obtained
from the National Safety Council [149] for 2012 and indexed to February 2014 dollars based on
the CPI [148]. This value considers only the tangible costs of motor-vehicle crashes, which
include wage and productivity losses, medical expenses, administrative expenses, motor vehicle
damage, and employers’ uninsured costs. It does not include additional comprehensive costs,
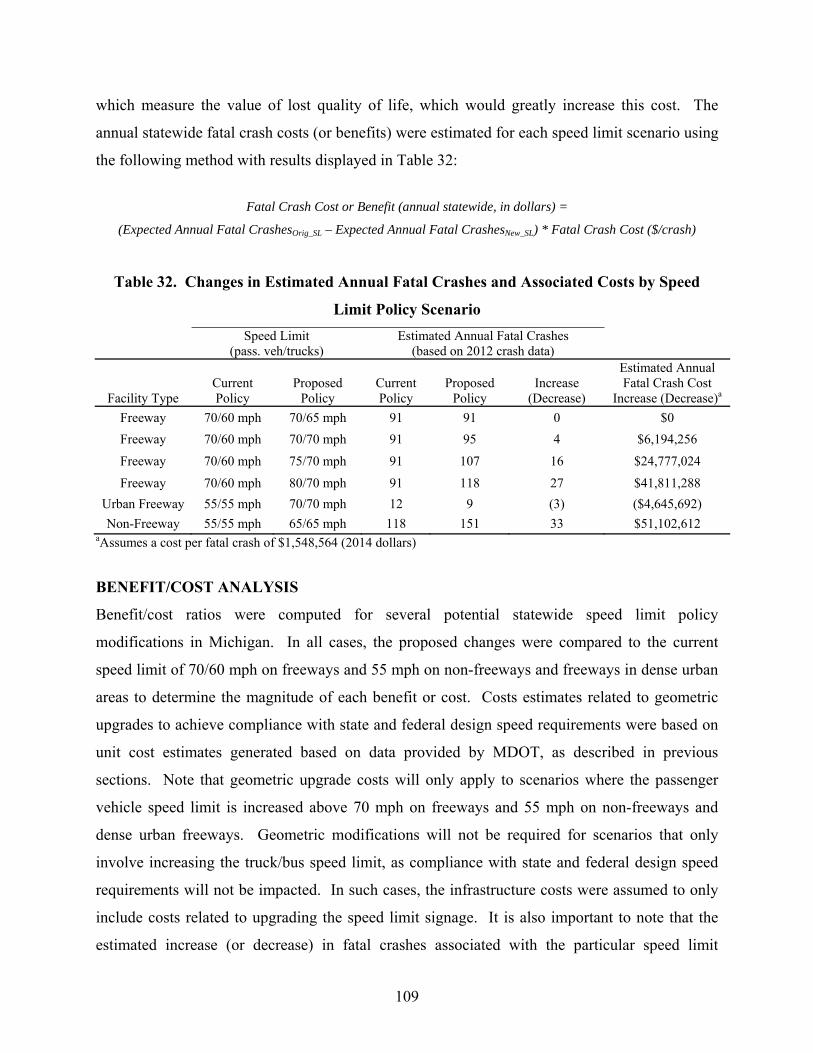
109
which measure the value of lost quality of life, which would greatly increase this cost. The
annual statewide fatal crash costs (or benefits) were estimated for each speed limit scenario using
the following method with results displayed in Table 32:
Fatal Crash Cost or Benefit (annual statewide, in dollars) =
(Expected Annual Fatal CrashesOrig_SL – Expected Annual Fatal CrashesNew_SL) * Fatal Crash Cost ($/crash)
Table 32. Changes in Estimated Annual Fatal Crashes and Associated Costs by Speed
Limit Policy Scenario
Speed Limit (pass. veh/trucks)
Estimated Annual Fatal Crashes (based on 2012 crash data)
Facility Type Current Policy
Proposed Policy
Current Policy
Proposed Policy
Increase (Decrease)
Estimated Annual Fatal Crash Cost
Increase (Decrease)a
Freeway 70/60 mph 70/65 mph 91 91 0 $0
Freeway 70/60 mph 70/70 mph 91 95 4 $6,194,256
Freeway 70/60 mph 75/70 mph 91 107 16 $24,777,024
Freeway 70/60 mph 80/70 mph 91 118 27 $41,811,288
Urban Freeway 55/55 mph 70/70 mph 12 9 (3) ($4,645,692)
Non-Freeway 55/55 mph 65/65 mph 118 151 33 $51,102,612 aAssumes a cost per fatal crash of $1,548,564 (2014 dollars)
BENEFIT/COST ANALYSIS
Benefit/cost ratios were computed for several potential statewide speed limit policy
modifications in Michigan. In all cases, the proposed changes were compared to the current
speed limit of 70/60 mph on freeways and 55 mph on non-freeways and freeways in dense urban
areas to determine the magnitude of each benefit or cost. Costs estimates related to geometric
upgrades to achieve compliance with state and federal design speed requirements were based on
unit cost estimates generated based on data provided by MDOT, as described in previous
sections. Note that geometric upgrade costs will only apply to scenarios where the passenger
vehicle speed limit is increased above 70 mph on freeways and 55 mph on non-freeways and
dense urban freeways. Geometric modifications will not be required for scenarios that only
involve increasing the truck/bus speed limit, as compliance with state and federal design speed
requirements will not be impacted. In such cases, the infrastructure costs were assumed to only
include costs related to upgrading the speed limit signage. It is also important to note that the
estimated increase (or decrease) in fatal crashes associated with the particular speed limit
110
increase assume that the roadway design speed is in compliance with the increased posted speed
limit. Utilizing the procedures described in the preceding sections for calculation of the itemized
statewide costs and benefits, separate benefit/cost ratios were computed for each of the possible
speed limit scenarios as follows, with results displayed in Table 33:
Table 33. Results of Systemwide Benefit/Cost Analysis by Speed Limit Policy Scenario
Facility Type
Current Speed Limit
Proposed Speed Limit
Travel Time Cost (Benefit)
Increased Fuel Consumption
Cost
Infrastructure Modification
Cost Fatal Crash
Cost (Benefit) B/C
Freeway 70/60 mph 70/65 mph ($30,399,364) $40,614,893 $113,100a $0 0.75
Freeway 70/60 mph 70/70 mph ($52,475,703) $72,520,606 $113,100a $6,194,256 0.67
Freeway 70/60 mph 75/70 mph ($195,592,074) $196,042,352 $81,937,550b $24,777,024 0.65
Freeway 70/60 mph 80/70 mph ($330,280,027) $330,010,681 $163,875,100 $41,811,288 0.62
Urban Freeway
55/55 mph 70/70 mph ($62,303,190) $43,021,563 $203,810,400 ($4,645,692) 0.27
Non-Freeway
55/55 mph 65/65 mph ($157,722,114) $63,759,197 $509,643,000 $51,102,612 0.25
Note: All monetary values are annualized 2014 dollars. aIncludes costs related to upgrading the speed limit signage only bAssumes 50% of costs associated with speed limit increase to 80/70
The benefit/cost results displayed in Table 33 suggest that none of the proposed speed limit
policy scenarios present a favorable economic condition compared to the current policy. The
most favorable (albeit economically undesirable) of these proposed scenarios include cases
where only the freeway truck speed limit is increased, either from 60 to 65 mph or 60 to 70 mph,
while preserving the 70 mph maximum speed limit. This is largely due to the expected absence
of any infrastructure upgrades aside from the speed limit signs, in addition to minimal expected
impacts on fatal crashes. However, the benefit/cost ratio remains less than 1.0, largely due to the
expectation that the increased fuel consumption costs associated with higher operating speeds
will outweigh the resulting travel time savings.
All proposed speed limit policy scenarios involving an increase in the maximum speed limit will
undoubtedly result in substantial infrastructure costs associated with geometric modifications
necessary to increase the design speed to comply with state and federal requirements. The
111
majority of the MDOT highway network is currently designed for compliance with posted speed
limits of 70 mph on freeways and 55 mph on non-freeways and freeways in dense urban areas.
Consequently, system-wide increases in the posted speed limit beyond these levels will result in
geometric upgrade costs that will greatly outweigh any net user benefits, resulting in benefit/cost
ratios well below 1.0. This is especially true for urban freeways and non-freeways currently
posted at 55 mph where geometric modification costs are expected to be especially severe.
Furthermore, as only fatal crashes were considered in the crash estimation process, the crash
costs are likely underestimated for all scenarios included in the benefit/cost analysis. Inclusion
of injury and property damage crashes would likely increase the crash costs for all scenarios,
thereby further reducing the corresponding benefit/cost ratios.
Increasing the maximum speed limits on freeways and non-freeways should only be considered
for sections of roadway where design speed compliance is maintained after the increase to avoid
costly geometric improvements. However, even if design speed compliance can be maintained,
careful consideration must be given to the potential safety impacts that may result from such
increases. To those ends, it is recommended that comprehensive engineering and safety analyses
be performed prior to any speed limit increase for those roadway segments under consideration.
NOISE IMPACTS
The noise impacts associated with the proposed speed limit increases were modeled using the
following equation [150]:
Leq = 42.3 + 10.2*log(VC+6VT) – 13.9*logD + 0.13*S
Where: Leq = mean hourly noise (A-weighted decibels [dBA])
VC = hourly passenger vehicle volume (vph)
VT = hourly heavy truck volume (vph)
D = receiver offset distance from edge of roadway (m)
S = average speed of traffic stream (kph)
Estimates for the average speed of the traffic stream during uncongested conditions were
determined based on the speed prediction model displayed in. Average noise levels (Leq) were
estimated for the following scenarios:

112
Speed limits (cars/trucks): 55/55; 65/65; 70/60; 70/70; 75/70; 80/70
Total hourly volume: 2,500; 7,500
Truck percentage: 10 percent; 25 percent
Receiver offset distance: 30 meters; 60 meters
The noise prediction results for various speed limit increase scenarios at a receiver distance of 30
meters are displayed in Table 34.
Table 34. Predicted Mean Noise (Leq) versus Speed Limit at 30 Meters
Mean Traffic Speed (mph)
10% Trucks Leq (dBA):
2,500 vph, 10% Trucks Leq (dBA):
7,500 vph, 10% Trucks Speed Limit
Increase Scenario Current Proposed Increase Current Proposed Increase Current Proposed Increase
70/60 to 70/70 71.8 71.8 0 73.2 73.2 0 78.1 78.1 0
70/60 to 75/70 71.8 74.1 2.3 73.2 73.7 0.5 78.1 78.6 0.5
70/60 to 80/70 71.8 76.4 4.6 73.2 74.2 1.0 78.1 79.1 1.0
55/55 to 70/70 (Urban Fwy)
64.7 71.9 7.2 71.8 73.3 1.5 76.6 78.1 1.5
55/55 to 65/65 (Non-Freeway)
57.8 60.8 3.0 70.3 70.9 0.6 75.2 75.8 0.6
Mean Traffic Speed (mph) 25% Trucks
Leq (dBA): 2,500 vph, 25% Trucks
Leq (dBA): 7,500 vph, 25% Trucks
Speed Limit Increase Scenario Current Proposed Increase Current Proposed Increase Current Proposed Increase
70/60 to 70/70 71.5 71.5 0 75.0 75.0 0 79.8 79.8 0
70/60 to 75/70 71.5 73.8 2.3 75.0 75.5 0.5 79.8 80.3 0.5
70/60 to 80/70 71.5 76.1 4.6 75.0 76.0 1.0 79.8 80.8 1.0
55/55 to 70/70 (Urban Fwy)
64.4 71.5 7.1 73.5 75.0 1.5 78.4 79.9 1.5
55/55 to 65/65 (Non-Freeway)
57.5 60.5 3.0 72.0 72.6 0.6 76.9 77.5 0.6
Table 34 presents several interesting findings. First, based on the range of values considered
here, traffic volume and truck percentage are predicted to have a greater impact on Leq than the
speed limit increase. As traffic volumes increase from 2,500 to 7,500, Leq increases by nearly 5
decibels. Increasing the truck percentage from 10 to 25 percent resulted in a nearly 2 decibel
increase in Leq, although little impact on average speeds of the traffic stream is expected.

113
Depending on the proposed speed limit scenario, average travel speeds were predicted to
increase between 0.1 mph to 7.2 mph, resulting in modest Leq increases of 0 to 1.5 dBA. Due to
the nature of the noise prediction model, for each speed limit increase scenario, the predicted
noise increase remains constant as the traffic volume or truck percentage was varied. Although
the results for the 60 meter offset distance are not displayed here, this also holds true for receiver
distance. Thus, for a proposed speed limit increase, the difference between the current and
proposed Leq may be predicted based solely on the expected increase in average speed of the
traffic stream, with consistent results expected across all traffic volumes, truck volumes, and
receiver distances. The predicted increases in mean noise and mean speed resulting from the
various speed limit increase scenarios are reflected in Figure 44.
Figure 44. Predicted Impacts of Speed Limit Policy on Mean Speed and Mean Noise
Not surprisingly, raising only the truck speed limit (i.e., from 70/60 to 70/70) will likely have no
impact on noise. Increasing the passenger vehicle and truck speed limits from 70/60 to 80/70 on
freeways is expected to result in a modest 1.0 decibel increase in mean noise. Increasing the
speed limit from 55 to 65 mph on non-freeways is expected to result in a 0.6 decibel increase.
0.0
1.0
2.0
3.0
4.0
5.0
6.0
7.0
8.0
0
0.2
0.4
0.6
0.8
1
1.2
1.4
1.6
70/60 to 70/70 70/60 to 75/70 70/60 to 80/70 55/55 to 70/70(Urban)
55 to 65 (Non‐Fwy)
Mean
Speed In
crease (mph)
Mean
Noise In
crease (dBA)
Speed Limit Increase Scenario
Noise
Speed
114
The largest increase in noise will result from increasing the speed limit on urban freeways from
55/55 to 70/70, which is expected to increase Leq by 1.5 decibels.
ADDITIONAL IMPACTS – AIR QUALITY
Beyond the economic factors discussed previously, speed limit increases are likely to result in
additional impacts, such as air quality. The National Ambient Air Quality Standards (NAAQS)
(40 CFR part 50) were initially developed as part of the 1990 Clean Air Act (CAA). The
NAAQS includes two standards: the primary standards, which were developed to protect the
health of the public, and the secondary standards, which were developed to ensure adequate
visibility as well as prevent damage to crops and animals [151]. Six common air pollutants
(often referred to as “criteria pollutants”) are regulated by the United States Environmental
Protection Agency (USEPA) and are protected under the NAAQS [151]. The six criteria
pollutants are carbon monoxide (CO), lead (Pb), nitrogen dioxide (NO2), ozone (O3), fine
particulate matter that is less than 2.5 microns (PM2.5), inhalable coarse particulate matter that is
between 2.5 and 10 microns in size (PM10), and sulfur dioxide (SO2). The NAAQS for the
criteria pollutants are summarized in Table 35. In all cases, these pollutant concentration levels
are based on ambient concentrations from mobile and stationary sources throughout a given
region.
The USEPA, following regulations in 40 CFR, Part 58, requires all states to monitor the ambient
concentration levels for the six criteria pollutants at the county level on an annual basis [151]. A
listing of all the state monitoring sites as well as annual air quality reports may be found on the
website of the Air Quality Division of the Michigan Department of Environmental Quality [152].
If the ambient levels of the six criteria pollutants in an area are within the appropriate ambient air
quality standards, the area is considered to be in “attainment.” However, if the ambient level for
one of the criteria pollutants in an area persistently exceeds the ambient air quality standards, the
area may be considered as “nonattainment” for that specific pollutant.

115
Table 35. National Ambient Air Quality Standards
Pollutant Primary/ Secondary
Averaging Time Level Form
Carbon Monoxide (CO)
Primary 8-hour 9 ppm Not to be exceeded more than once per year. 1-hour 35 ppm
Lead (Pb) Primary and Secondary
Rolling 3 month average
0.15 μg/m3
Not be exceeded
Nitrogen Dioxide (NO2)
Primary 1-hour 100 ppb 98th percentile, averaged over 3 years Primary and Secondary
Annual 53 ppb Annual mean
Ozone (O3)
Primary and Secondary
8-hour 0.075 ppm Annual fourth-highest daily maximum 8-hr concentration, averaged over 3 years
PM2.5 Primary Annual 12 μg/m3 Annual mean averaged over 3 years Secondary Annual 15 μg/m3 Annual mean averaged over 3 years Primary and Secondary
24-hour 35 μg/m3 98th percentile, averaged over 3 years
PM10 Primary and Secondary
24-hour 150 μg/m3 Not to be exceeded more than once per year on average over 3 years
Sulfur Dioxide (SO2)
Primary 1-hour 75 ppb 99th percentile of 1-hour daily maximum concentrations, averaged over 3 years
Secondary 3-hour 0.5 ppm Not to be exceeded more than once per year
Note: This table is developed from the EPA [151]
The State of Michigan is currently within the attainment levels for carbon monoxide, nitrogen
dioxide, ozone, sulfur dioxide, and particulate matter less than 10 microns (PM10 ) [153]. The
state is out of compliance (and is therefore considered by EPA to be in nonattainment ) for
annual and 24-hour for particulate matter less than 2.5 microns (PM2.5) in the following counties:
Livingston, Macomb, Monroe, Oakland, St. Clair, Washtenaw, and Wayne – all of which are
within the Detroit metropolitan area. Additionally a portion of Wayne County is in non-
attainment for SOx . Lastly, the city of Belding in Ionia County does not meet NAAQs levels for
lead (Pb) [153].
The Clean Air Act (CAA) requires all states to develop a State Implementation Plan (SIP)to
achieve and maintain the NAAQS. The objectives of the SIP are to “1) demonstrate the state has
the basic air quality management programs in place to implement a new or revised NAAQS and
116
2) identify the emissions control requirements the state will rely upon to attain and/or maintain
the primary and secondary NAAQS” [154]. The Michigan SIP may be found at the USEPA
website [155]. The emission’s budget contained in the SIP directly specifies the total mass of
pollutant emissions that are allowed from both stationary and mobile sources.
Case Study of Emission Impacts
As a result of the importance of estimating mobile source emissions, the USEPA has developed
the Motor Vehicle Emissions Simulator (MOVES), modeling software for estimating emissions
from cars, trucks, motorcycles, and buses that can be used for planning and analysis. The
MOVES software is a front end graphical user interface (GUI) that runs a series of structured
query language (SQL) databases to simulate the effects of vehicles in a given area on the
environment.
For the purposes of this study, case studies were conducted to examine prospective air quality
impacts associated with increasing speed limits. The EPA’s MOVES software was used to
estimate changes in vehicle emissions associated with increases in travel speeds from 60 mph to
75 mph.
In this research, case studies using county-level run specifications were developed for six
counties across Michigan, including Oceana, Sanilac, Shiawassee, St. Joseph, Tuscola, and Van
Buren. These six counties were chosen based on the availability of the required input data; which
were provided by MDOT. Detailed traffic data is the major attributed difference between these
counties, other than the geographic composition. A series of simulations were conducted in order
to establish baseline emissions at 60 MPH, which were compared with estimated emissions for
additional simulations at a speed limit of 75 MPH. For the six-county case study, a total of 60
MOVES simulations were completed. Figure 45 indicates the flow of data and the anticipated
completed results of the simulations.
Results of Emissions Case Study
Table 36 shows the net percent difference between the individual emissions factors. It is
important to mention that in some cases, the final results may not be valid due to the limited
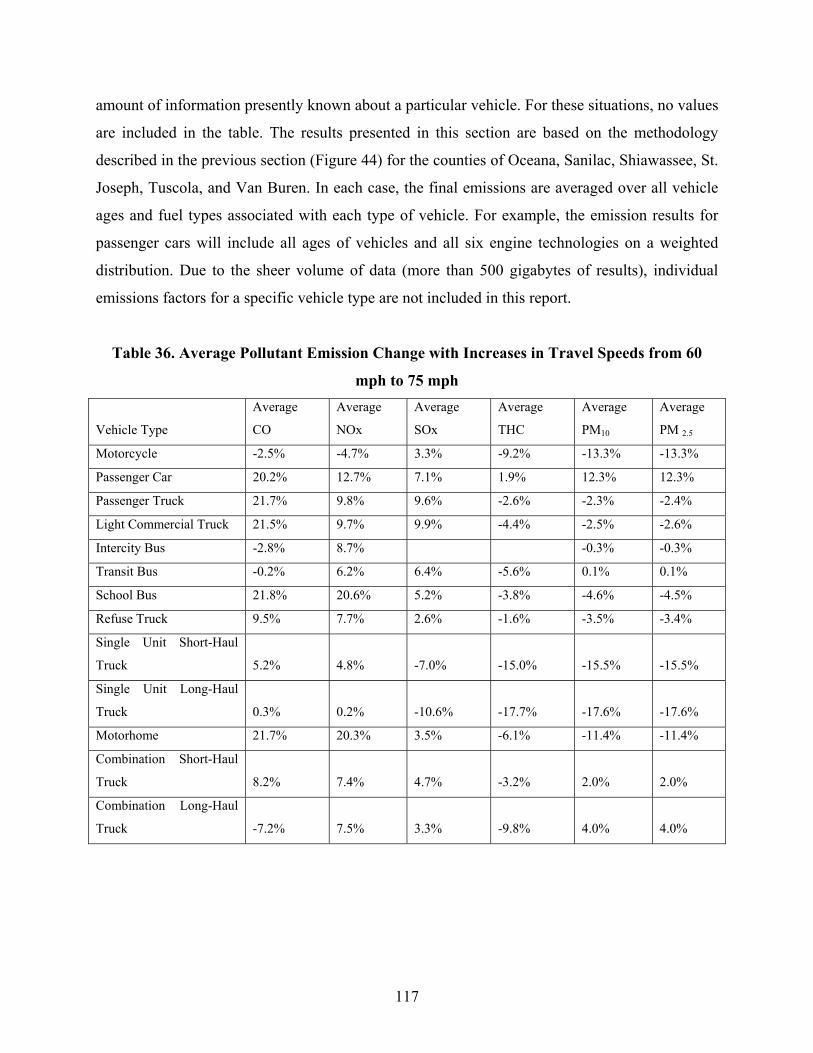
117
amount of information presently known about a particular vehicle. For these situations, no values
are included in the table. The results presented in this section are based on the methodology
described in the previous section (Figure 44) for the counties of Oceana, Sanilac, Shiawassee, St.
Joseph, Tuscola, and Van Buren. In each case, the final emissions are averaged over all vehicle
ages and fuel types associated with each type of vehicle. For example, the emission results for
passenger cars will include all ages of vehicles and all six engine technologies on a weighted
distribution. Due to the sheer volume of data (more than 500 gigabytes of results), individual
emissions factors for a specific vehicle type are not included in this report.
Table 36. Average Pollutant Emission Change with Increases in Travel Speeds from 60
mph to 75 mph
Vehicle Type
Average
CO
Average
NOx
Average
SOx
Average
THC
Average
PM10
Average
PM 2.5
Motorcycle -2.5% -4.7% 3.3% -9.2% -13.3% -13.3%
Passenger Car 20.2% 12.7% 7.1% 1.9% 12.3% 12.3%
Passenger Truck 21.7% 9.8% 9.6% -2.6% -2.3% -2.4%
Light Commercial Truck 21.5% 9.7% 9.9% -4.4% -2.5% -2.6%
Intercity Bus -2.8% 8.7% -0.3% -0.3%
Transit Bus -0.2% 6.2% 6.4% -5.6% 0.1% 0.1%
School Bus 21.8% 20.6% 5.2% -3.8% -4.6% -4.5%
Refuse Truck 9.5% 7.7% 2.6% -1.6% -3.5% -3.4%
Single Unit Short-Haul
Truck 5.2% 4.8% -7.0% -15.0% -15.5% -15.5%
Single Unit Long-Haul
Truck 0.3% 0.2% -10.6% -17.7% -17.6% -17.6%
Motorhome 21.7% 20.3% 3.5% -6.1% -11.4% -11.4%
Combination Short-Haul
Truck 8.2% 7.4% 4.7% -3.2% 2.0% 2.0%
Combination Long-Haul
Truck -7.2% 7.5% 3.3% -9.8% 4.0% 4.0%
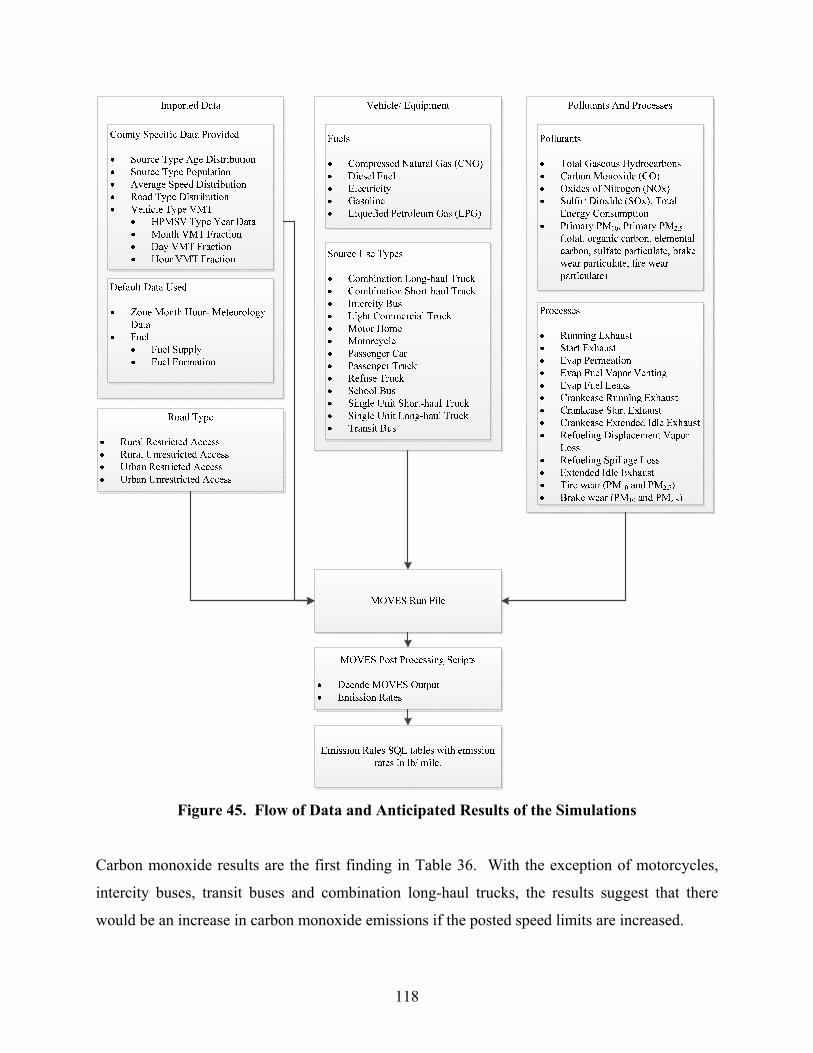
118
Figure 45. Flow of Data and Anticipated Results of the Simulations
Carbon monoxide results are the first finding in Table 36. With the exception of motorcycles,
intercity buses, transit buses and combination long-haul trucks, the results suggest that there
would be an increase in carbon monoxide emissions if the posted speed limits are increased.
119
The largest increases in emissions are from passenger cars, passenger trucks, school buses, and
motor homes. With the exception of transit buses, the general results as shown by the standard
deviation of the findings are consistent between the counties. This suggests that the overall fleet
distribution and vehicle activity within each county is similar.
With the exception of motorcycles, the results for NOx show an increase in the overall emissions
for all other vehicle types. These findings suggest that an increase in speed limits will increase
the emissions of NOx for most vehicle types. The largest percent increase, which approaches
20%, comes from school buses and motorhomes. Other results of significance show that the
more common vehicles such as passenger cars and passenger trucks, as well as single unit and
combination trucks in general, will increase the emissions range from 0.2% to 12.7%.
Similar to CO and NOx, the majority of the vehicles – with the exception of single unit short-haul
and single unit long-haul trucks – have increased SOx vehicle emissions with the faster suggested
speeds. The results for THC show that emissions per vehicle type, with the exception of
passenger cars, decreases with increasing speeds. The most significant decreases are related to
single unit short- and long-haul trucks. Finally, the results for PM10 and PM2.5 are consistent
between both pollutant types. The results with the exception of passenger cars suggest that
particulate matter emissions decrease with the increasing speeds.
These simulations provide general results of how air quality would be affected by increases in
vehicles speeds. It should be noted that these case studies were conducted for a six-county
sample, which did not include any high impact non-attainment areas. If speed limit increases
were to occur, additional consideration should be paid to nonattainment regions, such as the
Detroit metropolitan area. In order to capture the particular effects in the nonattainment areas as
well as other geographically large areas of Michigan, it would be necessary to create several
additional case studies using more detailed project-scale data based on field-captured
information (as opposed to the more general county-level data used herein). Such research is
beyond the scope of this report.
120
ADDITIONAL IMPACTS – PAVEMENT CONDITION
A number of studies have been conducted to consider various vehicle characteristics on
pavement performance and life expectancy. Vehicle speed, weight, and suspension type, in
conjunction with pavement type and surface, play a significant role in the deterioration rate of
the pavement. A study conducted by researchers at Qingdao University in China looked at the
impact of vehicle speeds on pavement performance. Using speeds ranging from 30 to 50 mph
and vehicles overloaded by 25, 50, and 75 percent, they found that the vertical, transverse, and
horizontal stresses decreased as speeds increased [156].
A study looking at the relationship between vehicle speed and pavement performance was
conducted in New Zealand to analyze the effects of increasing the heavy vehicle speed limit
from 50 to 100 km/h. Impact factors were calculated which represented the ratio of dynamic
loading effects to their static loading counterparts [157]. While the researchers were unable to
identify a defined trend, they did consider it reasonable to assume a 10 percent increase in the
impact factor over that speed increase [157].
An additional concern is the effect of dynamic vs. static loading on pavement performance. This
is an important consideration as the dynamic load is a combination of the weight of the vehicle
and the response of the vehicle’s suspension and as such, can be greater than its static equivalent
[158]. Research by Misaghi et al. showed a correlated increase in dynamic loading with
increases in vehicle speed and even greater increases on rough pavement [158].
The effect of rough or deteriorated pavement, as well as axle spacing, was explored in the
National Cooperative Highway Research Program (NCHRP) Report 353. This particular study
considered the response of both rigid and flexible pavements, ultimately coming to the
conclusion that, “…generally, higher speeds are slightly more damaging to rigid pavements, and
slightly less damaging to flexible pavements” [159]. This was due in part to the condition of the
pavement itself, meaning that there is no reason to limit vehicle speeds to reduce pavement
deterioration on roads in good condition. Supporting this conclusion, a series of tests performed
by Izquierdo et al. in 2002 found that speed had little effect on concrete pavements, but that a
rougher pavement surface would likely increase dynamic loading [160].

121
A study conducted by Hardy and Cebon in 1994 considered the effects of speed and frequency
on pavement response. Simplified and complex models were developed, which took vehicle
speed, frequency, and structural characteristics into account [161]. Holding the load constant as it
moved across the pavement surface and increasing the speed from 11 to 90 mph, the study found
that the base and soil strains decreased as the speed increased. They also noted, however, that at
higher frequencies the speed of the vehicle had less of an impact on strain measurements than the
frequency itself [161].
The effect of pavement surface roughness on the frequency, and consequently, magnitude of
dynamic loading, was tested at the Minnesota Road Research Project. Several test sections with
varying levels of roughness were used to study their combined effects. Truck speeds used for the
study ranged from 10 to 103 km/h (6 to 64 mph) [162]. The results of the study suggested that
vehicle speed and pavement roughness played conflicting roles in effecting the strain placed on
pavement. On smoother test sections as the speed increased the strain decreased. However, when
conducted on rougher sections of flexible pavement the strains decreased as the truck approached
65 km/h and then increased as the vehicle speed increased further to 103 km/h [162].
During the course of this project, the Michigan Department of Transportation conducted some
preliminary analyses to estimate potential pavement condition impacts that would be associated
with a speed limit increase. Consistent with the aforementioned findings from Minnesota, the
results suggested that distress propagation would not be substantially more severe on smooth
sections of pavement. In contrast, it is expected that rough pavements would experience
accelerated deterioration due to dynamic vertical impact forces.
122
CHAPTER 6:
CONCLUSIONS AND RECOMMENDATIONS
Speed management and the establishment of maximum speed limit policies in consideration of
safety impacts have long been important concerns of transportation agencies. The Emergency
Highway Energy Conservation Act of 1974 established a federally national maximum speed
limit (NMSL) of 55 mph. In 1987, the NMSL was relaxed, allowing states to increase speeds on
rural interstates to 65 mph. In 1995, the NMSL was fully repealed, providing states with full
authority to establish appropriate speed limits on all roadways. Given the potential implications
on safety, these speed limit policy decisions have been the subject of extensive research.
Research has examined the effects of maximum vehicular speed limits, as well as the influence
of differential speed limits, where trucks and buses are subject to a lower limit than passenger
vehicles.
Recently, legislation has been introduced in Michigan (SB 896) that would create a new “Rural
Freeway General Speed Limit” of 80 mph and a new “Urban Freeway General Speed Limit” of
70 mph, in addition to increase the maximum speed limit for trucks and buses from 60 mph to 70
mph. Additional speed limit increases have been proposed for non-limited access roadways, as
well.
In order to ascertain the potential impacts of these proposed speed limit increases, this research
examined a broad range of traffic safety, operational, environmental, and economic data.
Ultimately, the objective of this study was to collect and analyze empirical data from across the
United States in order to develop recommendations for the consideration of speed limit increases
in Michigan. Against this backdrop this research study involved:
A comprehensive state-of-the-art review of research examining the relationships between
traffic speed, safety, and crash risk. This included a survey of state agency practices with
respect to speed limit establishment, as well as a survey of the trucking industry to obtain
feedback on differential vs. uniform limits.
Collection and analysis of national interstate fatality data to ascertain the effects of speed
limit policies on traffic fatalities, with specific emphasis on maximum speed limits and
the effects of uniform vs. differential limits on urban and rural interstates.

123
Collection and analysis of traffic crash, injury, fatality, and vehicle-miles of travel data
for Michigan freeways. These analyses compared differences in safety performance
between freeways with different speed limits, as well between urban and rural settings.
Analysis of field collected speed data from Michigan, Indiana, and Ohio to ascertain
differences in mean speeds, 85th percentile speeds, and the standard deviation in speeds
among passenger cars, trucks, and buses. These states have 10-mph differential, 5-mph
differential, and uniform speed limits, respectively.
A comprehensive economic analysis of the proposed speed limit changes in consideration
of both road user and agency costs.
CONCLUSIONS
Prior research on maximum speed limits has generally shown that higher speed limits tend to
result in increases in traffic fatalities. This is particularly true for rural freeways, which have the
highest limits among all functional roadway classes in the United States, ranging up to as high as
85 mph on select facilities in Texas. The research on differential limits has generally been
inconsistent, with some states demonstrating higher fatality rates and others exhibiting lower
rates as compared to states with uniform limits.
Data from 1999 through 2011 were examined as part of this study in order to assess fatality
trends on both rural and urban interstates, as well as to examine the issue of differential limits.
Random effects negative binomial regression models were estimated to quantify the relationship
between fatalities and speed limits while controlling for additional factors such as vehicle-miles
of travel.
The results showed traffic fatalities to increase consistently with maximum speed limits in rural
environments. Compared to interstates with 60 or 65 mph limits, fatalities increased by 31.0
percent in states with 70 mph maximum limits and by 54.0 percent in states with maximum
limits of 75 mph or above. Truck- and bus-involved fatalities on rural interstates were 20.5
percent higher in states with uniform speed limits as compared to states with differential limits
for larger vehicles. States with higher speed limits showed a higher percentage of single-vehicle
crashes, a possible reflection of drivers being less capable of safely navigating interstates at
124
higher speeds. In contrast, states with lower maximum limits experienced a higher percentage of
rear-end collisions. Marginal differences were found with respect to light conditions and work
zone activity.
Consistent trends were not observed on the urban interstate network with respect to maximum
speed limits. It is important to note that this does not necessarily imply that speed limits do not
have a substantive impact in an urban setting. Urban environments are generally subject to
higher levels of congestion and more challenging roadway geometry and alignment issues, which
limit the design speed in such environments. As a result, speed limits are generally lower in an
urban setting, which potentially leads to increased variability in travel speeds.
In Michigan, a small subset of such urban freeways is posted at a uniform 55-mph limit. These
segments were examined in greater detail as a part of this study. The results of this analysis
showed that the 55-mph segments experienced total, injury, and fatal crash rates that were 49
percent, 97 percent, and 45 percent higher than those segments that were posted at 70 mph for
passenger vehicles and 60 mph for trucks and buses. Crash and injury rates were slightly higher
among urban segments posted at 70 mph/60 mph than similar rural segments. Additional
research into this issue was conducted by comparing data for seven freeway segments on which
speed limits were increased from 55 mph to 65 or 70 mph (and 60 mph for trucks/buses) between
2004 and 2012. A comparison of crash data for these segments with adjacent control locations
(all of which were posted at 70 mph) showed that total and injury crashes increased on the
segments where speeds were increased and decreased on the adjacent control locations.
Consequently, these results suggest that the lower crash, injury, and fatality rates shown at the
aggregate level among freeways posted at 70 mph is reflective of freeways with higher design
speeds. This illustrates the importance of segment-specific geometric and traffic characteristics
when considering speed limit increases.
Returning to the issue of truck and bus speed limits, the analysis of fatality data showed that total
fatality rates were not significantly different between states with uniform and differential truck
and bus limits. However, rural truck- and bus-involved fatalities were higher in states with
uniform limits than states with differential limits. One of the reasons that many states have
125
transitioned from differential to uniform limits has been due to the fact that uniform limits have
been shown to reduce the variance in travel speeds, which may in turn reduce the risk of traffic
crashes and resultant injuries/fatalities. Responses from the trucking industry survey reinforce
this argument. In order to quantitatively assess this issue, as well as general speed selection
behavior, spot speed studies were conducted at 160 freeway locations in Michigan, Indiana, and
Ohio. These sites were split among urban and rural freeways and provide geographic diversity.
Further, a subset of the locations were on freeways that passed through these neighboring states,
allowing for a controlled comparison of speed limit impacts.
Analysis of these speed data show that mean and 85th percentile travel speeds for passenger were
quite consistent among the three states when a common limit of 55 mph or 70 mph was in effect.
Conversely, truck and bus speeds were more variable, which is likely due to the existing
differential limits in Indiana (5 mph) and Michigan (10 mph). However, the differences in mean
and 85th percentile speeds were much less pronounced at 2.1 mph and 4.2 mph, respectively.
While the mean and 85th percentile truck and bus speeds were above the posted limit of 60 mph
in Michigan, compliance increased substantially in Indiana and Ohio, in particular.
The variability in travel speeds was also found to vary significantly based upon the posted speed
limit. For all vehicles combined, the highest standard deviation in travel speeds was found on
freeways posted at 70 mph for passenger vehicles and 60 mph for trucks and buses (6.9 mph on
average). This was higher than the standard deviation at locations with a uniform 55-mph limit
or with a 5-mph differential (70 mph/65 mph), which was 6.2 mph on average. Standard
deviations in travel speeds were significantly less on those segments with uniform speed limits.
Segments posted at 65/65 showed a standard deviation of 5.7 mph while those posted at 70/70
showed the lowest standard deviation at 5.4 mph. Collectively, these findings present some
evidence to potentially explain some of the trends that were observed in the urban fatality data.
Based upon the results of the fatality and speed data analyses, estimates were obtained as to
prospective impacts of increasing Michigan’s existing speed limits for trucks and buses, as well
as for passenger vehicles. Using these estimates, an economic analysis was conducted to
compare the following scenarios:
126
Increasing the maximum freeway truck/bus speed limit to 65 or 70 mph
Increasing rural freeway speed limits to 75 or 80 mph
Increasing existing 55 mph urban speed limits to 70 mph
Increasing speed limits on non-freeway facilities from 55 to 65 mph
This economic analysis focused on road user costs and benefits, installation costs for speed limit
sign upgrades, and estimates of system-wide costs for geometric upgrades necessary to
accommodate higher design speeds. The results of the economic analysis suggest that none of
the proposed speed limit policy scenarios present a favorable economic condition compared to
the current policy when considering the costs necessary for full reconstruction that will
accommodate the design standards required for higher speed facilities. The most favorable of
these proposed scenarios include cases where only the freeway truck speed limit is increased,
either from 60 to 65 mph or 60 to 70 mph, while preserving the 70 mph maximum speed limit.
This is largely due to the expected absence of any infrastructure upgrades aside from the speed
limit signs, in addition to minimal expected impacts on fatal crashes. However, the benefit/cost
ratio remains less than 1.0, largely due to the expectation that the increased fuel consumption
costs associated with higher operating speeds will outweigh the resulting travel time savings.
RECOMMENDATIONS
While several states have enacted speed limit increases over the past four to five years, these
increases have been selective and based on extensive analyses of existing traffic speeds and
historical crash trends. Given the relatively short time period for which post-increase data are
available, surveyed agencies were unable to determine whether any substantive safety impacts
had resulted. This is a particular concern at the highest speed limit ranges as only Idaho, Texas,
Utah, and Wyoming have implemented 80-mph or higher limits (and these limits have been
imposed very selectively).
Any scenarios involving an increase in the maximum speed limit will result in substantial
infrastructure costs associated with geometric modifications necessary to increase the design
speed to comply with state and federal requirements. The majority of the MDOT highway
network is currently designed for compliance with posted speed limits of 70 mph on freeways
and 55 mph on non-freeways and freeways in dense urban areas. System-wide increases in the
127
posted speed limit beyond these levels will result in geometric upgrade costs that will greatly
outweigh any net user benefits, resulting in benefit/cost ratios well below 1.0. This is especially
true for urban freeways and non-freeways currently posted at 55 mph where geometric
modification costs are expected to be especially severe. Thus, increasing the maximum speed
limits on freeways and non-freeways should only be considered for sections of roadway where
design speed compliance is maintained after the increase to avoid costly geometric
improvements.
Ultimately, it is recommended that detailed engineering and safety analyses be performed prior
to increasing the posted speed limit for any roadways under consideration. Prior to enacting any
speed limit increases, it is recommended that more detailed historic data is examined, including
but not limited to:
Mean and 85th percentile speeds – Research suggests that crashes are generally
minimized when the posted speed limit is near the 85th percentile of free-flowing traffic.
Consequently, locations with large variations between the posted and 85th percentile
speeds represent prospective candidate locations for speed limit increases.
Variability in travel speeds – Research has also demonstrated that crashes tend to
increase as the variability in travel speeds increases. The speed data from this project
suggest that variability is greatest at freeway locations with a 10-mph differential
(70/60), followed by those with a 5-mph differential (70/65) or uniform 55 mph limit.
Crash history and roadway geometry – It is important to consider whether a location has
a history of crashes, particularly those that may be speeding-related when determining
whether an increase is appropriate. Locations with high densities of entry/exit ramps,
sight distance restrictions (often due to horizontal and vertical curvature), or other design
exceptions (where the design speed of the roadway is less than the posted limit) should
be examined very cautiously.
Traffic volumes – Even if the 85th percentile speed under free-flow conditions suggests
that an increase may be appropriate, this must be balanced with the level of traffic
volume on specific roadways. If a roadway is subject to heavy congestion over
prolonged periods of the day, higher speed limits in these areas may greatly increase the
potential for collisions as faster moving traffic enters congested areas.
128
AREAS FOR FUTURE RESEARCH
This study provides important information that can be used as an input in guiding speed limit
policy decisions. However, further research is warranted prior to introducing such limits,
specifically:
1. More detailed, disaggregate analyses of the relationships between speeds and traffic
crashes, injuries, and fatalities on Michigan highways is warranted. Michigan has
introduced two speed limit increases during the past 20 years, providing an opportunity to
examine trends on specific road segments. By analyzing these segments at a more
detailed level, additional insights may be obtained as to those locations that may be
reasonable candidate for speed limit increases.
2. Further research is necessary into the potential effects of speed limits on non-limited
access facilities, particularly two-lane highways where the maximum posted speed limit
is currently 55 mph. On these types of facilities, road geometry plays a much larger role
than the posted speed limit on speed selection as drivers generally travel at speeds as
dictated by prevailing road conditions. Nationally, most states recognize a 55 mph limit
on such facilities. The analysis of traffic speed and crash data for a diverse range of two-
lane facilities, in combination with economic data required for infrastructure upgrades,
represent important areas of research prior to increasing speeds on these roadways.

129
APPENDIX: Field Speed Data

130
Table 37. Summary of Michigan Speed Data
Route #
Passenger Vehicles Trucks/Buses All Vehicles
Speed Limit (mph)
Mean Speed (mph)
Std. Dev
(mph)
85th %
Speed (mph)
% 5 mph
above Sp.
Limit
% 10 mph
above Sp.
Limit
Speed Limit (mph)
Mean Speed (mph)
Std. Dev
(mph)
85% Speed (mph)
% 5 mph
above Sp.
Limit
% 10 mph
above Sp. Limit
Overall Mean Speed (mph)
Overall Std. Dev
(mph)
Overall 85%
Speed (mph)
I-75 55 67.5 6.10 74.00 0.88 0.61 55 57.9 4.25 62.00 0.22 0.04 65.94 6.79 73.0
I-75 55 69.2 6.46 76.00 0.92 0.72 55 59.7 4.04 63.00 0.44 0.06 67.16 7.17 75.0
I-75 55 68.5 5.58 74.00 0.90 0.71 55 59.2 3.77 63.00 0.34 0.03 66.33 6.53 74.0
I-75 55 65.9 6.42 73.00 0.79 0.51 55 58.4 4.27 62.00 0.29 0.04 64.54 6.70 71.0
I-75 55 67.0 6.89 74.00 0.82 0.61 55 57.4 4.25 61.00 0.19 0.04 65.71 7.38 74.0
I-75 55 68.0 5.71 74.00 0.90 0.65 55 57.2 4.84 61.00 0.17 0.07 66.61 6.65 73.0
I-75 70 70.0 6.01 76.00 0.16 0.02 60 59.1 3.64 63.00 0.01 0.00 67.82 7.08 75.0
I-94 55 62.3 7.52 70.00 0.62 0.35 55 54.6 5.31 59.15 0.11 0.02 61.32 7.73 69.0
I-94 55 68.2 6.85 75.00 0.84 0.69 55 59.0 4.81 63.00 0.38 0.05 66.86 7.33 75.0
I-94 55 67.6 6.35 74.00 0.87 0.63 55 58.7 4.62 64.00 0.35 0.08 66.81 6.70 74.0
I-94 55 67.8 6.15 74.00 0.91 0.66 55 59.5 4.22 63.00 0.36 0.06 66.89 6.46 74.0
I-94 55 66.4 6.85 73.15 0.79 0.57 55 58.5 3.94 62.00 0.30 0.02 65.29 7.04 73.0
I-94 55 65.7 6.19 72.15 0.80 0.52 55 57.8 4.38 62.00 0.23 0.01 64.82 6.48 72.0
I-94 55 64.3 6.05 70.00 0.75 0.44 55 57.9 3.98 62.00 0.30 0.01 63.63 6.16 69.0
I-94 55 68.3 7.48 75.00 0.88 0.65 55 60.9 5.20 65.15 0.50 0.15 67.75 7.57 74.0
I-94 55 66.7 6.59 73.00 0.81 0.63 55 58.4 3.80 62.00 0.29 0.02 65.89 6.82 72.0
I-94 55 61.6 7.58 69.00 0.57 0.30 55 55.0 4.73 60.00 0.14 0.01 60.62 7.57 68.0
I-94 55 63.8 6.97 71.00 0.67 0.44 55 57.5 4.74 62.00 0.28 0.02 62.74 7.05 70.0
I-94 55 65.8 6.41 72.15 0.77 0.54 55 58.3 4.82 63.00 0.33 0.03 65.23 6.56 72.0
I-94 55 70.5 5.95 76.00 0.94 0.81 55 61.4 3.91 65.00 0.59 0.13 68.93 6.58 76.0
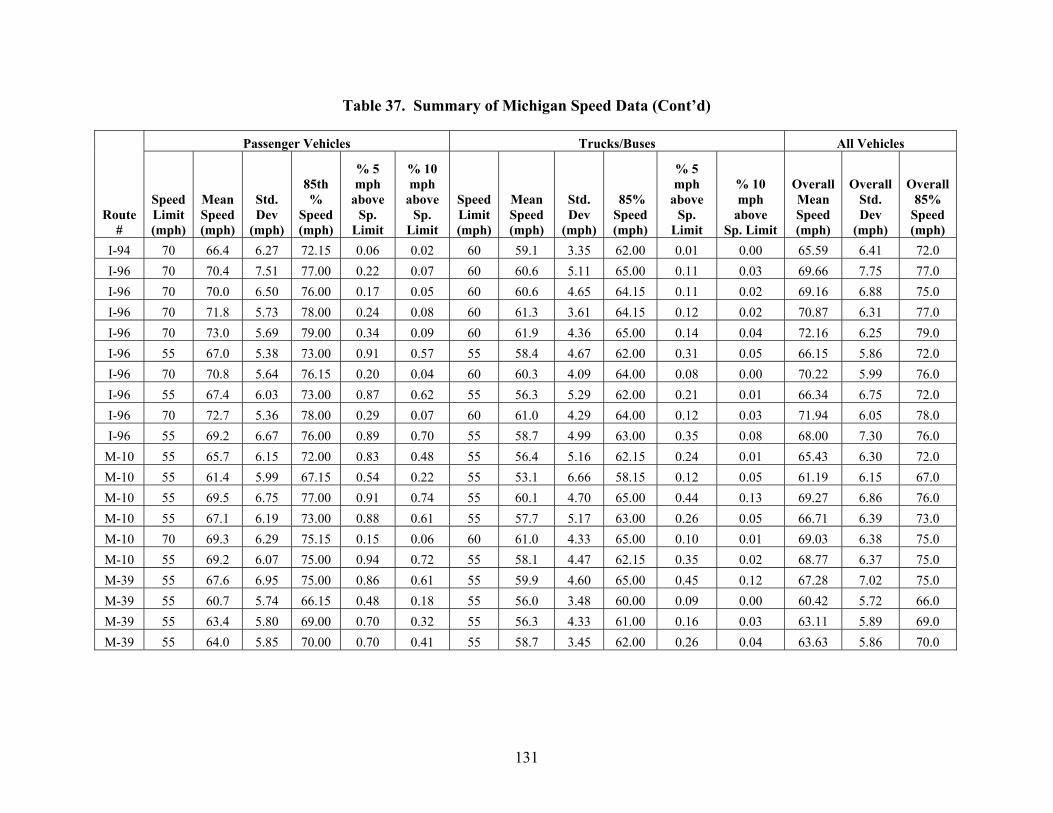
131
Table 37. Summary of Michigan Speed Data (Cont’d)
Route #
Passenger Vehicles Trucks/Buses All Vehicles
Speed Limit (mph)
Mean Speed (mph)
Std. Dev
(mph)
85th %
Speed (mph)
% 5 mph
above Sp.
Limit
% 10 mph
above Sp.
Limit
Speed Limit (mph)
Mean Speed (mph)
Std. Dev
(mph)
85% Speed (mph)
% 5 mph
above Sp.
Limit
% 10 mph
above Sp. Limit
Overall Mean Speed (mph)
Overall Std. Dev
(mph)
Overall 85%
Speed (mph)
I-94 70 66.4 6.27 72.15 0.06 0.02 60 59.1 3.35 62.00 0.01 0.00 65.59 6.41 72.0
I-96 70 70.4 7.51 77.00 0.22 0.07 60 60.6 5.11 65.00 0.11 0.03 69.66 7.75 77.0
I-96 70 70.0 6.50 76.00 0.17 0.05 60 60.6 4.65 64.15 0.11 0.02 69.16 6.88 75.0
I-96 70 71.8 5.73 78.00 0.24 0.08 60 61.3 3.61 64.15 0.12 0.02 70.87 6.31 77.0
I-96 70 73.0 5.69 79.00 0.34 0.09 60 61.9 4.36 65.00 0.14 0.04 72.16 6.25 79.0
I-96 55 67.0 5.38 73.00 0.91 0.57 55 58.4 4.67 62.00 0.31 0.05 66.15 5.86 72.0
I-96 70 70.8 5.64 76.15 0.20 0.04 60 60.3 4.09 64.00 0.08 0.00 70.22 5.99 76.0
I-96 55 67.4 6.03 73.00 0.87 0.62 55 56.3 5.29 62.00 0.21 0.01 66.34 6.75 72.0
I-96 70 72.7 5.36 78.00 0.29 0.07 60 61.0 4.29 64.00 0.12 0.03 71.94 6.05 78.0
I-96 55 69.2 6.67 76.00 0.89 0.70 55 58.7 4.99 63.00 0.35 0.08 68.00 7.30 76.0
M-10 55 65.7 6.15 72.00 0.83 0.48 55 56.4 5.16 62.15 0.24 0.01 65.43 6.30 72.0
M-10 55 61.4 5.99 67.15 0.54 0.22 55 53.1 6.66 58.15 0.12 0.05 61.19 6.15 67.0
M-10 55 69.5 6.75 77.00 0.91 0.74 55 60.1 4.70 65.00 0.44 0.13 69.27 6.86 76.0
M-10 55 67.1 6.19 73.00 0.88 0.61 55 57.7 5.17 63.00 0.26 0.05 66.71 6.39 73.0
M-10 70 69.3 6.29 75.15 0.15 0.06 60 61.0 4.33 65.00 0.10 0.01 69.03 6.38 75.0
M-10 55 69.2 6.07 75.00 0.94 0.72 55 58.1 4.47 62.15 0.35 0.02 68.77 6.37 75.0
M-39 55 67.6 6.95 75.00 0.86 0.61 55 59.9 4.60 65.00 0.45 0.12 67.28 7.02 75.0
M-39 55 60.7 5.74 66.15 0.48 0.18 55 56.0 3.48 60.00 0.09 0.00 60.42 5.72 66.0
M-39 55 63.4 5.80 69.00 0.70 0.32 55 56.3 4.33 61.00 0.16 0.03 63.11 5.89 69.0
M-39 55 64.0 5.85 70.00 0.70 0.41 55 58.7 3.45 62.00 0.26 0.04 63.63 5.86 70.0

132
Table 37. Summary of Michigan Speed Data (Cont’d)
Route #
Passenger Vehicles Trucks/Buses All Vehicles
Speed Limit (mph)
Mean Speed (mph)
Std. Dev
(mph)
85th %
Speed (mph)
% 5 mph
above Sp.
Limit
% 10 mph
above Sp.
Limit
Speed Limit (mph)
Mean Speed (mph)
Std. Dev
(mph)
85% Speed (mph)
% 5 mph
above Sp.
Limit
% 10 mph
above Sp. Limit
Overall Mean Speed (mph)
Overall Std. Dev
(mph)
Overall 85%
Speed (mph)
I-69 70 70.82 4.72 76 0.185 0.000 60 62.01 2.74 65 0.010 0.000 69.47 5.81 72.0
I-69 70 73.42 3.74 77 0.290 0.045 60 62.77 3.38 65 0.020 0.010 70.96 6.38 75.0
I-196 70 74.94 4.36 79 0.425 0.085 60 63.27 3.18 65 0.150 0.060 74.26 7.09 76.0
I-196 70 73.17 4.82 78 0.275 0.030 60 63.28 3.68 66 0.210 0.050 72.64 6.51 75.0
I-196 70 73.66 4.39 78 0.350 0.035 60 62.71 3.71 65 0.140 0.040 73.32 6.72 76.0
I-69 70 74.19 4.34 78 0.330 0.040 60 63.19 3.04 65 0.150 0.050 71.70 6.46 74.0
I-69 70 74.75 4.77 79 0.385 0.120 60 62.02 2.66 64 0.070 0.010 71.95 7.46 75.0
I-69 70 74.39 4.52 78 0.340 0.070 60 62.20 2.77 64 0.060 0.010 70.92 7.12 75.0
I-69 70 72.27 4.52 76 0.195 0.030 60 60.30 2.90 63 0.020 0.000 70.04 7.18 74.0
I-69 70 74.24 3.14 77 0.355 0.000 60 63.40 2.04 65 0.070 0.000 71.14 5.88 75.0
I-69 70 74.19 5.42 79 0.405 0.095 60 61.51 2.87 64 0.020 0.010 71.15 7.73 76.0
I-69 70 76.48 1.70 78 0.695 0.005 60 63.08 1.61 65 0.050 0.000 74.34 6.87 77.0
I-75 70 76.33 4.86 81 0.530 0.175 60 62.76 2.94 65 0.110 0.020 75.51 8.07 78.0
I-75 70 76.28 4.44 80 0.570 0.135 60 62.55 3.45 65 0.130 0.040 75.34 7.91 78.0
I-75 70 75.90 4.55 80 0.490 0.145 60 63.18 3.99 67 0.230 0.070 75.05 7.78 78.0
I-75 70 73.59 4.09 77 0.290 0.045 60 62.80 2.80 65 0.090 0.020 68.76 6.08 73.0
I-75 70 74.30 5.39 79 0.385 0.100 60 62.84 2.61 65 0.100 0.000 69.54 7.00 74.0
I-94 70 73.87 4.31 78 0.335 0.065 60 62.42 2.99 65 0.100 0.020 70.98 6.79 75.0
I-94 70 74.23 4.08 78 0.335 0.055 60 62.28 2.87 65 0.100 0.010 70.45 6.76 74.0
I-94 70 75.28 4.43 80 0.435 0.120 60 61.72 2.73 64 0.060 0.000 74.07 7.28 75.0
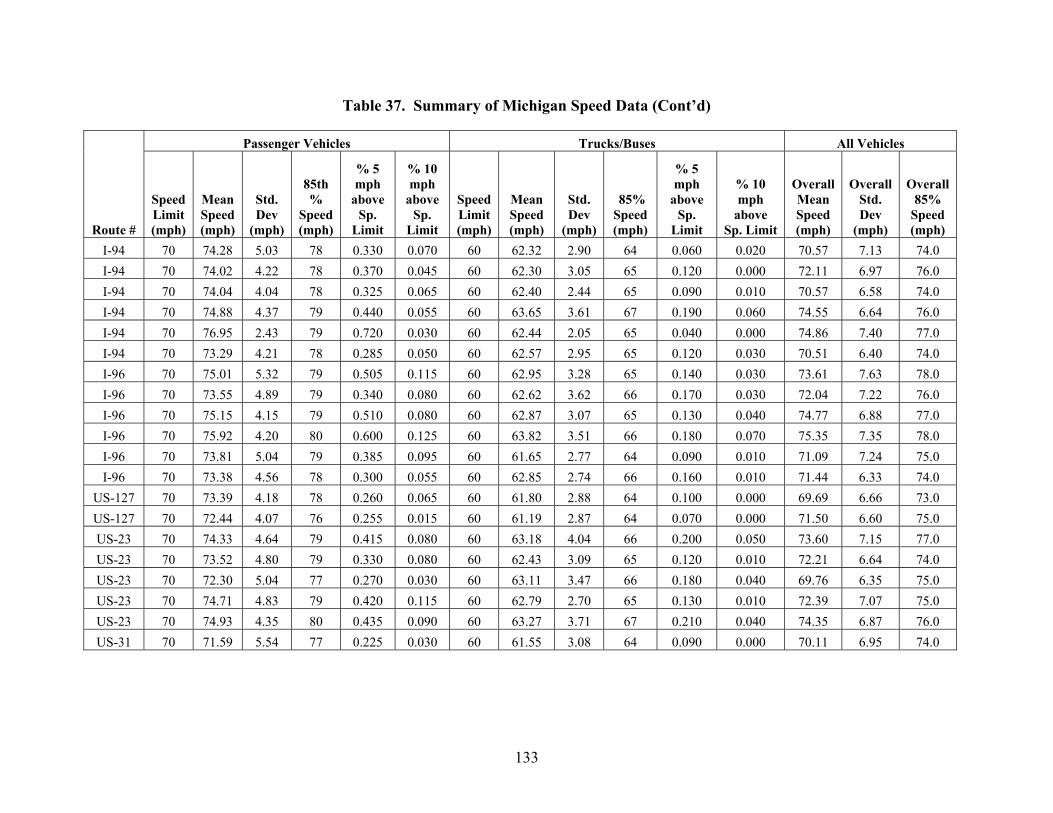
133
Table 37. Summary of Michigan Speed Data (Cont’d)
Route #
Passenger Vehicles Trucks/Buses All Vehicles
Speed Limit (mph)
Mean Speed (mph)
Std. Dev
(mph)
85th %
Speed (mph)
% 5 mph
above Sp.
Limit
% 10 mph
above Sp.
Limit
Speed Limit (mph)
Mean Speed (mph)
Std. Dev
(mph)
85% Speed (mph)
% 5 mph
above Sp.
Limit
% 10 mph
above Sp. Limit
Overall Mean Speed (mph)
Overall Std. Dev
(mph)
Overall 85%
Speed (mph)
I-94 70 74.28 5.03 78 0.330 0.070 60 62.32 2.90 64 0.060 0.020 70.57 7.13 74.0
I-94 70 74.02 4.22 78 0.370 0.045 60 62.30 3.05 65 0.120 0.000 72.11 6.97 76.0
I-94 70 74.04 4.04 78 0.325 0.065 60 62.40 2.44 65 0.090 0.010 70.57 6.58 74.0
I-94 70 74.88 4.37 79 0.440 0.055 60 63.65 3.61 67 0.190 0.060 74.55 6.64 76.0
I-94 70 76.95 2.43 79 0.720 0.030 60 62.44 2.05 65 0.040 0.000 74.86 7.40 77.0
I-94 70 73.29 4.21 78 0.285 0.050 60 62.57 2.95 65 0.120 0.030 70.51 6.40 74.0
I-96 70 75.01 5.32 79 0.505 0.115 60 62.95 3.28 65 0.140 0.030 73.61 7.63 78.0
I-96 70 73.55 4.89 79 0.340 0.080 60 62.62 3.62 66 0.170 0.030 72.04 7.22 76.0
I-96 70 75.15 4.15 79 0.510 0.080 60 62.87 3.07 65 0.130 0.040 74.77 6.88 77.0
I-96 70 75.92 4.20 80 0.600 0.125 60 63.82 3.51 66 0.180 0.070 75.35 7.35 78.0
I-96 70 73.81 5.04 79 0.385 0.095 60 61.65 2.77 64 0.090 0.010 71.09 7.24 75.0
I-96 70 73.38 4.56 78 0.300 0.055 60 62.85 2.74 66 0.160 0.010 71.44 6.33 74.0
US-127 70 73.39 4.18 78 0.260 0.065 60 61.80 2.88 64 0.100 0.000 69.69 6.66 73.0
US-127 70 72.44 4.07 76 0.255 0.015 60 61.19 2.87 64 0.070 0.000 71.50 6.60 75.0
US-23 70 74.33 4.64 79 0.415 0.080 60 63.18 4.04 66 0.200 0.050 73.60 7.15 77.0
US-23 70 73.52 4.80 79 0.330 0.080 60 62.43 3.09 65 0.120 0.010 72.21 6.64 74.0
US-23 70 72.30 5.04 77 0.270 0.030 60 63.11 3.47 66 0.180 0.040 69.76 6.35 75.0
US-23 70 74.71 4.83 79 0.420 0.115 60 62.79 2.70 65 0.130 0.010 72.39 7.07 75.0
US-23 70 74.93 4.35 80 0.435 0.090 60 63.27 3.71 67 0.210 0.040 74.35 6.87 76.0
US-31 70 71.59 5.54 77 0.225 0.030 60 61.55 3.08 64 0.090 0.000 70.11 6.95 74.0

134
Table 38. Summary of Indiana Speed Data
Route #
Passenger Vehicles Trucks/Buses All Vehicles
Speed Limit (mph)
Mean Speed (mph)
Std. Dev
(mph)
85th %
Speed (mph)
% 5 mph
above Sp.
Limit
% 10 mph
above Sp.
Limit
Speed Limit (mph)
Mean Speed (mph)
Std. Dev
(mph)
85% Speed (mph)
% 5 mph
above Sp.
Limit
% 10 mph
above Sp. Limit
Overall Mean Speed (mph)
Overall Std. Dev
(mph)
Overall 85%
Speed (mph)
I-265 55 62.1 5.71 67.00 0.60 0.25 55 58.3 3.69 62.00 0.30 0.02 61.80 5.66 67.0
I-265 55 59.6 4.77 65.00 0.37 0.11 55 55.4 4.65 60.00 0.11 0.02 59.18 4.88 64.0
I-265 55 61.5 5.50 67.00 0.54 0.21 55 57.8 4.21 62.00 0.22 0.05 61.08 5.48 67.0
I-465 55 65.3 5.16 70.00 0.84 0.48 55 60.1 3.25 64.00 0.43 0.04 64.94 5.20 70.0
I-465/74 55 65.9 5.48 72.00 0.84 0.48 55 60.7 3.79 65.00 0.50 0.14 65.42 5.55 71.0
I-65 55 63.7 5.37 69.00 0.71 0.35 55 59.4 3.85 63.00 0.39 0.05 63.40 5.39 69.0
I-65 55 61.9 forma 67.00 0.58 0.21 55 57.7 3.19 61.00 0.21 0.00 60.84 4.68 66.0
I-65 55 60.5 5.17 65.00 0.43 0.15 55 57.0 2.97 60.00 0.11 0.00 59.77 4.99 65.0
I-65 55 65.6 5.62 71.00 0.82 0.51 55 59.2 3.80 62.15 0.34 0.05 65.11 5.74 71.0
I-70 50 59.3 5.09 65.00 0.37 0.13 50 54.2 4.11 59.00 0.05 0.00 58.69 5.25 65.0
I-70 55 64.3 5.32 70.00 0.77 0.39 55 58.0 3.46 62.00 0.25 0.01 62.88 5.59 69.0
I-869 55 68.4 5.98 73.00 0.93 0.69 55 61.4 3.80 65.00 0.62 0.11 67.26 6.22 73.0
I-94/80 55 70.7 6.56 77.15 0.94 0.77 55 60.9 3.02 64.00 0.49 0.06 69.54 7.00 77.0
I-94/80 55 70.1 6.56 77.15 0.93 0.76 55 59.9 3.19 63.00 0.42 0.03 68.37 7.20 76.0
I-94/80 55 70.4 6.83 77.00 0.92 0.76 55 60.0 4.76 65.00 0.49 0.08 68.22 7.70 76.0
I-94/80 55 68.7 5.72 74.15 0.92 0.71 55 58.7 3.67 63.00 0.28 0.06 67.39 6.42 74.0
I-94/80 55 72.3 6.08 79.00 0.99 0.88 55 60.8 3.79 65.00 0.55 0.06 70.50 7.11 78.0
I-94/80 55 70.1 7.07 77.00 0.90 0.74 55 59.5 3.88 63.00 0.35 0.06 68.76 7.61 76.0
I-94/80 55 69.8 7.34 77.00 0.89 0.72 55 60.8 3.34 64.00 0.53 0.06 68.49 7.56 76.0
I-94/80 55 70.8 6.88 78.00 0.92 0.79 55 60.8 4.23 65.00 0.52 0.12 69.14 7.49 78.0
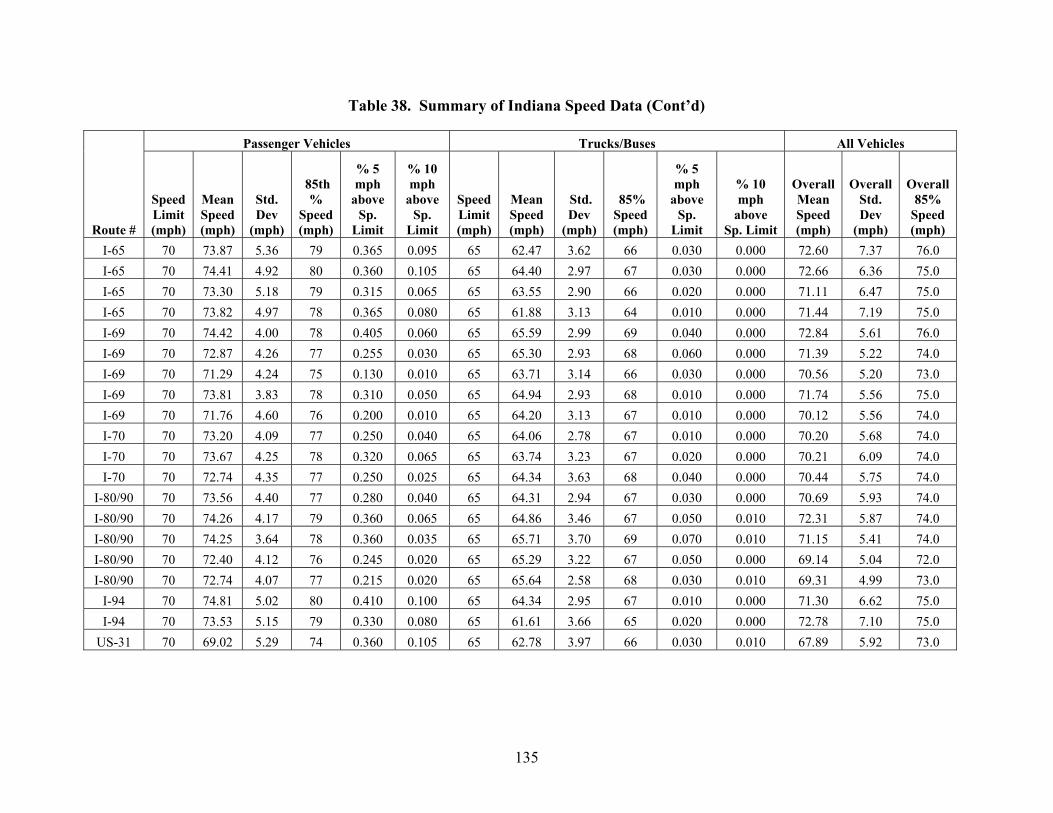
135
Table 38. Summary of Indiana Speed Data (Cont’d)
Route #
Passenger Vehicles Trucks/Buses All Vehicles
Speed Limit (mph)
Mean Speed (mph)
Std. Dev
(mph)
85th %
Speed (mph)
% 5 mph
above Sp.
Limit
% 10 mph
above Sp.
Limit
Speed Limit (mph)
Mean Speed (mph)
Std. Dev
(mph)
85% Speed (mph)
% 5 mph
above Sp.
Limit
% 10 mph
above Sp. Limit
Overall Mean Speed (mph)
Overall Std. Dev
(mph)
Overall 85%
Speed (mph)
I-65 70 73.87 5.36 79 0.365 0.095 65 62.47 3.62 66 0.030 0.000 72.60 7.37 76.0
I-65 70 74.41 4.92 80 0.360 0.105 65 64.40 2.97 67 0.030 0.000 72.66 6.36 75.0
I-65 70 73.30 5.18 79 0.315 0.065 65 63.55 2.90 66 0.020 0.000 71.11 6.47 75.0
I-65 70 73.82 4.97 78 0.365 0.080 65 61.88 3.13 64 0.010 0.000 71.44 7.19 75.0
I-69 70 74.42 4.00 78 0.405 0.060 65 65.59 2.99 69 0.040 0.000 72.84 5.61 76.0
I-69 70 72.87 4.26 77 0.255 0.030 65 65.30 2.93 68 0.060 0.000 71.39 5.22 74.0
I-69 70 71.29 4.24 75 0.130 0.010 65 63.71 3.14 66 0.030 0.000 70.56 5.20 73.0
I-69 70 73.81 3.83 78 0.310 0.050 65 64.94 2.93 68 0.010 0.000 71.74 5.56 75.0
I-69 70 71.76 4.60 76 0.200 0.010 65 64.20 3.13 67 0.010 0.000 70.12 5.56 74.0
I-70 70 73.20 4.09 77 0.250 0.040 65 64.06 2.78 67 0.010 0.000 70.20 5.68 74.0
I-70 70 73.67 4.25 78 0.320 0.065 65 63.74 3.23 67 0.020 0.000 70.21 6.09 74.0
I-70 70 72.74 4.35 77 0.250 0.025 65 64.34 3.63 68 0.040 0.000 70.44 5.75 74.0
I-80/90 70 73.56 4.40 77 0.280 0.040 65 64.31 2.94 67 0.030 0.000 70.69 5.93 74.0
I-80/90 70 74.26 4.17 79 0.360 0.065 65 64.86 3.46 67 0.050 0.010 72.31 5.87 74.0
I-80/90 70 74.25 3.64 78 0.360 0.035 65 65.71 3.70 69 0.070 0.010 71.15 5.41 74.0
I-80/90 70 72.40 4.12 76 0.245 0.020 65 65.29 3.22 67 0.050 0.000 69.14 5.04 72.0
I-80/90 70 72.74 4.07 77 0.215 0.020 65 65.64 2.58 68 0.030 0.010 69.31 4.99 73.0
I-94 70 74.81 5.02 80 0.410 0.100 65 64.34 2.95 67 0.010 0.000 71.30 6.62 75.0
I-94 70 73.53 5.15 79 0.330 0.080 65 61.61 3.66 65 0.020 0.000 72.78 7.10 75.0
US-31 70 69.02 5.29 74 0.360 0.105 65 62.78 3.97 66 0.030 0.010 67.89 5.92 73.0

136
Table 39. Summary of Ohio Speed Data
Route #
Passenger Vehicles Trucks/Buses All Vehicles
Speed Limit (mph)
Mean Speed (mph)
Std. Dev
(mph)
85th %
Speed (mph)
% 5 mph
above Sp.
Limit
% 10 mph
above Sp.
Limit
Speed Limit (mph)
Mean Speed (mph)
Std. Dev
(mph)
85% Speed (mph)
% 5 mph
above Sp.
Limit
% 10 mph
above Sp. Limit
Overall Mean Speed (mph)
Overall Std. Dev
(mph)
Overall 85%
Speed (mph)
I-280 65 64.6 4.89 70.00 0.12 0.01 65 60.2 3.77 64.00 0.00 0.00 63.57 5.00 69.0
I-280 60 67.2 4.81 72.00 0.62 0.25 55 62.0 3.77 65.15 0.63 0.02 65.35 5.12 71.0
I-475 55 67.6 5.44 73.15 0.91 0.63 55 61.3 3.16 65.00 0.56 0.10 66.92 5.58 73.0
I-475 60 67.8 4.87 72.15 0.67 0.26 55 61.7 3.15 64.15 0.63 0.01 66.98 5.14 72.0
I-480 55 65.6 4.47 70.00 0.89 0.50 55 61.3 3.31 64.00 0.59 0.10 65.19 4.54 70.0
I-480 55 64.2 4.92 69.15 0.79 0.37 55 60.5 3.19 64.00 0.48 0.05 63.42 4.84 68.0
I-670 55 64.0 5.83 70.00 0.75 0.38 55 59.6 4.92 64.00 0.47 0.07 63.78 5.86 70.0
I-670 55 59.2 5.33 64.00 0.36 0.12 55 55.4 3.88 60.00 0.08 0.00 58.85 5.32 64.0
I-70 55 62.4 5.20 67.15 0.66 0.24 55 56.0 3.89 61.00 0.17 0.00 61.72 5.45 67.0
I-70 55 61.7 6.07 68.00 0.63 0.28 55 57.9 4.61 62.00 0.27 0.03 61.43 6.04 68.0
I-71 65 63.9 5.13 69.00 0.07 0.02 65 57.7 6.66 64.00 0.01 0.00 63.57 5.43 69.0
I-71 55 61.8 5.48 67.00 0.59 0.21 55 56.9 4.60 62.00 0.23 0.01 61.59 5.52 67.0
I-71 55 65.5 4.72 70.00 0.88 0.52 55 60.3 4.83 65.00 0.49 0.12 64.96 4.98 70.0
I-71 55 65.4 5.44 70.00 0.83 0.48 55 58.5 3.98 62.15 0.28 0.03 65.10 5.61 70.0
I-71 55 55.6 5.09 60.00 0.12 0.03 55 50.5 4.62 54.00 0.02 0.01 55.10 5.25 60.0
I-74 65 62.9 5.46 69.00 0.09 0.02 65 58.5 5.05 64.00 0.01 0.00 62.83 5.43 69.0
I-75 55 68.6 6.39 75.00 0.90 0.67 55 61.2 3.55 65.00 0.60 0.10 65.65 6.51 72.3
I-75 55 64.8 4.86 69.00 0.84 0.44 55 60.3 4.39 64.15 0.48 0.12 64.45 4.95 69.0
I-90 55 59.5 5.93 66.00 0.41 0.18 55 53.7 6.05 60.00 0.14 0.01 59.00 6.13 66.0
I-90/271 65 65.1 4.13 70.00 0.11 0.02 65 61.7 3.77 65.00 0.01 0.00 64.03 4.30 68.0

137
Table 39. Summary of Ohio Speed Data (Cont’d)
Route #
Passenger Vehicles Trucks/Buses All Vehicles
Speed Limit (mph)
Mean Speed (mph)
Std. Dev
(mph)
85th %
Speed (mph)
% 5 mph
above Sp.
Limit
% 10 mph
above Sp.
Limit
Speed Limit (mph)
Mean Speed (mph)
Std. Dev
(mph)
85% Speed (mph)
% 5 mph
above Sp.
Limit
% 10 mph
above Sp. Limit
Overall Mean Speed (mph)
Overall Std. Dev
(mph)
Overall 85%
Speed (mph)
I-70 65 73.50 3.72 77 0.285 0.030 65 64.98 3.42 69 0.040 0.000 72.11 5.52 75.0
I-70 65 72.77 4.80 77 0.265 0.055 65 65.44 3.68 70 0.070 0.000 70.62 5.63 73.0
I-71 65 74.61 4.47 79 0.435 0.080 65 65.94 3.39 70 0.090 0.000 73.98 6.02 77.0
I-71 65 73.93 4.13 78 0.345 0.055 65 65.83 4.34 70 0.130 0.020 73.27 5.80 76.0
I-71 65 72.26 4.23 76 0.185 0.015 65 65.12 4.56 69 0.090 0.010 71.72 5.64 75.0
I-71 65 73.80 4.03 77 0.320 0.040 65 64.13 4.96 69 0.060 0.000 72.82 6.55 76.0
I-71 65 74.94 4.11 79 0.435 0.080 65 64.25 5.35 70 0.140 0.000 74.23 7.24 77.0
I-75 70 71.60 4.41 76 0.180 0.025 70 64.91 3.09 68 0.000 0.000 69.41 5.10 71.0
I-75 70 73.46 4.29 78 0.270 0.055 70 64.85 3.29 68 0.000 0.000 72.62 5.70 75.0
I-75 70 72.61 3.75 76 0.225 0.015 70 65.99 3.24 70 0.010 0.000 71.82 4.86 74.0
I-75 70 72.18 3.97 76 0.160 0.020 70 65.28 3.15 68 0.000 0.000 71.14 4.86 73.0
I-75 70 72.69 4.72 77 0.240 0.050 70 65.00 3.82 69 0.000 0.000 71.53 5.89 74.0
I-75 70 71.23 3.86 75 0.120 0.005 70 64.89 3.77 68 0.010 0.000 70.06 4.89 72.0
I-80/90 70 72.49 3.86 76 0.170 0.040 70 64.29 3.46 68 0.000 0.000 69.06 5.28 72.0
I-80/90 70 74.34 3.46 78 0.330 0.030 70 66.32 3.62 70 0.010 0.000 72.50 5.32 75.2
I-80/90 70 74.25 4.09 78 0.375 0.045 70 66.10 4.33 70 0.010 0.010 72.48 5.74 76.0
I-80/90 70 74.53 3.69 78 0.400 0.050 70 66.29 3.85 70 0.010 0.000 72.65 5.55 76.0
I-80/90 70 73.86 3.91 77 0.330 0.045 70 66.32 3.55 70 0.010 0.000 71.24 5.18 75.0
I-80/90 70 74.64 4.29 78 0.395 0.075 70 67.08 3.36 70 0.000 0.000 73.18 5.62 77.0
I-80/90 70 74.90 3.60 79 0.415 0.060 70 66.07 4.30 70 0.010 0.010 73.11 5.85 76.0
138
References:
1. Solomon, D., Accidents on Main Rural Highways Related to Speed, Driver, and Vehicle. United States Burearu of Public Roads, Washington, D.C., 1964.
2. Cirillo, J.A., Interstate System Accident Research Study II, Interim Report II. Public Roads, Vol. 35, No. 3, pp. 71-75, 1968.
3. Greenstone, M., A Reexamination of Resource Allocation Responses to the 65‐MPH Speed Limit. Economic Inquiry, Vol. 40, No 2., pp. 271-278, 2002.
4. Ledolter, J. and Chan, K., Evaluating the Impact of the 65 MPH Maximum Speed Limit on Iowa Rural Interstates. The American Statistician, Vol. 50, No. 1, pp. 79-85, 1996.
5. Baum, H.M., Lund, A.K. and Wells, J.K., The Mortality Consequences of Raising the Speed Limit to 65 MPH on Rural Interstates. American Journal of Public Health, Vol. 79, No. 10, pp. 1392-1395, 1989.
6. Baum, H.M.,Wells, J.K. and Lund, A.K., The Fatality Consequences of the 65 MPH Speed Limits. Journal of Safety Research, Vol. 22, No. 4, pp. 171-177, 1992.
7. McKnight, A.J. and Klein, T.M., Relationship of 65-MPH Limit to Speeds and Fatal Accidents. Transportation Research Record No. 1281: Journal of the Transportation Research Board, pp. 71-77, 1990.
8. Wagenaar, A.C., Streff, F.M. and Schultz, R.H., Effects of the 65 MPH Speed Limit on Injury Morbidity and Mortality. Accident Analysis & Prevention, Vol. 22, No. 6, pp. 571-585, 1990.
9. Gallaher, M.M., Sewel, C.M., Flint, S., Herndon, J.L., Graff, H., Fenner, J. and Hull, H.F., Effects of the 65-MPH Speed Limit on Rural Interstate Fatalities in New Mexico. Journal of the American Medical Association, Vol. 262, No. 16, pp. 2243-2245, 1989.
10. Upchurch, J., Arizona's Experience with the 65-MPH Speed Limit. Transportation Research Record No. 1244: Journal of the Transportation Research Board, pp. 1-6, 1989.
11. Farmer, C.M., Retting, R.A. and Lund, A.K., Changes in Motor Vehicle Occupant Fatalities After Repeal of the National Maximum Speed Limit. Accident Analysis & Prevention, Vol. 31, No. 5, pp. 537-543, 1999.
12. Patterson, T.L., Frith, W.J., Poveya, L.J., and Keallaand, M.D., The Effect of Increasing Rural Interstate Speed Limits in the United States. Traffic Injury Prevention, Vol. 3, No. 4, pp. 316-320, 2002.
13. Haselton, C.B., Gibby, A.R. and Ferrara, T.C., Methodologies Used to Analyze Collision Experience Associated with Speed Limit Changes on Selected California Highways. Transportation Research Record No. 1784: Journal of the Transportation Research Board, pp. 65-72, 2002.
14. Najjar, Y.M., Russell, E.R., Stokes, R.W. and Abu-Lebden, G., New Speed Limits on Kansas Highways: Impact on Crashes and Fatalities. Transportation Research Forum: Journal of the Transportation Research Forum, Vol. 56, No 4., pp. 119-147, 2002.
15. Forester, T.H., McNown, R.F. and Singell, L.D., A Cost-Benefit Analysis of the 55 MPH Speed Limit. Southern Economic Journal, Vol. 50, No. 3, pp. 631-641, 1984.
16. Burritt, B., Moghrabi, A. and Matthias, J., Analysis of the Relation of Accidents and the 88-KM/H (55-MPH) Speed Limit on Arizona Highways (Abridgement). Transportation Research Record No. 609: Journal of the Transportation Research Board, pp. 34-35, 1976.
139
17. Dart Jr, O., Effects of the 88.5-KM/H (55-MPH) Speed Limit and Its Enforcement on Traffic Speeds and Accidents. Transportation Research Record No. 643: Journal of the Transportation Research Board, pp. 23-32, 1977.
18. Weckesser, P.M., Gage, J.R., Hoffman, T., Horner, G.S., Kyte, G., Litwornia, A.J., Richie, S.M. and Streb, P.L., Implications of the Mandatory 55 MPH National Speed Limit. Traffic Engineering, Vo. 47, No .2, pp. 21-28, 1977.
19. Tofany, V.L., Life is Best at 55. Traffic Quarterly, Vol. 35, No.1, pp. 5-19, 1981. 20. Deen, T.B. and Godwin, S.R., Safety Benefits of the 55 mph Speed Limit. Transportation
Quarterly, Vol. 39, No. 3, 1985. 21. Hoskin, A.F., Consequences of Raising the Speed Limit. Journal of Safety Research, Vol.
17, No.4, pp. 179-182, 1987. 22. Lynn, C. and Jernigan, J.D., The Impact of the 65 MPH Speed Limit on Virginia's Rural
Interstate Highways through 1990, Virginia Transportation Research Council, 1992. 23. Ossiander, E.M. and Cummings, P., Freeway Speed Limits and Traffic Fatalities in
Washington State. Accident Analysis & Prevention, Vol. 34, No. 1, pp. 13-18, 2002. 24. Garber, S. and Graham, J.D., The Effects of the New 65 Mile-Per-Hour Speed Limit on
Rural Highway Fatalities: A State-by-State Analysis. Accident Analysis & Prevention, Vol. 22, No. 2, pp. 137-149, 1990.
25. Rock, S.M., Impact of the 65 MPH Speed Limit on Accidents, Deaths, and Injuries in Illinois. Accident Analysis & Prevention, Vol. 27, No. 2, pp. 207-214, 1995.
26. Taylor, W.C. and Maleck, T.L., An Evaluation of the Michigan 70 MPH Speed Limit. Michigan State University, 1996.
27. Taylor, W.C., The Impact of Raising the Speed Limit on Freeways in Michigan. Michigan State University, 2000.
28. Friedman, L.S., Hedeker, D. and Richter, E.D., Long-Term Effects of Repealing the National Maximum Speed Limit in the United States. American Journal of Public Health, Vol. 99, No. 9, pp. 1626-1631, 2009.
29. Pant, P.D., Adhami, J.A. and Niehaus, J.C., Effects of the 65-MPH Speed Limit on Traffic Accidents in Ohio. Transportation Research Record No. 1375: Journal of the Transportation Research Board, pp. 53-60, 1992.
30. Sidhu, C.S., Preliminary Assessment of the Increased Speed Limit on Rural Interstate Highways in Illinois (Abridgment). Transportation Research Record No. 1281: Journal of the Transportation Research Board, pp. 78-83, 1990.
31. Chang, G.L. and Paniati, J.F., Effects of 65-MPH Speed Limit on Traffic Safety. Journal of Transportation Engineering, Vol. 116, No. 2, pp. 213-226, 1990.
32. Labrum, W.D., The 55 MPH Speed Limit and Fatality Reduction in Utah. Traffic Engineering, Vol. 46, No. 9, 1976.
33. Lave, C. and Elias, P., Did the 65 MPH Speed Limit Save Lives?. Accident Analysis & Prevention, Vol. 26, No 1., pp. 49-62, 1994.
34. McCarthy, P.S., Public Policy and Highway Safety: A City-Wide Perspective. Regional Science and Urban Economics, Vol. 29, No 2., pp. 231-244., 1999.
35. Lave, C. and Elias, P., Resource Allocation in Public Policy: The Effects of the 65‐MPH Speed Limit. Economic Inquiry, Vol. 35, No. 3, pp. 614-620, 1997.
36. Houston, D.J., Implications of the 65-MPH Speed Limit for Traffic Safety. Evaluation Review, Vol. 23, No 3., pp. 304-315, 1999.

140
37. Research Triangle Institute, Speed and Accidents: Volume I. National Highway Safety Burearu, 1970.
38. West, L.B. and Dunn, J., Accidents, Speed Deviation and Speed Limits. Institute of Traffic Engineering, 1971.
39. Fildes, B., Rumbold, G. and Leening, A., Speed Behaviour and Drivers’ Attitude to Speeding. Monash University Accident Research Centre, 1991.
40. Maycock, G., Brocklebank, P. and Hall, R., Road Layout Design Standards and Driver Behavior. Proceedings of the ICE-Transport, Vol. 135, No. 3, pp. 115-122, 1999.
41. Quimby, A., Maycock, G., Palmer, C., and Buttress, S., The Factors that Influence a Driver's Choice of Speed: A Questionnaire Study. Transport Research Laboratory Report No. 325, 1999.
42. Finch, D., Kompfner, P., Lockwood, C.R. and Mayock, G., Speed, Speed Limits and Crashes. Transport Research Laboratory Report No. 58, Crowthorne, 1994.
43. Taylor, M., Lynam, D.A. and Baruya, A., The Effects of Drivers' Speed on the Frequency of Road Accidents. Transport Research Laboratory, Crowthorne, 2000.
44. Garber, N.J. and Gadiraju, R., Factors Affecting Speed Variance and Its Influence on Accidents. Transportation Research Record No. 1213: Journal of the Transportation Research Board, pp. 64-71, 1989.
45. Fowles, R. and Loeb, P.D., Speeding Coordination, and the 55 MPH Limit: Comment. American Economic Review, Vol. 79, No. 4, pp. 916-921, 1989.
46. Levy, D.T. and Asch, P., Speeding, Coordination, and the 55-MPH Limit: Comment. American Economic Review, Vol. 79, No. 4, pp. 913-915, 1989.
47. Solomon, D., Accidents on Main Rural Highways Related to Speed, Driver, and Vehicle. United States Burearu of Public Roads, Washington, D.C., 1964.
48. Zlatoper, T.J., Determinants of Motor Vehicle Deaths in the United States: A Cross-Sectional Analysis. Accident Analysis & Prevention, Vol. 23, No. 5, pp. 431-436, 1991.
49. Garber, N.J. and Ehrhart, A.A., Effect of Speed, Flow, and Geometric Characteristics on Crash Frequency for Two-Lane Highways. Transportation Research Record No. 1717: Journal of the Transportation Research Board, pp. 76-83, 2000.
50. Kinetic Energy, March 2014. 51. Committee for Guidance on Setting and Enforcing Speed Limits, Special Report 254:
Managing Speed: Review of Current Practice for Setting and Enforcing Speed Limits. Transportation Research Board, 1998.
52. Nilsson, G., Traffic Safety Dimensions and the Power Model to Describe the Effect of Speed on Safety. Lund University, 2004.
53. Transport Research Centre, Speed Management. European Conference of Ministers of Transport, 2006.
54. Kockelman, K., CRA International, Inc., Safety Impacts and Other Implications of Raised Speed Limits on High-Speed Roads. Transportation Research Board, 2006.
55. Salusjarvi, M., The Speed Limit Experiments on Public Roads in Finland. Technical Research Centre of Findland No. 7, 1981.
56. Egsmose, L. and Egsmose, T., Speed Limits Save Lives. World Health Forum, Vol. 6, No. 3, pp. 246-247, 1985.
57. Nilsson, G., Reduction in the Speed Limit from 110KM/H to 90KM/H During Summer 1989: Effects on Personal Injury Accidents, Injured, and Speeds. VTI Report No. 358A, 1990.

141
58. Johansson, P., Speed Limitation and Motorway Casualties: A Time Series Count Data Regression Approach. Accident Analysis & Prevention, Vol. 28, No 1., pp. 73-87, 1996.
59. Borsje, J., The Effects of the 1988 Differentiation of Speed Limits in the Netherlands. Road Safety in Europe and Strategic Highway Research Program (SHRP), France, 1994.
60. Sliogeris, J., 110 Kilometre per Hour Speed Limit-Evaluation of Road Safety Effects. VIC Roads, 1992.
61. Aarts, L. and Van Schagen, I., Driving Speed and the Risk of Road Crashes: A Review. Accident Analysis & Prevention, Vol. 38, No. 2, pp. 215-224, 2006.
62. American Association of State Highway and Transportation Officials, Policy on Geometric Design of Highways and Streets. Washington, D.C., 2001.
63. Emmerson, J., Speeds of Cars on Sharp Horizontal Curves. Traffic Engineering & Control, Vol. 11, No. 3, pp. 135-137, 1969.
64. McLean, J., Driver Speed Behaviour and Rural Road Alignment Design. Traffic Engineering & Control, Vol. 22, No. 4, pp. 208-211, 1981.
65. Glennon, J.C., Neuman, T.R. and Leisch, J.E., Safety and Operational Considerations for Design of Rural Highway Curves. Federal Highway Administration, 1985.
66. Lamm, R. and Choueiri, E.M., Recommendations for Evaluating Horizontal Design Consistency Based on Investigations in the State of New York. Transportation Research Board, 1987.
67. Kanellaidis, G., Golias, J. and Efstathiadis, S., Driver's Speed Behaviour on Rural Road Curves. Traffic Engineering & Control, Vol. 31, No. 7, pp. 414-415, 1990.
68. Islam, M. and Seneviratne, P., Evaluation of Design Consistency of Two-Lane Rural Highways. Institute of Traffic Engineers Journal, Vol. 64, No. 2, 1994.
69. Krammes, R.A., Brackett, R.Q., Shafer, M. A., Ottesen, J.L., Anderson, I.B., Fink, K.L., Collins, K.M., Pendleton, O.J. and Messer, C.J., Horizonal Alignment Design Consistency for Rural Two-Lane Highways. Texas Transportation Institute, 1993.
70. Voigt, A., Evaluation of Alternative Horizontal Curve Design Approaches on Rural Two-Lane Highways. Texas Transportation Institute, 1996.
71. Polus, A., Fitzpatrick, K. and Fambro, D.B., Predicting Operating Speeds on Tangent Sections of Two-Lane Rural Highways. Transportation Research Record: Journal of the Transportation Research Board No. 1737, pp. 50-57, 2000.
72. Al-Masaeid, H.R., Hammory, K. and Al-Omari, B.H., Consistency of Horizontal Alignment Under Adverse Weather Conditions. Road and Transport Research, Vol. 8, No. 3, pp. 55-67, 1999.
73. Andjus, V. and Maletin, M., Speeds of Cars on Horizontal Curves. Transportation Research Record: Journal of the Transportation Research Board No. 1612, pp. 42-47, 1998.
74. Abdelwahab, W., Aboul-Ela, M. and Morrall, J., Geometric Design Consistency Based on Speed Change on Horizontal Curves. Road and Transport Research, Vol. 1, 1998.
75. Schurr, K.S., McCoy, P.T., Pesti, G. and Huff, R., Relationship of Design, Operating, and Posted Speeds on Horizontal Curves of Rural Two-Lane Highways in Nebraska. Transportation Research Record: Journal of the Transportation Research Board No. 1796, pp. 60-71, 2002.
76. Fitzpatrick, K., Carlson, P. and Brewer, M.A., Wooldridge, M.D. and Miaou, S.P., NCHRP Report 504: Design Speed, Operating Speed, and Posted Speed Practices. Transportation Research Board, Washington, D.C., 2003.
142
77. Freedman, M. and Esterlitz, J.R., Effect of the 65 mph Speed Limit on Speeds in Three States. Transportation Research Record: Journal of the Transportation Research Board No. 1281, 1990.
78. Brown, D.B., Maghsoodloo, S. and McArdle, M.E., The Safety Impact of the 65 mph Speed Limit: A Case Study Using Alabama Accident Records. Journal of Safety Research, Vol. 21, No. 4, pp. 125-139, 1991.
79. Parker Jr, M., Effects of Raising and Lowering Speed Limits on Selected Roadway Sections. Federal Highway Administration, 1997.
80. Wilmot, C.G. and Khanal, M., Effect of Speed Limits on Speed and Safety: A Review. Transport Reviews, Vol. 19, No. 4, pp. 315-329, 1999.
81. Feng, C., Synthesis of Studies on Speed and Safety. Transportation Research Record: Journal of the Transportation Research Board No. 1779, pp. 86-92, 2001.
82. Mannering, F., Effects of Interstate Speed Limits on Driving Speeds: Some New Evidence. Proceedings of the Transportation Research Board 86th Annual Meeting, 2007.
83. Royal, D., National Survey of Speeding and Unsafe Driving Attitudes and Behaviors: 2002. National Highway Traffic Safety Administration, 2003.
84. Bham, G.H. and Mohammadi, M.A., Evaluation of Work Zone Speed Limits: An Objective and Subjective Analysis of Work Zones in Missouri. Mid-America Transportation Center, 2012.
85. Debnath, A.K., Blackman, R.A. and Haworth, N.L., A Review of the Effectiveness of Speed Control Measures in Roadwork Zones. Occupational Safety In Transport Conference, 2012.
86. Wasson, J.S., Boruff, G.W., Hainen, A. M., Remias, S.M., Hulme, E.A., Farnswroth, G.D. and Bullock, D.M., Evaluation of Spatial and Temporal Speed Limit Compliance in Highway Work Zones. Transportation Research Record: Journal of the Transportation Research Board No. 2258, pp. 1-15, 2011.
87. Finley, M.D., Field Evaluation of Motorist Reactions to Reduced Work Zone Speed Limits and Other Work Zone Conditions. Transportation Research Record: Journal of the Transportation Research Board No. 2258, pp. 40-48, 2011.
88. Brewer, M.A., Pesti, G. and Schneider, W., Improving Compliance with Work Zone Speed Limits Effectiveness of Selected Devices. Transportation Research Record: Journal of the Transportation Research Board No. 1948, pp. 67-76, 2006.
89. McMurtry, T., Riffkin, M., Heath, S. and Saito, M., Variable Speed Limits Signs: Effects on Speed and Speed Variation in Work Zones. Transportation Research Board 88th Annual Meeting Compendium of Papers, 2009.
90. Hou, Y., Edara, P. and Sun, C., Speed Limit Effectiveness in Short-Term Rural Interstate Work Zones. Transportation Letters: the International Journal of Transportation Research, Vol. 5, 2013.
91. Blake, P., Vehicle Speeds Through Roadworks Under Various Conditions. 16th ARRB Conference Proceedings, Vol. 16, No.4, 1992.
92. McCoy, P.T. and Heimann, J.E., School Speed Limits and Speeds in School Zones. Transportation Research Record: Journal of the Transportation Research Board No. 1254, 1990.
93. Saibel, C., Salzberg, P., Doane, R. and Moffat, J., Vehicle Speeds in School Zones. Insitute of Transportation Engineers Journal, Vol. 69, No. 11, pp. 38-43, 1999.
143
94. Young, E.J. and Dixon, K., The Effects of School Zones on Driver Behavior. Georgia Institute of Technology, 2003.
95. Ellison, A., Greaves, S. and Daniels, R., Speeding Behaviour in School Zones. Australasian College of Road Safety Conference, 2011.
96. Freedman, M. and Williams, A., Speeds Associated with 55-mph and 65-mph Speed Limits in Northeastern States. Insitute of Transportation Engineers Journal, Vol. 62, No. 2, pp. 17-21, 1992.
97. Johnson, S. and Murray, D., Empirical Analysis of Truck and Automobile Speeds on Rural Interstates: Impact of Posted Speed Limits. Transportation Research Board 89th Annual Meeting, 2010.
98. Harkey, D.L. and Mera, R., Safety Impacts of Different Speed Limits on Cars and Trucks. Federal Highway Administration, 1994.
99. National Highway Users Conference, State Laws Governing Motor Vehicle Speed Limits. Washington, D.C., 1963.
100. Ferguson, W.S., Truck Speeds in Virginia: A Study to Evaluate the Adequacy and Advisability of Differential Truck-Car Speed Limits. Virginia Highway Research Council, 1968.
101. Joscelyn, K. B., Jones, R. K. and Elston, P. A., Safety, Maximum Speed Limits: A Study for the Selection of Maximum Speed Limits. Institute for Research in Public Safety, Indiana University, 1970.
102. Hall, J. and Dickinson Jr., L.V., Truck Speeds and Accidents on Interstate Highways, Transportation Research Record, No. 486, pp. 19-32, 1974.
103. English, J.W. and Levin, S.H., Traffic Speed Limit Laws in the United States. National Highway Traffic Safety Administration, 1978.
104. National Highway Traffic Safety Administration, Preliminary Report to Congress on the 65 mph Speed Limit - Safety Effects in 1987. Washington D.C., 1988.
105. Baum, H.M., Esterlitz, J.R, Zador, P. and Penny, M., Different Speed Limits for Cars and Trucks: Do They Affect Vehicle Speeds? Transportation Research Record: Journal of the Transportation Research Board No. 1318, 1991.
106. Garber, N.J., Miller, J.S., Yuan, B., and Sun, X., The Safety Impacts of Differential Speed Limits on Rural Interstate Highways. Federal Highway Administration, 2005.
107. Malyshkina, N.V. and Mannering, F., Effect of Increases in Speed Limits on Severities of Injuries in Accidents. Transportation Research Record: Journal of the Transportation Research Board No. 2083, pp. 122-127, 2008.
108. Saifizul, A.A., Yamanaka, H. and Karim, M.R., Empirical Analysis of Gross Vehicle Weight and Free Flow Speed and Consideration on Its Relation with Differential Speed Limit. Accident Analysis & Prevention, Vol. 43, No. 3, pp. 1068-1073, 2011.
109. Dixon, M.P., Abdel-Rahim, A. and Elbassuoni, S., Evaluation of the Impacts of Differential Speed Limits on Interstate Highways in Idaho. University of Idaho, 2012.
110. Pasanen, E., Driving Speeds and Pedestrian Safety: A Mathematical Model. Helsinki, University, 1992.
111. Anderson, R.W., McLean, A.J., Farmer, M.J., Lee, B.H., and Brooks, C.G., Vehicle Travel Speeds and the Incidence of Fatal Pedestrian Crashes. Accident Analysis & Prevention, Vol. 29, No. 5, pp. 667-674, 1997.
112. Leaf, W.A. and Preusser, D.F., Literature Review on Vehicle Travel Speeds and Pedestrian Injuries. National Highway Traffic Safety Administration, 1999.
144
113. Pasanen, E., The Video Recording of Traffic Accidents. Helsinki, University, 1993. 114. Jensen, S.U., Safety of Pedestrians and Two-Wheelers. Road Directorate, 1998. 115. Kim, J.K., Kim, S., Ulfarsson, G. F. and Porrello, L.A., Bicyclist Injury Severities in
Bicycle–Motor Vehicle Accidents. Accident Analysis & Prevention, Vol. 39, No. 2, pp. 238-251, 2007.
116. Eluru, N., Bhat, C.R. and Hensher, D.A., A Mixed Generalized Ordered Response Model for Examining Pedestrian and Bicyclist Injury Severity Level in Traffic Crashes. Accident Analysis & Prevention, Vol. 40, No. 3, pp. 1033-1054, 2008.
117. Armon, R., Speed Limit Jumps to 70 mph Monday on Ohio Interstates. http://www.ohio.com/news/speed-limit-jumps-to-70-mph-monday-on-ohio-interstates-1.409974, Accessed July 2014.
118. The Associated Press: Baton Rouge, Interstate 49 Speed Limit Increased to 75 mph Between Central, North Louisiana. The Times Picayune, 2011.
119. Marin, R., Speed Limit Going Up on Kansas Turnpike, I-135, I-70. KWCH: Topeka Eyewitness News 12, 2011.
120. Little, L., Texas May Raise Speed Limit to 85 MPH. ABC News, 2011. 121. Hoschouer, K., Speed Limit Amendments. Utah Department of Tranportation, 2013. 122. WTVD: Raleigh, 3 Triangle highways to see speed limit increase to 70 mph. WTVD:
Raleigh, 2013. 123. Gregory, T., 70 mph Speed Limit Map Leaves Chicago a Slow Zone. The Chicago
Tribune, 2013. 124. Associated Press: Concord, Hassan Signs Bill Raising I-93 Speed Limit. New Hampshire
News, 2013. 125. Murdock, Z., Speed Limit on Portion of SC 170 Goes to 60 mph. The Island Packet,
2014. 126. Hartzell, D., 70 mph Speed Limits Coming to Pennsylvaina in 2014. The Morning Call,
2013. 127. Beaton, M., Bill would Allow Speed Limit Hikes. The News Herald, 2014. 128. Siceloff, B., NC Legislators Put 75 mph Speed Limit on Fast Track. The Charlotte
Observer, 2013. 129. Precious, T., Bill Aims to Raise NYS Maximum Speed Limit to 75 mph. The Buffalo
News, 2013. 130. Pepitone, J., Missouri Lawmakers to Consider Raising Speed Limit. Fox 4 News Belton,
2014. 131. Fields, E., Higher Speed Limits may be on the Horizon for Some W. Kentucky Roads.
WSPD Local 6 Calloway County, 2014. 132. National Highway Traffic Safety Administration, Fatality Analysis Reporting System
(FARS). Available from: http://www-fars.nhtsa.dot.gov//QueryTool/QuerySection/SelectYear.aspx, Accessed March 2014.
133. Federal Highway Administration, Highway Statistics Series. Available from: http://www.fhwa.dot.gov/policyinformation/statistics.cfm, Accessed March 2014.
134. United States Cencus Burearu, Intercensal Estimates. Available from: http://www.census.gov/popest/data/intercensal/index.html, Accessed March 2014.
135. National Oceanic and Atmospheric Administration, Climate Data Online: Dataset Discovery. Available from: http://www.ncdc.noaa.gov/cdo-web/datasets, Accessed March 2014.
145
136. Boyle, L.N. and Mannering, F., Impact of Traveler Advisory Systems on Driving Speed: Some New Evidence. Transportation Research Part C: Emerging Technologies, Vol. 12, pp. 57-72, 2004.
137. Miller, L., Abraham, D.M. and Mannering, F., Effectiveness of Speed Control Measures on Nighttime Construction and Maintenance Projects: Some New Evidence. Transportation Research Board 87th Annual Meeting, 2008.
138. Washington, S.P., Karlaftis, M.G. and Mannering, F.L., Statistical and Econometric Methods for Transportation Data Analysis. CRC Press, 2010.
139. Michigan Department of Transportation, Road Design Manual: Chapter 3 - Alignment and Geometrics. Michigan Department of Transportation, 2013.
140. What Consumes Fuel? Bridgestone Tire Corporation. Available from: http://www.bridgestonetrucktires.com/us_eng/real/magazines/ra_special-edit_4/ra-special4_pdf_downloads/ra_special4_fuel-speed.pdf, Accessed March 2014.
141. Garthwaite, J., Smarter Trucking Saves Fuel Over the Long Haul, National Geographic Daily News, 2011.
142. 2013 Vehicle Technologies Market Report Chapter 3: Heavy Trucks. Oak Ridge National Laboratory, 2013.
143. Thomas, J., West, B. and Huff, S., Predicting Light-Duty Vehicle Fuel Economy as a Function of Highway Speed. SAE International Journal of Passenger Cars-Mechanical Systems, Vol. 6, No. 2, pp. 859-875, 2013.
144. Michigan Department of Transportation, Michigan Highway Performance Monitoring System (HPMS) Report.
145. Average retail fuel costs in Michigan in March 2014. Available from http://www.gasbuddy.com, Accessed March 2014.
146. Michigan Department of Transportation, Construction Congestion Cost (CO3) Analysis. Available from: http://www.michigan.gov/mdot/0,4616,7-151-9625_54944-227053--,00.html, Accessed March 2014.
147. Walls III, J. and Smith, M.R., Life-Cycle Cost Analysis in Pavement Design - Interim Technical Bulletin. Federal Highway Administration, 1998.
148. United States Bureau of Labor Statistics, Consumer Price Index for All Urban Consumers (CPI-U) - U.S. City Average by Month and Year. Available from: ftp://ftp.bls.gov/pub/special.requests/cpi/cpiai.txt, Accessed March 2014.
149. National Safety Council, Estimating the Costs of Unintentional Injuries. Available from: http://www.nsc.org/news_resources/injury_and_death_statistics/Pages/EstimatingtheCostsofUnintentionalInjuries.aspx, Accessed March 2014.
150. Andrew, K.B., NCHRP Report 174: Highway Noise: A Design Guide for Prediction and Control. Transportation Research Board, 1976.
151. United State Environmental Protection Agency, National Ambient Air Quality Standards (NAAQS). Available from: http://www.epa.gov/air/criteria.html, Accessed March 2014.
152. Michigan Department of Environmental Quality, Air Quality Division. Available from: http://www.michigan.gov/deq/0,4561,7-135-3310_4195---,00.html, Accessed March 2014.
153. Michigan Department of Environmental Quality, Attainment - NonAttainment. Available from: http://www.michigan.gov/deq/0,4561,7-135-3310_30151_31129---,00.html, Accessed March 2014.
146
154. United States Environmental Protection Agency, State Implementation Plan Overview. Available from: http://www.epa.gov/oar/urbanair/sipstatus/overview.html, March 2014.
155. United States Environmental Protection Agency, Region 5, Air and Radiation. Available from: http://yosemite.epa.gov/r5/r5ard.nsf/SIPs View By State Main View!OpenView&Start=1&Count=30&Expand=3.1 - 3.1, Accessed March 2014.
156. Kang, Z., Liu, D., Jiang, R. and Yang, Y., Impacts of Vehicle Speed on Pavement Performance 1. Effect of Vehicle Speed and Vehicle Load on Damage of Pavement. Rep. Shandong: China Academic Journal, 2013.
157. Works Consultancy Services Limited, Transit New Zealand Research Report No. 30: Speed of Overweight Vehicles. Transit New Zealand, 1994
158. Misaghi, S., Tirado, C., Nazarian, S. and Carrasco, C., Effect of Road Vehicle Interaction on Pavement Condition Deterioration. Transportation Research Board 91st Annual Meeting, 2012.
159. Gillespie T.D., Karamihas, S.M., Sayers, M.W., Nasim, M.A., Hansen, W. and Ehsan, N., NCHRP Report 353: Effects of Heavy-Vehicle Characteristics on Pavement Response and Performance. Transportation Research Board, 1993.
160. Izquierdo, J.T., Rodrigues, L. and Rios B.C., Structural Evaluation and Analysis of Instrumented In-Service Concrete Pavements Subjected to Heavy Dynamic Loads. Transportation Research Record: Journal of the Transportation Research Board No. 1568, pp. 24-34, 2002.
161. Hardy, A. and Cebon, D., Importance of Speed and Frequency in Flexible Pavement Response. Journal of Engineering Mechanics, Vol. 120, No. 3, pp. 463-482, 1994.
162. Dai, S.T., Van Deusen, D., Beer, M., Rettner, D. and Cochran, G., Investigation of Flexible Pavement Response to Truck Speed and FWD Load Through Instrumented Pavements. Eighth International Conference on Asphalt Pavements, 1997.