Evaluating the global contribution from MACC when … Evaluating the global contribution from MACC...
16
www.bsc.es Evaluating the global contribution from MACC when modelling an ozone episode over Spain M.T. Pay 1 , V. Valverde 1 , J.M. Baldasano 1,2 1 Earth Sciences Department, Barcelona Supercomputing Center, Barcelona, Spain 2 Environmental Modeling Laboratory, Technical University of Catalonia, Barcelona, Spain MACC-III Policy User Workshop, Wien, Austria, March 3-4, 2015
Transcript of Evaluating the global contribution from MACC when … Evaluating the global contribution from MACC...

www.bsc.es
Evaluating the global contribution from MACC when modelling an ozone episode over Spain
M.T. Pay1, V. Valverde1, J.M. Baldasano1,2
1Earth Sciences Department, Barcelona Supercomputing Center, Barcelona, Spain2Environmental Modeling Laboratory, Technical University of Catalonia, Barcelona, Spain
MACC-III Policy User Workshop, Wien, Austria, March 3-4, 2015

The problem of O3 in Europe & Spain
• O3 precursors emissions have declined (27% for NOx and 28% NMVOC) (EEA, 2013a)
• High O3 (rural background), concentrations are still a problem: exceedances TV (21%), LTO (85%), IT (28%) and AT (3%) in summer 2012 (EEA, 2013b).
• O3 complex pollutant: secondary (NOx/VOC), long-range transported, stratospheric, etc.
• O3 is not longer a local air quality issue, it is a hemispheric and global problem
• Regions: Medit. area > Central & E EU > NW EU > N EU
PeriodEU (2008/50/EC) WHO (2005) NAAQS (2008)
μg m-3 μg m-3 μg m-3
O3
8 h 120TV (25d/3y), 120LTO 100 147 (3y)
1 h 180 IT - 235
1 h 240 AT -
LTO: Long-Term Objective, TV: Target Value, IT: Information Threshold, AT: Alert Threshold
EEA, 2013b

Introduction: Chemical Boundary Conditions
3
An important aspect in the regional/area applications of AQF systems is the way in which models are initialized: initial and chemical boundary conditions.
The use of climatological averages is one of the common practices, but implementing boundary conditions obtained from global models is currently a significant challenge:
– Which are the required parameters from the global model (key pollutants, meteoparameters)?
– Are the temporal and spatial resolutions of the global model consistent with our application?
– Which vertical interpolation techniques from the global to regional/city scale?
– Is the forecast time of the global model enough to produce regional/city forecasts?
– Are there consistency between chemical mechanisms and aerosol sizes?
Global products Download links
MACC project forecast and analysis http://join.iek.fz-juelich.de/macc/access
MOZART-4 model forecast http://www.acd.ucar.edu/acresp/forecast/
MATCH-MPIC model forecast http://cwf.mpic.de/~cwf/cgi-bin/match/std_figs/forecasts_std_figs.pl
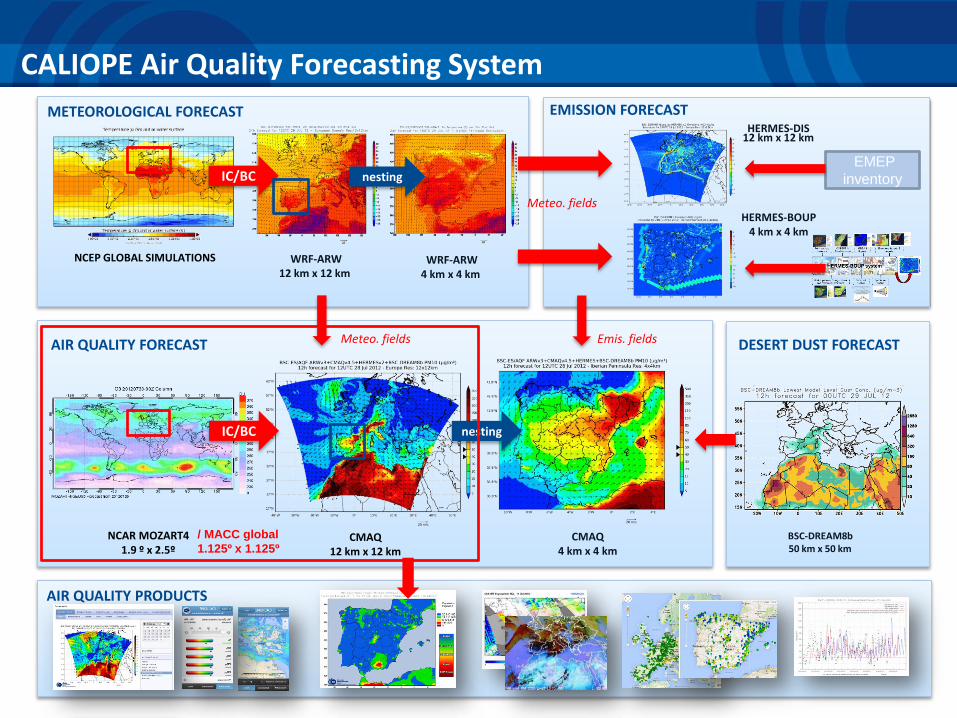
CALIOPE Air Quality Forecasting System
METEOROLOGICAL FORECAST
NCEP GLOBAL SIMULATIONS WRF-ARW12 km x 12 km
IC/BC nesting
WRF-ARW4 km x 4 km
EMISSION FORECASTHERMES-DIS
12 km x 12 km
HERMES-BOUP 4 km x 4 km
Meteo. fields
EMEP
inventory
AIR QUALITY FORECAST
CMAQ 4 km x 4 km
CMAQ 12 km x 12 km
NCAR MOZART41.9 º x 2.5º
Meteo. fields
IC/BC nesting
Emis. fields DESERT DUST FORECAST
BSC-DREAM8b 50 km x 50 km
AIR QUALITY PRODUCTS
/ MACC global
1.125º x 1.125º

Objectives and method
Action 1: Evaluate and intercompare forecasted O3 rates from two global model:
MACC and Mozart-4
a. Validation of vertical profiles over the European domain (ozone sondes).
Objective: to evaluate the O3 global contribution from global MACC during a summer episode in Spain
Action 2: Evaluate the MACC chemical boundary contribution for O3 within the CALIOPE system affecting Spain
a. Implement an interpolation method from global to regional for boundary conditions.
b. Track O3 global contribution from MACC: source apportionment algorithms.
c. Quantify the relative contribution from different scales (global, regional, local) to O3
in Spain.

Study episode: 21-31 July 2012
ITL
MSL
P &
pre
pTe
mp
& w
ind
Circulation Type Classification 2012
(Freq, patterns > 22%)
NWad ITL
Seasonal freq (%): DJF/MAM/
JJA/SON
2.5/37.5/37.5/22.5
15.2/20.3/43.0/21.5
Mean/Max persist.
4/10 days 3/8 days
Transitions ITL/ W-NWadNWad /W-
NWad
21-24th = ITL25-29th = NWad30-31st = ITL
L
H
NWAd
L
H
ITL: Iberian Thermal LowNWad: NW advection
The largest O3 episode in 2012 (24-28th July):
• Total number of exceedances: 33% of the IT, 32% of the AT, and 12% of the LTO
(Valverde et al., 2014)

Evaluation global data: MACC and MOZART-4
MACC MOZART4-GEOS5
Definition Monitoring Atmospheric Composition and
Climate (MACC)
Model of Ozone And Related Tracers
Reference Inness et al. (2013) Emmons et al. (2010)
Operational institution 7 FP of the European Union National Center for Atmospheric
Research (NCAR)
Chemical transport model
/chemical mech.
Model for Ozone And Related chemical Tracers
(MOZART-3, Kinnison
et al., 2007; Stein et al., 2009)/
Model for Ozone And Related chemical
Tracers( MOZART-4 )/CB05
Meteorological data Medium-Range Weather Forecasts’ (ECMWF)
Integrated
Forecast System (IFS)
GEOS5
Emission data Anthropogenic emission from MACCity (Granier
et al., 2011) from Atmopheric Chemistry and
Climate Model Intercomparison Project
(ACCMIP) emission. Shipping emission from
RETRO project. Biomass burning emission from
Global Fire Emissions Database. Biogenic
emission from MEGANv2
Argonne National Laboratory
Vertical resolution (top)/ first
layer thickness (m)
60 hybrid sigma-pressure levels (0.1hPa)/~10 m
and 14 levels covering low troposphere (< 2km)
56 σ-layers (2 hPa)/~63 m and 14 levels
covering low troposphere (< 2km)
Horizontal resolution 1.125ºx1.125º 1.9 º x 2.5º
Temporal resolution 8 time steps 6 time steps
Higher spatial and temporal resolution

Evaluation global data: MACC and MOZART-4 (forecast)Vertical profiles at WOUDC stations
MACC global MOZART-4 Altitude range 0-2km >2-8km 0-2km >2-8km
Mean(obs/mod, ppb) 53.59 / 54.91 97.34 / 73.74 53.59 / 57.92 97.34 / 71.52SD (obs/mod, ppb) 3.02 / 5.45 13.28 / 3.48 3.02 / 4.66 13.28 / 10.62
Bias(ppb) 1.31 -23.6 4.12 -25.82NMB (%) 2.45 -24.25 7.66 -26.52
MGE (ppb) 2.7 23.6 7.37 25.82
NMGE (%) 5.04 24.25 13.7 26.52RMSE(ppb) 4.43 25.42 7.8 26.3
r 0.58 0.94 -0.6 0.92
MACC global forecasts show higher performance than MOZART-4
Ozone sondes

Interpolation method from global MACC to regional CALIOPE
“Nearest-neighbor interpolation”: Interpolation between the two nearest
layersProxy: the High of the mean layers (global
and regional) (Preasure and T).
CMAQ
(CB05, AERO5)MACC
O3 vmr_o3
NO vmr_no
NO2 vmr_no2
CO vmr_co
PAN vmr_pan
OH vmr_oh
FORM vmr_ch2o
ISOP vmr_isop
SO2 vmr_so2
ETHA vmr_c2h6
ETH N/A
ASO4I vmr_sulfaer (50%)
ASO4J vmr_sulfaer (50%)
HNO3 vmr_hno3
H2O2 N/A
15 layers (top 50 hPa)
60 layers (top 0.1 hPa)
15/1535/60
Layer 1
Layer 2
Layer 3
Layer 4
Zoom < 500 m a.s.l

Track O3 global contribution from MACC:source apportionment algorithms
Tool: Source Apportionment CMAQ-ISAM
• CMAQ-ISAM: Integrated Source Apportionment Method.
• Evaluated by means brute force zero-out scenarios (Kwok et al., 2013, 2014)
• Hybrid approach for O3: using the PH2O2/PHNO3 indicator ratio.
• Tracers for NOx (9) and VOC families (19) are based on CB05 species contributing to O3 formation.
ISAM-EU12 (Europe, 12 km x 12 km)
Spain* (Spanish IP + Balearic Islands)
• BCON: MACC global (global O3
transport out from EU12)• EURO: countries surrounding Spain*• ESP: Spain*• OTHR: Ocean• ICON: initial conditions
Apply Source Apportionment in CALIOPE (CMAQ-ISAM):1. Check the performance of the MACC boundary condition2. Assess the origin of O3 exceedances in Spain from different scales (global, regional, country)

Region contribution to O3 in Spain (EU12):Mean concentration 21-31 July 2012
O3 from Spain
O3 from shipping O3 from GLOBAL MACC
TOTAL O3 O3 from Europe
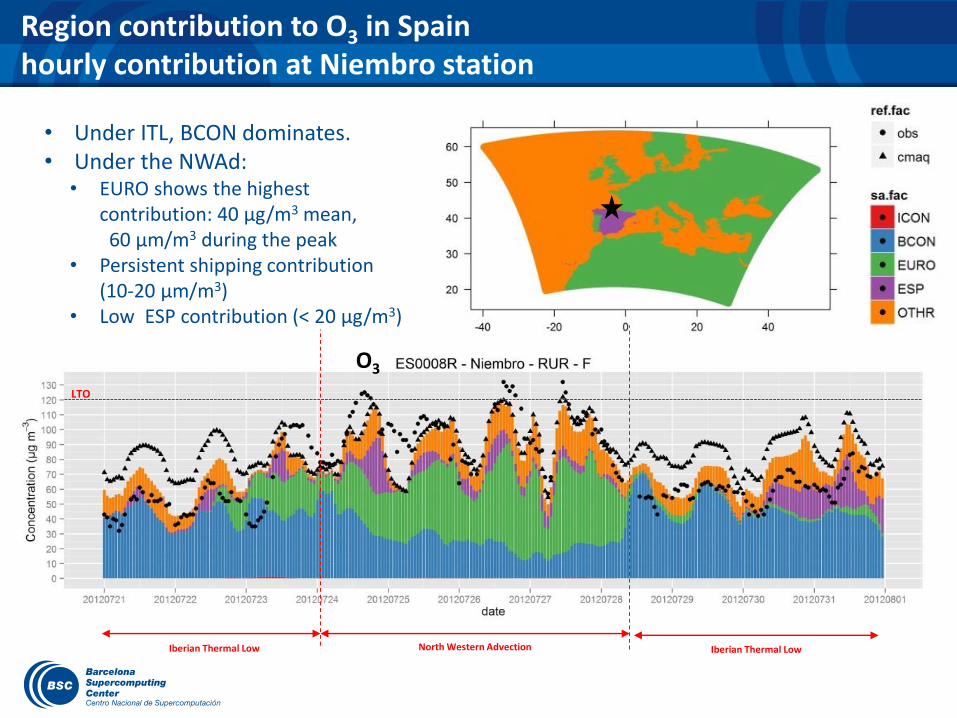
Region contribution to O3 in Spainhourly contribution at Niembro station
O3
North Western Advection
LTO
• Under ITL, BCON dominates.• Under the NWAd:
• EURO shows the highest contribution: 40 µg/m3 mean,60 µm/m3 during the peak
• Persistent shipping contribution (10-20 µm/m3)
• Low ESP contribution (< 20 µg/m3)
Iberian Thermal Low Iberian Thermal Low

Region contribution to O3 in Spainat rural background sites
LTO
LTO
LTO
LTO
LTO
LTO
EURO controls EURO controls
ESP controls
ESP controls
Portugal controls
Portugal + ESP + Shipping controls
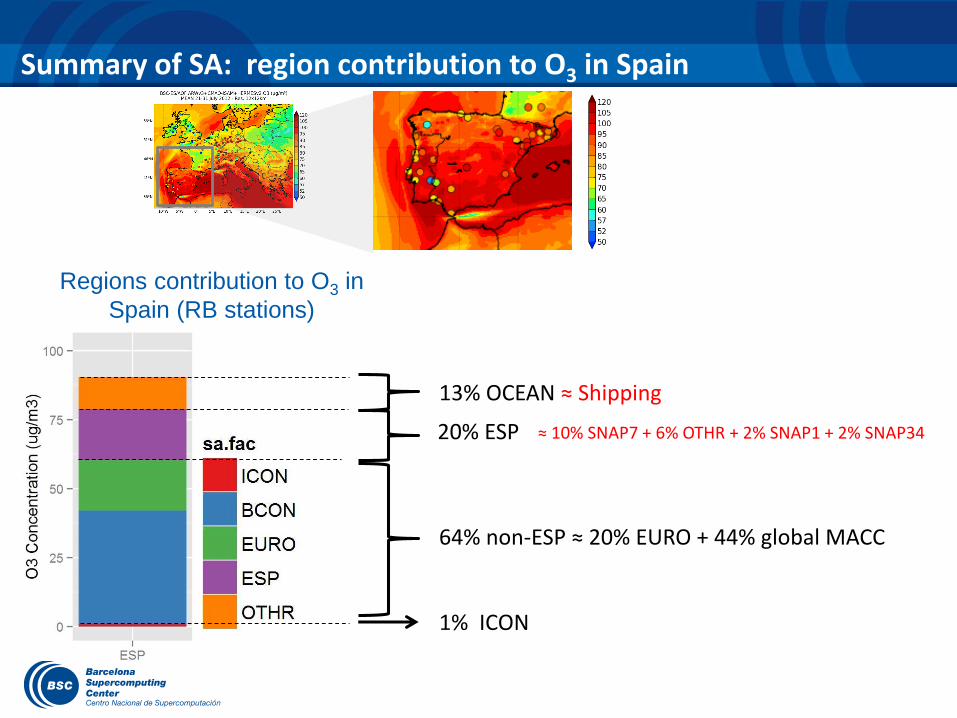
Summary of SA: region contribution to O3 in Spain
64% non-ESP ≈ 20% EURO + 44% global MACC
20% ESP
Regions contribution to O3 in
Spain (RB stations)
1% ICON
13% OCEAN ≈ Shipping
≈ 10% SNAP7 + 6% OTHR + 2% SNAP1 + 2% SNAP34

Conclusions and future work
MACC global forecasts is a valuable product to feed regional forecast simulations:
– Enough time at sufficient spatial resolution to produce a real-time forecast.
– Large number of chemical components.
– High performance in terms of vertical profiles in Europe.
ISAM source apportionment is useful as a diagnostic tool:
– Check chemical boundary conditions.
– Quantify the contribution at different scales and sources.
O3 overestimation in the eastern domain of the CALIOPE system are linked to how MACC boundary conditions are implemented in the boundaries. Next steps:
– Interpolation methods from global to regional: test “Weighted average” instead “Nearest-neighbor interpolation ” (current)
– Increase the vertical resolution of the regional model (first layer from 40 to ~20 m).
Assessment of the origin of O3 exceedances in Spain in a typical summer episode:
– Not only national (~20%), but continental (~20%), hemispheric and global (~44%).
– NWad brings O3 and precursors from N EU countries and international shipping inland Spain up to 60 µg/m3
(~40-50 µg/m3) in N Spain; meanwhile central and costal areas are more affected by recirculation of local precursors.

16
Thank you for your attentionReferences:
EEA, 2013a. Air quality in Europe – 2013 report. European Environmental Agency, EEA Report, No 9/2013. ISSN 1725-
9177. 112 pp.
EEA, 2013b. Air pollution by ozone across Europe during summer 2012. Overview of exceedances of EC ozone threshold
values for April-September 2012. European Environmental Agency, EEA Report, No 3/2013. ISSN 1725-2237. 52 pp.
Kwok, R., Baker, K., Napelenok, S., Tonnesen, G., 2014. Photochemical grid model implementation of VOC, NOx, and O3
source apportionment. Geoscientific Model Development Discussions 7, 5791-5829.
Kwok, R., Napelenok, S., Baker, K., 2013. Implementation and evaluation of PM2.5 source contribution analysis in a
photochemical model. Atmospheric Environment 80, 398-407.
Valverde, V., Pay, M.T., Baldasano, J.M., 2014. Circulation-type classification derived on a climatic basis to study air quality
dynamics over the Iberian Peninsula. International Journal of Climatology, doi: 10.1002/joc.4179
Webs:
• Air Quality Forecasts Europe / Spain: http://www.bsc.es/caliope
Funding: