Evaluating the Effectiveness of Cash Transfers versus Food Aid…€¦ · · 2017-09-01Evaluating...
36
Evaluating the Effectiveness of Cash Transfers versus Food Aid: a case study in rural Zimbabwe* Cormac Staunton # Concern Worldwide Micheál L. Collins # Department of Economics Trinity College Dublin ABSTRACT Since 2002, Zimbabwe has faced a number of humanitarian crises and prolonged food insecurity. Drought, political upheaval, hyperinflation and the collapse of the economy have all had a negative impact on the development of the country. The United Nations World Food Programme (WFP) has been implementing food aid programmes in Zimbabwe since 2002, assisting as many as five million people in 2009. The food security situation and economic environment began to improve in Zimbabwe in 2009, though many were still vulnerable. At that time the WFP and Concern Worldwide (an Irish based NGO) commenced a pilot programme of cash transfers instead of food aid for vulnerable communities. Using a Social Accounting Matrix (input‐output) model, and data from Concern Worldwide’s five month “Zimbabwe Emergency Cash Transfers” (ZECT) pilot, this paper attempts to quantify the relative impact of cash and food aid on the rural market in the Gokwe North region of Zimbabwe. Using data on expenditure of the cash transfer, use of food aid and proportional local spending of all the economic actors in the region, comparable multiplier figures are used to demonstrate the market impact of each intervention. The multiplier represents the impact of each intervention on all the other actors in the region, and thus the overall market impact of the intervention. JEL Classification: C67, D04, 012, R15 Keywords: Cash Transfers, Food Aid, Input-Output, Zimbabwe __________________________ * Draft paper, not for quotation #E‐mail addresses: [email protected] (Cormac Staunton), [email protected] (Micheál L. Collins)
Transcript of Evaluating the Effectiveness of Cash Transfers versus Food Aid…€¦ · · 2017-09-01Evaluating...

Evaluating the Effectiveness of Cash Transfers versus Food Aid:
a case study in rural Zimbabwe*
Cormac Staunton#
Concern Worldwide
Micheál L. Collins#
Department of Economics Trinity College Dublin
ABSTRACT
Since 2002, Zimbabwe has faced a number of humanitarian crises and prolonged food insecurity. Drought, political upheaval, hyperinflation and the collapse of the economy have all had a negative impact on the development of the country. The United Nations World Food Programme (WFP) has been implementing food aid programmes in Zimbabwe since 2002, assisting as many as five million people in 2009. The food security situation and economic environment began to improve in Zimbabwe in 2009, though many were still vulnerable. At that time the WFP and Concern Worldwide (an Irish based NGO) commenced a pilot programme of cash transfers instead of food aid for vulnerable communities.
Using a Social Accounting Matrix (input‐output) model, and data from Concern Worldwide’s five month “Zimbabwe Emergency Cash Transfers” (ZECT) pilot, this paper attempts to quantify the relative impact of cash and food aid on the rural market in the Gokwe North region of Zimbabwe. Using data on expenditure of the cash transfer, use of food aid and proportional local spending of all the economic actors in the region, comparable multiplier figures are used to demonstrate the market impact of each intervention. The multiplier represents the impact of each intervention on all the other actors in the region, and thus the overall market impact of the intervention.
JEL Classification: C67, D04, 012, R15
Keywords: Cash Transfers, Food Aid, Input-Output, Zimbabwe
__________________________
* Draft paper, not for quotation
# E‐mail addresses: [email protected] (Cormac Staunton), [email protected] (Micheál L. Collins)

2
Introduction
Zimbabwe has faced a number of humanitarian crises in recent years. Drought, political upheaval, hyperinflation and the collapse of the economy have all had a negative impact on the development of the country. The result has been large scale food insecurity, especially for the poorest in rural areas. The United Nations World Food Programme (WFP) has been implementing food aid programmes in Zimbabwe since 2002. One of the implementing partners in these has been the International Non‐Governmental Organisation (NGO) Concern Worldwide.
In 2009, things began to improve in Zimbabwe. Political stability, the end of hyper‐inflation through the introduction of the US dollar, and improved harvests meant that the number of people in need of humanitarian assistance was falling, and the operating environment was dramatically altered. There were still huge numbers of people in need, but given the new circumstances, Concern Worldwide and WFP began a new approach to emergency assistance in Zimbabwe; providing people with cash instead of food.
Cash transfer programmes in emergency contexts, while not radically new, have become more prevalent in response to humanitarian crises, especially since the Southern Africa food crisis in 2002 and the Asian Tsunami in late 2004. Concern Worldwide has played an important role in this movement, having run cash transfer programmes in Malawi, Kenya, Niger, Haiti, Somalia and now Zimbabwe. Giving people cash rather than in‐kind assistance has proven to be an effective intervention at meeting humanitarian needs, while at the same time empowering recipients to be able to make choices based on their own requirements. Cash has also been shown to stimulate local markets and boost local economies, thus having a much greater effect on the wider community, beyond the initial recipients. Measuring this impact for the programme in Zimbabwe will be the focus of this paper.
Using methods derived from the “Social Accounting Matrix” model, this paper quantifies the relative impact of cash transfers and food aid on the rural market in the Gokwe North region of Zimbabwe. With data from Concern Worldwide’s five month “Zimbabwe Emergency Cash Transfers” (ZECT) pilot project in late 2009 and early 2010, the Social Accounting Matrix (SAM) model is used to calculate a multiplier figure for Concern’s cash injection into the Gokwe North. Given that the ZECT pilot was implemented alongside food aid programmes in neighbouring wards of the same region, the same model is also used to calculate a multiplier for food aid. Comparable multiplier figures are used to demonstrate the market impact of each intervention.
Background
Since 2002 Zimbabwe has suffered from large scale food insecurity, especially for the poorest in rural areas. The United Nations World Food Programme (WFP) has been implementing food aid programmes in Zimbabwe since that time. One of the implementing partners in these has been the International Non‐Governmental Organisation (NGO) Concern Worldwide.

3
The on‐going humanitarian crises in Zimbabwe have affected the functioning of rural markets, particularly for the staple crop; maize. A Market Structure Assessment1 in late 2009 showed that as a result of years of neglect and disinvestment the maize value chain in rural areas was not functioning. The study observed that the market for maize was heavily constrained, with very few traders participating in maize trade because of insignificant profit margins. It also found that the market for maize was heavily localised, in that maize transfers were occurring within wards (small administrative districts), with negligible external trade. Because of liquidity challenges, maize trade and flow was noted as being predominately done through barter. According to the baseline study conducted by Concern as part of the programme in November 2009, 61% of market transactions were bartered in rural districts2. The market for maize, as well as being local, was found to be isolated. Most maize flow was occurring at village level with farmer‐to‐farmer sales dominating the market.
Throughout 2009, the situation had begun to improve in Zimbabwe. Political stability, the end of hyper‐inflation through the introduction of the US dollar, and improved harvests meant that the number of people in need of humanitarian assistance fell, although many were still vulnerable.
In the months leading up to the harvest in March 2010, Concern and WFP targeted areas considered to be amongst the most food‐insecure in Zimbabwe, and thus in need of assistance. However, the maize market assessment study noted that in some areas farmers, millers and to a lesser extent grocers were holding stocks of maize. Also, many of the areas targeted for intervention were close to other areas which were producing surpluses.
Given this new situation, WFP and Concern instigated a new approach to emergency assistance in Zimbabwe; providing people with cash instead of food. Concern and WFP concluded that giving cash rather than food to some households was seen as a viable and appropriate option in these regions as a response to localised food insecurity.
Cash Transfers were expected to provide programme participants with greatly improved humanitarian assistance, and would empower people by giving them choice. In addition to enabling the targeted households to access their food entitlement, there was expected to be a multiplier effect, resulting from cash being spent in the local economy, which would benefit the wider community. Cash transfers have proven to be an effective intervention in response to food shortages and hunger crises. The economic environment and the food security situation in Zimbabwe were considered appropriate for such an intervention in late 2009.
1 GreatMinds Investments (2009). Concern Worldwide Zimbabwe, Maize Value Chain Analysis and Assessment Tools Development Gokwe North, Gokwe South and Nyanga Districts, Zimbabwe, Harare, October 2009 2 Concern Worldwide Zimbabwe Emergency Cast Transfer Programme (ZECT) Baseline Survey Prepared Elena Ruiz Roman, Harare, December 2009

4
The Zimbabwe Emergency Cash Transfer (ZECT) Programme
The Zimbabwe Emergency Cash Transfer (ZECT) project was a pilot project providing cash to households during the food insecure months in Zimbabwe from November 2009 to March 2010. The objectives of the programme were:
• To enable approximately 1,900 households in Zimbabwe to obtain their Missing Food Entitlement (MFE) for a period of five months (November 2009 to March 2010) by providing direct cash transfers.
• To enable approximately 1,900 households in Zimbabwe to obtain their Missing Food Entitlement (MFE) for a period of five months (November 2009 to March 2010) by providing 50% direct cash transfers and 50% food aid.
Social Accounting Matrices and Multiplier Analysis
The aim of this paper is to quantify the relative multiplier effect of cash transfers and food aid3. In doing so it builds on previous studies, notably Davies’ “Reduced Social Accounting Matrix”, which was used to calculate a multiplier for a cash transfer programme in Malawi in 20074.
A Social Accounting Matrix (SAM) is a particular representation of the economic activity of a socio‐economic system, which captures the transactions and transfers between all economic agents in the system. All the actors are represented in a square matrix, and each cell of the matrix represents the expenditure of one agent with another. The overriding feature of a SAM is that households are at the heart of the framework. According to Round (2003), only if there is some detail on the distributional features of the household sector can the framework truly earn the label ‘social’ accounting matrix. Also, a SAM typically shows detail about the circular flow of income, including transactions between different actors (including different household groups) (Round, 2003)5
It is generally acknowledged that the origins of SAMs can be traced to the pioneering work of Stone in the 1960s, based on the United Kingdom and some other industrialised countries. These ideas were further developed and used to help address poverty and income distribution issues in developing countries by Pyatt, Thorbecke and others from early in the 1970s onwards (Pyatt and
3 Although the ZECT programme had three modalities of intervention (Cash Only [CO], Cash and Food [CF], and Food Only [FO]), this paper only looks Food Only and Cash Only as the extremes, while ignoring the mixed Cash and Food intervention. 4 Davies, S. (2007) Making the Most of It: A Regional Multiplier Approach to Estimating the Impact of Cash Transfers on the Market in Dowa, Malawi, Concern Worldwide Malawi, 2007 5 Round, J. (2003). Social Accounting Matrices and SAM‐Based Multiplier Analysis, pp. 261‐276, in Bourguignon, François, and Luiz A. Pereira da Silva, eds. 2003. The Impact of Economic Policies on Poverty and Income Distribution: Evaluation Techniques and Tools. New York: World Bank and Oxford University Press. http://www.un.org/esa/policy/sanjose_training_mdgs/round_2003_sams_chapter14.pdf

5
Thorbecke, 1976). A large number of SAM‐based multiplier studies have since followed. (Round, 2003)6
In all of these studies the aim has been to examine the nature of the multiplier effects of an income injection in one part of an economic system on the economy in general, and on the incomes of certain socio‐economic groups of households in particular.
A Social Accounting Matrix for the ZECT programme in Gokwe North
The SAM is not in itself an economic model. It is simply a representation of a set of the data for an economy. However, suitably designed and supported by survey data and other information it does suggest some important and useful features about socio‐economic structure in general, and the relationship between the structure of production and the distribution of income in particular7. This section will show how a SAM can be used to calculate a multiplier for an exogenous injection of cash on the rural economy in Zimbabwe. A multiplier occurs when the exogenous injection of cash has knock on effects in the economy. Some of the money will be spent locally and some will leave the region. Graphically this can be represented as in Diagram 1.
6 Round, J. (2003). Social Accounting Matrices and SAM‐Based Multiplier Analysis, pp. 261‐276, in Bourguignon, François, and Luiz A. Pereira da Silva, eds. 2003. The Impact of Economic Policies on Poverty and Income Distribution: Evaluation Techniques and Tools. New York: World Bank and Oxford University Press. http://www.un.org/esa/policy/sanjose_training_mdgs/round_2003_sams_chapter14.pdf
7 Ibid.

6
Diagram 1: Movement of Cash in a Rural Economy
(source: Davies, 2007)
The effect of the injection of cash depends on how it is used. Davies (2007) shows that if some of the cash is used to purchase goods or services produced locally, this will have the effect of stimulating local demand. For example, a household which received $100 of cash from the ZECT programme may choose to spend $50 of this on food produced locally. The effect is to stimulate local production, and means that the producer’s income has increased by $50. The total increase in the income of the region is thus the initial $100 plus the $50 earned by the farmer who produced the food; a total of $150 after one round of spending8. There is, of course, no reason to assume that spending ends there. In turn, the farmer will spend his money. If he also spends half of his income locally, this will help to generate the further production of local goods and services by $25, so that the total impact on the region is $175. This continues such that the total increase in regional income is:
$100 + $50 + $25 + $12.50 + $6.25 + ….
In doing this it is assumed that in each “round” of spending, 50% is spent locally, and 50% leaves the region9.
Mathematically, this can be written as a power series expansion10:
8 Davies, S. (2007) Making the Most of It: A Regional Multiplier Approach to Estimating the Impact of Cash Transfers on the Market in Dowa, Malawi, Concern Worldwide Malawi, 2007 9 It does not have to be the case that 50% of the money is spent locally. It could be 90% or 10%.

7
which can be re‐written as:
In this equation, a is the initial injection of cash, z represents the percentage spent in the local area and t is the round of spending.
The multiplier (k) therefore is
k= 1/(1−z)
Standard economics tells us that z is the constant marginal propensity to consume locally‐produced goods (MPC). That is, the proportion of the last dollar of income spent on local produce.
k= 1/(1−MPC)
The denominator (1‐MPC) represents leakages from the local economy.
In the example above, the multiplier k is equal to
k = 1/(1−0.5) = 1/0.5 = 2
indicating that the total impact on regional income will be twice the initial cash injection. That is, for a $100 injection, the total increase in regional income will be equal to $200. The size of the multiplier depends upon the proportion that leaks from the local cash pool.
Using the SAM to calculate the multiplier
There are two reasons why the above model is insufficient to calculate a multiplier for the economy. Firstly, this model assumes that the marginal propensity to consume local products (MPC) is equal for all the actors. However, this is not the case. Beneficiaries of the initial cash transfer may spend a large proportion of their income locally (MPC= 0.9), but the recipients of this income (local traders) may spend most of the money externally (MPC= 0.1). Therefore although the initial spending in the economy is large, the majority “leaks” out of the economy in the second round. This will affect the size of the multiplier. Secondly, some actors may not benefit at all in the first “round”, but may benefit from subsequent rounds. It will be shown later that teachers, for example, receive no money directly from the recipients, but if the recipients use the money to pay school levies, and these are passed on to the teachers in the form of incentives (the current
10 Davies, S. (2007) Making the Most of It: A Regional Multiplier Approach to Estimating the Impact of Cash Transfers on the Market in Dowa, Malawi, Concern Worldwide Malawi, 2007

8
practise in Zimbabwe) then the teachers do receive a proportion of the initial injection. If they choose to spend this locally, then this continues the cycle.
Using the SAM allows all of this activity to be captured. It shows the marginal propensity to consume local goods for all the actors, and measures, for example, how money flows from the initial injection, to the beneficiary, to the school, to the teacher and to the trader. The overall multiplier can be calculated in matrix form using the steps in Appendix I.
Creating a Social Accounting Matrix for Gokwe North: Data Although this paper is using the methodology of the social accounting matrix, it important to note that the starting point in this model is the proportional expenditures of each actor with the others, rather than actual expenditure data which was not available for all actors. These proportional expenditures are entered into the square matrix as separate “accounts” for each actor to construct the SAM. Proportional expenditure of the primary beneficiaries was taken from Concern Worldwide’s monthly monitoring report. Proportional expenditure of the secondary beneficiaries was gathered through interviews and focus groups conducted as part of the field research for this paper in March 2010. The data are presented below.
The ZECT Programme was closely monitored by Concern Worldwide Zimbabwe’s Monitoring and Evaluation (M&E) team. A baseline survey was conducted in November 2009, and monthly monitoring reports were produced. Regular assessments looked at the market impact and prices. There were also a series of structured interviews, known as “Post‐Distribution Monitoring (PDM) Surveys” which captured beneficiary behaviour, satisfaction with the programme and, crucially, their expenditure patterns and use of the transfers. Around 180 interviews took place each month covering all three districts and targeting beneficiaries of all three interventions, as well as non‐beneficiaries from the communities. The final Monitoring and Evaluation report11 gives a clear indicator of the outcomes of the programme. Beneficiary Expenditure
The data on the expenditure of those receiving the cash in the first instance (the beneficiaries) is taken from Concern Worldwide’s monthly monitoring data. This data was collected from structured interview questionnaires with recipients, conducted by Concern Worldwide’s local Monitoring and Evaluation officer. The interviews were carried out roughly two weeks after each distribution. Around 180 interviews took place each month, covering all three programme areas, and the respondents represented Food beneficiaries, Food and Cash beneficiaries, Cash only beneficiaries, and non‐beneficiaries12. Given that a SAM is a snapshot of a particular timeframe, and it was decided to use expenditure data for the month of February to correspond with the
11 Concern Worldwide Zimbabwe (2010) Zimbabwe Emergency Cash Transfer (ZECT) Pilot Programme Monitoring Consolidated Report, November 2009 to March 2010, Elena Ruiz Roman, Harare, April 2010 12 It should be noted that this data was collected for monitoring purposes, and given the small sample size (15‐20 per intervention in each region, each month) they are not considered statistically significant.

9
secondary beneficiary data. The results for cash beneficiaries for Gokwe North in February are given below and are the starting point for the SAM.
Table 1: Average Expenditure of ZECT Cash, Gokwe North, February 2010
Gokwe north Maize 53.05% Milling 10.09% Other Foods 16.36%
Food Total
Foods 79.50% NFIs 2.44%
Clothes 0.00% Health 3.58%
Education 3.57% Equipment and
Inputs 0.00% Transport 0.66%
Alcohol & Tobacco 0.16% Debt Repayment 4.27%
Social 0.00% Funeral 1.95% Savings 1.99%
Unaccounted 1.88% Total 100.00%
(source: Concern Worldwide PDM dataset)
When these are aggregated into the accounts used for the SAM they become:
Table 2: Average Expenditures of ZECT cash in Gokwe North February 2010 by SAM category
Large Farmer Trader School Clinic Other Local External Total
53.05% 29.04% 3.57% 3.58% 6.88% 3.87% 100.00%
It is assumed that expenditure on maize goes to the farmer, expenditure on other food, Non‐Food Items (NFIs), milling, clothes, alcohol and tobacco goes to the trader, education expenditure goes to the school, health expenditure goes to the clinic, and social, funeral, debt repayment and transport goes to other local. Savings, and any unaccounted for expenditure, are a leakage and go to the external account.

10
Diagram 2: Composition of SAM categories from ZECT cash expenditure
Non‐Beneficiaries
Data on the expenditure patterns of those not benefitting from the programme were also collected as part of the PDM process. The results for Gokwe North in February 2010 are given in the table below. These data are important as they will be used as the basis for calculating the non‐business expenditure of other actors in the region. We assume that non‐beneficiaries expenditure represents average expenditures on local goods for all other actors in the region.

11
Table 3: Non-Beneficiary Expenditure Data (Gokwe North)
Farmer 39.23%
Trader 14.52%
Health 3.90%
School 10.15%
Other 32.20% (Source: Concern Worldwide PDM data set)
Other actors
Data on other actors in the region were derived from key informant interviews conducted as part of this study in Gokwe North in March 2010. These interviews covered a range of topics relevant to the monitoring of the programme. Crucially, respondents were asked to report on how they spent the income they received from the beneficiaries. The results are shown in the table and discussed below.
Small Farmers
This is the group that the beneficiaries come from. They can be said to be the food insecure households that do not sell any surpluses in the market. For the sake of the model, their expenditure is equal to that of the beneficiaries of the programme.
Large Farmers
Farmers in this category are assumed to be growing surpluses of food, and thus are producing enough to sell. Much of the economic activity between farmers in rural Zimbabwe is informal and hidden. Many of the sales occur between farmers at village level. From the interviews we know that they trade with other similar farmers (20%), they purchase stocks with traders, and they engage the services of the miller (together 30%) and that they use income to pay school fees (10%). The remainder (40%) is used to buy inputs for their farm, such as seeds and fertiliser13.
Traders
This classification includes both grocers and millers as their expenditure patterns are roughly similar. Ideally they would have been separated in the classification scheme. However, as they were interviewed together as a focus group this was not possible. On average they spend 23% of their income locally, and 77% goes outside the area in the form of tax (15%), purchasing stock (30%), electricity bills (17%) and transport cost (15%). Of the 23% spent locally, we assume it 13 It should be noted that these numbers are uncharacteristically round. Numeracy levels amongst farmers are quite low, and in order to estimate proportional expenditure, a technique called “proportional piling” was used. Farmers were asked to show how much of their income was spent with other actors by dividing up a pile of 10 stones into smaller piles to represent expenditure. Hence, the numbers are in multiples of 10.

12
mirrors the expenditure of non‐beneficiaries in the region: 39.23% (9%) on maize from the farmer, 14.52% (3.3%) with the grocer and the miller, 10.2% (2.3%) on school fees, 3.9% (0.09%) on health and 32.2% (7.4%) on other local.
Schools
Three schools were interviewed in Gokwe North. Interviews took place with head‐teachers to determine how schools spend income from the community, and with teachers to gauge their own expenditure (see next section). Primary education in Zimbabwe is technically free, though due to a shortfall in government funding available for education, schools are permitted to charge levies for specific purposes. These levies are agreed with the community through consultation with community leaders and parents. The amount charged in levies varies from school to school, though interestingly the proportion of the income spent on the various levies is roughly similar (this is not just true for Gokwe North, but was witnessed in other areas where the programme is operational too).
Of the three schools interviewed in Gokwe North, the average proportional expenditure of the levies received is 40% on local activities such as a “sports levy” and repairs and maintenance of the school. 16.7% on average is given to teachers. This is a feature of rural schools where teachers are given an incentive on top of their regular salary in order to attract teachers to these schools. The rest of the levy (on average 43.3%) is used on school supplies, mainly books, which for our purposes is considered to be external expenditure.
Teachers
Although teachers derive no direct benefit from the initial transfer from the beneficiaries, through the teachers’ incentive in the school levies, they do receive a small proportion of the cash transfer indirectly. Many of these teachers come from outside the area, and on average half (50%) of this income is sent back to families in the form of remittances. The remainder is spent locally, and we assume, as with the traders and millers, that it mirrors the “non‐beneficiary expenditure” from the PDM data. We discount school fees being part of the teachers’ expenses purely on the basis that none of the teachers interviewed had children in school, and thus we reallocate this expenditure equally amongst the other actors. Thus, we conclude that 20.1% of their total income is spent on maize purchased from local farmers, 8.5% is spent with the grocer and the miller, and 17.4% with other local actors.
Clinic
Similar to the school, treatment at a clinic is technically provided free of charge. However, users are encouraged to contribute to the running of the clinic, either through a small charge per visit, or through a community wide levy. The levy is collected by the local government, but goes back to clinic in the form of paying for maintenances of the clinic, repairs and some non‐medical supplies. The extent to which this happens is a contentious issue. For our purposes we assume that all the money paid in levies to clinics is spent locally as “other local”.

13
Other local
The remaining category is a catch‐all category for miscellaneous expense incurred by the other actors including funeral costs, debt repayment, repairs and construction of buildings. For simplicity we assume that all of this is local, though it is acknowledged that this may not be the case. There is no available data to show how the income received by those in the category “other local” is used. However, we do need to assign some form of local expenditure, in order to complete the feedback loops in the model. For simplicity we will treat all of their expenditure as analogous with that of the category “trader”. This will have some local expenditure, but will also take into account that some of this may be spent outside the area, for example through the purchasing of building supplies for repairs.
Table 4: Trader, Miller and Teacher Expenditure, Gokwe North
Non‐beneficiary Traders and Millers Teachers
Total Local 100% 23% 50%
Farmer 0.392 0.090 0.209
Trader 0.145 0.033 0.085
Health 0.039 0.009 0.032
School 0.101 0.023 0
Other 0.322 0.074 0.174

14
Calculating the Multiplier for Cash
This section details how the multiplier for cash is calculated using the Social Accounting Method, and the data described in the previous section. With all the available data in place, it is possible to construct a matrix of proportional expenditures (“Technology matrix”) for Gokwe North district. This is the first step in the multiplier analysis as laid out in Appendix I.
Technology Matrix (A)
Table 5
Small Farmer
Large Farmer Trader School Teacher Clinic
other local external Total
Small Famer 0.000 0.531 0.290 0.036 0.000 0.036 0.069 0.039 1
Large Farmer 0.000 0.200 0.300 0.100 0.000 0.000 0.000 0.400 1
Trader 0.000 0.090 0.033 0.023 0.000 0.009 0.074 0.770 1
School 0.000 0.000 0.000 0.000 0.167 0.000 0.400 0.433 1
Teacher 0.000 0.209 0.085 0.000 0.000 0.032 0.174 0.500 1
Clinic 0.000 0.000 0.000 0.000 0.000 0.000 1.000 0.000 1
other local 0.000 0.090 0.033 0.023 0.000 0.009 0.074 0.770 1
external 0.000 0.000 0.000 0.000 0.000 0.000 0.000 0.000 0
Total 0.000 1.107 0.730 0.182 0.167 0.073 1.829 2.912 7
Given that there is an injection of $27,158.40 by Concern Worldwide into Gokwe North in February 2010 this translates into a Social Accounting Matrix of actual expenditures as follows:
Table 6
Small Farmer
Large Farmer Trader School Teacher Clinic
other local external Total
Small Farmer $0.00 $14,407.53 $7,886.80 $969.55 $0.00 $972.27 $1,868.50 $1,056.46 $27,161.1214
Large Farmer $0.00 $2,881.51 $4,322.26 $1,440.75 $0.00 $0.00 $0.00 $5,763.01 $14,407.53
Trader $0.00 $711.57 $263.39 $184.09 $0.00 $70.80 $584.12 $6,072.84 $7,886.80
School $0.00 $0.00 $0.00 $0.00 $161.62 $0.00 $387.82 $420.11 $969.55
Teacher $0.00 $0.00 $0.00 $0.00 $0.00 $0.00 $0.00 $0.00 $0.00
Clinic $0.00 $0.00 $0.00 $0.00 $0.00 $0.00 $972.27 $0.00 $972.27
other local $0.00 $168.58 $62.40 $43.61 $0.00 $16.77 $138.39 $1,438.74 $1,868.50
external $0.00 $0.00 $0.00 $0.00 $0.00 $0.00 $0.00 $0.00 $0.00
Total $0.00 $18,169.18 $12,534.84 $2,638.01 $161.62 $1,059.85 $3,951.10 $14,751.16 $53,265.77
14 Difference is due to rounding in the expenditure data.

15
Expenditures are shown along the row, and the proportion spent with other actors determined by the appropriate column. Once the average expenditures are in place, the overall multiplier effect can be calculated. This is explained in Appendix II
The answer matrix (y) is the total impact of the initial injection of cash once it has passed through all the rounds of spending.
Table 7 Initial Gain Total Impact
Small Farmer a $0.00 $15,766.81
Large Farmer b $14,407.53 $22,548.73
Trader c $7,886.80 $10,778.03
School d $969.55 $3,980.41
Teacher e $0.00 $6,640.43
Clinic f $972.27 $5,732.00
other local g $1,868.50 $4,759.73
external h $1,056.46
Initial local gain i $26,104.65
Initial Input j $27,158.40
Initial Total Gain m $53,263.05
Overall Total Impact p $70,206.13
Multiplier First Round 1.96
Total 2.59
The initial local gain (i) is the sum of the first round spending that occurs in the region (a+b+c+d+e+f+g). The initial input (j) $27,158.40, is also equal to (i) plus the external spending in the first round (h). The total initial gain (m) is equal to the total first round spend locally (i) plus the initial injection (j). The “first round multiplier” is calculated as (m) divided by (j). The total local impact is shown in the second column, and the sum of this is (p). Using this, the overall multiplier is calculated as p/j. For an initial input of $27,158.40 the outcome is $70,206.13 giving us a multiplier of 2.59. What this figure means and how it should be interpreted, including some of the pitfalls, is discussed in later sections.
Calculating the Food Aid multiplier
To calculate the multiplier for food aid, it is possible to use the same model, but with a slight alteration. With the cash multiplier, the impact is measured from the point at which the cash is spent, i.e. the point at which it hits the market. The multiplier is the total impact as a proportion of the total first round local spending. With food aid, if it were assumed that all the food is

16
consumed, it would never reach the market, thus the multiplier would be zero. However, putting food into the hands of beneficiaries represents an increase of resources to the region. Thus the multiplier is measured by comparing the total local impact including consumption, against the total injection. If all the food is consumed it follows that the multiplier is equal to 1.
There are however instances in which there is some multiplier from the provision of food aid. Given what is known about the processing of maize into flour for consumption, some knock on effects to the local economy of supplying food aid in the form of maize are evident. The assumption is that, in the absence of available cash, the miller takes a share of the maize they mill in lieu of payment. This is borne out in the expenditure data, and focus group discussions with beneficiaries and millers. According to the Maize Market Assessment study in October 200915, households were paying 1 gallon (5 litre container) to mill a 20 litre (17.5 kg) bucket of maize. Alternatively, those able to pay cash would pay US$1. This will have implications for the multiplier16.
Another way in which food aid could have multiplier effects is if some of it is used to barter for other goods and services. Prior to the programme it was noted that 60% of transactions took place through barter. The PDM data shows only insignificant amounts of the food aid being bartered; although this result may be due to recipients being unwilling to admit in these surveys that they do not consume all the food aid they receive. However, feedback based on the experience of programme staff, combined with information gathered from focus group discussions with local traders, all point to a much higher proportion of food aid being bartered. As shown above they might exchange a proportion of the maize for milling services. There is also evidence that beneficiaries exchange some of the food with local “scotch‐cart” operators to transport the food home from the distribution site. Looking at the data for the cash beneficiaries, it is also clear that the very poorest in the region have needs beyond what is provided in the food aid transfer. This includes other food items (such as sugar and salt) as well as non‐food items such as paraffin, matches or soap. It is conceivable that food beneficiaries will also need these items and may exchange some of their food aid in return for them.
As a way of considering the potential local impact of this bartering, this section examines a series of hypothetical scenarios based on possible outcomes rather than using the data on bartering observed by the monitoring reports.
To calculate the food multiplier, the same model is used. It is assumed that aside from the food aid beneficiaries, the rest of the market operates as presented in the previous section, i.e. the spending patterns of all the actors and thus the underlying model are the same. The following
15 GreatMinds Investments (2009). Concern Worldwide Zimbabwe, Maize Value Chain Analysis and Assessment Tools Development Gokwe North, Gokwe South and Nyanga Districts, Zimbabwe, Harare, October 2009 16 It should be noted that this only occurs when unprocessed maize is provided, rather than bulgar wheat or pre‐processed maize meal.

17
section simulates three different scenarios of what could potentially be happening with the food once it is given to the beneficiaries. The three scenarios are:17
1. The beneficiaries use a proportion of the maize they receive to pay for milling services
2. The beneficiaries barter 20% of the value of the food they receive for other goods
3. The beneficiaries barter 30% of the value of the food they receive for other goods
The following section presents these three scenarios, and their implications for the multiplier, using the same techniques as used for the cash multiplier.
Scenario 1
In scenario 1, it is assumed that the miller takes a share of the beneficiaries’ transfer as payment for milling services. As previously stated, the market research shows that the miller takes a 5‐litre bucket of maize for every 20‐litre bucket that he processes. Thus it can be said that for every 1kg that is given in food aid, 25% goes to the miller (and only 75% to the beneficiary). This represents an increase in income for the miller, and a corresponding decrease in the value of the transfer to the beneficiary. Maize accounts for 32% of the value of the food aid transfer for Gokwe North. If 25% of this is exchanged for milling, the miller receives 8% of the total value of the food transfer, with 92% consumed by the beneficiary. The final results are:
17 These scenarios were based on the assumptions and conversations with Concern’s Country Director for Zimbabwe

18
Table 8 Initial Gain Total Impact
Small Farmer a $0.00 $136.83
Large Farmer b $0.00 $655.07
Trader c $1,582.98 $1,712.43
School d $0.00 $103.31
Teacher e $0.00 $309.13
Clinic f $0.00 $129.45
other local g $0.00 $129.45
external h $18,227.61
Initial local gain i $1,582.98
Initial Input j $19,810.59
Initial Total Gain m $21,393.56
Overall Total Impact p $3,175.68
q $22,986.27
Multiplier First Round 1.08
Total 1.16
The initial local gain is only to the trader (c). The total initial gain locally (m) is the gain to the trader plus the value of the food (j). The first round multiplier is m/j. The total impact (q) is the multiplier effect of the initial multiplier (p) plus the initial input (j). The multiplier is given by q/j. The result for scenario 1 is a multiplier of 1.16.
Scenario 2
The second assumption is that the food is used for other payments and barter of other goods. This is based on anecdotal evidence from the research. There is no reliable data to support this, but for sake of argument it is assumed that 80% of the food is consumed, that 20% goes to the trader category. This could be for milling, or bartered for goods. It could in theory also be going to the “other local” category, but as their expenditure patterns are the same as the trader, the result would not affect the overall multiplier and for clarity it is assumed all of this goes to the trader category. Using the same steps as scenario 1, the multiplier for scenario 2 is 1.43
Scenario 3
In scenario 3, the same logic is applied as scenario 2, but the assumption is that 30% is bartered with traders. The multiplier for scenario 3, where 30% of the food aid is bartered is 1.67.

19
Explaining the food multiplier
These figures above aim to show that from an economic perspective, food aid is not just a static injection on a region, but that it can have some multiplier effects. The injection itself is treated as a positive resource gain for the region, and other knock on effects build from this. How the beneficiaries use the transfer to elicit other goods and services affects the multiplier. Gains to the trader and the grocer are assumed to be converted from food to cash relatively easily which might be an unrealistic assumption given the lack of general liquidity in regions that only receive food aid. Nevertheless, with this assumption, the knock‐on effects are not insignificant. Up to 30% of the value of the food aid transfer enters the local economy and thus is calculated through all the actors and their interrelations. Given what was noted in the previous section about the feedback loops affecting local trade, gains of up to 67% on top of the value of the food injected are possible given the assumptions. More rigorous comparisons with the cash multiplier and what this means in the context of this study are discussed in the following section.
Interpreting the multipliers for Cash and Food
Multipliers are used to show the impact of an exogenous injection on local economy. They aim to show not just what the initial impact is, but also other benefits that may accrue from the intervention. Earlier sections have noted that a multiplier stimulates production and therefore growth in an economy. However, previous research has shown that the positive impact of cash transfers for rural poor households do not necessarily result in economic growth for the region. Nor is this the intended impact of the cash transfer in the ZECT programme.
The central question of this paper has been to evaluate the relative impact of cash transfers and food aid on the economy of Gokwe North. Intuitively, the multiplier for cash, which is spent, versus food, which is consumed, would be much greater. The aim has been to quantify this difference. The results are summarised in Table 9.
Table 9: Multiplier figures for Food Aid and Cash Transfers in Gokwe North, Zimbabwe Scenario Multiplier
Food Aid – 100% consumption 1
Food Aid – Maize exchanged for milling 1.17
Food Aid – 20% barter simulation 1.43
Food Aid – 30% barter simulation 1.67
Cash Transfers 2.59
A multiplier of 2.59 for cash, and a high of 1.67 for the food injection, indicates that whatever the relative impacts at a household level, injecting cash rather than food into the pilot wards of Gokwe North had quantifiable benefits for more than just the direct recipient households.
These impacts can be described as follows:
20
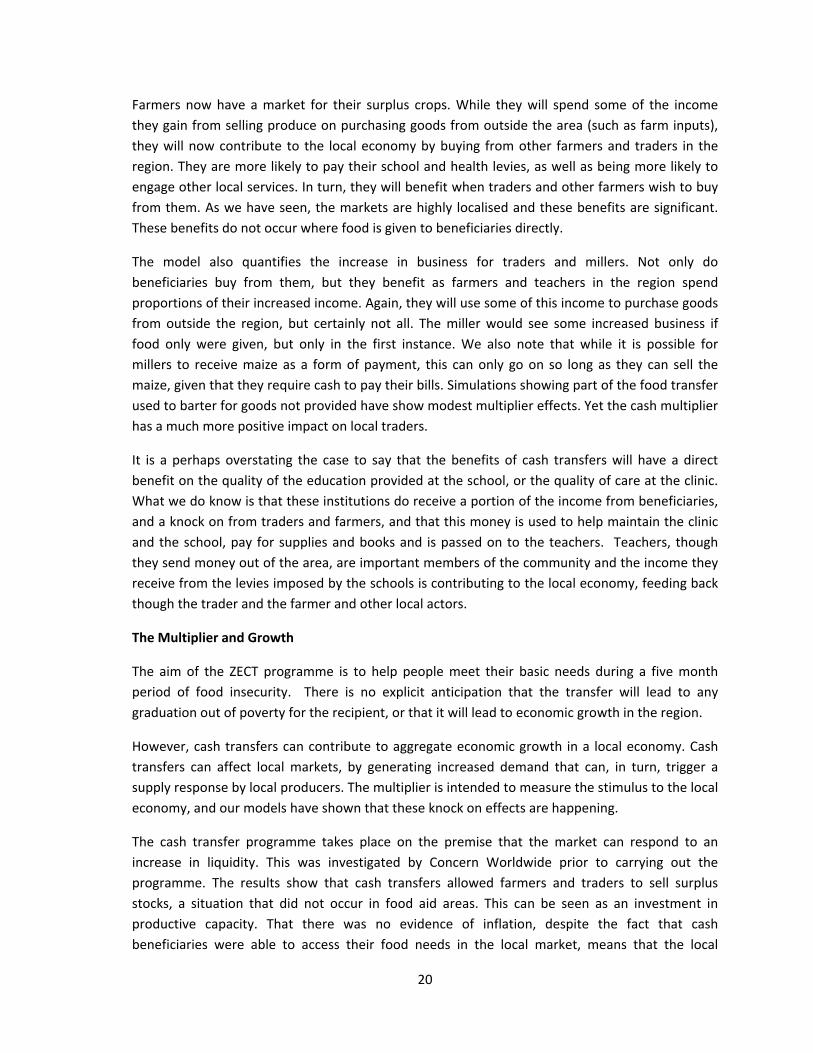
Farmers now have a market for their surplus crops. While they will spend some of the income they gain from selling produce on purchasing goods from outside the area (such as farm inputs), they will now contribute to the local economy by buying from other farmers and traders in the region. They are more likely to pay their school and health levies, as well as being more likely to engage other local services. In turn, they will benefit when traders and other farmers wish to buy from them. As we have seen, the markets are highly localised and these benefits are significant. These benefits do not occur where food is given to beneficiaries directly.
The model also quantifies the increase in business for traders and millers. Not only do beneficiaries buy from them, but they benefit as farmers and teachers in the region spend proportions of their increased income. Again, they will use some of this income to purchase goods from outside the region, but certainly not all. The miller would see some increased business if food only were given, but only in the first instance. We also note that while it is possible for millers to receive maize as a form of payment, this can only go on so long as they can sell the maize, given that they require cash to pay their bills. Simulations showing part of the food transfer used to barter for goods not provided have show modest multiplier effects. Yet the cash multiplier has a much more positive impact on local traders.
It is a perhaps overstating the case to say that the benefits of cash transfers will have a direct benefit on the quality of the education provided at the school, or the quality of care at the clinic. What we do know is that these institutions do receive a portion of the income from beneficiaries, and a knock on from traders and farmers, and that this money is used to help maintain the clinic and the school, pay for supplies and books and is passed on to the teachers. Teachers, though they send money out of the area, are important members of the community and the income they receive from the levies imposed by the schools is contributing to the local economy, feeding back though the trader and the farmer and other local actors.
The Multiplier and Growth
The aim of the ZECT programme is to help people meet their basic needs during a five month period of food insecurity. There is no explicit anticipation that the transfer will lead to any graduation out of poverty for the recipient, or that it will lead to economic growth in the region.
However, cash transfers can contribute to aggregate economic growth in a local economy. Cash transfers can affect local markets, by generating increased demand that can, in turn, trigger a supply response by local producers. The multiplier is intended to measure the stimulus to the local economy, and our models have shown that these knock on effects are happening.
The cash transfer programme takes place on the premise that the market can respond to an increase in liquidity. This was investigated by Concern Worldwide prior to carrying out the programme. The results show that cash transfers allowed farmers and traders to sell surplus stocks, a situation that did not occur in food aid areas. This can be seen as an investment in productive capacity. That there was no evidence of inflation, despite the fact that cash beneficiaries were able to access their food needs in the local market, means that the local

21
markets were functioning well enough to respond to the increase in demand. Although the programme does not intend to help productive farmers and traders directly, they gain significantly.
Caution is needed in translating the existence of a multiplier into economic growth for Gokwe North. The model assumes that all the necessary resources are available as needed and that prices are unaffected. In other words, there are no binding constraints. But economics is the science of scarce resources and constraints do act in limiting what can be done. In more general terms, when resource constraints are at work, extra resources for producing more of a good can only be found if they are shifted from elsewhere. If production cannot increase beyond a set amount, this implies an economy‐wide general reallocation. Though the model shows that supply responded to meet the needs of cash recipients, they were relatively few in number and there was an existing excess supply in the market to meet their need. This assumption cannot be extrapolated out into a larger programme without the market reaching saturation point, at least not without further investment in agriculture. This study does not focus on the impact of cash transfers or food aid on food production in any empirical sense. We have seen that cash transfers allowed farmers, traders and millers to sell surplus stock and we can assume that they will invest some of this income in future production. That this did not happen in areas that were in receipt of food aid points to some evidence that the food aid did crowd out sales by local farmers, traders and millers. The negative impacts of food aid on production are gaining increased attention in recent years. Gelan (2006)18 uses a Computable General Equilibrium (CGE) model to show the impact of removing food aid in Ethiopia. His model focused on the disincentive effects of food aid on local production. Many of characteristics identified in Ethiopia in his study are similar to those observed in Zimbabwe, namely poor farmers as producers and consumers of staple crops and with regional and localized food deficits off‐set by surpluses in neighbouring regions and wards. His model showed that removing food aid would have a positive impact on local food production of between 2.5% and 4.5%, the latter figure coming about if food was replaced with cash transfers.
However we can see that there is a marked difference in the impact of food and cash on local employment in agriculture. Recipients of cash transfer indicated that the time previously spent on casual labour was now spent working in their own fields. Most households receiving cash indicated that they “do not need to do maricho (casual labour) anymore as the cash we receive is enough to cover our monthly needs”19. On average those receiving food aid were engaged in maricho 3 to 5 days a month while those not beneficiating from the programme worked on average 8‐10 days a month. While those receiving cash are less likely to seek casual labour than those receiving food only, this can have two positive effects. Firstly, they spend more time
18 Gelan, A.U. (2007) Does food aid have disincentive effects on local production? A general equilibrium perspective on food aid in Ethiopia; Food Policy 32 (2007) 436–458 available at www.elsevier.com/locate/foodpol 19 Concern Worldwide Zimbabwe (2010) Zimbabwe Emergency Cash Transfer (ZECT) Pilot Programme Monitoring Consolidated Report, November 2009 to March 2010, Elena Ruiz Roman, Harare, April 2010

22
working on their own production which could lead increased production for themselves. Secondly, those seeking casual labour have more power to demand higher wages. There was no evidence to suggest that the cash transfers led to an undersupply of labour20, thus the overall impact on local food production would be positive.
Conclusions
The aim of this study has been to quantify the differences in the impact on local markets of two forms of aid assistance, cash transfers and food aid. Specifically the study compared two modalities of the Concern Worldwide “Zimbabwe Emergency Cash Transfer” (ZECT) programme, one modality that gave recipients food rations, and one that gave recipients a cash equivalent. A form of Social Accounting Matrix was constructed to show proportional expenditures between all the economic actors in the region. Using data from the programme, the multiplier matrix model was used to calculate the multiplier for each intervention. Expenditure of the cash and use of the food was calculated through all the various actors. Knock‐on effects were observed and the total proportion of local spending as a proportion of the injection was quantified. The multiplier represents the impact of each intervention on all the other actors in the region, and thus the overall market impact of the intervention.
The results show a multiplier figure for cash transfers to poor households of 2.59 with a food aid multiplier of between 1 and 1.67 depending on assumptions. Cash transfers therefore have a much bigger impact on local markets than food aid.
Cash is spent with many different actors in the region, where as food aid is either consumed in its entirety, or a small proportion goes to local millers or traders. The cash is not just spent once however, it is re‐spent with other actors, and is re‐spent again. At every stage cash is ‘leaking’ out of the area, but overall enough is being spent locally to generate a significant multiplier for cash.
However, some notes of caution are needed here. Firstly, the multiplier only measures the impact on the market and makes no judgement on the impact at household level. Secondly, the existence of a high multiplier for cash in this study is reflective of the context in which the programme was instigated. The study has shown that the markets in rural Zimbabwe are highly localised which drives up the multiplier, but this means there is little trade with actors outside the area. Ultimately, it is considered better for markets to be integrated to maximise the benefits of trade.
Secondly, the cash transfer programme was instigated on the basis that the market would be able to respond by increasing supply. This is also an inherent assumption of the model. Given the situation this was a reasonable assumption and one that proved to be correct. However, rural suppliers would not always be able to increase supply in the short term, or at least their ability to do so is limited by regular constraints. These constraints are not captured in the model, which
20 Concern Worldwide Zimbabwe (2010) Zimbabwe Emergency Cash Transfer (ZECT) Pilot Programme Monitoring Consolidated Report, November 2009 to March 2010, Elena Ruiz Roman, Harare, April 2010

23
assumes that the ability to increasing supply as incomes rise is unconstrained. Rural producers cannot increase production in the short‐term, and their ability to do so in the long‐term is unclear. That it works in this situation is down to the excess capacity in the market and was a particular characteristic of this market at this time. Also it is unclear what would have happened to supply in the market had there been many more cash beneficiaries. The effect of food aid and cash aid on local production is an interesting issue but one that requires a longer‐term study than what was possible with this programme.
For the food model there is a further cautionary note. The study has assumed that the injection of “free food” into the region is a positive gain for the market. While the impact is lower than the impact of cash, it is still considered positive as the increase in food in the area is treated as part of the multiplier. Yet it could be argued, particularly when looking at market response to a liquidity increase, that food aid is actually “crowding out” local producers and suppliers. If this were taken into account and found to be occurring, the multiplier for food could in fact be less than 1. This is not measured in this model, but the possibility is worth noting nonetheless.
Overall however, the multiplier effect is clear. Given the situation that existed in Gokwe North in late 2009, the injection of cash to very poor households had a much more significant positive impact on the market than distributions of food rations. The existence of significant multiplier effects in rural economies when cash is given to extremely poor households should also inform the wider debate about the market advantages of providing cash as a form of social protection to the most vulnerable.
From a market impact perspective, the existence of a higher multiplier for providing cash transfers than for food aid in response to the humanitarian crisis in Zimbabwe in late 2009 and early 2010 shows that providing cash transfers was hugely beneficial, not just for the recipients, but for the local market and the wider community in the Gokwe North region.
24
Appendix I
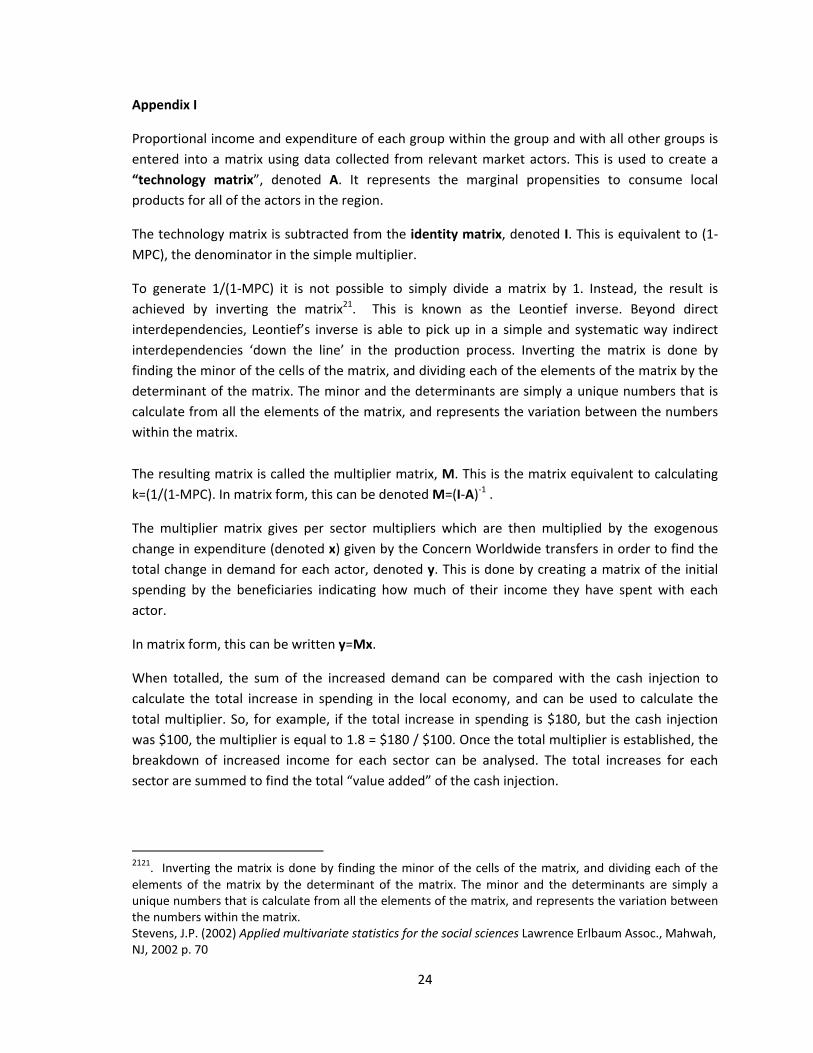
Proportional income and expenditure of each group within the group and with all other groups is entered into a matrix using data collected from relevant market actors. This is used to create a “technology matrix”, denoted A. It represents the marginal propensities to consume local products for all of the actors in the region.
The technology matrix is subtracted from the identity matrix, denoted I. This is equivalent to (1‐MPC), the denominator in the simple multiplier.
To generate 1/(1‐MPC) it is not possible to simply divide a matrix by 1. Instead, the result is achieved by inverting the matrix21. This is known as the Leontief inverse. Beyond direct interdependencies, Leontief’s inverse is able to pick up in a simple and systematic way indirect interdependencies ‘down the line’ in the production process. Inverting the matrix is done by finding the minor of the cells of the matrix, and dividing each of the elements of the matrix by the determinant of the matrix. The minor and the determinants are simply a unique numbers that is calculate from all the elements of the matrix, and represents the variation between the numbers within the matrix.
The resulting matrix is called the multiplier matrix, M. This is the matrix equivalent to calculating k=(1/(1‐MPC). In matrix form, this can be denoted M=(I‐A)‐1 .
The multiplier matrix gives per sector multipliers which are then multiplied by the exogenous change in expenditure (denoted x) given by the Concern Worldwide transfers in order to find the total change in demand for each actor, denoted y. This is done by creating a matrix of the initial spending by the beneficiaries indicating how much of their income they have spent with each actor.
In matrix form, this can be written y=Mx.
When totalled, the sum of the increased demand can be compared with the cash injection to calculate the total increase in spending in the local economy, and can be used to calculate the total multiplier. So, for example, if the total increase in spending is $180, but the cash injection was $100, the multiplier is equal to 1.8 = $180 / $100. Once the total multiplier is established, the breakdown of increased income for each sector can be analysed. The total increases for each sector are summed to find the total “value added” of the cash injection.
2121. Inverting the matrix is done by finding the minor of the cells of the matrix, and dividing each of the elements of the matrix by the determinant of the matrix. The minor and the determinants are simply a unique numbers that is calculate from all the elements of the matrix, and represents the variation between the numbers within the matrix. Stevens, J.P. (2002) Applied multivariate statistics for the social sciences Lawrence Erlbaum Assoc., Mahwah, NJ, 2002 p. 70

25
The multiplier matrix can be said to be comprised of, as Pyatt and Round (1979)22 suggested, three economically meaningful components. Firstly, there is a transfer matrix that picks up the net multiplier effects of the exogenous transfer on internal actors. Secondly there is an open‐loop matrix that captures the cross effects between different actors. Thirdly there is a closed‐loop matrix detailing the multiplier effects of the exogenous inflow on the endogenous actors. There are also several assumptions in the model. Firstly, prices are assumed to remain constant. This means that the model implicitly assumes that there exists an excess capacity of production, or supply. Secondly, all production technology and resource endowments are given. As a result, the analysis is necessarily a short term one and no dynamic of any kind can be taken into account. Finally, the propensities of the actors remain constant and are not affected. In the basic analysis, income elasticities are unitary, therefore the prevailing average expenditure propensities are assumed to apply to any incremental injection (The multiplier can be seen as the matrix of average expenditure propensities) 23. This is an unrealistic assumption, but it is unavoidable in such analyses. It is also an assumption of the basic multiplier theory (Davies; 2007). These assumptions are important when interpreting the results of the model. A social accounting matrix (SAM) represents a particular geographic area. As the Concern programme is split over 3 areas it was decided to concentrate this study on the Gokwe North region as it had the most comprehensive data available.
22 Pyatt and Round, J. (1979), Accounting and fixed price multiplier in a social accounting matrix, Economic Journal no. 89, pp. 850‐873 23 Dumont, J.C. (2000) SAM Multiplier Analysis available at http://www.pep‐net.org/fileadmin/medias/pdf/FicheMultiplicateur.pdf
26
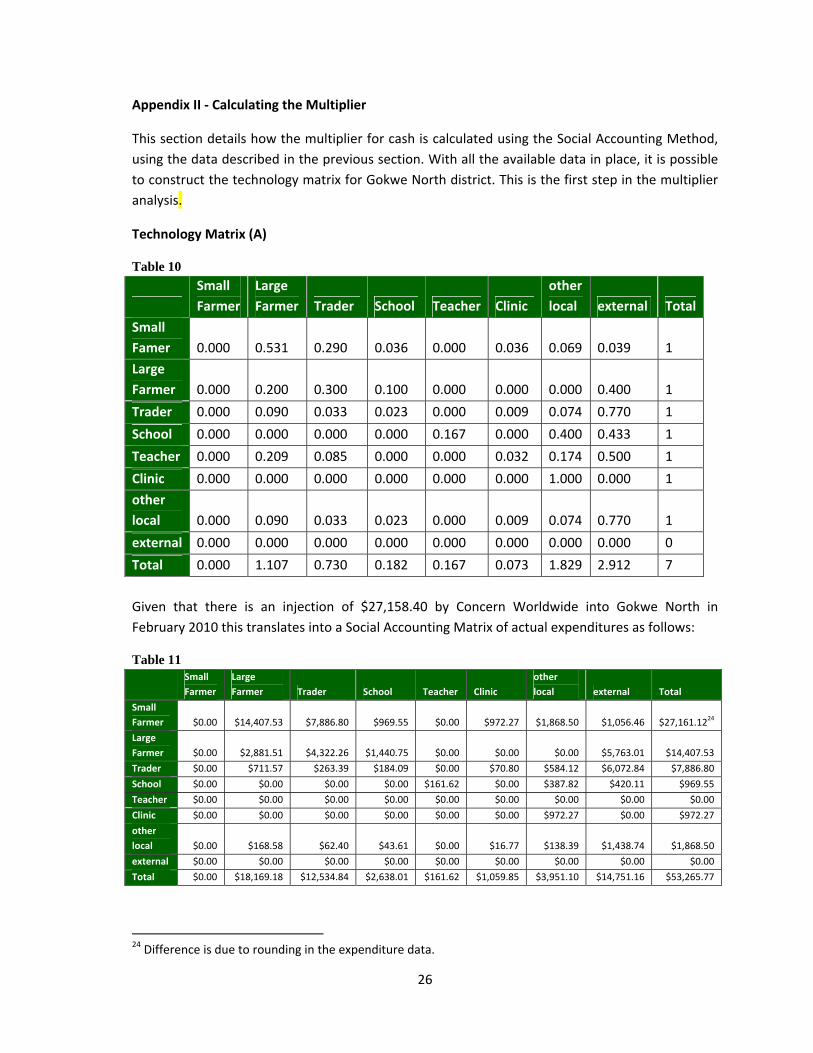
Appendix II ‐ Calculating the Multiplier
This section details how the multiplier for cash is calculated using the Social Accounting Method, using the data described in the previous section. With all the available data in place, it is possible to construct the technology matrix for Gokwe North district. This is the first step in the multiplier analysis.
Technology Matrix (A)
Table 10
Small Farmer
Large Farmer Trader School Teacher Clinic
other local external Total
Small Famer 0.000 0.531 0.290 0.036 0.000 0.036 0.069 0.039 1
Large Farmer 0.000 0.200 0.300 0.100 0.000 0.000 0.000 0.400 1
Trader 0.000 0.090 0.033 0.023 0.000 0.009 0.074 0.770 1
School 0.000 0.000 0.000 0.000 0.167 0.000 0.400 0.433 1
Teacher 0.000 0.209 0.085 0.000 0.000 0.032 0.174 0.500 1
Clinic 0.000 0.000 0.000 0.000 0.000 0.000 1.000 0.000 1
other local 0.000 0.090 0.033 0.023 0.000 0.009 0.074 0.770 1
external 0.000 0.000 0.000 0.000 0.000 0.000 0.000 0.000 0
Total 0.000 1.107 0.730 0.182 0.167 0.073 1.829 2.912 7
Given that there is an injection of $27,158.40 by Concern Worldwide into Gokwe North in February 2010 this translates into a Social Accounting Matrix of actual expenditures as follows:
Table 11
Small Farmer
Large Farmer Trader School Teacher Clinic
other local external Total
Small Farmer $0.00 $14,407.53 $7,886.80 $969.55 $0.00 $972.27 $1,868.50 $1,056.46 $27,161.1224
Large Farmer $0.00 $2,881.51 $4,322.26 $1,440.75 $0.00 $0.00 $0.00 $5,763.01 $14,407.53
Trader $0.00 $711.57 $263.39 $184.09 $0.00 $70.80 $584.12 $6,072.84 $7,886.80
School $0.00 $0.00 $0.00 $0.00 $161.62 $0.00 $387.82 $420.11 $969.55
Teacher $0.00 $0.00 $0.00 $0.00 $0.00 $0.00 $0.00 $0.00 $0.00
Clinic $0.00 $0.00 $0.00 $0.00 $0.00 $0.00 $972.27 $0.00 $972.27
other local $0.00 $168.58 $62.40 $43.61 $0.00 $16.77 $138.39 $1,438.74 $1,868.50
external $0.00 $0.00 $0.00 $0.00 $0.00 $0.00 $0.00 $0.00 $0.00
Total $0.00 $18,169.18 $12,534.84 $2,638.01 $161.62 $1,059.85 $3,951.10 $14,751.16 $53,265.77
24 Difference is due to rounding in the expenditure data.

27
Expenditures are shown along the row, and the proportion spent with other actors determined by the appropriate column. Once the average expenditures are in place, the overall multiplier effect can be calculated. Using the steps laid out in appendix III , the technology matrix must first be subtracted from its identity matrix (I) which is a matrix where all the cells are equal to zero, except for those along the diagonal axis, which represent an actors’ expenditure with itself and are thus equal to 1.
Identity Matrix (I)
Table 12
Beneficiary Farmer Trader School Teacher Clinic other local external
Beneficiary 1 0 0 0 0 0 0 0
Farmer 0 1 0 0 0 0 0 0
Trader 0 0 1 0 0 0 0 0
School 0 0 0 1 0 0 0 0
Teacher 0 0 0 0 1 0 0 0
Clinic 0 0 0 0 0 1 0 0
other local 0 0 0 0 0 0 1 0
external 0 0 0 0 0 0 0 1
Which allows us to calculate (I‐A)
(I‐A)
Table 13
Beneficiary Farmer Trader School Teacher Clinic other local external
Beneficiary 1.000 ‐0.531 ‐0.290 ‐0.036 0.000 ‐0.036 ‐0.069 ‐0.039
Farmer 0.000 0.800 ‐0.300 ‐0.100 0.000 0.000 0.000 ‐0.400
Trader 0.000 ‐0.090 0.967 ‐0.023 0.000 ‐0.009 ‐0.074 ‐0.770
School 0.000 0.000 0.000 1.000 ‐0.167 0.000 ‐0.400 ‐0.433
Teacher 0.000 ‐0.209 ‐0.085 0.000 1.000 ‐0.032 ‐0.174 ‐0.500
Clinic 0.000 0.000 0.000 0.000 0.000 1.000 ‐1.000 0.000
other local 0.000 ‐0.090 ‐0.033 ‐0.023 0.000 ‐0.009 0.926 ‐0.770
external 0.000 0.000 0.000 0.000 0.000 0.000 0.000 1.000

28
The Matrix (I‐A) is then inverted, to give (I‐A)‐1 , which is the multiplier matrix (M)
Table 14
Beneficiary Farmer Trader School Teacher Clinic other local external
Beneficiary 1.000 0.755 0.544 0.129 0.022 0.043 0.225 1.000
Farmer 0.000 1.314 0.413 0.144 0.024 0.005 0.106 1.000
Trader 0.000 0.137 1.082 0.042 0.007 0.011 0.118 1.000
School 0.000 0.105 0.062 1.023 0.171 0.008 0.495 1.000
Teacher 0.000 0.299 0.179 0.041 1.007 0.024 0.288 1.000
Clinic 0.000 0.137 0.082 0.042 0.007 1.011 1.118 1.000
other local 0.000 0.137 0.082 0.042 0.007 0.011 1.118 1.000
external 0.000 0.000 0.000 0.000 0.000 0.000 0.000 1.000
This inverted matrix, ignoring the external expenditure, is now multiplied by the initial spending of the beneficiaries. The amount transferred to beneficiaries in Gokwe North in February 2010 was $27,158.40, and given what we know about where the first round of spending by beneficiaries occurs we can say that the first round result is as follows:
Table 15
Initial Gain
Beneficiary 0.00
Farmer 14407.53
Trader 7886.80
School 969.55
Teacher 0.00
Clinic 972.27
other local 1868.50
External 1056.46
Both of these tables are put in to matrix form and multiplied (see Appendix III). This is represented as follows:
Matrix 1 1.000 0.755 0.545 0.129 0.022 0.043 0.225 0.000 0.000 1.315 0.414 0.144 0.024 0.005 0.105 14407.531 0.000 0.137 1.082 0.042 0.007 0.011 0.118 7886.799 0.000 0.107 0.065 1.024 0.171 0.010 0.491 x 969.555 0.000 0.315 0.195 0.042 1.007 0.036 0.262 0.000 0.000 0.137 0.082 0.042 0.007 1.011 1.118 972.271 0.000 0.137 0.082 0.042 0.007 0.011 1.118 1868.498

29
The first matrix is the multiplier Matrix (M). The second matrix is the initial input from the Cash transfers programme, by how it is initially spent (x).
In the ZECT matrix the result therefore is:
Matrix 2
1.000 0.755 0.545 0.129 0.022 0.043 0.225 0.000 15760.0170.000 1.315 0.414 0.144 0.024 0.005 0.105 14407.531 22541.1720.000 0.137 1.082 0.042 0.007 0.011 0.118 7886.799 10775.8340.000 0.107 0.065 1.024 0.171 0.010 0.491 x 969.555 = 3926.558 0.000 0.315 0.195 0.042 1.007 0.036 0.262 0.000 6322.676 0.000 0.137 0.082 0.042 0.007 1.011 1.118 972.271 5729.804 0.000 0.137 0.082 0.042 0.007 0.011 1.118 1868.498 4757.533
The answer matrix (y) is the total impact of the initial injection of cash once it has passed through all the rounds of spending.
Table 16 Initial Gain Total Impact
Small Farmer a $0.00 $15,766.81
Large Farmer b $14,407.53 $22,548.73
Trader c $7,886.80 $10,778.03
School d $969.55 $3,980.41
Teacher e $0.00 $6,640.43
Clinic f $972.27 $5,732.00
other local g $1,868.50 $4,759.73
external h $1,056.46
Initial local gain i $26,104.65
Initial Input j $27,158.40
Initial Total Gain m $53,263.05
Overall Total Impact p $70,206.13
Multiplier First Round 1.96
Total 2.59
The initial local gain (i) is the sum of the first round spending that occurs in the region (a+b+c+d+e+f+g). The initial input (j) $27,158.40, is also equal to (i) plus the external spending in

30
the first round (h). The total initial gain (m) is equal to the total first round spend locally (i) plus the initial injection (j). The “first round multiplier” is calculated as (m) divided by (j). The total local impact is shown in the second column, and the sum of this is (p). Using this, the overall multiplier is calculated as p/j. For an initial input of $27,158.40 the outcome is $70,206.13 giving us a multiplier of 2.59.
31
Appendix III ‐ Matrix Algebra
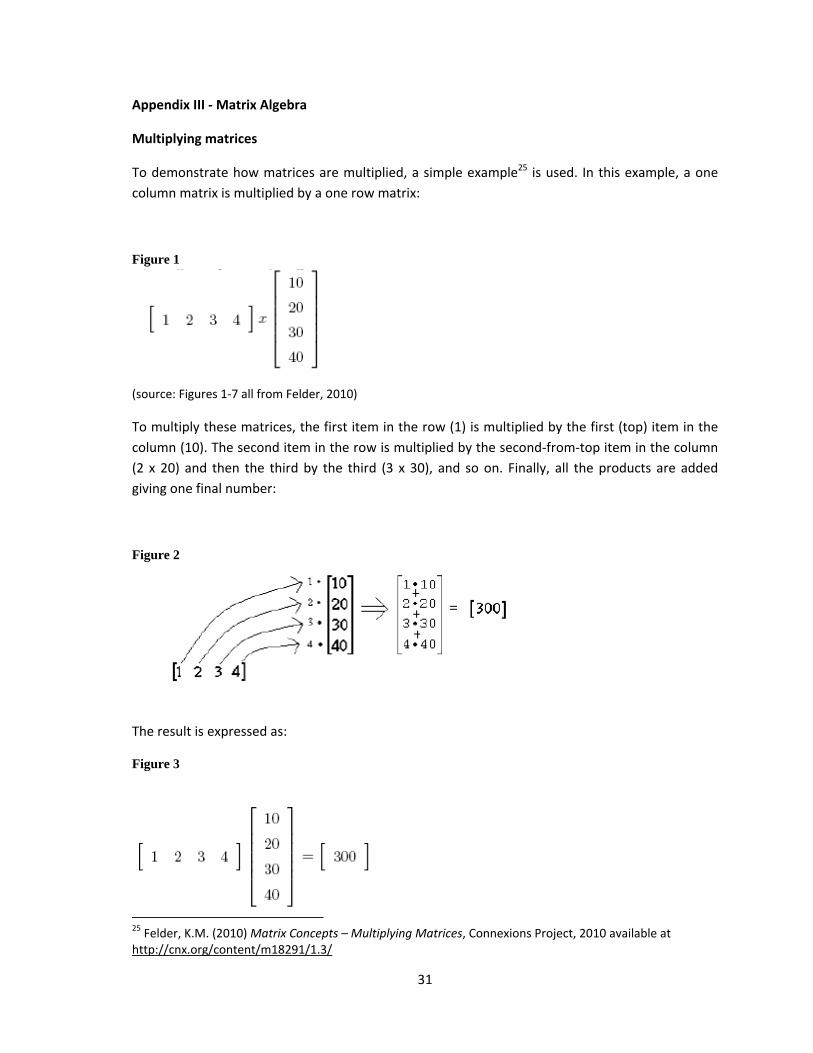
Multiplying matrices
To demonstrate how matrices are multiplied, a simple example25 is used. In this example, a one column matrix is multiplied by a one row matrix:
Figure 1
(source: Figures 1‐7 all from Felder, 2010)
To multiply these matrices, the first item in the row (1) is multiplied by the first (top) item in the column (10). The second item in the row is multiplied by the second‐from‐top item in the column (2 x 20) and then the third by the third (3 x 30), and so on. Finally, all the products are added giving one final number:
Figure 2
The result is expressed as:
Figure 3
25 Felder, K.M. (2010) Matrix Concepts – Multiplying Matrices, Connexions Project, 2010 available at http://cnx.org/content/m18291/1.3/
32
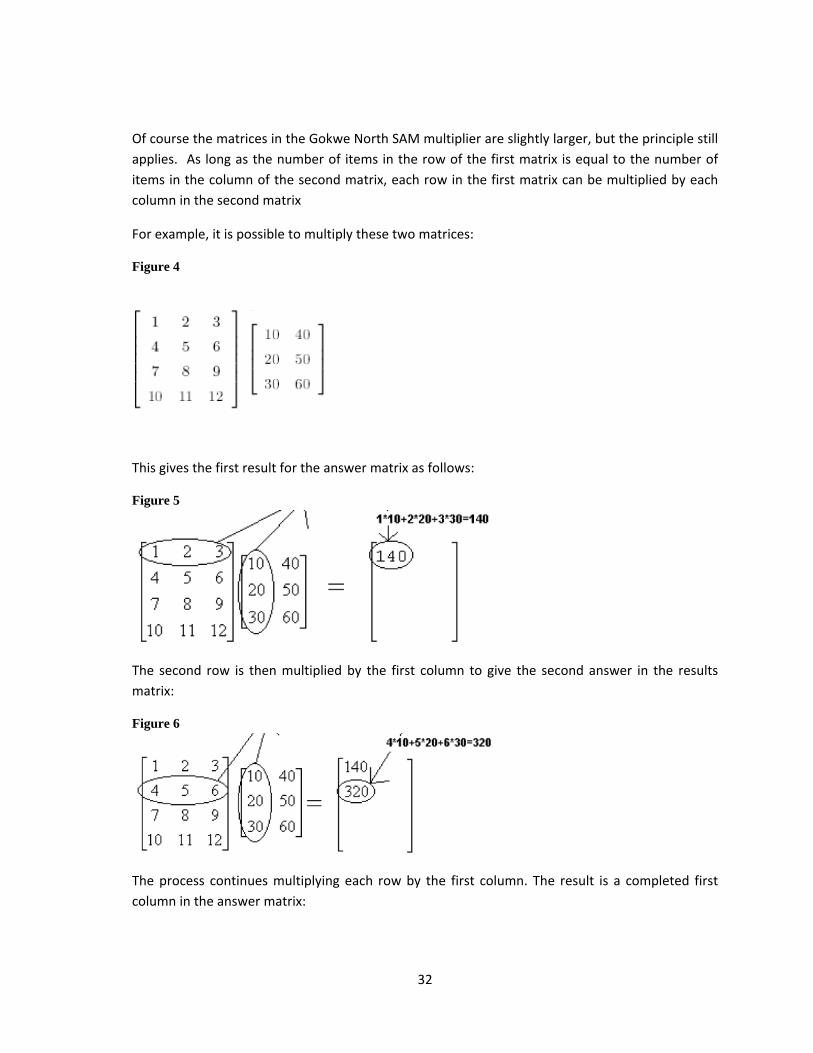
Of course the matrices in the Gokwe North SAM multiplier are slightly larger, but the principle still applies. As long as the number of items in the row of the first matrix is equal to the number of items in the column of the second matrix, each row in the first matrix can be multiplied by each column in the second matrix
For example, it is possible to multiply these two matrices:
Figure 4
This gives the first result for the answer matrix as follows:
Figure 5
The second row is then multiplied by the first column to give the second answer in the results matrix:
Figure 6
The process continues multiplying each row by the first column. The result is a completed first column in the answer matrix:

33
Figure 7
The process can then continue starting again at the first row, but multiplying against the second column.

34
REFERENCES
Armstrong, H., Taylor, J. (2000) Regional Economics and Policy (Third Edition), Blackwell Publishers, Oxford, 2000
Breisinger, C., Thomas, M. and Thurlow, J. (2009). Social accounting matrices and multiplier analysis: An introduction with exercises. Food Security in Practice technical guide 5. International Food Policy Research Institute. Washington, D.C. Cardente, M.A., and Sancho, F. (2010) The Role of Supply Constraints in Multiplier Analysis (draft) Universidad Pablo de Olavide, Seville, Spain Concern Worldwide Zimbabwe (2009) Annual Programme Progress Report, Zimbabwe 2009 Concern Worldwide Zimbabwe (2009). Zimbabwe Emergency Cast Transfer Programme (ZECT) Baseline Survey. Prepared Elena Ruiz Roman, Harare, December 2009 Concern Worldwide Zimbabwe (2009) Cash Transfer Pilot In Zimbabwe 2009‐10: Detailed Concept Note (unpublished internal document), Harare, 2009 Concern Worldwide Zimbabwe (2010) Zimbabwe Emergency Cash Transfer (ZECT) Pilot Programme Monitoring Consolidated Report, November 2009 to March 2010, Elena Ruiz Roman, Harare, April 2010 Davies, S. (2007) Making the Most of It: A Regional Multiplier Approach to Estimating the Impact of Cash Transfers on the Market in Dowa, Malawi, Concern Worldwide Malawi, 2007 Devereux, S., Myula, P., and Solomon, C. (2006) After the FACT: An Evaluation of Concern Worldwide’s Food and Cash Transfers Project in Three Districts of Malawi, Institute of Development Studies, University of Sussex, June 2006 Devereux, S. (2007) Smart Cards for Smart Women: An Evaluation of Concern Worldwide’s Dowa Emergency Cash Transfer Project (DECT) in Malawi. Institute of Development Studies, University of Sussex, 2007 Devereux, S., and Mhlanga, M. (2008) Cash Transfers in Lesotho: An evaluation of World Vision’s Cash and Food Transfers Pilot Project, Institute of Development Studies, July 2008 Devereux, S. et.al. (2010) Social Protection in Africa: Where next? Centre for Social Protection (CSP) at the Institute of Development Studies (IDS), the Social Protection Programme at the Overseas Development Institute (ODI), the School of International Development at the University of East Anglia (UEA‐DEV), and the Regional Hunger & Vulnerability Programme (RHVP) (2010) (online) http://www.odi.org.uk/resources/download/4884.pdf Dumont, J.C. (2000) SAM Multiplier Analysis (online) available at http://www.pep‐net.org/fileadmin/medias/pdf/FicheMultiplicateur.pdf
35
Gelan, A.U, (2006). Cash or Food Aid? A General Equilibrium Analysis for Ethiopia, Development Policy Review, 2006, 24 (5): 601‐624, Oxford Gelan, A.U. (2007) Does food aid have disincentive effects on local production? A general equilibrium perspective on food aid in Ethiopia; Food Policy 32 (2007) 436–458 available at www.elsevier.com/locate/foodpol Gilligan, D.O. and Hoddinott, J. (2006) Is There Persistence in the Impact of Emergency Food Aid? Evidence on Consumption, Food Security, and Assets in Rural Ethiopia, International Food Policy Research Institute (IFPRI), Food Consumption and Nutrition Division (FNCD) Discussion Paper 209, Washington, 2006
GreatMinds Investments (2009). Concern Worldwide Zimbabwe, Maize Value Chain Analysis and Assessment Tools Development Gokwe North, Gokwe South and Nyanga Districts, Zimbabwe, Harare, October 2009 Haver, K., Hatungimana, F., and Tennant, V. (2009) Money matters: An evaluation of the use of cash grants in UNHCR’s voluntary repatriation and reintegration programme in Burundi, United Nations High Commissioner For Refugees, Policy Development And Evaluation Service (PDES), July 2009 Harvey, P. (2005) Cash and vouchers in emergencies. Humanitarian Policy Group Discussion Paper, Overseas Development Institute, London, February 2005, www.odihpn.org Harvey, P., and Savage, K. (2006) No Small Change: Oxfam GB Malawi and Zambia Emergency Cash Transfer Projects: a Synthesis of key learning. Humanitarian Policy Group, Overseas Development Institute, June 2006 Hughes, D.W. (2003). Policy Uses of Economic Multiplier and Impact Analysis, Choices; American Agricultural Economics Association, October 2003 International Food Policy Research Institute (2009): Global Hunger Index 2009, Washington, 2009 http://www.ifpri.org/publication/2009‐global‐hunger‐index Juana, J.S., and Mabugu, R.E. (2005) Assessment of small‐holder agriculture’s contribution to the economy of Zimbabwe: a Social accounting matrix multiplier analysis, Agrekon, Vol. 44, No 3, September 2005, P.344‐ 362 available at http://purl.umn.edu/31724 Khan, H.A. (2007) Social Accounting Matrix: A Very Short Introduction for Economic Modelling, University of Denver, February 2007 McCord, A. (2009) Cash transfers and political economy in sub‐Saharan Africa, Overseas Development Institute Project Briefing No. 29, November 2009 available from www.odi.org.uk MacAuslan, I. (2010) (forthcoming) Concern Worldwide Zimbabwe Emergency Cash Transfers Programme Evaluation, Oxford, 2010 Miller, C. (2009) Economic Impact Report of the Mchinji Social Cash Transfer Pilot (draft), Center for International Health and Development, Boston University School of Public Health, Boston, Massachusetts and The Centre for Social Research, University of Malawi
36
Pyatt, G. and Round, J. (1979). Accounting and fixed price multiplier in a social accounting matrix, Economic Journal no. 89, pp. 850‐873 Ravallion, M. (n.d.) The Mystery of the Vanishing Benefits: Ms Speedy Analyst’s Introduction to Evaluation, World Bank Round, J. (2003) Social Accounting Matrices and SAM‐Based Multiplier Analysis, pp. 261‐276, in Bourguignon, F., and Luiz A., eds. (2003). The Impact of Economic Policies on Poverty and Income Distribution: Evaluation Techniques and Tools. New York: World Bank and Oxford University Press. http://www.un.org/esa/policy/sanjose_training_mdgs/round_2003_sams_chapter14.pdf
Save the Children UK, HelpAge International, and Institute of Development Studies (2005) Making cash count: Lessons from cash transfer schemes in east and southern Africa for supporting the most vulnerable children and households. Institute of Development Studies, University of Sussex, 2005 Slater, R. (2009) Cash Transfers: Graduation and Growth. Overseas Development Institute Briefing Paper No. 29, November 2009, London available at www.odi.org.uk Stevens, J.P. (2002) Applied multivariate statistics for the social sciences Lawrence Erlbaum Assoc., Mahwah, NJ, 2002 p. 70 Thomas M. and Bautista R.M. (1999). A 1991 social accounting matrix (SAM) for Zimbabwe. Trade and Macroeconomics discussion paper No 36, International Food Policy Research Institute, Washington DC. United Nations Food and Agriculture Organisation, (2009) Crop and Food Security Assessment Mission (CFSAM)1 special report for Zimbabwe available at ftp://ftp.fao.org/docrep/fao/011/ai483e/ai483e00.pdf United Nations World Food Programme Vulnerability Assessment Mission (n.d.) Gokwe North district profile World Food Programme Zimbabwe, Harare (internal document, quoted with permission of WFP Zimbabwe Country Office) Web pages www.cia.gov/library/publications/the‐world‐factbook/geos/zi.html www.fews.net www.ifpri.org www.odi.org.uk www.odihpn.org www.wfp.org/countries/zimbabwe