
Evaluating Forecast Qualityjhansen/mason11july.pdf · Evaluating Forecast Quality Simon J. Mason...
33
Evaluating Forecast Quality Simon J. Mason International Research Institute for Climate Prediction
Transcript of Evaluating Forecast Qualityjhansen/mason11july.pdf · Evaluating Forecast Quality Simon J. Mason...
Evaluating Forecast Quality
Simon J. Mason
International Research Institute for Climate Prediction

Questions
• How do we decide whether a forecast was “correct”?
• How do we decide whether a set of forecasts is correct consistently enough to be considered “good”?
• How can we answer any of these questions when forecasts are expressed probabilistically?
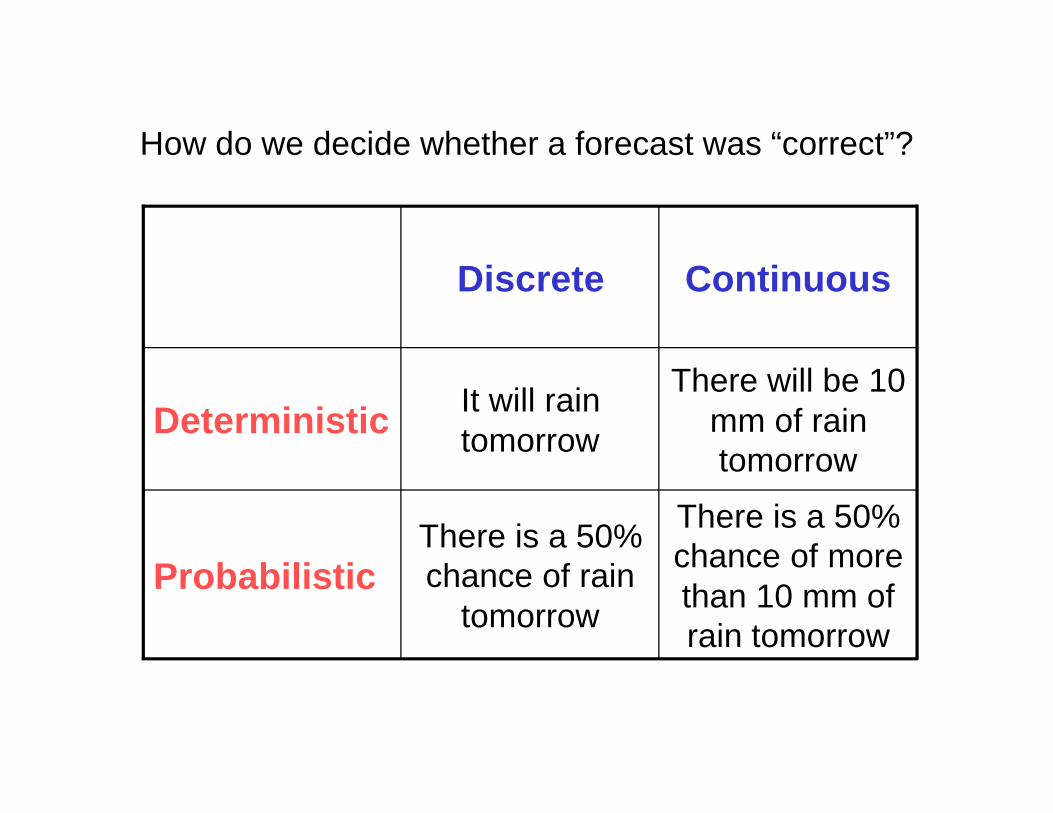
How do we decide whether a forecast was “correct”?
There is a 50% chance of more than 10 mm of rain tomorrow
There is a 50% chance of rain
tomorrowProbabilistic
There will be 10 mm of rain tomorrow
It will rain tomorrowDeterministic
ContinuousDiscrete
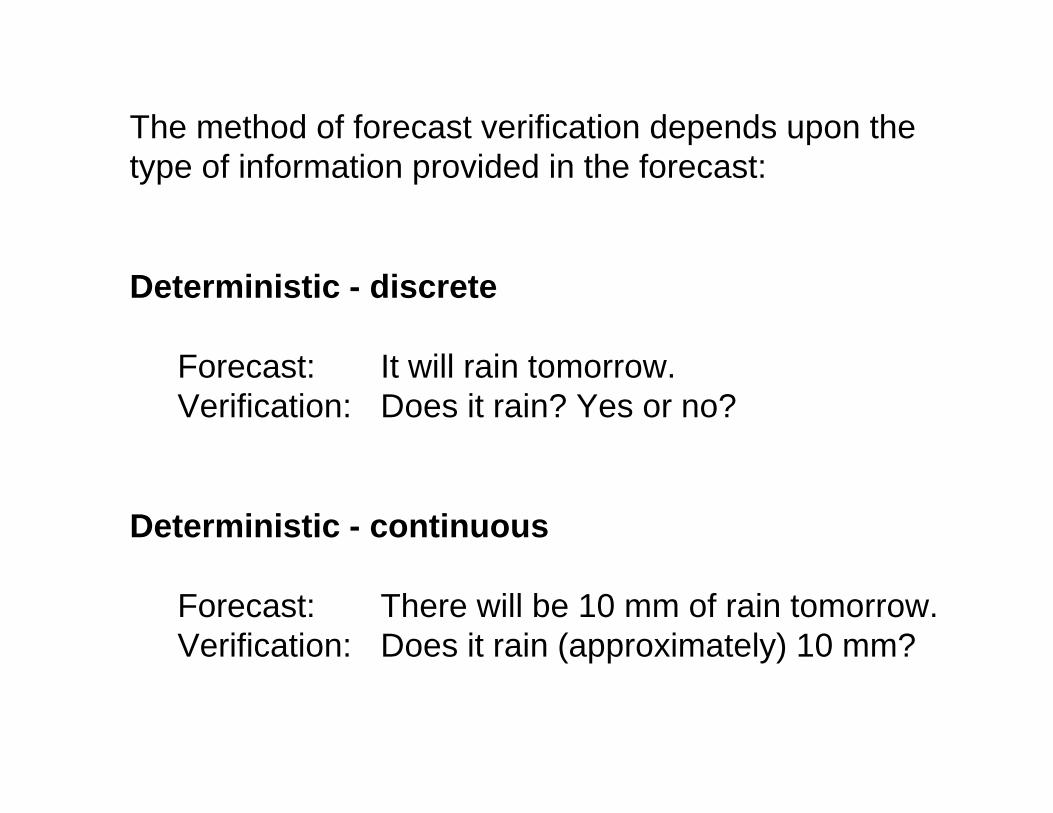
The method of forecast verification depends upon the type of information provided in the forecast:
Deterministic - discrete
Forecast: It will rain tomorrow.Verification: Does it rain? Yes or no?
Deterministic - continuous
Forecast: There will be 10 mm of rain tomorrow.Verification: Does it rain (approximately) 10 mm?
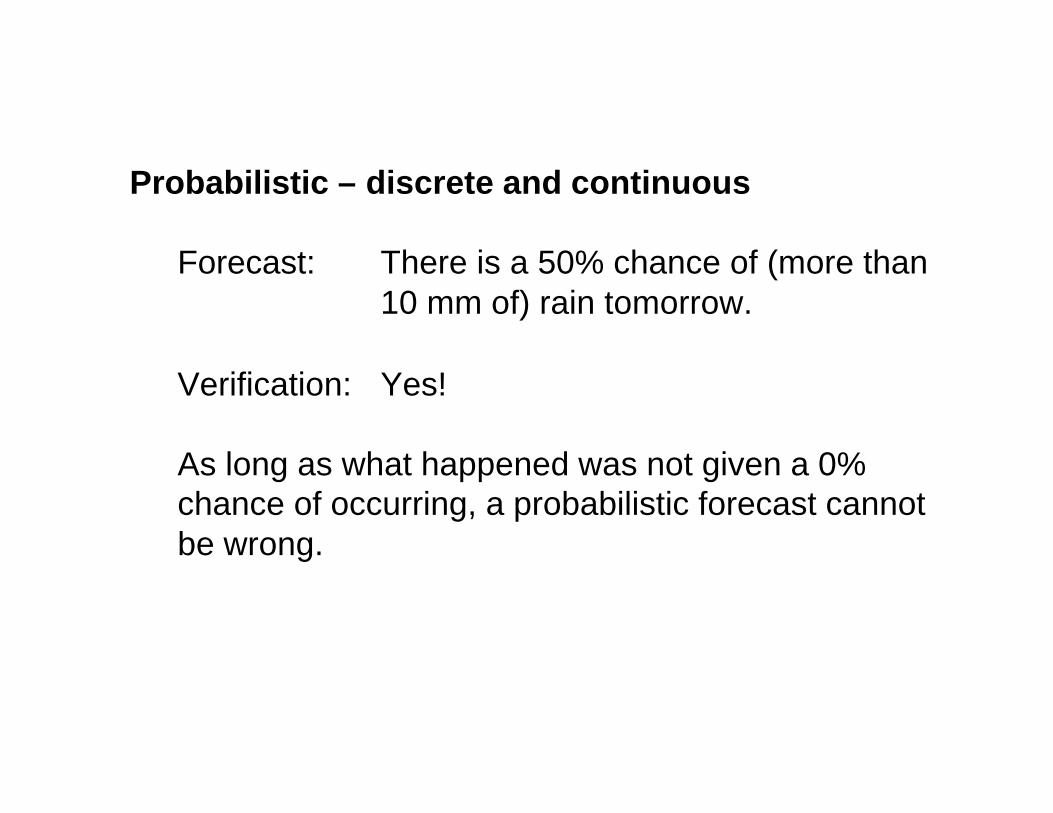
Probabilistic – discrete and continuous
Forecast: There is a 50% chance of (more than 10 mm of) rain tomorrow.
Verification: Yes!
As long as what happened was not given a 0% chance of occurring, a probabilistic forecast cannot be wrong.

Conclusion
• “Prediction is very difficult, especially if it’s about the future.” Nils Bohr
• No – probabilistic forecasting is very easy because the forecast is never wrong!
?

How do we decide whether a set of forecasts is correct consistently enough to be considered “good”?
FORECASTS
OBSERVATIONS Yes No
Yes Hit Miss
No False alarm Correct Rejection
Deterministic - discrete

Hit Rate
How many of the events were forecast?
= ×hitnumber of
Hit rate 100%number of events
s
“Wall Street indices predicted nine out of the last five recessions!” Newsweek, 19 Sept., 1966.
Correct rejections are correct forecasts.
falsenumber of False-alarm rate
number of no ala
nevmss
rent
=

Hit Score
How many times was the forecast correct?
= ×number of correct forecasts
Hit score 100%number of forecasts
correct rejenumber of and Hit score 100%
number of forecast
ctiot ns
s
hi s= ×
A measure of forecast accuracy.
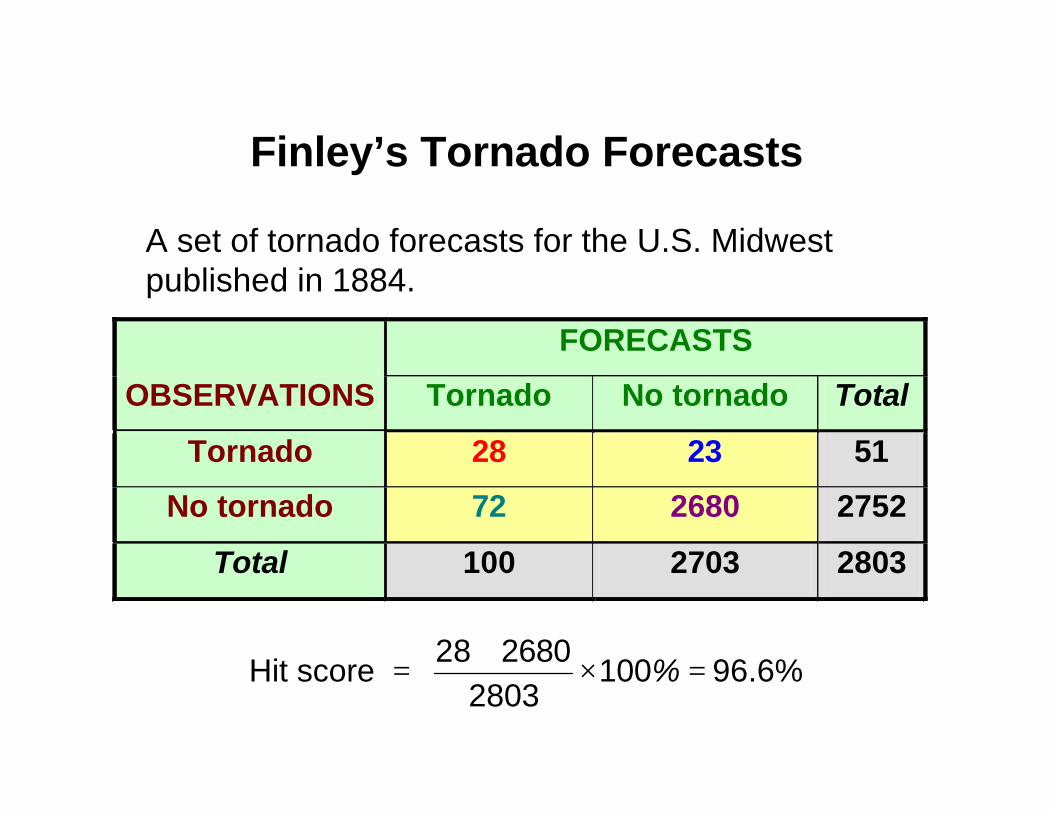
Finley’s Tornado Forecasts
FORECASTS
OBSERVATIONS Tornado No tornado Total
Tornado 28 23 51
No tornado 72 2680 2752
Total 100 2703 2803
A set of tornado forecasts for the U.S. Midwest published in 1884.
+= × =
28 2680Hit score 100 96.6%
2803%

No Tornado Forecasts
0 2752Hit score 100 98.2%
2803%
+= × =
A better score can be achieved by issuing no forecasts of tornadoes!
FORECASTS
OBSERVATIONS Tornado No tornado Total
Tornado 0 51 51
No tornado 0 2752 2752
Total 0 2803 2803

Problems
Accuracy: The forecasts correspond well with the observations, but:
Uncertainty: Tornadoes are rare events so it is easy to score a correct rejection. There is very little uncertainty.
Skill: The accuracy of one set of forecasts compared to that of another set.

How do we decide whether a set of forecasts is “good”?
Is this set of forecasts better than another (simple) set?
Often the comparison is with a simple forecast strategy such as:
climatology;persistence;perpetual forecasts;random forecasts.

Hit Skill Score
How many more times was the forecast correct compared to a reference forecast strategy?
# correct - # expected correctHit skill score 100%
# forecasts - # expected correct= ×
( )28 2680 2752Hit skill score 100%
2803-8
273
526. %
+ −−= × =
Exercise: calculate the hit skill score for Finley’s forecasts compared to a strategy of random guessing.

How do we decide whether a set of forecasts is correct consistently enough to be considered “good”? Deterministic – continuous
Correlation
A measure of association – e.g., does rainfall increase if forecast rainfall increases?

A set of “perfect” forecasts!
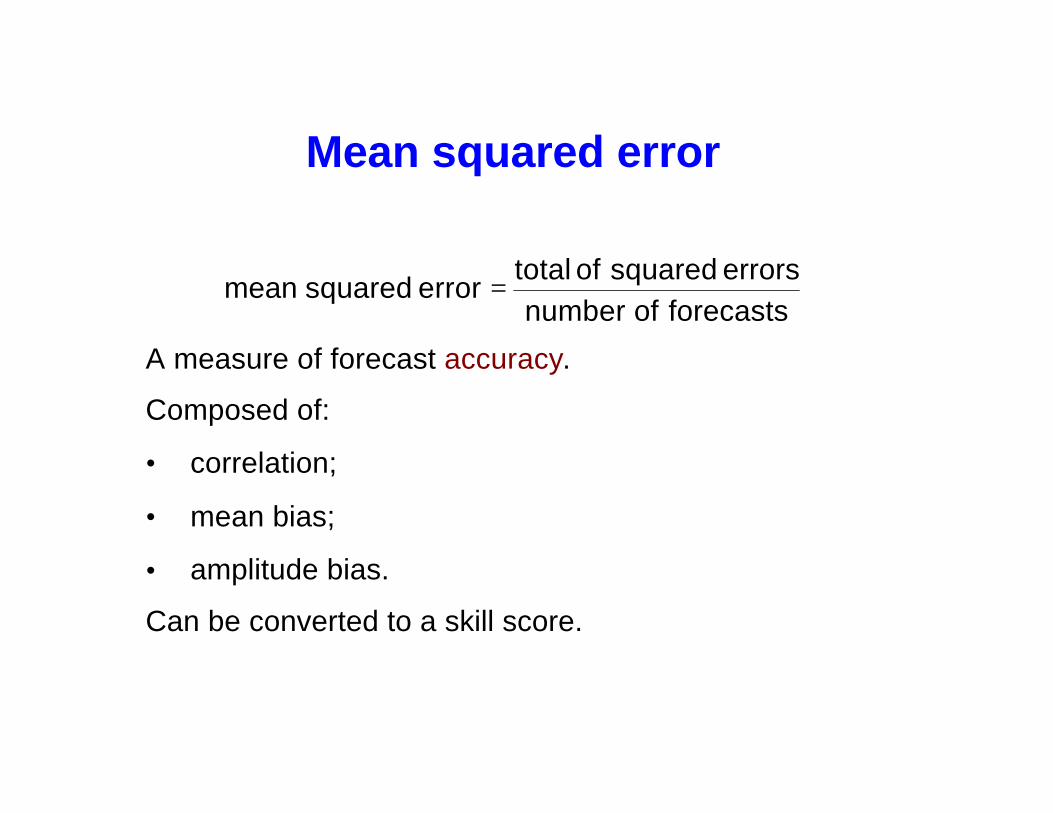
Mean squared error
forecasts of number
errors squared of total error squared mean =
A measure of forecast accuracy.
Composed of:
• correlation;
• mean bias;
• amplitude bias.
Can be converted to a skill score.

How do we decide whether one set of probabilisticforecasts is better than another?
Brier score
Measures the mean-squared error of probability forecasts.
If an event was forecast with a probability of 60%, and the event occurred, the probability error is:
60% - 100% = -40%
forecasts of numbererrorsy probabilit squared of total
score Brier =
Verification of probabilistic forecasts
• How do we know if a probabilistic forecast was “correct”?
“A probabilistic forecast can never be wrong!”
As soon as a forecast is expressed probabilistically, all possible outcomes are forecast. However, the forecaster’s level of confidence can be “correct” or “incorrect” = reliable.
Is the forecaster over- / under-confident?

Verification of probabilistic forecasts
• How do we know if a forecaster is over- / under-confident
Whenever a forecaster says there is a high probability of rain tomorrow, it should rain more frequently than when the forecaster says there is a low probability of rain.
Forecast reliability
• A forecast is consistent if the forecast probability is a true estimate of the forecaster’s level of confidence.
• If forecasts are reliable, the forecaster’s confidence is appropriate.
• If forecasts are consistent and reliable, the probability that the event will occur is the same as the forecast probability.

Desired characteristics of forecasts:
Probabilities should be reliable.Probabilities should be sharp.
Reliability is a function of forecast accuracy.
Assuming the forecasts are reliable, sharpness is a function of predictability.
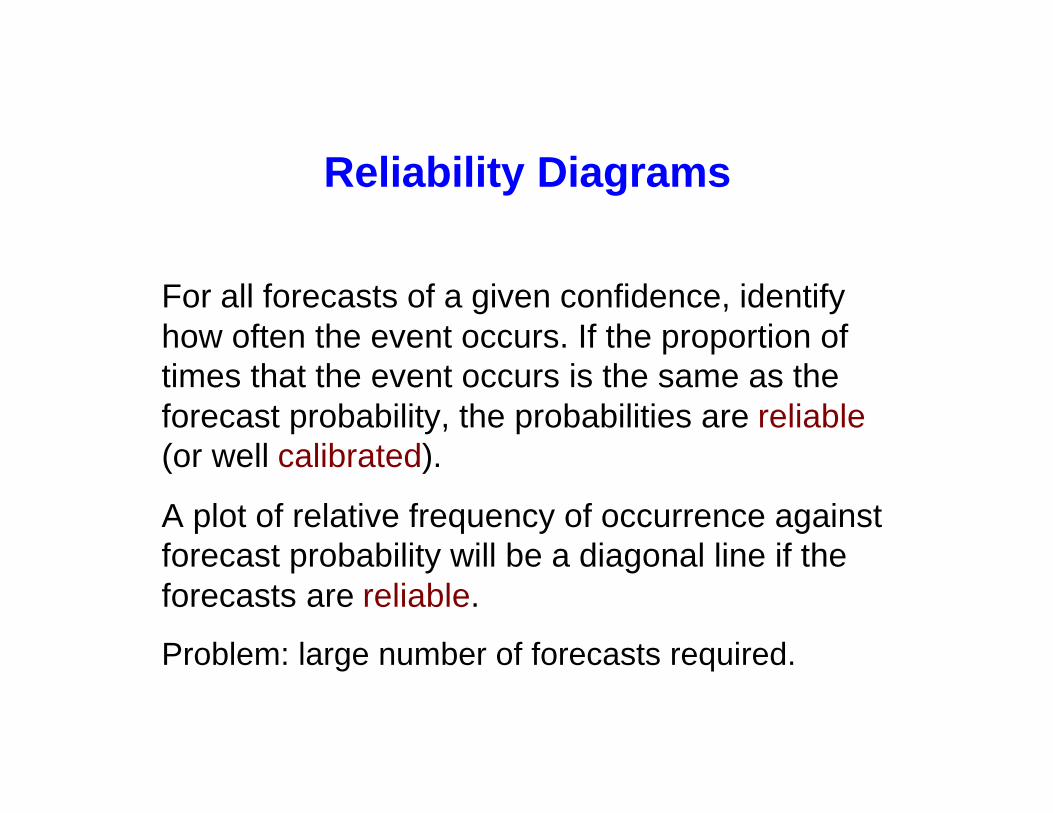
Reliability Diagrams
For all forecasts of a given confidence, identify how often the event occurs. If the proportion of times that the event occurs is the same as the forecast probability, the probabilities are reliable(or well calibrated).
A plot of relative frequency of occurrence against forecast probability will be a diagonal line if the forecasts are reliable.
Problem: large number of forecasts required.

Reliability Diagrams
Reliability diagrams for forecasts of Nino3.4 sea-surface temperatures.
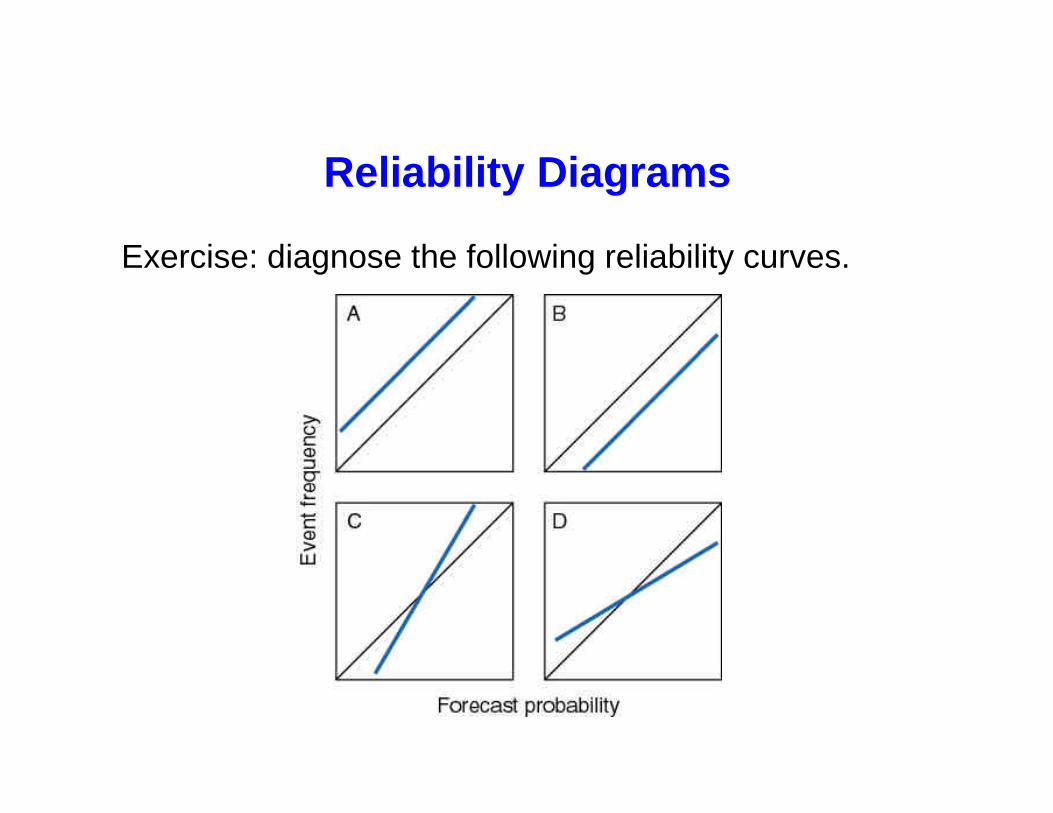
Reliability Diagrams
Exercise: diagnose the following reliability curves.

Relative (or Receiver) Operating Characteristics (ROC)
Convert probabilistic forecasts to deterministic forecasts by issuing a warning if the probability exceeds a threshold minimum.
By raising the threshold less warnings are likely to be issued - reducing the potential of issuing a false alarm, but increasing the potential of a miss.
By lowering the threshold more warnings are likely to be issued - reducing the potential of a miss, but increasing the potential of a false alarm.

Relative (or Receiver) Operating Characteristic (ROC)
Are (proportionately) more warnings issued for events than for non-events?
Plot the hit rate against the false alarm rate for varying thresholds.
The ROC is used to estimate whether forecasts are potentially useful.
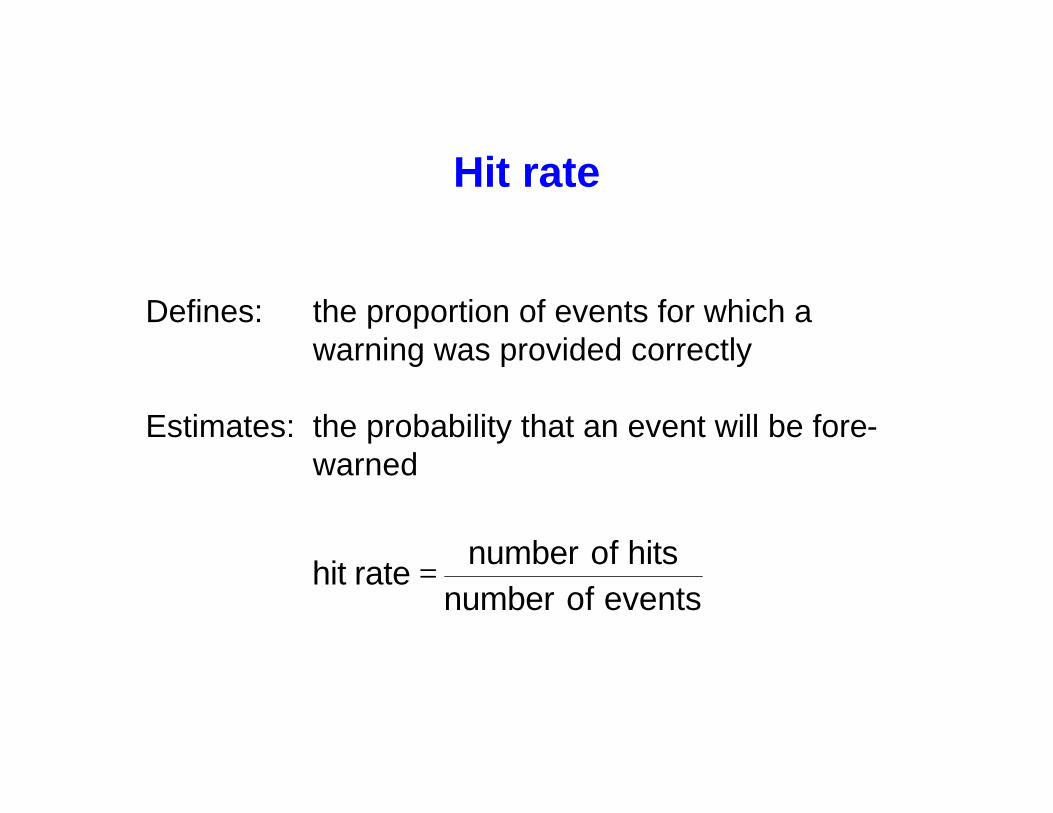
Hit rate
Defines: the proportion of events for which a warning was provided correctly
Estimates: the probability that an event will be fore-warned
events of numberhits of number
rate hit =
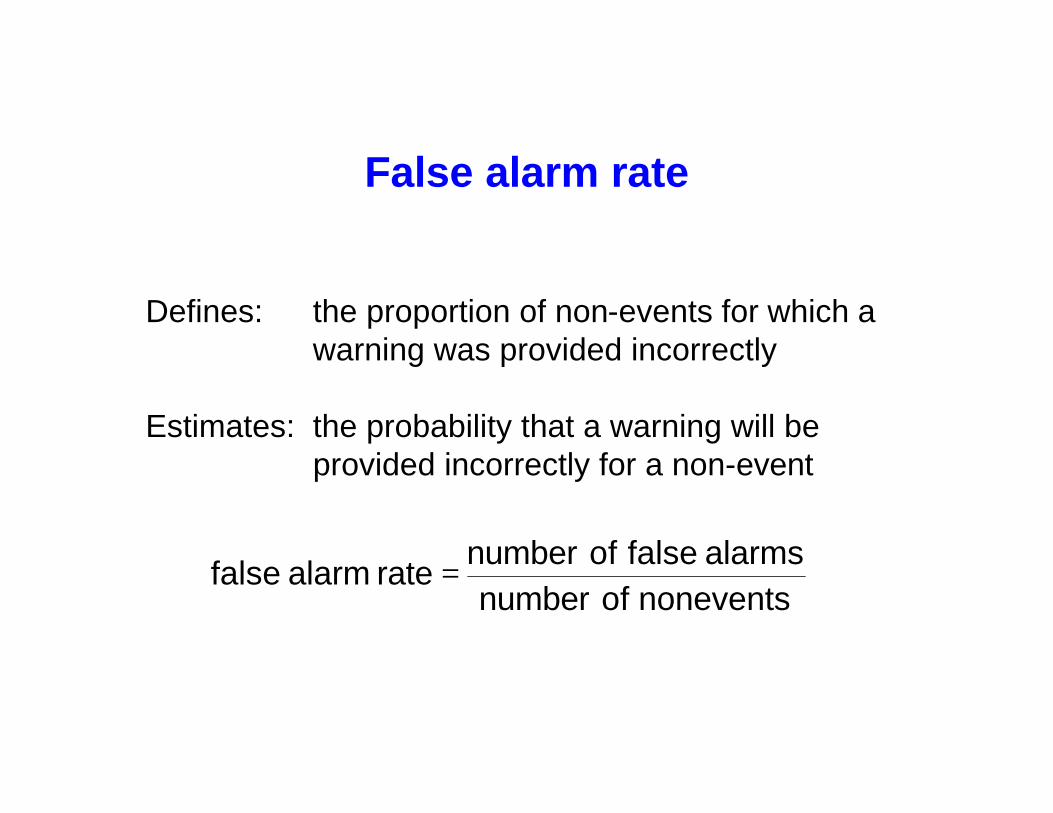
False alarm rate
Defines: the proportion of non-events for which a warning was provided incorrectly
Estimates: the probability that a warning will be provided incorrectly for a non-event
nonevents of numberalarms false of number
rate alarm false =

Relative (or Receiver) Operating Characteristics (ROC)
ROC curves for ECHAM 3.6 simulations of March-May below-and above-normal precipitation over eastern Africa(10°-10°S, 30°-50°E)
Conclusions
• Even for deterministic forecasts, there is no single measure that gives a comprehensive summary of forecast quality:
- accuracy- skill- uncertainty
• Probabilistic forecasts address the two fundamental questions:
- What is going to happen?- How confident can we be that it is going to
happen?• Both these aspects require verification.

Conclusions
• The most important aspects of forecast quality:- the most likely outcome must be the one that
occurs most frequently;- confidence in the forecast must be
appropriate (reliability);- forecast probabilities should be sharp (without
compromising reliability).• Good forecasts must address:
- consistency- quality- value

Recommended readings
Forecast verification and quality:
• Murphy, A. H., 1991: Forecast verification: its complexity and dimensionality. Monthly Weather Review, 105, 803–816.
• Murphy, A. H., 1993: What is a good forecast? An essay on the nature of goodness in weather forecasting. Weather and Forecasting, 8, 281–293.
• Wilks, D. S., 1995: Statistical Methods in the Atmospheric Sciences, Academic Press, San Diego. Chapter 7, Forecast verification, pp 233–283.


![Welcome! []mason/iucee/IUCEE08-mason-day1-post.pdf · A. Mason IUCEE Workshop: VLSI Design, Day 1 1 July 2008 •VLSI Design Workshop •Andrew Mason ... • Synopsys __3__ • Xilinx](https://static.fdocuments.in/doc/165x107/5e7e4d8ca5a41a2e16094ef1/welcome-masoniuceeiucee08-mason-day1-postpdf-a-mason-iucee-workshop.jpg)
