EUROPEAN STRUCTURAL INDICATORS, A WAY FORWARD
28
Project number: BPA number: Date: 16 May 2002 Statistics Netherlands Division of Macro-economic statistics and Dissemination Division of Social and Spatial Statistics EUROPEAN STRUCTURAL INDICATORS, A WAY FORWARD Mark de Haan, Wim P. Leunis and Marleen Verbruggen Summary At the 2000 Lisbon Summit, the European Union has formulated the ambition to transform itself into “the most competitive and dynamic knowledge- based economy in the world capable of sustainable economic growth with more and better jobs and greater social cohesion”. This objective should be achieved by means of the so-called open co-ordination method, in which benchmarking plays an important role. Obviously, countries can only be benchmarked on the basis of reliable, comparable and timely national statistics in general, and meaningful statistical indicators in particular. The current set of Structural Indictors designed to support the Lisbon Strategy clearly needs further improvement. Some indicators are based on incomparable data while others give the impression of a fairly incoherent shopping list of numbers without underlying structure and with unclear policy implications. This paper argues that Structural Indicators can only be evaluated when they are presented in their economic, social or demographic context. This requirement and those related to mutual consistency and comparability on the micro and/or macro level can best be met by integration of Indicators and statistics. Especially those Structural Indicators aiming at measuring economic performance in a wide sense are preferably embedded in an underlying accounting system. Such a ‘systems approach’ will safeguard the needs mentioned above and provides a solid statistical basis for policy evaluation. In this context, national accounts conventions play an important role. Most of the General Economic Background Indicators (GDP, labour productivity, public balance) are directly derived from the national accounts.
Transcript of EUROPEAN STRUCTURAL INDICATORS, A WAY FORWARD
Project number:BPA number:
Date: 16 May 2002
Statistics Netherlands Division of Macro-economic statistics and Dissemination Division of Social and Spatial Statistics
EUROPEAN STRUCTURAL INDICATORS, A WAY FORWARD
Mark de Haan, Wim P. Leunis and Marleen Verbruggen
Summary At the 2000 Lisbon Summit, the European Union has formulated the ambition to transform itself into “the most competitive and dynamic knowledge-based economy in the world capable of sustainable economic growth with more and better jobs and greater social cohesion”. This objective should be achieved by means of the so-called open co-ordination method, in which benchmarking plays an important role. Obviously, countries can only be benchmarked on the basis of reliable, comparable and timely national statistics in general, and meaningful statistical indicators in particular.
The current set of Structural Indictors designed to support the Lisbon Strategy clearly needs further improvement. Some indicators are based on incomparable data while others give the impression of a fairly incoherent shopping list of numbers without underlying structure and with unclear policy implications. This paper argues that Structural Indicators can only be evaluated when they are presented in their economic, social or demographic context. This requirement and those related to mutual consistency and comparability on the micro and/or macro level can best be met by integration of Indicators and statistics.
Especially those Structural Indicators aiming at measuring economic performance in a wide sense are preferably embedded in an underlying accounting system. Such a ‘systems approach’ will safeguard the needs mentioned above and provides a solid statistical basis for policy evaluation. In this context, national accounts conventions play an important role. Most of the General Economic Background Indicators (GDP, labour productivity, public balance) are directly derived from the national accounts.
1
In the present Dutch SESAME (System of Economic and Social Accounting Matrices and Extensions), the national accounts are extended with modular sub-systems on socio-demographic developments and employment (SAM), knowledge, and the environment (NAMEA).
The drive behind designing a consistent, mutually related set of indicators and other variables can in principle be extended to micro data sets as well. Increasingly, micro-integration is being applied in order to reach consistency between different micro-data sets without losing the advantages of flexibility and detail.
In some cases, Structural Indicators can be judged as both micro and macro oriented. In these cases it may be worthwhile to make micro data sets fully consistent to the corresponding meso and macro aggregates.
An analysis based on the Dutch SESAME indicators will show how differences in economic structures may influence the estimates of Structural Indicators on the macro level. This may obfuscate the benchmarking of countries and may give raise to an internal conflict between different goals laid down in the Lisbon Strategy. On the one hand, the goal of economic reform aims at market liberalization and thus the economic development of individual EU member states according to their comparative advantages (e.g. specialization). On the other hand, other goals seem to straightjacket countries in striving at lowest energy and waste intensities and highest expenditure on R&D and ICT. A sector breakdown of indicators as facilitated by SESAME will take into consideration differences in economic structures and will reveal genuine economic performance at the industry level.
Keywords: Socio-economic policy analysis, statistical indicators, top-down vs. bottom-up approach, Social Accounting Matrix, NAMEA, SESAME.
2
1. Introduction
At the Lisbon summit, the European Union has formulated the ambition to transform itself into “the most competitive and dynamic knowledge-based economy in the world capable of sustainable economic growth with more and better jobs and greater social cohesion”. This initiative has placed socio-economic topics substantially higher on the European political agenda. A direct result of this summit was the agreement to publish a so-called annual synthesis report, which is discussed at the spring meetings of the European Council and provides an overview of the progress made in four policy domains: employment, innovation, economic reform and social cohesion.
A few months later, the European Council in Nice (December 2000) adopted the European Social agenda, which primarily focuses on the aim of full employment through the creation of more and better jobs. Full employment is considered an important tool to fight social exclusion and to maintain sustainable economic growth with an ageing population.
These initiatives have lead to a multitude of activities, which are partially overlapping and which all have embraced the so-called open co-ordination method. This means that the European community is convinced that quicker progress can be made by learning from best practices and a system of benchmarking than by the adoption of regulations. Obviously, countries can only be benchmarked on the basis of reliable, comparable and timely national statistics in general, and meaningful statistical indicators in particular. In this regard, it is remarkable that until recently the expertise of European statisticians was not called upon in the design of a statistical information system and related indicators for this important policy purpose.
A preliminary proof of a benchmarking exercise was the establishment of a set of 35 so-called Structural Performance Indicators (SPI), which were used for the first synthesis report, presented early 2001. At present, there are several initiatives under way to improve and extend the SPIs, which have meanwhile been renamed as Structural Indicators (SI). For instance, the indicators on social inclusion will be improved and several new indicators have been identified, e.g. on sustainable development, marginal effective tax rate, the demography of businesses, E-society and the market structure of network industries. In addition, the European Commission and relevant policy committees are discussing indicators to measure the quality of labour and the adequacy of pension funding, to name but a few examples of areas where more concrete results are expected shortly.
Although the simultaneous discussion in different European fora raise political awareness and illustrate the interdependence between several issues, this also entails a risk that there will be different indicators to measure the same phenomena or the indicator definitions are not mutually consistent. The result may well be a patchwork
3
of indicators that do not comply with quality criteria and are very costly to produce on a regular basis.
A second complication is that the measurement of progress in the different policy areas requires that interdependencies between indicators can be studied. The Commission stated in this regard that “the indicators selected should not be seen in isolation but rather as different elements of the same picture” [Com (2000) 594 final]. In an opinion of the Economic and Social Committee on the SPIs this was formulated even more explicitly: “The Committee would also stress that, in addition to the high standards of reliability, topicality and uniformity required for each of the proposed indicators, it will be necessary to interpret the indicator-based figures in order to assess progress made in economic, social and structural policy. This can be done with the help of an underlying statistical information system, so that in interpreting the data account is taken of e.g. the economic and demographic characteristics of a Member State”. [CES 241/2001].
Interdependencies may be macro-oriented (e.g. circular flow of income), micro-oriented (e.g. tuning changes in labour market status) or directed to the understanding of macro changes from the dynamics underlying these changes. Section 2 will elaborate on content and orientation of structural indicators.
Integration of data can be seen from different perspectives. Section 3 shows the principles of macro and micro integration.
For economic policy, the national accounts are the generally accepted co-ordination system for analysis at both the international and the national level. However, for many purposes of socio-economic analysis the present national accounts are still inadequate, if only because they do not contain sufficient labour market information or sufficient details on counterpart sectors of transactions. For the analysis of the results of fiscal policies, for example, the latter deficiency is immediately evident from the fact that the counterpart sectors of government transactions are not shown, although they are often known, and can be inserted in the accounting framework without much additional effort. For monetary policy analyses, the lack of a link between wage rate developments in (segmented) labour markets and commodity prices is particularly problematic, as well as insufficient insight in interest rate and other property income flows.
The above deficiencies can partly be remedied by an extension of the national accounts. An example of such an extended accounting system is the so-called Social Accounting Matrix (cf. Pyatt [1991], Keuning [1996]). The features of such an extended accounting system and the opportunities it offers for socio-economic analyses are elaborated in section 4. The section also gives a description of two parts of this extended system: the Social Accounting Matrix (SAM) and the environmental module NAMEA. Both systems are already known and also applied in a majority of European Member States.
Micro data sets offer a variety of detail compared with macro and meso aggregates. Where macro data are often co-ordinated through regulations regarding the output desired, co-ordination of survey data is often effectuated by regulations regarding
4
survey design and questionnaires. In order to combine different data sets like survey data and data received from administrative registers, additional efforts are needed also on the harmonisation of these data sets. This can be done through micro integration, which also offers new opportunities (section 5).
In some case, the quality of an extended accounting system can be enhanced if the “top down approach”, which is used to build such a system is combined with a “bottom-up approach” which forms the basis of micro-integration, Section 6 illustrates how these approaches can be combined.
Section 7 provides an analysis based on the Dutch SESAME indicators and shows how differences in economic structures may influence the estimates of Structural Indicators on the macro level.
2. Structural Indicators
The Structural Indicators are politically important indicators, covering the policy domains: employment, innovation, economic reform, social cohesion and the environment. The European Summit in Barcelona formally adopted a list of 35 structural indicators, supplemented by seven general economic background indicators. The work on the structural indicators is still ongoing. Some indicators are being refined and new indicators are added. However presumably, the core list will remain fairly stable. The indicators have to be produced annually, for each EU member state and for the world’s major blocks as a whole, and are meant to be some sort of catch all of Europe’s ambition in this field. The present indicators have been designed with barely any involvement of existing statistical bodies in Europe, such as the Statistical Programme Committee (SPC) or the Committee of Monetary, Financial and Balance of Payments Statistics (CMFB). The list should be seen as the beginning of a much more extensive set of indicators, which will be developed in due course. Potentially, it will involve substantial costs and survey burden to respondents to compile these indicators. For that reason, it may be useful to review the present list: will it serve its purpose?
The result thus far is a rather incoherent shopping-basket with numbers. It is hardly conceivable that a meaningful synthesis of European competitiveness can be cooked from these ingredients.
When considering the quality of the ingredients, the Commission itself set out some requirements, such as international comparability, timely and regular availability of the data sources and consistency. More generally, when establishing criteria for good indicators, one may think of elements, such as scientifically sound, understandable, sensitive to the change they are intended to measure, measurable and capable of being updated regularly [Custance and Hillier, 1998]. These may all seem very plausible criteria, deserving no further elaboration, but in practice the fulfilment of these criteria may be more complicated than it seems at first glance. For that reason it might be desirable that a limited set of more complex aggregate
5
indicators is designed. These aggregate indicators must all be fairly undisputed and their limitations must also be realised. This can be illustrated by the most widely used aggregate indicator: the GDP. The GDP summarises billions, perhaps trillions, of transactions in a single number. It is unrealistic to assume that such a number is equally exact as an estimate of the distance between Amsterdam and London, say. A fortiori, this applies to GDP volume change, the common measure of economic growth. In that case, there is the additional difficulty of breaking down value changes in all transactions into price changes on the one hand and quantity plus quality changes on the other. In particular, a quality improvement is not easily distinguished from an ‘ordinary’ price rise.
In practice, some of the selected Structural Indicators are certainly not undisputed. In several instances, the indicators are ratios whereby numerators and denominators are mutually inconsistent. For example, there are various indicators with GDP in the denominator, whereby the numerator is not derived from national accounts data, with concomitantly inconsistent outcomes. This concerns, for instance, the indicators ‘public expenditure on education’ and the ‘energy intensity of the economy’. In fact, some of the indicators on the environment also suffer from this shortcoming.
The most obvious and perhaps also the most important criterion for a good indicator in this European benchmarking exercise is international comparability. Evidently, this is not easy to achieve and unfortunately, some of the SI’s are not sufficient comparable at an international level. For example, the indicator for ‘life long learning’ is not defined identically in the different member states. Besides, even when definitions are identical, institutional and cultural differences may hamper comparability because interpretation of those indicators will not be possible without knowledge of these underlying differences. The indicator ‘jobless households’ gives an example of this. This indicator is influenced by cultural differences, being the differences in the household size in the member states.
Furthermore, some indicators have a limited policy relevance or simple do no measure what they are supposed to measure. For instance, the indicator ‘energy intensity’ is highly dependent upon the economic structure of a country. This indicator may have a favourable (low) value if a country imports relatively many products that cost a lot of energy to produce. Moreover, if energy consumption is derived from energy statistics, it is quite likely that for example international transport is measured quite differently in the numerator (energy consumption on the domestic territory) than in the denominator (value added generated by national enterprises). The solution is to design a measure of energy efficiency, that is, the weighted sum of the ratios, by industry, of a) energy consumption per unit of value added and b) the European average energy consumption per unit of value added.
Concluding: the recipe is fine, but the taste will improve significantly by the use of high quality ingredients that also nicely blend. Moreover, ingredients alone do not make a dinner. One needs tools and expertise to prepare and serve an agreeable dish. What does this mean for the decisions about the context the various indicators are
6
taken from? In case of each indicator we should ask ourselves the following questions:
1. Is this indicator related to other data from our statistical information system?
2. If so, what does this say about the need of consistency to be reached? Do we need macro integration, micro integration or a combination of both?
In answering these questions, the availability of data might present the most relevant criteria, data driven, or the needs expressed by our users, output driven. Criteria which stem from output demands will for instance express the need of socio-economic analysis. This will lead to the same conclusions in all countries. Data driven criteria may lead to the need for additional efforts in further integration of data which differ between countries depending on the available sources and the efforts already undertaken in combining those source data. The scheme presented in the annex of this paper gives a tentative overview of the answer to the second question for all structural indicators.
3. Statistical integration
Discussion about (a) what integration is, (b) where integration starts and (c) the distinction between full and partial integration often runs the risk of devoting more time to labelling than to the principles of the underlying integration.
Whether the aim is consistency between macro-aggregates (macro-integration), between micro data sets (micro-integration) or between integrated macro-aggregates and the underlying micro data sets, in all these cases the following set of principles can be distinguished:
a. Identify the relations which should hold. Content and characteristics of these identities may differ between various kinds of data. A general principle that holds in all cases is that these identities reflect the interrelationships between published variables (output demand).
b. Transform the available data in such a way that they meet pre-set definitions and classifications. This also entails a clear and unique point/period of reference.
c. Take care of full coverage either through measurement or estimation
d. Check on inconsistencies or unlikely figures: error detection. Here the check on fulfilment of the identity relations defined in (a) is the most relevant check in addition to the checks already performed on the various variables separately. So, the relevance of identities is not only that the resulting output should be consistent. Equally important is the information, which results from the discrepancies in those cases identities do not yet hold.
e. Re-evaluate the figures compiled so far. Here the balancing methods may be quite different in case of macro integration compared to those applied to the micro integration process, but also within each of these categories different
7
solutions may appear. This is also the most time consuming and unpredictable phase.
4. Extended accounting frameworks: the macro approach
Instead of putting forward various ‘shopping lists’ of footloose indicators, it may be considered to pre-cook the information in an integrated system that allows the analysis of inter-relationships. Of course, the integration of economic data is already secured by the national accounts, which function as a co-ordinating information system for these data. In fact, an aim of this paper is to demonstrate that the basic principles of national accounts can and should be extended to a wider range of statistics, notably social and environmental statistics. For this purpose, a so-called System of Economic and Social Accounting Matrices and Extensions (SESAME) is set out (cf. Keuning [1996] for a more extensive description and applications of this system).
A SESAME is a detailed statistical information system consisting of sub-modules in matrix format, from which a set of core economic, social and environmental macro-indicators is derived. Although it is impossible to capture socio-economic development in a single indicator, it is equally clear that a prime task of national statistical offices is to comprise the countless numbers they collect to a manageable, 'executive summary'. Such a summary typically describes trends in main indicators (e.g. Gross Domestic Product, population size, (un)employment, inflation, balance on current account of the balance of payments, income inequality, environmental indicator(s), average number of years of schooling). Consistent indices covering distributional aspects can also be derived for all variables included in the SESAME, because the system registers both the national total value and its distribution among socio-economic household groups and categories of employed persons.
Since all modular sub-systems are connected in a similar way to the core national accounts matrix, the system ensures coherence between the modular sub-systems. At the same time, the modular approach allows for maximum flexibility. Individual modules can be added to the system in accordance with possibilities, priorities and resources. During the past years, Statistics Netherlands has gained considerable experience with the development of modular sub-systems in most of the policy domains covered by the Structural Indicators (cf. e.g Kazemier, Keuning and Van de Ven, [1998]). In the present Dutch SESAME, the national accounts are extended with modular sub-systems on socio-demographic developments and employment (SAM), knowledge, R&D and the environment (NAMEA). Further extensions are envisaged with health accounts, social security accounts and education accounts. Appendix 1 provides a detailed description of the possibilities to include the Structural Indicators in a macro- or micro-based integration framework.
8
____________________________________________________________________
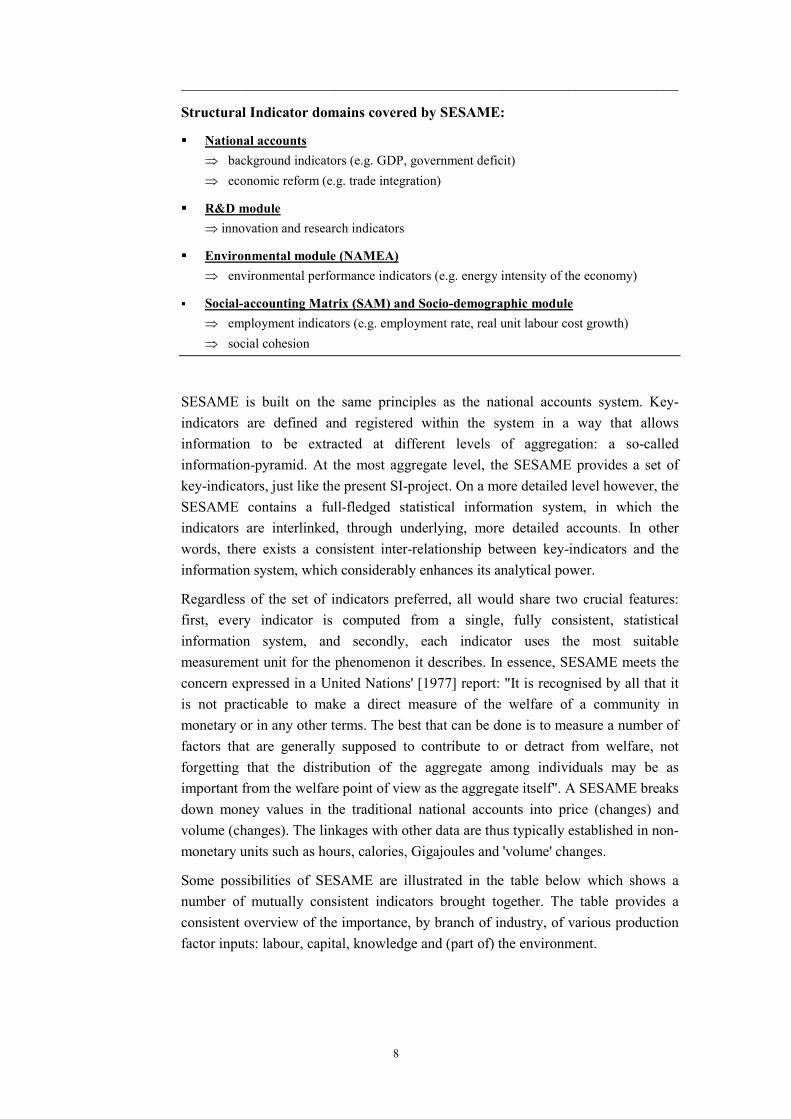
Structural Indicator domains covered by SESAME:
� National accounts⇒ background indicators (e.g. GDP, government deficit) ⇒ economic reform (e.g. trade integration)
� R&D module ⇒ innovation and research indicators
� Environmental module (NAMEA)⇒ environmental performance indicators (e.g. energy intensity of the economy)
� Social-accounting Matrix (SAM) and Socio-demographic module⇒ employment indicators (e.g. employment rate, real unit labour cost growth) ⇒ social cohesion
SESAME is built on the same principles as the national accounts system. Key-indicators are defined and registered within the system in a way that allows information to be extracted at different levels of aggregation: a so-called information-pyramid. At the most aggregate level, the SESAME provides a set of key-indicators, just like the present SI-project. On a more detailed level however, the SESAME contains a full-fledged statistical information system, in which the indicators are interlinked, through underlying, more detailed accounts. In other words, there exists a consistent inter-relationship between key-indicators and the information system, which considerably enhances its analytical power.
Regardless of the set of indicators preferred, all would share two crucial features: first, every indicator is computed from a single, fully consistent, statistical information system, and secondly, each indicator uses the most suitable measurement unit for the phenomenon it describes. In essence, SESAME meets the concern expressed in a United Nations' [1977] report: "It is recognised by all that it is not practicable to make a direct measure of the welfare of a community in monetary or in any other terms. The best that can be done is to measure a number of factors that are generally supposed to contribute to or detract from welfare, not forgetting that the distribution of the aggregate among individuals may be as important from the welfare point of view as the aggregate itself". A SESAME breaks down money values in the traditional national accounts into price (changes) and volume (changes). The linkages with other data are thus typically established in non-monetary units such as hours, calories, Gigajoules and 'volume' changes.
Some possibilities of SESAME are illustrated in the table below which shows a number of mutually consistent indicators brought together. The table provides a consistent overview of the importance, by branch of industry, of various production factor inputs: labour, capital, knowledge and (part of) the environment.

9
Percentage contribution to a number of economic performance indicators, by industry, 1999. GDP (basic prices) Employment Capital stock R&D Greenhouse
effect
%
Economic activities
Agriculture, forestry and fishing 2,7 3,6 3,0 0,9 15,1
Mining and manufacturing 18,5 15,6 15,1 80,6 36,2
Electricity, gas and water supply 1,7 0,6 3,7 0,5 22
Construction 5,7 7,3 1,2 1,6 1,2
Trade, hotels, restaurants and repair 14,9 19,3 5,9 2,9 2,6
Transport, storage and communication 7,4 6,1 7,1 2,4 13,8
Finance and business services 26,4 20,0 44 3,4 2,4
General government 11,5 11,5 4,7 6,9 2,1
Other services 11,2 16,1 15,4 0,9 4,7
Total 100 100 100 100 100
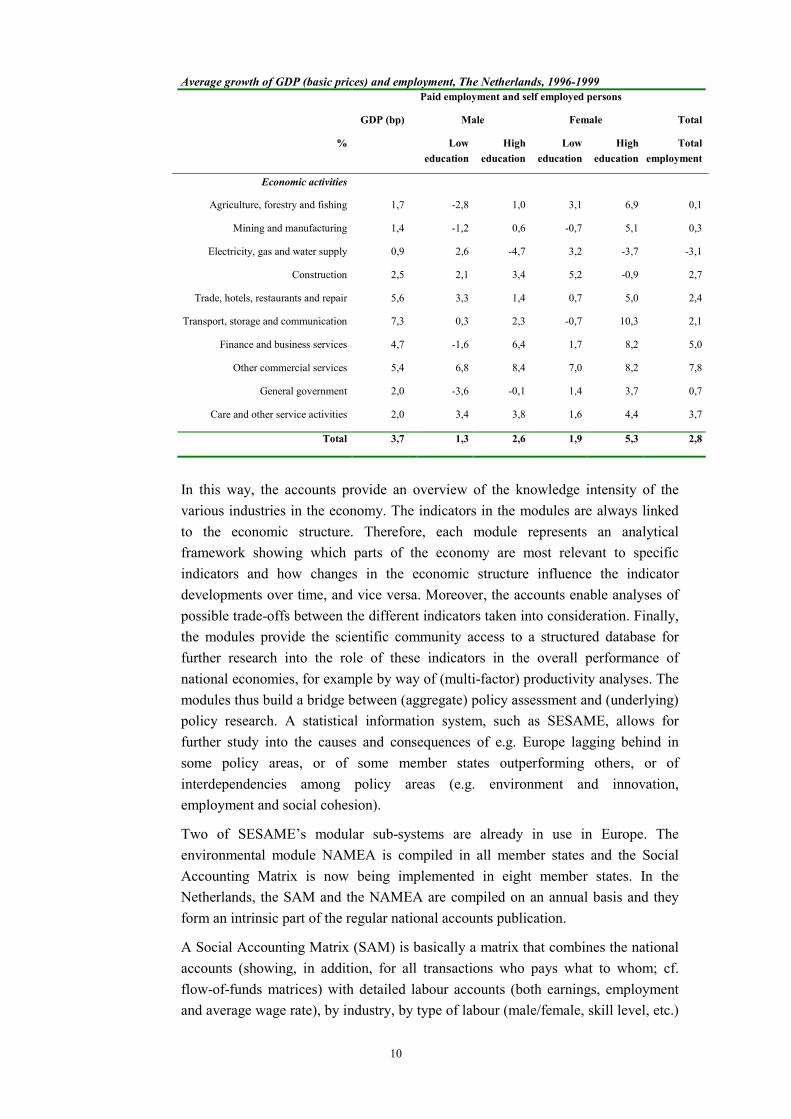
The table shows for example, that in 1999, agriculture, forestry and fishing contributed 15% to the greenhouse effect, but only 3% to GDP. Moreover, nearly 80% of the R&D expenditures went to the manufacturing sector, which employed 15% of all workers and contributed 17% to GDP. Obviously, the various modules can provide more detail with respect to the range of indicators and they can provide as well a further breakdown by branch of industry (or type of household). For example, the labour volume indicator can be further decomposed into labour inputs by level of education. The table below shows that during the period 1996-1999 the average growth of GDP was 3,7% and total employment increased with 2,8%. However, there were considerable differences at a more disaggregated level. For example, total employment for males with a low educational attainment grew only 1,3% and even decreased in some branches of industry, such as: general government, manufacturing, finance and business services. The employment opportunities for females with a high educational attainment were most favourable, especially in the services sector.
10
Average growth of GDP (basic prices) and employment, The Netherlands, 1996-1999 Paid employment and self employed persons
GDP (bp) Male Female Total
% Low education
High education
Low education
High education
Total employment
Economic activities
Agriculture, forestry and fishing 1,7 -2,8 1,0 3,1 6,9 0,1
Mining and manufacturing 1,4 -1,2 0,6 -0,7 5,1 0,3
Electricity, gas and water supply 0,9 2,6 -4,7 3,2 -3,7 -3,1
Construction 2,5 2,1 3,4 5,2 -0,9 2,7
Trade, hotels, restaurants and repair 5,6 3,3 1,4 0,7 5,0 2,4
Transport, storage and communication 7,3 0,3 2,3 -0,7 10,3 2,1
Finance and business services 4,7 -1,6 6,4 1,7 8,2 5,0
Other commercial services 5,4 6,8 8,4 7,0 8,2 7,8
General government 2,0 -3,6 -0,1 1,4 3,7 0,7
Care and other service activities 2,0 3,4 3,8 1,6 4,4 3,7
Total 3,7 1,3 2,6 1,9 5,3 2,8
In this way, the accounts provide an overview of the knowledge intensity of the various industries in the economy. The indicators in the modules are always linked to the economic structure. Therefore, each module represents an analytical framework showing which parts of the economy are most relevant to specific indicators and how changes in the economic structure influence the indicator developments over time, and vice versa. Moreover, the accounts enable analyses of possible trade-offs between the different indicators taken into consideration. Finally, the modules provide the scientific community access to a structured database for further research into the role of these indicators in the overall performance of national economies, for example by way of (multi-factor) productivity analyses. The modules thus build a bridge between (aggregate) policy assessment and (underlying) policy research. A statistical information system, such as SESAME, allows for further study into the causes and consequences of e.g. Europe lagging behind in some policy areas, or of some member states outperforming others, or of interdependencies among policy areas (e.g. environment and innovation, employment and social cohesion).
Two of SESAME’s modular sub-systems are already in use in Europe. The environmental module NAMEA is compiled in all member states and the Social Accounting Matrix is now being implemented in eight member states. In the Netherlands, the SAM and the NAMEA are compiled on an annual basis and they form an intrinsic part of the regular national accounts publication.
A Social Accounting Matrix (SAM) is basically a matrix that combines the national accounts (showing, in addition, for all transactions who pays what to whom; cf. flow-of-funds matrices) with detailed labour accounts (both earnings, employment and average wage rate), by industry, by type of labour (male/female, skill level, etc.)
11
and by household subsector. Because of its matrix format, the SAM also elaborates the national accounts’ information on income and expenditure distributions. For instance, a SAM presents expenditure patterns by product group and by household subsector, and commonly also breaks down investment, by sector of origin and industry of destination, and as well by industry of destination and by product group.
Sustainable development is an area that is only recently covered by the Structural Indicators. The Communication from the Commission (2001) presented 7 indicators on the environment for the synthesis report 2002. For the analysis of environmental indicators the National Accounting Matrix including Environmental Accounts (NAMEA) has been developed. In the NAMEA, among other things, environmental degradation is linked to production of goods and services (by industry) and consumption expenditure (by purpose) for environmental themes, such as: the greenhouse effect, ozone layer depletion, acidification, eutrophication, waste, water depletion, emission of toxic substances, and use of space. In addition, the depletion of three types of natural resources (crude oil, natural gas and wood) has been incorporated (cf. Keuning, De Haan van Van Dalen, [1999]). Each of these problems is monitored with the help of a single summary indicator, expressed in the appropriate physical units. At present, NAMEAs for air emissions are available for all EU Member States (cf. Eurostat [1999 and 2001]).
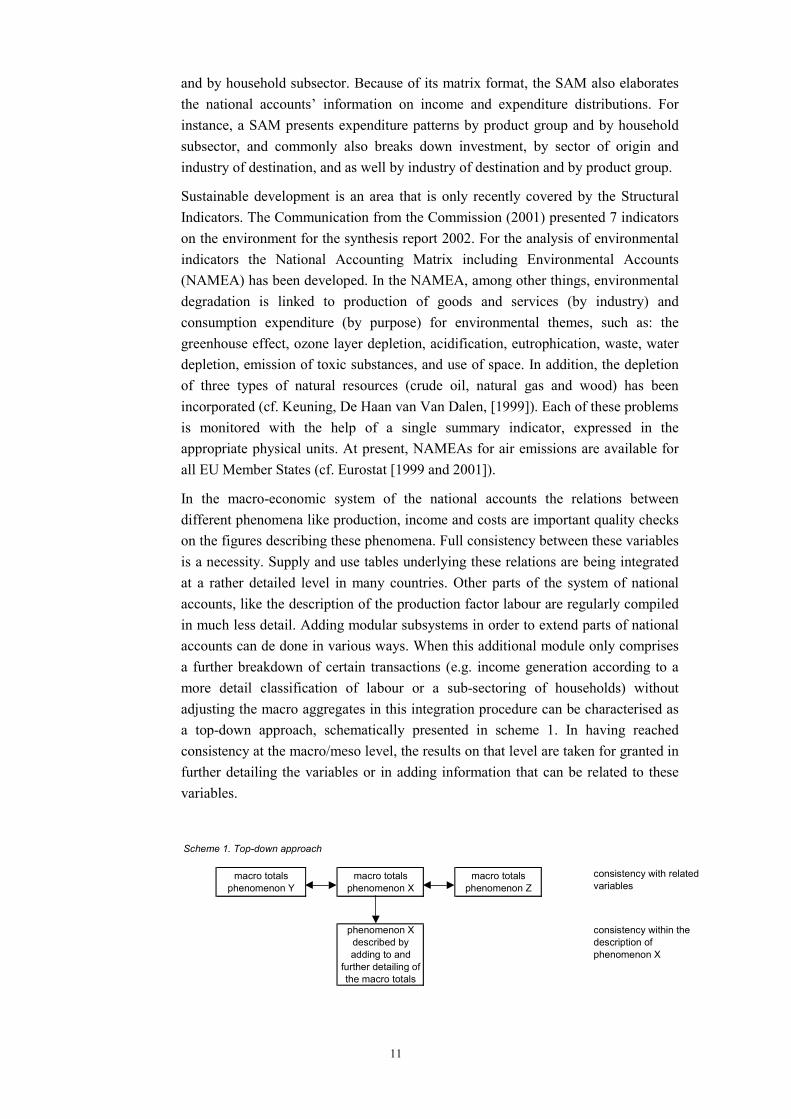
In the macro-economic system of the national accounts the relations between different phenomena like production, income and costs are important quality checks on the figures describing these phenomena. Full consistency between these variables is a necessity. Supply and use tables underlying these relations are being integrated at a rather detailed level in many countries. Other parts of the system of national accounts, like the description of the production factor labour are regularly compiled in much less detail. Adding modular subsystems in order to extend parts of national accounts can de done in various ways. When this additional module only comprises a further breakdown of certain transactions (e.g. income generation according to a more detail classification of labour or a sub-sectoring of households) without adjusting the macro aggregates in this integration procedure can be characterised as a top-down approach, schematically presented in scheme 1. In having reached consistency at the macro/meso level, the results on that level are taken for granted in further detailing the variables or in adding information that can be related to these variables.
Scheme 1. Top-down approach
macro totals phenomenon Y
macro totals phenomenon X
macro totals phenomenon Z
consistency with related variables
phenomenon X described by adding to and
further detailing of the macro totals
consistency within the description of phenomenon X
12
In adding modules to these macro-aggregates, the fastest and less capacity requiring method is just adding distributions from underlying data sources. Depending on coverage and consistency of those sources more sophisticated compilation of the inner part of those matrices might be needed. Up to now, SAMs are usually compiled by a top-down approach. In practice a top-down approach will almost always be accompanied with some bottom-up reflections and vice versa. For example, the integration of environment data in NAMEA is not an example of a top-down approach but rather a matter of harmonising the classifications and populations in the national accounts, energy accounts and subsequently the environmental accounts.
5. Micro-integration1.
Where the general economic background indicators are mainly based on macro-aggregates from the national accounts, the indicators, which have been introduced recently, rely more and more on micro data sources. Indicators in the field of education and labour market are examples of this.
Consistency requirements and the desired ability to offer data users the opportunity to descend to the dynamics underlying the changes shown in the indicators presented, also steer to integration of micro data sources. Data sources like the Labour Force Survey (LFS) and Statistics on Income and Living Conditions (SILC) are comparable between countries, but not always mutual consistent. In producing SILC, already available information from administrative registers will more and more be incorporated. Recent developments in information and communication technology have created the opportunity to build integrated micro-databases which will contain all the relevant information on persons, families, households, jobs, social security benefits and living quarters. These micro-databases are based on linked administrative and survey data and a reconciliation process called micro-integration. The production of integrated micro-data files as part of the redesigned production process of social statistics will lead to a number of benefits over the traditional ‘stovepipe’ approach: • the statistical outcomes will show more consistency; • the statistical outcomes will have better comparability over space and time; • better tools to identify quality problems in our sources; • reduce costs by using more cheap register data and less expensive survey data; • better opportunities to produce data on small population groups; • better opportunities for small area estimation; • better opportunities to correct for the selectivity of non-response in household
surveys.
1 A more extended description of micro-integration can be found in van der Laan [2000]
13
Both the improved quality resulting from the demands imposed on the micro data and the extended possibilities to interpret differences between countries and changes over time in the meso and macro figures, which can be compiled from the micro data sets underline the surplus value of an integrated micro data set over just the co-existence of separate sources each covering only part of the field. This development is very helpful for an indicator such as the gender wage gap. Average wages of men being twice as high as those of women only become meaningful when we know how these differences can be attributed to the payment of full-time jobs compared to part-time jobs; how the educational and occupational distribution in both categories is; how many years experience men have compared to women or how other personal characteristics influencing this figure hold. The search for answers to these questions does not only express the need for the inclusion of wage statistics like the Structure of earnings survey, but also personal characteristics gathered by for instance the Labour force survey. The aim of micro-integration is to check the matched data and modify incorrect records, i.e. data on individual units, in such a way that statistical analyses and publications based on the data give acceptable results. Because the published results are aggregate data, such as totals or means, it is not necessary that all errors are removed. Small errors often cancel out when they are aggregated. Statistical data editing using the combined data of all the sources that need to be checked leads to a more efficient process of data editing than a stovepipe approach, where every data source is modified independently from other ones. It is less time consuming to decide whether the records of a particular data source are accurate, when all the relevant data can be used that are available at the statistical institute.
The extent to which micro-integration improves the accuracy of our statistical output depends among other things on our knowledge of invalid, inconsistent or missing data and our experiences with statistical techniques (Holt 1999). Lack of relevant meta-data or insufficient experiences with particular statistical techniques can lead to the introduction of biases when adjusting for invalid, inconsistent or missing data.
In producing figures on the frontier area between micro and macro, micro integration can be characterised as a bottom-up approach of producing statistics. In the bottom-up approach two variants can be distinguished:
a. Derived estimates, benchmarking: in consecutive steps primary sources are the benchmark for further breakdown and extensions.
b. The accounting approach: inconsistencies between variables lead to research and adjustment of in principle all data if necessary or justified.
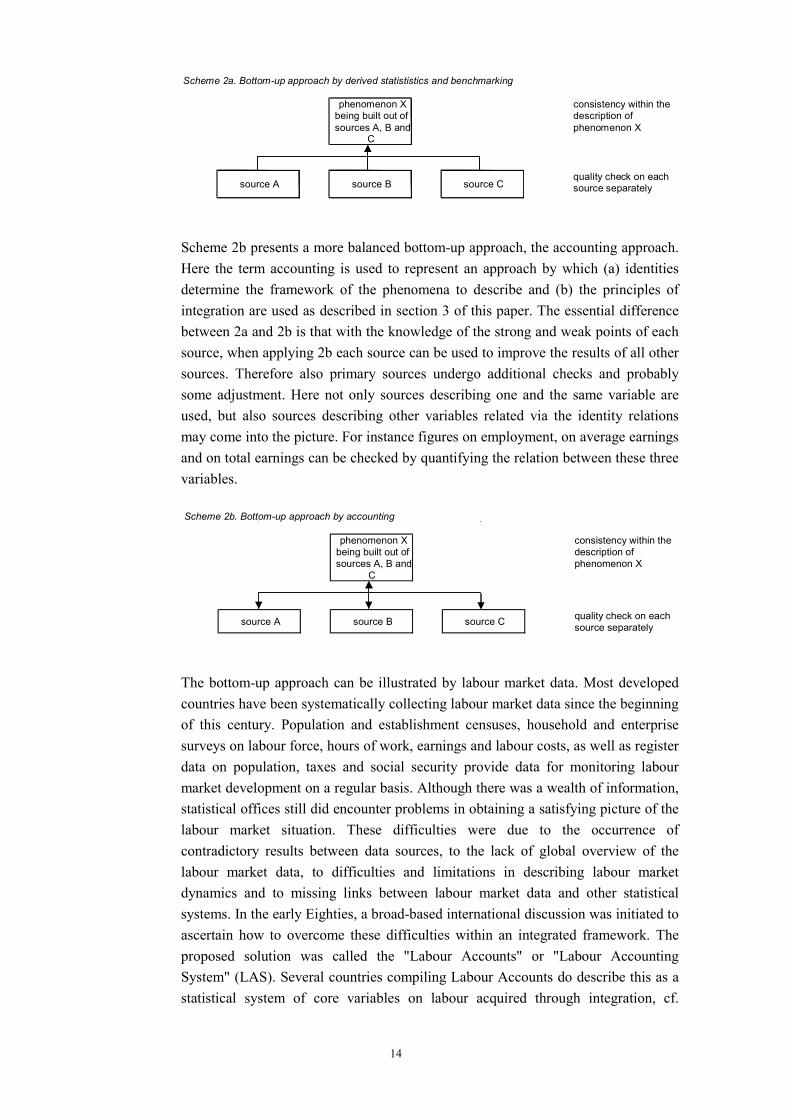
Variant a. is schematically presented in scheme 2a. Mostly one of the sources is appointed to be the primary, most reliable source beforehand. This source is not challenged anymore. This might for instance be a census or a large structural survey. The other sources are only used to bring in further detail or to add an annual or quarterly pattern. There is only one-way traffic in describing phenomenon X.
14
Scheme 2a. Bottom-up approach by derived statististics and benchmarking
phenomenon X being built out of sources A, B and
C
consistency within the description of phenomenon X
source A source B source Cquality check on each source separately
Scheme 2b presents a more balanced bottom-up approach, the accounting approach. Here the term accounting is used to represent an approach by which (a) identities determine the framework of the phenomena to describe and (b) the principles of integration are used as described in section 3 of this paper. The essential difference between 2a and 2b is that with the knowledge of the strong and weak points of each source, when applying 2b each source can be used to improve the results of all other sources. Therefore also primary sources undergo additional checks and probably some adjustment. Here not only sources describing one and the same variable are used, but also sources describing other variables related via the identity relations may come into the picture. For instance figures on employment, on average earnings and on total earnings can be checked by quantifying the relation between these three variables.
The bottom-up approach can be illustrated by labour market data. Most developed countries have been systematically collecting labour market data since the beginning of this century. Population and establishment censuses, household and enterprise surveys on labour force, hours of work, earnings and labour costs, as well as register data on population, taxes and social security provide data for monitoring labour market development on a regular basis. Although there was a wealth of information, statistical offices still did encounter problems in obtaining a satisfying picture of the labour market situation. These difficulties were due to the occurrence of contradictory results between data sources, to the lack of global overview of the labour market data, to difficulties and limitations in describing labour market dynamics and to missing links between labour market data and other statistical systems. In the early Eighties, a broad-based international discussion was initiated to ascertain how to overcome these difficulties within an integrated framework. The proposed solution was called the "Labour Accounts" or "Labour Accounting System" (LAS). Several countries compiling Labour Accounts do describe this as a statistical system of core variables on labour acquired through integration, cf.
Scheme 2b. Bottom-up approach by accounting
phenomenon Xbeing built out ofsources A, B and
C
consistency within thedescription ofphenomenon X
source A source B source C quality check on eachsource separately
15
Buhmann et al [2000]. So, the Labour Accounts consist of a set of tables providing a systematic and consistent overview, mutually and over time, of these core variables. The task of the Labour Accounts is to address the problems, mentioned above, by combining various statistical data sources so as to enhance their strengths and overcome their weaknesses as effectively as possible, thus producing new statistical series which are superior in quality to the original data sources. An appropriate choice of basic definitions enables direct connections with other statistical systems, such as the National Accounts or Demographic Accounts.
The micro-meso approach as described above for the development of labour accounts in the Netherlands is extensively being described in Statistics Netherlands [1999]). Although this already presents an example of a bottom-up approach schematically presented in scheme 2b, an even more elaborated bottom-up approach is the micro-integration described at the beginning of this section, cf. van der Laan [2000].
6. Combining top-down and bottom-up approaches
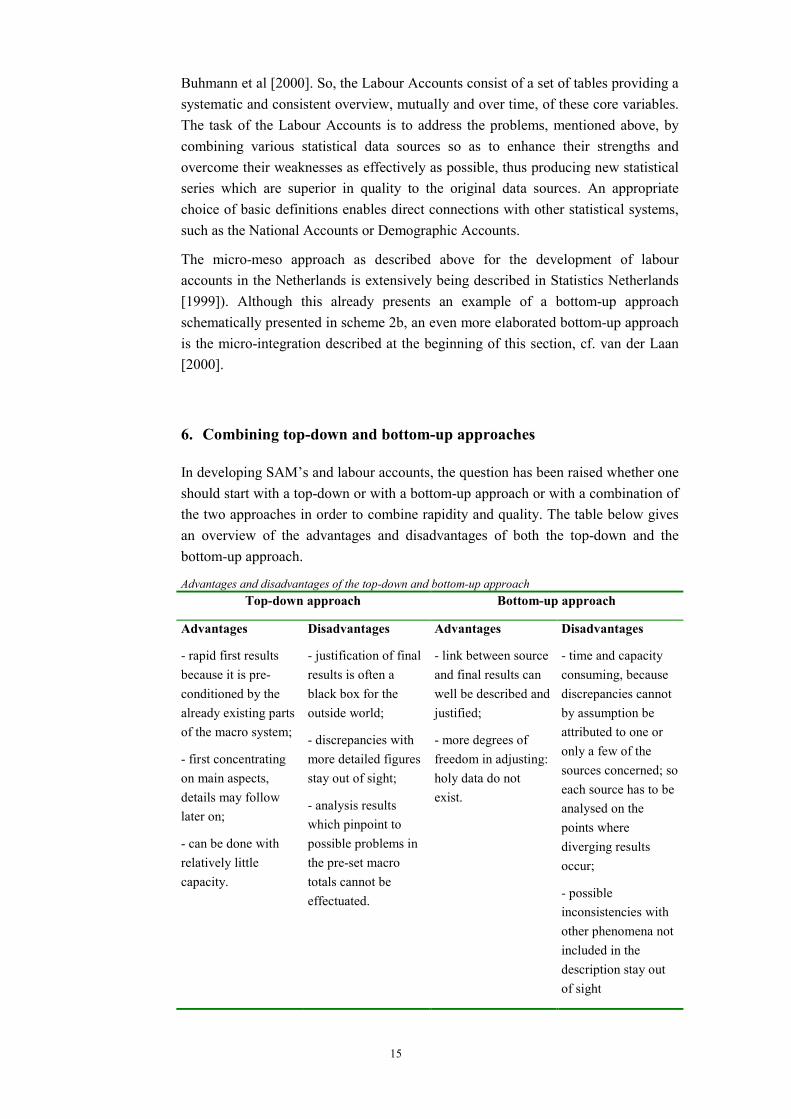
In developing SAM’s and labour accounts, the question has been raised whether one should start with a top-down or with a bottom-up approach or with a combination of the two approaches in order to combine rapidity and quality. The table below gives an overview of the advantages and disadvantages of both the top-down and the bottom-up approach.
Advantages and disadvantages of the top-down and bottom-up approach Top-down approach Bottom-up approach
Advantages Disadvantages Advantages Disadvantages
- rapid first results because it is pre-conditioned by the already existing parts of the macro system;
- first concentrating on main aspects, details may follow later on;
- can be done with relatively little capacity.
- justification of final results is often a black box for the outside world;
- discrepancies with more detailed figures stay out of sight;
- analysis results which pinpoint to possible problems in the pre-set macro totals cannot be effectuated.
- link between source and final results can well be described and justified;
- more degrees of freedom in adjusting: holy data do not exist.
- time and capacity consuming, because discrepancies cannot by assumption be attributed to one or only a few of the sources concerned; so each source has to be analysed on the points where diverging results occur;
- possible inconsistencies with other phenomena not included in the description stay out of sight
16
The start of such a bottom-up based system generally needs quite a lot of capacity, because discrepancies between different data results have to be analysed very thoroughly in order to make adjustments that can be fully justified with the available sources. When the bottom-up approach is applied in order to compile e.g. a SAM when national accounts figures have already been set, here already, some problems with the top-down approach come into the open, because analysing the data from a different angle as is the case on introducing a new shoot, always pinpoints to weaknesses in the pre-set data which cannot be adjusted anymore unless in the case of a full revision of time series. An independent implementation of both approaches will only yield similar results by very rare coincidence. In working along only one of the two lines, no use is made of all information and knowledge available, so a sub-optimal description will result.
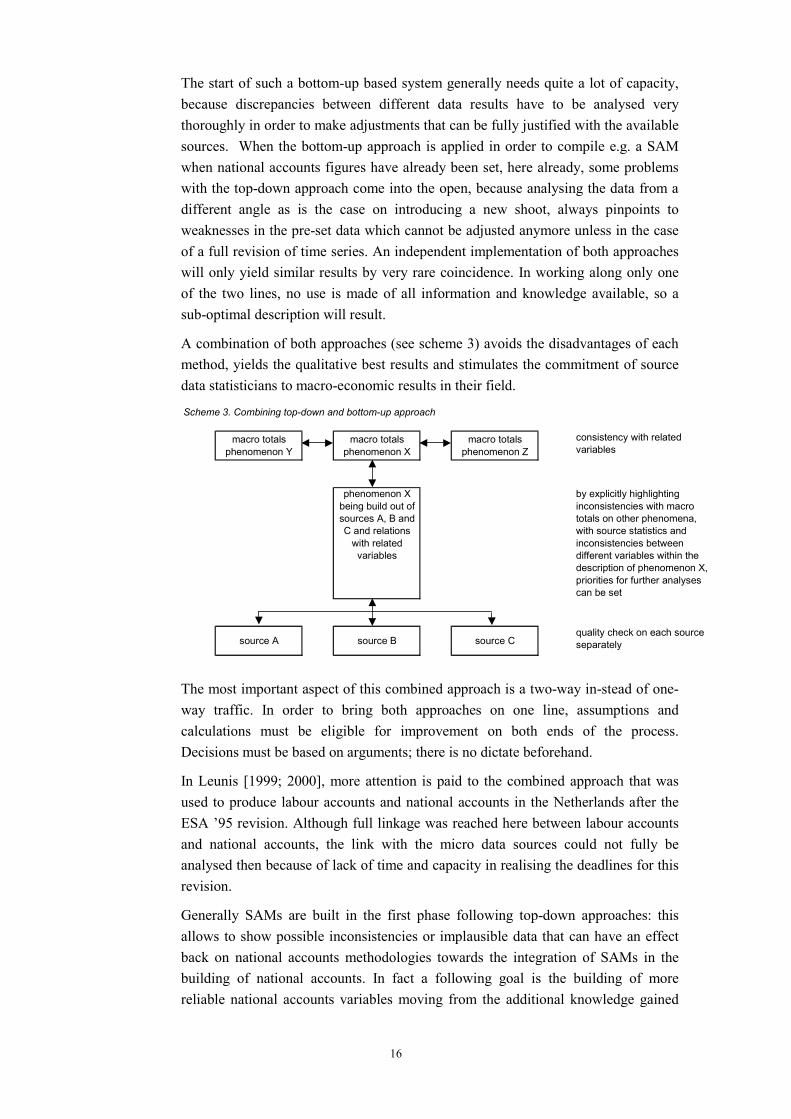
A combination of both approaches (see scheme 3) avoids the disadvantages of each method, yields the qualitative best results and stimulates the commitment of source data statisticians to macro-economic results in their field.
Scheme 3. Combining top-down and bottom-up approach
macro totals phenomenon Y
macro totals phenomenon X
macro totals phenomenon Z
consistency with related variables
phenomenon X being build out of sources A, B and C and relations
with related variables
by explicitly highlighting inconsistencies with macro totals on other phenomena, with source statistics and inconsistencies between different variables within the description of phenomenon X, priorities for further analyses can be set
source A source B source Cquality check on each source separately
The most important aspect of this combined approach is a two-way in-stead of one-way traffic. In order to bring both approaches on one line, assumptions and calculations must be eligible for improvement on both ends of the process. Decisions must be based on arguments; there is no dictate beforehand.
In Leunis [1999; 2000], more attention is paid to the combined approach that was used to produce labour accounts and national accounts in the Netherlands after the ESA ’95 revision. Although full linkage was reached here between labour accounts and national accounts, the link with the micro data sources could not fully be analysed then because of lack of time and capacity in realising the deadlines for this revision.
Generally SAMs are built in the first phase following top-down approaches: this allows to show possible inconsistencies or implausible data that can have an effect back on national accounts methodologies towards the integration of SAMs in the building of national accounts. In fact a following goal is the building of more reliable national accounts variables moving from the additional knowledge gained
17
by the compilation of SAMs. On the other hand labour accounts are very often built following a bottom-up approach. Here too, some top-down reflections are necessary. Gradually it will be possible to incorporate also the results of micro-integration here. For the compilation of Structural indicators this opens the possibility of combining (a) the link to the figures on related aspects and (b) growing possibilities to interpret changes in macro and meso figures directly from the relationships reflected by the micro data sets.
7. Structural Indicators: barriers or incentives to economic reform?
The Lisbon Strategy covers a wide range of policy fields such as employment, innovation economic reform and social cohesion. Annual synthesis reports will review the progress made in these various policy fields. The Structural Indicators represented in these reports seem to incite individual member states to take front running positions. However, the ultimate goal of such a benchmarking exercise is rather unclear. On the one hand, economic reform seems to point at the liberalisation and integration of markets. According to economic theory, this will lead to specialisation of individual countries according to their comparative advantages. Subsequently, this will enforce a more efficient allocation of production factors and thus increase welfare of individual countries and Europe as a whole. On the other hand, other goals seem to straightjacket countries in striving at the lowest energy and transport requirements and highest knowledge intensity. Neglecting the differences in economic structures of member states in the appraisal of these structural indicators conflicts with the positive welfare effects that are to be expected from specialisation. Therefore it is important to overcome differences due to specialisation in the country comparisons of structural indicators.
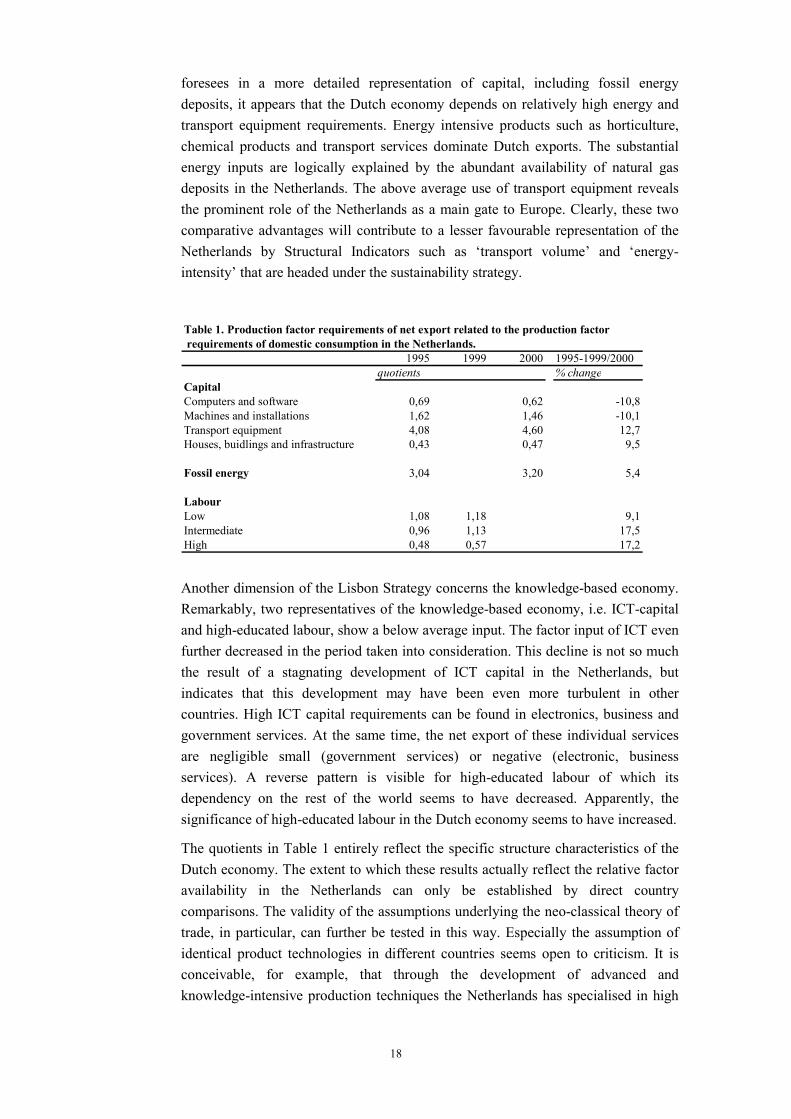
Table 1 shows which production factors play a dominant role in the direction in which the Dutch economy has developed. The quotients in this table are derived from the Heckscher-Ohlin-Vanek theory of international trade. This theory explains how the comparative advantages of countries are revealed by their international trade relationships. The theory assumes that consumption will usually be determined by general consumer preferences that will not substantially differ between countries. As such, the table compares the total factor requirements of a series of production factors of one Euro net export (export minus import) compared to the factor requirements per one Euro domestic consumption. A quotient higher then one indicates an above average endowment of a production factor in the Netherlands compared to the rest of the world. A crucial assumption is that all products are generated according to one single production technology. Therefore the quotients represent entirely the differences in product composition between net export and consumption and thus the specific characteristics of the Dutch production structure. The results in Table 1 corresponds to earlier findings of Cörvers & Reininga for the year 1991 (Cornet, 2000). Similarly, they observe a relatively high input of lower education labour in export compared to domestic consumption. Since Table 1
18
foresees in a more detailed representation of capital, including fossil energy deposits, it appears that the Dutch economy depends on relatively high energy and transport equipment requirements. Energy intensive products such as horticulture, chemical products and transport services dominate Dutch exports. The substantial energy inputs are logically explained by the abundant availability of natural gas deposits in the Netherlands. The above average use of transport equipment reveals the prominent role of the Netherlands as a main gate to Europe. Clearly, these two comparative advantages will contribute to a lesser favourable representation of the Netherlands by Structural Indicators such as ‘transport volume’ and ‘energy-intensity’ that are headed under the sustainability strategy.
Table 1. Production factor requirements of net export related to the production factor requirements of domestic consumption in the Netherlands.
1995 1999 2000 1995-1999/2000quotients % change
CapitalComputers and software 0,69 0,62 -10,8Machines and installations 1,62 1,46 -10,1Transport equipment 4,08 4,60 12,7Houses, buidlings and infrastructure 0,43 0,47 9,5
Fossil energy 3,04 3,20 5,4
Labour Low 1,08 1,18 9,1Intermediate 0,96 1,13 17,5High 0,48 0,57 17,2
Another dimension of the Lisbon Strategy concerns the knowledge-based economy. Remarkably, two representatives of the knowledge-based economy, i.e. ICT-capital and high-educated labour, show a below average input. The factor input of ICT even further decreased in the period taken into consideration. This decline is not so much the result of a stagnating development of ICT capital in the Netherlands, but indicates that this development may have been even more turbulent in other countries. High ICT capital requirements can be found in electronics, business and government services. At the same time, the net export of these individual services are negligible small (government services) or negative (electronic, business services). A reverse pattern is visible for high-educated labour of which its dependency on the rest of the world seems to have decreased. Apparently, the significance of high-educated labour in the Dutch economy seems to have increased.
The quotients in Table 1 entirely reflect the specific structure characteristics of the Dutch economy. The extent to which these results actually reflect the relative factor availability in the Netherlands can only be established by direct country comparisons. The validity of the assumptions underlying the neo-classical theory of trade, in particular, can further be tested in this way. Especially the assumption of identical product technologies in different countries seems open to criticism. It is conceivable, for example, that through the development of advanced and knowledge-intensive production techniques the Netherlands has specialised in high
19
quality products on the more traditional markets. These differences only come to the fore in a comparison of production methods and the corresponding input of production factors between countries.
In case of the Netherlands, specialisation has a negative influence on a number of Structural Indicators. For example, high scores will be found for greenhouse gas emissions and transport volumes. Relatively, lower scores will be found for innovation and research, or at least lower compared to countries that are specialised in high-tech industries. These indicators may be in conflict with the underlying goals of economic reform when it is acknowledged that differences in economic structures irrevocably result from specialisation. At the same time, the influence of economic structures on indicator outcomes conceals the factual performances on the micro and meso level. A substantial transport sector in the Netherlands does not necessarily contribute to a lesser sustainable Europe. Its geographical situation makes the Netherlands automatically suitable for a wide range of logistic services that are inextricably bound up to the economic functioning of Europe as a whole. Similarly, it is not necessarily true that the importance of transportation activities contributes to a lesser environmental performance of the Dutch economy compared to other countries. Such judgements can only result from sector based comparisons.
In other words, a correct interpretation of Structural Indicators is only possible when they can be represented in their economic or demographic context. Especially for economically oriented indicators, the national accounts provide a logical point of departure. Structural Indicators such as GDP, labour productivity and public balance are already derived from the national accounts. The application of national accounts conventions for defining other indicators will contribute to further consistency and comparability. At this moment, some indicators are inconsistently defined since numerator and denominator describe different populations. Greenhouse gas emissions are demarcated on the basis of geographical criteria which implies that pollution of domestic transport companies in other countries are excluded while those of foreign companies on domestic territory are included. The development of a harmonised system of environmental accounts in Europe made clear that these geographically demarcated pollution is only partially related to GDP and that transboundary transfers of pollution via international transportation can be substantial.
20
Figure 1a. Development of ICT capital in the Netherlands 1995-2000
-40
-20
0
20
40
60
80
100
120
Total =1+2+3+4
1. ShareICT
Capital
2. Capitalcoëfficient
3.Structure
4. GDPGrowth
%vo
lum
egr
owth
Figure 1b. Development of high educated labour volume in the Netherlands 1995-1999
-10
-5
0
5
10
15
20
25
30
Total =1+2+3+4
1. Sharehigh
educated
2. Labourcoëfficient
3.Structure
4. GDPGrowth
%ch
ange
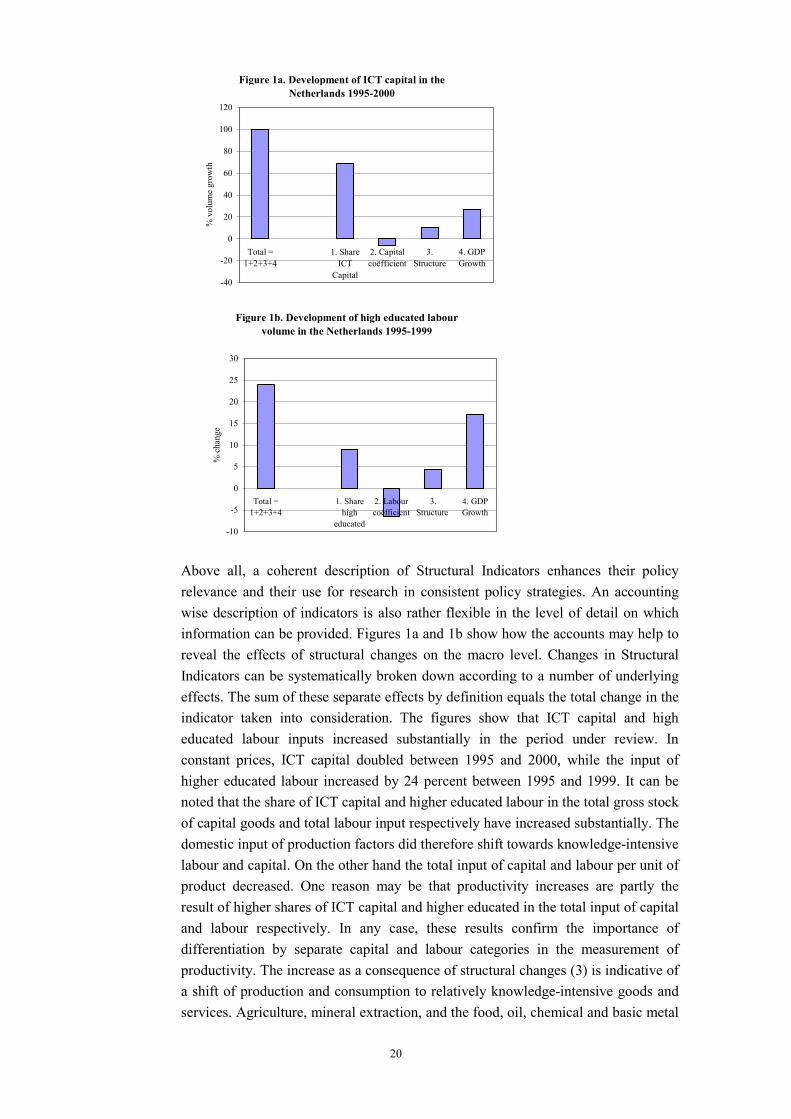
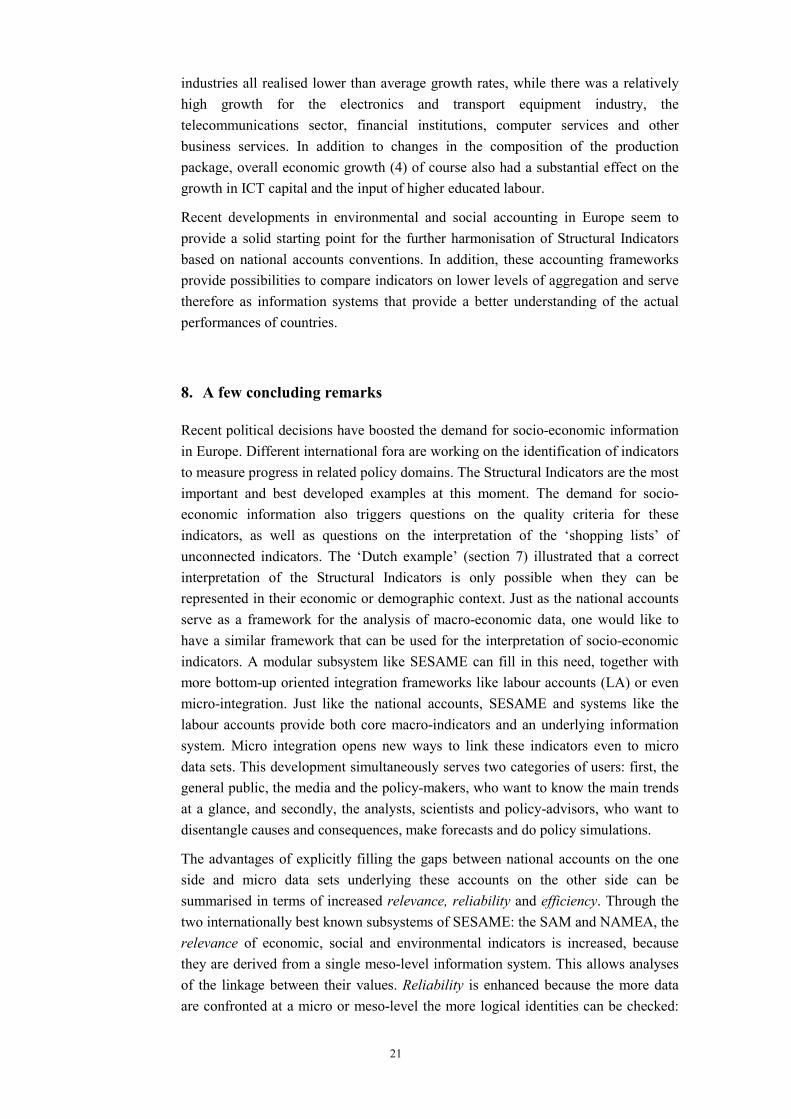
Above all, a coherent description of Structural Indicators enhances their policy relevance and their use for research in consistent policy strategies. An accounting wise description of indicators is also rather flexible in the level of detail on which information can be provided. Figures 1a and 1b show how the accounts may help to reveal the effects of structural changes on the macro level. Changes in Structural Indicators can be systematically broken down according to a number of underlying effects. The sum of these separate effects by definition equals the total change in the indicator taken into consideration. The figures show that ICT capital and high educated labour inputs increased substantially in the period under review. In constant prices, ICT capital doubled between 1995 and 2000, while the input of higher educated labour increased by 24 percent between 1995 and 1999. It can be noted that the share of ICT capital and higher educated labour in the total gross stock of capital goods and total labour input respectively have increased substantially. The domestic input of production factors did therefore shift towards knowledge-intensive labour and capital. On the other hand the total input of capital and labour per unit of product decreased. One reason may be that productivity increases are partly the result of higher shares of ICT capital and higher educated in the total input of capital and labour respectively. In any case, these results confirm the importance of differentiation by separate capital and labour categories in the measurement of productivity. The increase as a consequence of structural changes (3) is indicative of a shift of production and consumption to relatively knowledge-intensive goods and services. Agriculture, mineral extraction, and the food, oil, chemical and basic metal
21
industries all realised lower than average growth rates, while there was a relatively high growth for the electronics and transport equipment industry, the telecommunications sector, financial institutions, computer services and other business services. In addition to changes in the composition of the production package, overall economic growth (4) of course also had a substantial effect on the growth in ICT capital and the input of higher educated labour.
Recent developments in environmental and social accounting in Europe seem to provide a solid starting point for the further harmonisation of Structural Indicators based on national accounts conventions. In addition, these accounting frameworks provide possibilities to compare indicators on lower levels of aggregation and serve therefore as information systems that provide a better understanding of the actual performances of countries.
8. A few concluding remarks
Recent political decisions have boosted the demand for socio-economic information in Europe. Different international fora are working on the identification of indicators to measure progress in related policy domains. The Structural Indicators are the most important and best developed examples at this moment. The demand for socio-economic information also triggers questions on the quality criteria for these indicators, as well as questions on the interpretation of the ‘shopping lists’ of unconnected indicators. The ‘Dutch example’ (section 7) illustrated that a correct interpretation of the Structural Indicators is only possible when they can be represented in their economic or demographic context. Just as the national accounts serve as a framework for the analysis of macro-economic data, one would like to have a similar framework that can be used for the interpretation of socio-economic indicators. A modular subsystem like SESAME can fill in this need, together with more bottom-up oriented integration frameworks like labour accounts (LA) or even micro-integration. Just like the national accounts, SESAME and systems like the labour accounts provide both core macro-indicators and an underlying information system. Micro integration opens new ways to link these indicators even to micro data sets. This development simultaneously serves two categories of users: first, the general public, the media and the policy-makers, who want to know the main trends at a glance, and secondly, the analysts, scientists and policy-advisors, who want to disentangle causes and consequences, make forecasts and do policy simulations.
The advantages of explicitly filling the gaps between national accounts on the one side and micro data sets underlying these accounts on the other side can be summarised in terms of increased relevance, reliability and efficiency. Through the two internationally best known subsystems of SESAME: the SAM and NAMEA, the relevance of economic, social and environmental indicators is increased, because they are derived from a single meso-level information system. This allows analyses of the linkage between their values. Reliability is enhanced because the more data are confronted at a micro or meso-level the more logical identities can be checked:
22
components must add to totals, accounts must balance and prices and quantities must multiply to values. A good example are labour statistics. When these are confronted with the national accounts, gaps and inconsistencies in both sources can be detected and corrected. On the one hand, trends in employment and wage rates by economic activity must be plausible in the light of concomitant value-added estimates. On the other hand, the national accounts’ assessment of changes in the wage bill by industry must agree with credible changes in the employment and wage rate by labour category. Finally, efficiency is served by the application of uniform units, classifications and concepts throughout a statistical system; that is, not only in economic statistics, but also in social statistics. Among the advantages of such a harmonisation is a much easier matching of results from different surveys.
Recent achievements with NAMEA and SAM/LA show that it is feasible to implement these subsystems at the European level, although some more work needs to be done to make the modular subsystems of the national accounts available more timely. An imperative condition of the Structural Indicators is that they can be made available in a timely fashion in order to allow measurement of progress made towards the implementation of the Lisbon strategy. As in the case of economic data, where the compilation of national accounts is complementary to the need to have consistent aggregate trends for short term analyses, the SAM is also complementary to short-term information on employed persons, labour costs and volume of work. In fact, the regular availability of a detailed information system, such as a SESAME allows for a more reliable estimation of much more timely indicators, namely by combining the structure of the SESAME for an earlier year with scattered very recent pieces of information (cf. Leunis and Keuning [1994]). In the Dutch labour accounts this is already common practice for quite a number of years.
23
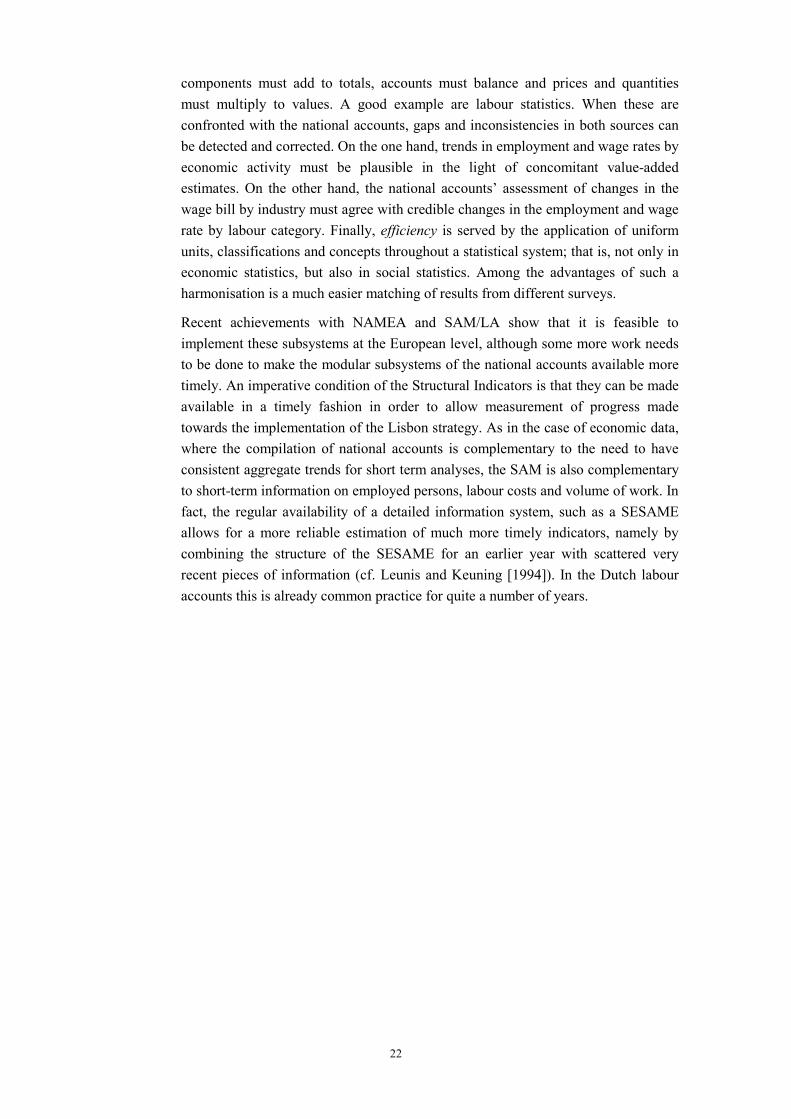
Annex 1:
General Economic Background Indicators
Indicator Micro-Macro oriented SESAME
a1. GDP per capita in PPS Macro (all background indicators are meant to provide a macroeconomic overview)
GDP is derived from the NA. PPS data are derived from a different source.
a2. Real GDP growth rate Macro Derived from the NA b1. Labour productivity Micro and macro
GDP is derived from the NA; number of employed persons is derived from the Labour Accounts (LA). Clearly, the consistency of this indicator is enhanced when NA and LA are fully consistent (as accomplished in SESAME). PPS data are derived from a different source.
b2. Labour productivity (per hour worked)
Micro and macro
GDP is derived from the NA; number of hours worked is derived from the Labour Accounts (LA). PPS data are derived from a different source.
c. Employment growth Micro and macro Derived from the Labour Accounts (LA) d. Inflation rate Macro
Not derived from SESAME. Harmonisation of HICP with national accounts (consumption) deflators will clearly increase mutual consistency between volume measures (GDP growth) and inflation figures.
e. Unit labour cost growth Macro
If this indicator can be interpreted as: Labour costs / GDP = Labour – income quotient, then the information can be derived from the NA.
f. Public balance Macro Derived from the NA g. General Government debt
Macro Derived from the NA
(I) Employment
Indicator Micro-Macro oriented SESAME
1. Employment rate This indicator is micro as well as macro oriented. Determinants of employment concern both the characteristics of the labour force as well as macro-economic conditions
This indicator can be derived from Socio-demographic module of SESAME
2. Employment rate of older workers
This indicator is micro as well as macro oriented
Potentially, this indicator can be derived from Socio-demographic module of SESAME
3. Gender pay gap This indicator is micro as well as macro oriented.
Derived from the LA/SAM
4. Tax rate on low wage earners
Micro and macro Not derived from SESAME
5. Life-long learning (adult participation in education and training)
Micro Not derived from SESAME
24
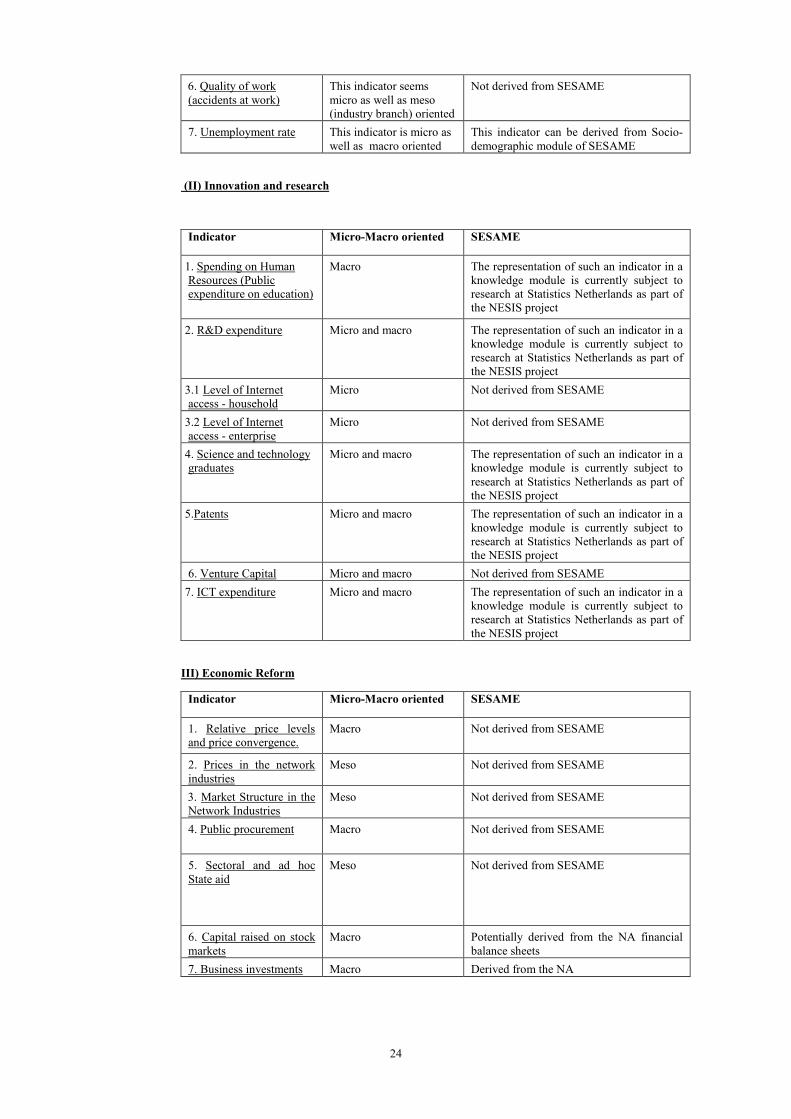
6. Quality of work (accidents at work)
This indicator seems micro as well as meso (industry branch) oriented
Not derived from SESAME
7. Unemployment rate This indicator is micro as well as macro oriented
This indicator can be derived from Socio-demographic module of SESAME
(II) Innovation and research
Indicator Micro-Macro oriented SESAME
1. Spending on Human Resources (Public expenditure on education)
Macro
The representation of such an indicator in a knowledge module is currently subject to research at Statistics Netherlands as part of the NESIS project
2. R&D expenditure Micro and macro
The representation of such an indicator in a knowledge module is currently subject to research at Statistics Netherlands as part of the NESIS project
3.1 Level of Internet access - household
Micro Not derived from SESAME
3.2 Level of Internet access - enterprise
Micro Not derived from SESAME
4. Science and technology graduates
Micro and macro The representation of such an indicator in a knowledge module is currently subject to research at Statistics Netherlands as part of the NESIS project
5.Patents Micro and macro The representation of such an indicator in a knowledge module is currently subject to research at Statistics Netherlands as part of the NESIS project
6. Venture Capital Micro and macro Not derived from SESAME 7. ICT expenditure Micro and macro
The representation of such an indicator in a knowledge module is currently subject to research at Statistics Netherlands as part of the NESIS project
III) Economic Reform
Indicator Micro-Macro oriented SESAME
1. Relative price levels and price convergence.
Macro
Not derived from SESAME
2. Prices in the network industries
Meso Not derived from SESAME
3. Market Structure in the Network Industries
Meso Not derived from SESAME
4. Public procurement Macro
Not derived from SESAME
5. Sectoral and ad hoc State aid
Meso
Not derived from SESAME
6. Capital raised on stock markets
Macro Potentially derived from the NA financial balance sheets
7. Business investments Macro Derived from the NA
25
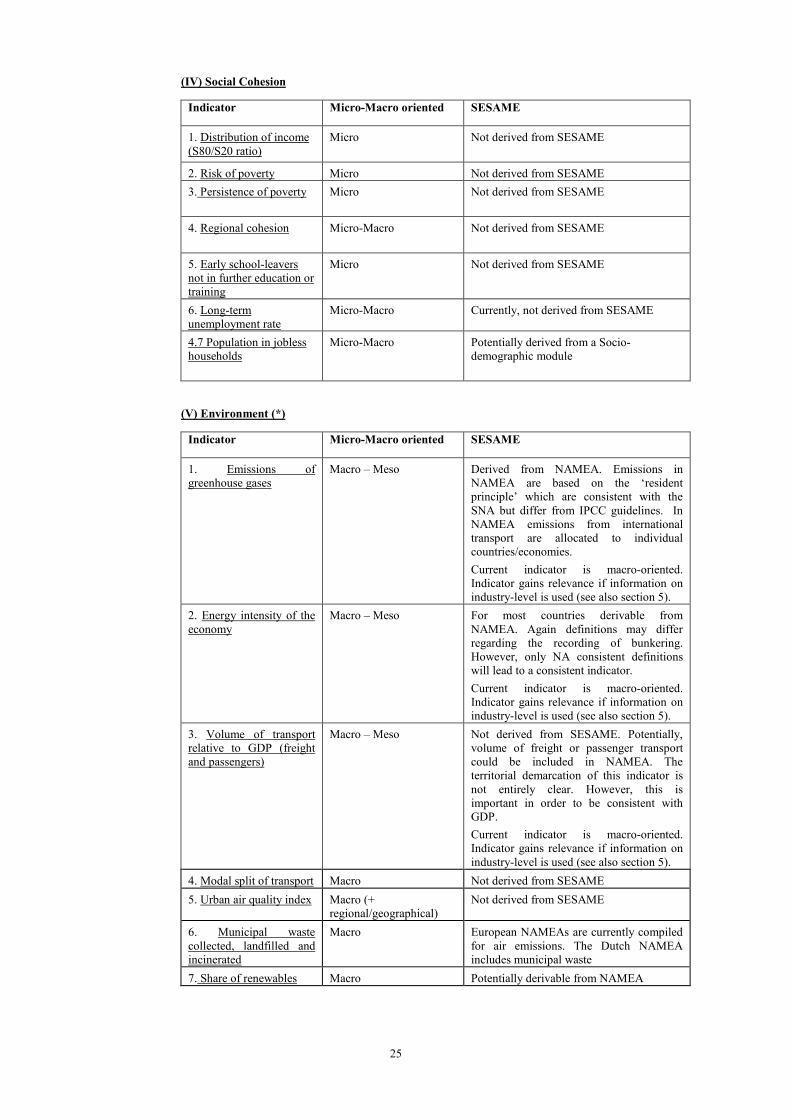
(IV) Social Cohesion
Indicator Micro-Macro oriented SESAME
1. Distribution of income (S80/S20 ratio)
Micro
Not derived from SESAME
2. Risk of poverty Micro Not derived from SESAME 3. Persistence of poverty Micro
Not derived from SESAME
4. Regional cohesion Micro-Macro
Not derived from SESAME
5. Early school-leavers not in further education or training
Micro
Not derived from SESAME
6. Long-term unemployment rate
Micro-Macro Currently, not derived from SESAME
4.7 Population in jobless households
Micro-Macro Potentially derived from a Socio-demographic module
(V) Environment (*)
Indicator Micro-Macro oriented SESAME
1. Emissions of greenhouse gases
Macro – Meso Derived from NAMEA. Emissions in NAMEA are based on the ‘resident principle’ which are consistent with the SNA but differ from IPCC guidelines. In NAMEA emissions from international transport are allocated to individual countries/economies. Current indicator is macro-oriented. Indicator gains relevance if information on industry-level is used (see also section 5).
2. Energy intensity of the economy
Macro – Meso For most countries derivable from NAMEA. Again definitions may differ regarding the recording of bunkering. However, only NA consistent definitions will lead to a consistent indicator. Current indicator is macro-oriented. Indicator gains relevance if information on industry-level is used (see also section 5).
3. Volume of transport relative to GDP (freight and passengers)
Macro – Meso Not derived from SESAME. Potentially, volume of freight or passenger transport could be included in NAMEA. The territorial demarcation of this indicator is not entirely clear. However, this is important in order to be consistent with GDP. Current indicator is macro-oriented. Indicator gains relevance if information on industry-level is used (see also section 5).
4. Modal split of transport Macro Not derived from SESAME 5. Urban air quality index Macro (+
regional/geographical) Not derived from SESAME
6. Municipal waste collected, landfilled and incinerated
Macro European NAMEAs are currently compiled for air emissions. The Dutch NAMEA includes municipal waste
7. Share of renewables Macro Potentially derivable from NAMEA
26
References
Cornet, M.F., 2000. Kaaskoppen verhandelen kennis. Economische Statistische Berichten, 4 februari.
Economic and Social Committee, 2001. Opinion of the Economic and Social Committee on Structural Indicators, CES 241/2001.
European Commission, 2000. Communication from the Commission on Structural indicators, COM (2000) 594 final.
European Commission, 2001. Communication from the Commission to the Council, the European Parliament, the Economic and Social Committee and the Committee of the Regions on Employment and social policies: a framework for investing in quality, COM (2001) 313 final.
European Commission, 2001. Communication from the Commission to the Council, the European Parliament and the Economic and Social Committee on Supporting national strategies for safe and sustainable pensions through an integrated approach, COM (2001) 362 final.
European Commission, 2001. Note for the attention of members of the Commission, Report on the informal meeting of Ministers for Employment and Social Policy, Liège, 6-7 July 2001, SI (2001) 815.
European Commission, 2001, Communication from the Commission Structural Indicators. COM (2001) 619 final.
Eurostat, 1995. European System of Accounts. Luxembourg.
Eurostat, 1999. Pilot Studies on NAMEAs for Air Emissions with a Comparison at European Level. Luxembourg.
Eurostat, 2001. Structural Indicators, Definitions – Data sources – Data availability, 11 July 2001. Doc. Eurostatt/D2/SBS/IPS/Jun01.
Eurostat, 2001. NAMEAs for Air Emissions. Luxembourg.
Haan, de M. & H. Verduin, 2000. De vergelijking can economische baten en milieulasten: verschillen in kooldioxidecijfers nader toegelicht. Tijdschrift Milieu, No. 3, p. 159-166.
Haan, de M., 2001. A structural decomposition analysis of pollution in the Netherlands. Economic System Research, Vol. 13, p. 181-196.
Kazemier, Brugt, Steven Keuning and Peter van de Ven, 1998. Measuring well-being with an integrated system of economic and social accounts. An application of the SESAME approach to the Netherlands. Paper prepared for the 25th General Conference of the International Association for Research in Income and Wealth, 23-29 August 19998, Cambridge (UK).
Keuning, Steven, 1996. Accounting for Economic Development and Social Change, IOS Press.
27
Keuning, Steven, 1997. SESAME: an integrated economic and social accounting system, in: International Statistical Review (1997), 65, 111-121.
Keuning, Steven, 1998. Interaction between National Accounts and socio-economic policy, in: The Review of Income and Wealth, Series 44, Number 3, September 1998.
Keuning, Steven, Mark de Haan and Jan van Dalen, 1999. The Netherlands’ NAMEA; presentation, usage and future extensions. In: Structural Change and Economic Dynamics 10 (1999), 15-37.
Laan, Paul van der, 2000, Social Statistics based on Micro-Integration of Administrative Registers and Household Surveys, Paper prepared for the Session on Methodologies and Developments for Statistical Information Systems, 2000 Meeting of the Siena Group on Social Statistics, Maastricht, Netherlands, 22-24 May 2000.
Leunis, Wim and Keuning, Steven, 1994. Integrated Statistical Information Systems: An Evaluation, in: Ned. Official Stat., Summer 1994.
Leunis, Wim P., 1999, Linking social and economic statistics through the 1995 revision of national accounts and labour accounts, paper presented at the OECD national accounts working party meeting, 21-24 September, Paris
Leunis, Wim P., 2000, The description of ESA ’95 employment; relation between labour force survey and national accounts in the Netherlands, Interim summary report prepared for the Taskforce on ESA employment, 25 February 2000
Pyatt, Graham, 1999. Some Relationships between T-Accounts, Input-Output Tables and Social Accounting Matrices, in: Economic Systems Research, Volume 11, Number 4, December 1999, 365-389.
Pyatt, Graham & Round J., 1995. Social Accounting Matrices: A basis for planning. Washington D.C.: World Bank.
Pyatt, Graham and Thorbecke E., 1976. Planning Techniques for a better future. International Labour Office, Geneva.
Statistics Netherlands, 1999, Labour accounts in theory and practice, the Dutch
experience (Statistics Netherlands, Voorburg/Heerlen)
United Nations, 1977. The feasibility of welfare-oriented measures to supplement
the national accounts and balances: a technical report. Studies in Methods, series F, Number 22, United Nations, New York.
United Nations, Eurostat, International Monetary Fund, Organization for Economic
Cooperation and Development & Wold Bank, 1993. System of National Accounts 1993. Series F, No. 2, Rev. 4, New York.