European Innovation Scoreboard 2017 - RVO.nl · The new measurement framework is composed of ten...
93
European Innovation Scoreboard 2017
Transcript of European Innovation Scoreboard 2017 - RVO.nl · The new measurement framework is composed of ten...

European Innovation Scoreboard 2017


ForewordInnovation means prosperity. It drives productivity and economic growth, creates opportunities for new and better jobs, enables social mobility and is
instrumental in responding to global societal challenges. In times of profound technological and societal transformation, the competitiveness of the
European economy and the well-being of European citizens depend – more than ever – on the ability of our businesses to develop and successfully
commercialise innovative solutions. Innovation increases efficiency, boosts company productivity and provides huge benefits to consumers.
Creating an ecosystem that allows innovation to thrive and multiply is a shared task of the EU, its Member States, regions and municipalities. The
European Innovation Scoreboard helps Member States to assess performance, track progress on key aspects and identify policy priorities. For this
year's edition, we have revised the measurement framework to better capture digitalisation and entrepreneurship, as drivers that are transforming
the nature of innovation and how it spreads. We also adjusted that framework to improve its use for policymaking by better distinguishing between
framework conditions, investments in innovation, firms' innovation activities and their impact.
The report reveals that while the innovation performance of the EU is improving, progress is too slow. Many of our global competitors are increasing
their innovation performance at a much faster pace, and within the EU, performance gaps remain wide. While we are making good progress in
education and research as well as in broadband infrastructure and ICT training, venture capital investments and the number of SMEs introducing
innovations are declining strongly. Lifelong learning – essential to empowering citizens in a rapidly changing world – is stagnating.
In essence, Europe still lacks the market-creating innovation that is needed to turn our best ideas into new businesses and high quality jobs. We
need to make sure at local, regional, national and EU level that innovative companies – established ones and start-ups alike – have access to the
right employees with the right skills, to academic communities, other innovators and business partners, to the right investors and finance, and to the
right political support for venturing into new markets in Europe and beyond.
The European Commission's priority actions address the entire innovation ecosystem. For instance, under the New Skills Agenda, we are working
to overcome a growing mismatch of skills and to massively improve skills and reorient the European workforce. As part of our Startup and Scaleup
initiative, we are launching a Pan-European Venture Capital Fund of Funds, which will provide funding for innovative, high-risk, high-potential
projects. This will be complemented by a preparatory action for a European Innovation Council, which will champion breakthrough market-creating
innovation and listen, harness and add value to the ideas of Europe's entrepreneurs and innovators. In parallel, we are continuously assessing and
improving the innovation-friendliness of the European regulatory framework.
As we seek to make an open, outward-looking EU a destination of choice for global talent and investment and a hub of global value chains, a solid
evidence base to guide our policies is more important than ever. We are confident that the European Innovation Scoreboard 2017 will provide
valuable resources for policy-makers to design policies that support innovation and hence jobs and growth in Europe. The Regional Innovation
Scoreboard, which we are launching together with this report, provides additional insights at regional level. We hope that these reports will provide
useful insight to policymakers, companies and researchers, and to anyone who shares our determination to boost innovation in Europe.
Elżbieta Bieńkowska
European Commissioner for Internal Market, Industry,
Entrepreneurship and SMEs
Carlos Moedas
European Commissioner for Research,
Science and Innovation


TABLE OF CONTENTS
6 EXECUTIVE SUMMARY
8 1. A REVISED MEASUREMENT FRAMEWORK
14 2. INNOVATION PERFORMANCE AND TRENDS
14 2.1 Most recent innovation performance
16 2.2 Performance changes
19 3. PERFORMANCE OF THE EU INNOVATION SYSTEM
20 4. INNOVATION DIMENSIONS
26 5. BENCHMARKING INNOVATION PERFORMANCE WITH NON�EU COUNTRIES
26 5.1 Benchmarking against other European countries and regional neighbours
27 5.2 Benchmarking against global competitors
34 6. EXPECTED SHORT�TERM CHANGES IN EU INNOVATION PERFORMANCE
35 6.1 Looking back at last year’s estimates
36 6.2 EU trend performance compared to China, Japan, South Korea, and the United States
37 6.3 Short-term changes in EU innovation performance by indicator
39 6.4 Methodology section
40 6.5 Big data as a statistical source for innovation indicators
41 7. COUNTRY PROFILES
78 8. EUROPEAN INNOVATION SCOREBOARD METHODOLOGY
80 ANNEX A: Country abbreviations
80 ANNEX B: Performance per indicator
81 ANNEX C: Current performance
83 ANNEX D: Performance change
85 ANNEX E: Definitions of indicators
90 ANNEX F: Summary Innovation Index (SII) time series
91 ANNEX G: Performance scores per dimension
92 ANNEX H: International data

6 European Innovation Scoreboard 2017
Executive summaryEuropean Innovation Scoreboard 2017: a revised
measurement framework
This year’s edition constitutes a major conceptual advancement of the
report. Following developments in policy priorities, economic theory and
data availability, the previous measurement framework was in need of
adjustment. Its revision for the present edition aims at better aligning
the EIS innovation dimensions with evolving policy priorities, improving
the quality and timeliness of the indicators, better capturing new and
emerging phenomena as digitisation and entrepreneurship, and providing
a toolbox with contextual data, which can be used to analyse structural
differences between Member States. The revision has benefited from
interactions with renowned experts in the field and representatives of
EU Member States.
The new measurement framework is composed of ten dimensions,
including a new dimension on the innovation-friendly environment. Last
year’s dimension on economic effects has been split in two separate
dimensions measuring the impact of innovation on employment and
sales. By deleting three indicators and including five new indicators, the
number of indicators has increased from 25 last year to 27 this year. In
addition, definitions have been revised for six indicators. Another change
is that comparisons between countries and over time are made relative
to the performance of the EU in 2010, thereby providing an improved
monitoring of performance changes over time.
The EU is catching up with the United States, while it is
losing ground vis-à-vis South Korea and Japan
At the global level, the EU is less innovative than Australia, Canada,
Japan, South Korea, and the United States. Performance differences
with Canada and the United States have become smaller compared to
2010, but those with Japan and South Korea have increased. Japan has
improved its performance more than three times as much as the EU,
and South Korea has improved its performance more than four times as
much as the EU. The EU maintains a performance lead over China, but
this lead is decreasing rapidly with China having improved more than
seven times faster than the EU. The EU’s performance lead over Brazil,
India, Russia, and South Africa is considerable.
Performance of innovation systems is measured by
average performance on 27 indicators
The new EIS measurement framework distinguishes between four
main types of indicators and ten innovation dimensions, capturing in
total 27 different indicators. Framework conditions capture the main
drivers of innovation performance external to the firm and cover three
innovation dimensions: Human resources, Attractive research systems,
as well as Innovation-friendly environment. Investments capture
public and private investment in research and innovation and cover two
dimensions: Finance and support and Firm investments. Innovation
activities capture the innovation efforts at the level of the firm, grouped
in three innovation dimensions: Innovators, Linkages, and Intellectual
assets. Impacts cover the effects of firms’ innovation activities in two
innovation dimensions: Employment impacts and Sales effects.
Figure 1: Performance of EU Member States’ innovation systems
Coloured columns show Member States’ performance in 2016, using the most recent data for 27 indicators, relative to that of the EU in 2010. The horizontal hyphens show performance in 2015, using the next most recent data for 27 indicators, relative to that of the EU in 2010. Grey columns show Member States’ performance in 2010 relative to that of the EU in 2010. For all years the same measurement methodology has been used. The dashed lines show the threshold values between the performance groups in 2016, comparing Member States’ performance in 2016 relative to that of the EU in 2016.
0
20
40
60
80
100
120
140
160
RO BG HR PL LV HU EL SK CY IT MT ES LT EE PT CZ SI EU FR IE BE LU AT DE UK NL FI DK SE
MODEST INNOVATORS MODERATE INNOVATORS STRONG INNOVATORS INNOVATION LEADERS 2010 2015

7European Innovation Scoreboard 2017
Member States are classified into four performance
groups based on their average performance scores
Based on their average performance scores as calculated by
a composite indicator, the Summary Innovation Index, Member States
fall into four different performance groups (Figure 1). Denmark, Finland,
Germany, the Netherlands, Sweden, and the United Kingdom are
Innovation Leaders with innovation performance well above that of the
EU average. Austria, Belgium, France, Ireland, Luxembourg, and Slovenia
are Strong Innovators with performance above or close to that of the
EU average. The performance of Croatia, Cyprus, the Czech Republic,
Estonia, Greece, Hungary, Italy, Latvia, Lithuania, Malta, Poland, Portugal,
Slovakia, and Spain is below that of the EU average. These countries are
Moderate Innovators. Bulgaria and Romania are Modest Innovators with
performance well below that of the EU average.
Performance has increased for the EU but not for all
Member States
Compared to 2010, the innovation performance of the EU has increased
by 2 percentage points. At the level of individual Member States, results
differ with an increase in performance in 15 countries and a decrease
in performance in 13 countries. Performance has increased most
in Lithuania, Malta, the Netherlands, and the United Kingdom, and
decreased most in Cyprus and Romania.
Switzerland remains the most innovative country
in Europe
Comparing the EU Member States to other European and neighbouring
countries, Switzerland remains the most innovative European country.
Iceland, Israel and Norway are Strong Innovators performing above the
EU average, Serbia and Turkey are Moderate Innovators, and the Former
Yugoslav Republic of Macedonia and Ukraine are Modest Innovators.
In two years’ time, EU innovation performance is expected
to increase by 2 percentage points
Last year’s report introduced, for the first time, a forward-looking analysis
of EU innovation performance, discussing more recent developments,
trends, and expected changes. This exercise is repeated this year
using the revised measurement framework. The analysis explores EU
trend performance on 19 indicators, for which a robust calculation of
expected short-term changes proved possible. Increasing performance
is expected for 12 of these indicators, and decreasing performance for
six indicators. Overall, the innovation performance of the EU, relative to
its performance in 2010, is expected to increase from 102% this year to
104% in two years’ time.
This analysis also includes a trend comparison of the EU with its main
competitors. At the global level, the trends observed in recent years can
be expected to continue, with the EU catching up with the United States
in two years’ time, while the EU’s performance gap towards Japan and
South Korea would increase and its lead over China decrease further.
8 European Innovation Scoreboard 2017
1. A revised measurement frameworkThe annual European Innovation Scoreboard (EIS) provides a comparative
assessment of the research and innovation performance of the EU
Member States and the relative strengths and weaknesses of their
research and innovation systems. It helps Member States assess areas
in which they need to concentrate their efforts in order to boost their
innovation performance.
For the European Innovation Scoreboard 20171, the 16th edition since the
introduction of the EIS in 2001, the measurement framework has been
significantly revised. A direct consequence of this revision is that results
in this year’s EIS report cannot be compared to the results in the EIS 2016
report.
A revised framework
The most recent 2016 European Innovation Scoreboard (EIS) followed
the methodology of previous editions. The last major revision of the
measurement framework was introduced in 2010 with the launch of
the Innovation Union. Following new developments in policy priorities,
economic theory and data availability, last year’s measurement
framework was in need of adjustment. The revision of the framework
started in 2016 and benefited from discussions in various forums,
including an expert workshop, various meetings of the Enterprise
Policy Group (EPG)’s Subgroup on Innovation, a presentation at the
European Research and Innovation Area Committee (ERAC)2 plenary, and
a workshop under ERAC auspices.
Notably, for the present 2017 edition, there was a need to: (1) better align
the EIS dimensions with changing policy priorities; (2) continuously improve
the quality, timeliness and analytical soundness of indicators; (3) ensure
that the EIS better captures increasingly important phenomena, including
in fields such as digitisation and entrepreneurship, and that it includes
indicators on key areas such as human resources, skills and science-
business links; and (4) provide a contextual analysis of the data presented,
examining the effects of structural differences between Member States, in
order to provide an enhanced evidence base for policy-making purposes.
Changes to the EIS measurement framework: regrouping
and addition of dimensions
In the following, the changes to the EIS measurement framework will
be briefly discussed. The EIS 2017 Methodology Report includes a more
detailed discussion of these changes and the rationale for the new
framework. The Methodology Report will also discuss the impact of
these changes on the results compared to those in the EIS 2016.
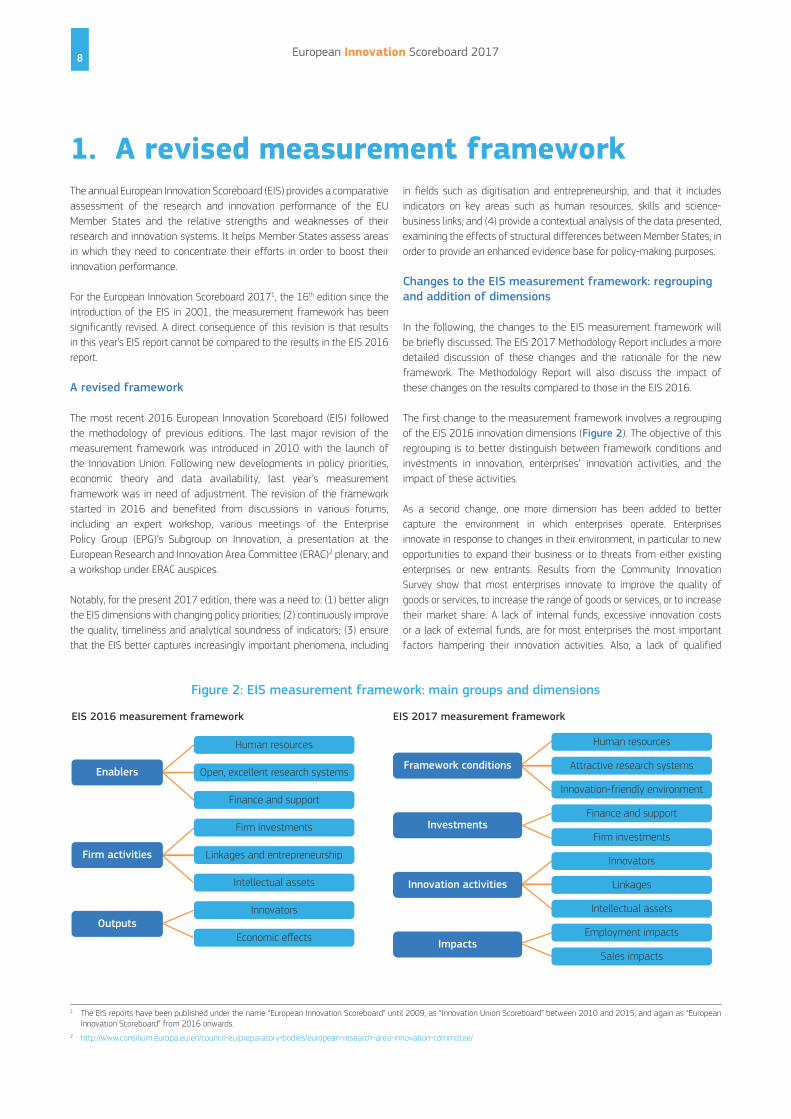
The first change to the measurement framework involves a regrouping
of the EIS 2016 innovation dimensions (Figure 2). The objective of this
regrouping is to better distinguish between framework conditions and
investments in innovation, enterprises’ innovation activities, and the
impact of these activities.
As a second change, one more dimension has been added to better
capture the environment in which enterprises operate. Enterprises
innovate in response to changes in their environment, in particular to new
opportunities to expand their business or to threats from either existing
enterprises or new entrants. Results from the Community Innovation
Survey show that most enterprises innovate to improve the quality of
goods or services, to increase the range of goods or services, or to increase
their market share. A lack of internal funds, excessive innovation costs
or a lack of external funds, are for most enterprises the most important
factors hampering their innovation activities. Also, a lack of qualified
Figure 2: EIS measurement framework: main groups and dimensions
EIS 2016 measurement framework
Human resources
Open, excellent research systems
Finance and support
Human resources
Attractive research systems
Innovation-friendly environment
Innovators
Linkages
Intellectual assets
Finance and support
Firm investments
Employment impacts
Sales impacts
Firm investments
Linkages and entrepreneurship
Intellectual assets
Innovators
Economic effects
EIS 2017 measurement framework
Firm activities
Outputs
EnablersFramework conditions
Investments
Innovation activities
Impacts
1 The EIS reports have been published under the name “European Innovation Scoreboard” until 2009, as “Innovation Union Scoreboard” between 2010 and 2015, and again as “European
Innovation Scoreboard” from 2016 onwards.
2 http://www.consilium.europa.eu/en/council-eu/preparatory-bodies/european-research-area-innovation-committee/

9European Innovation Scoreboard 2017
personnel, markets being dominated by established enterprises, and
uncertain demand for innovative goods or services, score high among the
factors hindering innovation. An environment which is “innovation-friendly”
will act as a catalyst, helping enterprises to innovate or innovate more.
A third change involves splitting the EIS 2016 dimension measuring
economic effects in two dimensions, one measuring employment
impacts and the other one measuring sales impact.
Changes to the EIS measurement framework: deleted,
revised and new indicators
Within each of the dimensions, performance of the research and
innovation system is captured by two or three indicators. Table 1
summarises the changes made, including the deletion of three indicators,
minor revisions to six indicators, and the inclusion of five new indicators.
Annex E provides more detailed definitions for each indicator.
Deleted indicators
‘Youth with at least upper secondary education’ has been removed for
several reasons: first, education attainment is already captured by the
indicator measuring the share of population with tertiary attainment;
second, removing the indicator allowed for the inclusion of an indicator
measuring the upgrading of skills during working life, i.e. the new
indicator on lifelong learning. ‘PCT patent applications in societal
challenges’ has been removed as it is already included in the indicator
measuring all ‘PCT patent applications’, and including it would lead
to a double-counting of patent applications in societal challenges.
‘License and patent revenues from abroad’ has been removed as
these revenues can be considered as exports of knowledge-intensive
services. The revenues previously captured by this indicator are now
included in the revised indicator on ‘Knowledge-intensive services
exports’.
Revised indicators
The share of ‘Population having completed tertiary education’ has been
revised by increasing the age group from 30-34 to 25-34. Broadening
the age group will reduce the confidence interval and improve the
statistical significance of changes, while still capturing a relatively
narrow age group, thereby allowing the indicator to respond faster to
policy changes. The revised indicator uses the same age group as the
indicator on ‘New doctorate graduates’.
‘Foreign doctorate students as percentage of total doctorate students’
has been revised by not only capturing students with a citizenship of
non-EU Member States as in the EIS 2016, but including all students
with a citizenship of any foreign country (thus also including other EU
Member States). The revision follows the fact that there should be no
difference in the value of foreign students to a country’s education
system based on their country of origin. Broadening the definition will
also provide a better benchmark with non-EU Member States, as for
these the EIS 2016 indicator already included all foreign students.

10 European Innovation Scoreboard 2017
Table 1: EIS measurement framework: indicators
EIS 2016 measurement framework
(indicators removed in red, indicators revised in blue)
EIS 2017 measurement framework
(indicators revised in blue, new indicators in green)
ENABLERS
Human resources
1.1.1 New doctorate graduates
1.1.2 Population aged 30-34 with tertiary education
1.1.3 Youth with at least upper secondary education
Open, excellent research systems
1.2.1 International scientific co-publications
1.2.2 Top 10% most cited publications
1.2.3 Non-EU doctorate students
Finance and support
1.3.1 R&D expenditure in the public sector
1.3.2 Venture capital expenditures
FIRM ACTIVITIES
Firm investments
2.1.1 R&D expenditure in the business sector
2.1.2 Non-R&D innovation expenditures
Linkages and entrepreneurship
2.2.1 SMEs innovating in-house
2.2.2 Innovative SMEs collaborating with others
2.2.3 Public-private co-publications
Intellectual assets
2.3.1 PCT patent applications
2.3.2 PCT patent applications in societal challenges
2.3.3 Trademarks applications
2.3.4 Design applications
OUTPUTS
Innovators
3.1.1 SMEs with product or process innovations
3.1.2 SMEs with marketing or organisational innovations
3.1.3 Employment fast-growing enterprises of innovative sectors
Economic effects
3.2.1 Employment in knowledge-intensive activities
3.2.2 Medium and high tech product exports
3.2.3 Knowledge-intensive services exports
3.2.4 Sales of new-to-market and new-to-firm product innovations
3.2.5 License and patent revenues from abroad
FRAMEWORK CONDITIONS
Human resources
1.1.1 New doctorate graduates
1.1.2 Population aged 25-34 with tertiary education
1.1.3 Lifelong learning
Attractive research systems
1.2.1 International scientific co-publications
1.2.2 Top 10% most cited publications
1.2.3 Foreign doctorate students
Innovation-friendly environment
1.3.1 Broadband penetration
1.3.2 Opportunity-driven entrepreneurship
INVESTMENTS
Finance and support
2.1.1 R&D expenditure in the public sector
2.1.2 Venture capital expenditures
Firm investments
2.2.1 R&D expenditure in the business sector
2.2.2 Non-R&D innovation expenditures
2.2.3 Enterprises providing training to develop or upgrade ICT skills
of their personnel
INNOVATION ACTIVITIES
Innovators
3.1.1 SMEs with product or process innovations
3.1.2 SMEs with marketing or organisational innovations
3.1.3 SMEs innovating in-house
Linkages
3.2.1 Innovative SMEs collaborating with others
3.2.2 Public-private co-publications
3.2.3 Private co-funding of public R&D expenditures
Intellectual assets
3.3.1 PCT patent applications
3.3.2 Trademark applications
3.3.3 Design applications
IMPACTS
Employment impacts
4.1.1 Employment in knowledge-intensive activities
4.1.2 Employment fast-growing enterprises of innovative sectors
Sales impacts
4.2.1 Medium and high tech product exports
4.2.2 Knowledge-intensive services exports
4.2.3 Sales of new-to-market and new-to-firm product innovations

11European Innovation Scoreboard 2017
The indicator measuring ‘Trademark applications’ has been revised and
will aggregate data from the European Union Intellectual Property Office
(EUIPO) on Community trademark applications, already used in the EIS
2016, with data from the World Intellectual Property Organization
(WIPO) on trademark applications applied for under the Madrid Protocol.
In the EU, there is a four-tier system for registering trademarks: 1) for
protection in one EU Member State only, one can make a trademark
application directly at the relevant national IP office. This is the national
route. 2) For protection in Belgium, the Netherlands and/or Luxembourg,
one can make an application to the Benelux Office of Intellectual
Property (BOIP), the only regional-level IP office in the EU, for trademark
protection in those three Member States. This is the regional route. 3)
For protection in more Member States of the EU, one can apply for an
EU trademark from EUIPO – this is the European route. 4) The fourth
route to protection in the EU is the international route. One can use
a national, regional or EU trademark application to expand protection
internationally, to any country that is a signatory of the Madrid Protocol.
‘Employment in fast-growing enterprises of innovative sectors’ suffered
from being excessively complex, making it difficult to explain year-on-
year changes in country performance. The indicator originates from the
European Commission’s Innovation Output Indicator (IOI). The previous
indicator was computed by weighting sectoral innovation coefficients
with sectoral shares of employment in high-growth enterprises.
The revised indicator instead measures more simply the share of
employment in high-growth enterprises in the top 50% most innovative
sectors within total employment. The top 50% most innovative sectors
are selected based on a ranking of innovation coefficients measuring
the degree of innovation of each industry at EU level3.
The indicator measuring ‘Knowledge-intensive services exports’ has
been revised and also includes license and patent revenues from
abroad, which was a separate indicator in the EIS 2016.
New indicators
‘Lifelong learning (percentage of population aged 25 to 64 participating
in education and training)’ captures the share of the adult population
involved in training activities and measures the upgrading of skills
during working life. Lifelong learning encompasses all purposeful
learning activity, whether formal, non-formal or informal, undertaken
on an ongoing basis with the aim of improving knowledge, skills and
competence. Lifelong learning makes workers involved in innovative
activities more knowledgeable and efficient. The 25-64 year age group
refers to the majority of the labour force outside initial formal education.
The indicator was also included in earlier versions of the EIS, but was
removed from the 2010 report onwards.
‘Broadband penetration (share of enterprises with a maximum contracted
download speed of the fastest fixed internet connection of at least 100
Mbps)’ captures the increasing digitisation of European economies.
Digital innovations are reshaping Europe’s economy and industries. Big
data, the Internet of Things, and mobile and cloud technologies are
expected to be strong drivers of economic growth, job creation and the
quality of life. Realising Europe’s full e-potential depends on creating
the conditions for electronic commerce and the Internet to flourish. This
indicator captures the relative use of this e-potential by the share of
enterprises that have access to fast broadband.
‘Opportunity-driven entrepreneurship’ is measured by the Motivational
Index from the Global Entrepreneurship Monitor (GEM) and captures
the prevalence of opportunity-driven entrepreneurship. Improvement-
driven opportunity entrepreneurship is the result of individuals wanting
to exploit new innovative products. This type of entrepreneurship is
relevant for measuring the performance of innovation systems.
The ‘share of enterprises that provide training to develop/upgrade ICT
skills of their personnel’ captures the upgrading of ICT skills in the
business sector. ICT skills are particularly important for innovation in an
increasingly digital economy. The share of enterprises providing training
in this respect is a proxy for the overall skills development of employees.
‘Private co-funding of public R&D (percentage of GDP)’ measures public-
private co-operation. The share of university and government R&D
financed by the business sector captures the importance of external
R&D and the role of Public Research Organisations and higher education
institutions in an enterprise’s innovation activities. A higher share of
business funding going to public R&D is expected in economies with
a high share of large firms with more linkages to public R&D. In addition,
external R&D-industry links are more developed in science-intensive
sectors such as semiconductors, computers, communications equipment,
drugs, organic chemicals, plastics, petroleum refining, pulp and paper.
Additional contextual analysis on the impact of structural
differences between countries
In addition to changes to the main measurement framework, a need
has emerged for additional contextual analyses explaining the impact
of structural differences on observed scores. The analysis of structural
differences by country will be performed in the country profiles. As an
introduction, the following sections discuss the importance of these
structural aspects for a better understanding of differences between
countries in the performance on particular indicators. Full definitions of
these indicators are provided in the EIS 2017 Methodology Report.
Structure of the economy
Of particular importance are differences in economic structures, with
differences in the share of industry in GDP and so-called high-tech
activities in manufacturing and services, being important factors that
explain why countries can performance better or worse on indicators
like business R&D expenditures, PCT patents and innovative enterprises.
Medium-high and high-tech industries have higher technological
intensities than other industries. These industries, on average, will have
higher R&D expenditures, patent applications and shares of innovating
3 Vertesy, D. and Deiss, R., The Innovation Output Indicator 2016. Methodology Update; EUR 27880 EN; doi:10.2788/261409

12 European Innovation Scoreboard 2017
enterprises. Countries with above-average shares of these industries
are expected to perform better on several EIS indicators. For example,
for the EU28 on average, 85% of R&D expenditures in manufacturing
are accounted for by medium-high and high-technology manufacturing
industries4. Also, the share of enterprises that introduced a product
and/or process innovation is higher (53%) in medium-high and high-
technology manufacturing industries compared to all core industries
(31%) covered in the Community Innovation Survey5.
Business indicators
Enterprise characteristics are important for explaining differences in
R&D spending and innovation activities. Large enterprises, defined as
enterprises with 250 or more employees, account for almost four-fifths
of EU business R&D expenditures (Figure 3), whereas SMEs, defined
as enterprises with 10 to 249 employees, account for only one-fifth.
The presence of large R&D spending enterprises is captured by the EU
Industrial R&D Investment Scoreboard, which provides economic and
financial data and analysis of the top corporate R&D investors from the
EU and abroad6.
Foreign ownership, including ownership from both other EU Member
States and non-Member States, is important as about 40% of business
R&D expenditures in EU Member States are by foreign affiliates, which
is significantly higher compared to major international competitors7.
The indicator measuring the share of foreign-controlled enterprises
serves as a proxy for differences in foreign ownership rates between
countries.
‘Opportunity-driven entrepreneurship’ is one of the new indicators in
the EIS and provides a measure of opportunities for engaging in new
business. The EIS indicator is complemented by a contextual indicator
measuring the share of new enterprise births in the economy.
Institutional and legal differences between countries may make it more
or less difficult to engage in business activities. The World Bank’s Doing
Business provides an index, Ease of starting a business, which measures
the distance of each economy to the “frontier” economy providing the
most lenient regulatory framework for doing business. Countries with
more favourable regulatory environments will obtain scores closer to the
maximum score of 100. This indicator complements the EIS indicators
covering real new business activities or perceived possibilities for new
business activities: ‘Employment of fast-growing firms in innovative
sectors’ and ‘Opportunity-driven entrepreneurship’.
4 Based on NACE Rev. 2 3-digit level, manufacturing industries can be classified as follows:
High-technology (HT): Basic pharmaceutical products and pharmaceutical preparations (21); Computer, electronic and optical products (26); Air and spacecra� and related machinery
(30.3*).
Medium-high-technology (MHT): Chemicals and chemical products (20); Weapons and ammunition (25.4**); Electrical equipment (27); Machinery and equipment not elsewhere classified
(28); Motor vehicles, trailers and semi-trailers (29); Other transport equipment (30) excluding Building of ships and boats (30.1) and excluding Air and spacecra� and related machinery
(30.3); Medical and dental instruments and supplies (32.5***).
Medium-low-technology (MLT): Reproduction of recorded media (18.2***); Coke and refined petroleum products (19); Rubber and plastic products (22); Other non-metallic mineral
products (23); Basic metals (24); Fabricated metal products, except machinery and equipment (25) excluding Manufacture of weapons and ammunition (25.4); Building of ships and
boats (30.1*); Repair and installation of machinery and equipment (33).
Low-technology (LT): Food products (10); Beverages (11); Tobacco products (12); Textiles (13); Wearing apparel (14); Leather and related products (15); Wood and products of wood and
cork, except furniture; articles of straw and plaiting materials (16); Paper and paper products (17); Printing and reproduction of recorded media (18) excluding Reproduction of recorded
media (18.2); Furniture (31); Other manufacturing (32) excluding Medical and dental instruments and supplies (32.5).
If data are only available at the NACE Rev. 2 2-digit level, industries identified with an * are classified as medium-high-technology, industries identified with an ** are classified as
medium-low-technology, and industries identified with an *** are classified as low-technology (Source: http://ec.europa.eu/eurostat/statistics-explained/index.php/Glossary:High-tech_
classification_of_manufacturing_industries).
5 In accordance with Commission Regulation No 995/2012, the following industries and services are included in the Core target population to be covered in the CIS:
Core Industry (excluding construction): Mining and quarrying (B), Manufacturing (C) (10-12: Manufacture of food products, beverages and tobacco; 13-15: Manufacture of textiles,
wearing apparel, leather and related products; 16-18: Manufacture of wood, paper, printing and reproduction; 20: Manufacture of chemicals and chemical products; 21: Manufacture
of basic pharmaceutical products and pharmaceutical preparations; 19-22 Manufacture of petroleum, chemical, pharmaceutical, rubber and plastic products; 23: Manufacture of
other non-metallic mineral products; 24: Manufacture of basic metals; 25: Manufacture of fabricated metal products, except machinery and equipment; 26: Manufacture of computer,
electronic and optical products; 25-30: Manufacture of fabricated metal products (except machinery and equipment), computer, electronic and optical products, electrical equipment,
motor vehicles and other transport equipment; 31-33: Manufacture of furniture; jewellery, musical instruments, toys; repair and installation of machinery and equipment, Electricity, gas,
steam and air conditioning supply (D), Water supply, sewerage, waste management and remediation activities (E) (36: Water collection, treatment and supply; 37-39: Sewerage, waste
management, remediation activities).
Core Services: Wholesale trade, except of motor vehicles and motorcycles (46), Transport and storage (H) (49-51: Land transport and transport via pipelines, water transport and
air transport; 52-53: Warehousing and support activities for transportation and postal and courier activities); Information and communication (J) (58: Publishing activities; 61:
Telecommunications; 62: Computer programming, consultancy and related activities; 63: Information service activities), Financial and insurance activities (K) (64: Financial service
activities, except insurance and pension funding; 65: Insurance, reinsurance and pension funding, except compulsory social security; 66: Activities auxiliary to financial services
and insurance activities), Professional, scientific and technical activities (M) (71-73: Architectural and engineering activities; technical testing and analysis; Scientific research and
development; Advertising and market research).
6 http://iri.jrc.ec.europa.eu/scoreboard.html
7 Average shares for 2011-2015 are 40.8% for the EU (a weighted average of 15 Member States for which data are available), 29.4% for Australia, 35.6% for Canada, 16.1% for the
United States, and 5.5% for Japan (own calculation using data from OECD Main Science and Technology Indicators).
Figure 3: Enterprise size and business R&D expenditures
78
14
7
2
0 20 40 60 80
250 employees or more
50 to 249 employees
10 to 49 employees
1 to 9 employees
Share of business R&D expenditures by enterprise size
Average 2011-2014 data for EU28

13European Innovation Scoreboard 2017
Demand is an important driver of innovation. According to the Oslo
Manual (2005)8, demand factors shape innovation activity in two
major ways: for the development of new products, as firms modify and
differentiate products to increase sales and market share; and for the
improvement of the production and supply processes in order to reduce
costs and lower prices. A robust indicator measuring the demand for
innovation is currently not available. The Executive Opinion Survey of the
World Economic Forum includes an indicator that provides a measure
of the preferences of individual consumers for innovative products. The
degree of Buyer sophistication measures, on a scale from 1 (low) to 7
(high), whether buyers focus more on price or quality of products and
services. Higher degrees of Buyer sophistication could explain higher
shares of innovative sales as measured by the EIS indicator ‘Sales of
new-to-market and new-to-firm product innovations’.
Socio-demographic indicators
Densely populated areas are more likely to be more innovative for
several reasons. First, knowledge diffuses more easily when people
and enterprises are located closer to each other. Second, in urbanised
areas there tends to be a concentration of government and educational
services. These provide better training opportunities and also employ
above-average shares of highly educated people. Data on urbanisation
distinguish between the share of households living in rural areas, towns
and suburbs, and cities. For the EU28, higher shares of highly educated
people and people involved in lifelong learning are found in more highly
urbanised areas.9 At the regional level, differences in population density
and in the degree of urbanisation are even more relevant. Regional
data for 220 regions in Europe are available in the Regional Innovation
Scoreboard 2017.
Structural data also include population size and GDP per capita in
purchasing power standards10, which is a measure for interpreting
real income differences between countries. Other indicators include
population size, the share of population aged 15-64 as a proxy for the
share of the labour force, and two indicators measuring the change
between 2010 and 2015 in GDP and population. In economies that grow
faster, expanding markets may provide more favourable conditions for
enterprises to sell their goods and services.
Data sources and data availability
The EIS uses the most recent statistics from Eurostat and other
internationally recognised sources such as the OECD and the United
Nations available at the time of analysis, with the cut-off day of 25
April 2017. International sources have been used wherever possible in
order to improve comparability between countries. The data relates to
actual performance in 2016 for 10 indicators, 2015 for eight indicators
and 2014 for nine indicators (these are the most recent years for which
data are available, cf. Annex E).
Data availability is complete for 26 Member States, with data being
available for all 27 indicators. For Malta, data is missing for ‘Opportunity-
driven entrepreneurship’ as the Global Entrepreneurship Monitor is not
carried out there. For Greece, data is missing for the indicators ‘Foreign
doctorate students’ and ‘Employment in fast-growing enterprises in
innovative sectors’.
8 The Oslo Manual is the foremost international source of guidelines for the collection and use of data on innovation activities in industry. OECD/Eurostat (2005), Oslo Manual: Guidelines
for Collecting and Interpreting Innovation Data, 3rd Edition, OECD Publishing, Paris. DOI: http://dx.doi.org/10.1787/9789264013100-en
9 More details are provided in the EIS Methodology Report.
10 The purchasing power standard, abbreviated as PPS, is an artificial currency unit. Theoretically, one PPS can buy the same amount of goods and services in each country. However, price
differences across borders mean that different amounts of national currency units are needed for the same goods and services depending on the country. PPS are derived by dividing any
economic aggregate of a country in national currency by its respective purchasing power parities. PPS is the technical term used by Eurostat for the common currency in which national
accounts aggregates are expressed when adjusted for price level differences using PPPs. Thus, PPPs can be interpreted as the exchange rate of the PPS against the Euro.

14 European Innovation Scoreboard 2017
2. Innovation performance and trends
2.1 Most recent innovation performance
The performance of EU national innovation systems is measured by the
Summary Innovation Index, which is a composite indicator obtained by
taking an unweighted average of the 27 indicators (cf. Table 1)11. Figure 4
shows the scores for the Summary Innovation Index for all EU Member
States (country abbreviations and full names are shown in Annex A).
Based on this year’s results, the Member States fall into four
performance groups12:
• The first group of Innovation Leaders includes Member States
where performance is more than 20% above the EU average. The
Innovation Leaders are Denmark, Finland, Germany, the Netherlands,
Sweden, and the United Kingdom13.
• The second group of Strong Innovators includes Member States
with a performance between 90% and 120% of the EU average.
Austria, Belgium, France, Ireland, Luxembourg, and Slovenia are
Strong Innovators.
• The third group of Moderate Innovators includes Member States
where performance is between 50% and 90% of the EU average.
Croatia, Cyprus, the Czech Republic, Estonia, Greece, Hungary, Italy,
Latvia, Lithuania, Malta, Poland, Portugal, Slovakia, and Spain
belong to this group.
• The fourth group of Modest Innovators includes Member States
that show a performance level below 50% of the EU average. This
group includes Bulgaria and Romania.
As shown on the map in Figure 5, the performance groups tend to
be geographically concentrated. The most innovative countries are
surrounded by different zones of countries. Their average performance
decreases with increasing geographical distance from the Innovation
Leaders.
11 Chapter 8 gives a brief explanation of the calculation methodology. The EIS 2017 Methodology Report provides a more detailed explanation.
12 The EIS performance groups are relative performance groups with countries’ group membership depending on their performance relative to that of the EU. With a growing EU innovation
performance, the absolute thresholds between these groups will also be increasing over time.
13 The UK was a Strong Innovator in the EIS 2016. The country’s advance to the Innovation Leader group in the EIS 2017 is not due to the new measurement framework, as it would still
have been a Strong Innovator last year based on the next most recent data in the EIS 2017.
0
20
40
60
80
100
120
140
160
RO BG HR PL LV HU EL SK CY IT MT ES LT EE PT CZ SI EU FR IE BE LU AT DE UK NL FI DK SE
MODEST INNOVATORS MODERATE INNOVATORS STRONG INNOVATORS INNOVATION LEADERS 2010 2015
Figure 4: Performance of EU Member States’ innovation systems
Coloured columns show Member States’ performance in 2016, using the most recent data for 27 indicators, relative to that of the EU in 2010. The horizontal
hyphens show performance in 2015, using the next most recent data for 27 indicators, relative to that of the EU in 2010. Grey columns show Member States’
performance in 2010 relative to that of the EU in 2010. For all years the same measurement methodology has been used. The dashed lines show the threshold
values between the performance groups in 2016, comparing Member States’ performance in 2016 relative to that of the EU in 2016. Scores relative to EU 2016
used for determining group membership are shown in Annex F.

15European Innovation Scoreboard 2017
Figure 5: Map showing the performance of EU Member States’ innovation systems

16 European Innovation Scoreboard 2017
2.2 Performance changes
This section discusses performance changes over time for each of the
innovation performance groups and the Member States included in each
of the groups.
For the EU, performance between 2010 and 2016 improved by 2.0
percentage points. Performance improved for 15 Member States
and worsened for 13 Member States (Figure 6) (Annex F shows the
Summary Innovation Index and performance scores relative to the EU
average over time):
• For seven Member States, performance improved by 5% or more:
Lithuania (21.0%), Malta (12.2%), United Kingdom (11.7%),
Netherlands (10.4%), Austria (8.9%), Latvia (8.5%), and Slovakia
(8.0%);
• For eight Member States, performance improved by less than
5%: Ireland (3.5%), France (2.8%), Sweden (2.3%), Poland (2.0%),
Belgium (1.4%), Luxembourg (1.4%), Greece (0.7%), and Bulgaria
(0.1%);
• For 10 Member States, performance declined by up to 5%: Slovenia
(-0.2%), Italy (-0.2%), Croatia (-1.4%), Spain (-1.8%), Portugal
(-2.4%), Denmark (-2.8%), Hungary (-3.5%), Czech Republic (-3.5%),
Estonia (-3.6%), and Germany (-3.7%);
• For three Member States, performance declined by more than 5%:
Finland (-5.1%), Cyprus (-12.7%), and Romania (-14.1%).
In past EIS reports, less innovative countries would improve their
performance faster than more innovative countries. There was thus
a negative link between the level of and the change in performance.
This year’s report shows that the change in performance is not related
to the level of performance14. Between 2010 and 2016, there has been
no convergence in innovation performance between Member States
performing at lower levels in 2010 and those performing at higher levels.
Performance for the Innovation Leaders improved until 2013, after
which it declined in 2014. Performance improved again in 2015 and
2016, but average performance is still below that in 2012. Performance
has improved most in the Netherlands and the UK, with increases of
more than 10 percentage points. The increase in the Netherlands took
place mostly between 2011 and 2012. The increase in the UK is more
recent, starting in 2012 and accelerating in 2016. Performance also
improved for Sweden, but at a lower rate. For Denmark, Finland, and
Germany, performance has declined. Danish performance improved until
2013, after which it declined for three years resulting in an almost 9
percentage point lower relative score in 2016 as compared to 2013. For
Germany, a similar pattern is observed with increasing performance until
2013 followed by a decline until 2016. For Finland, the decline already
started in 2010 leading to an almost 6 percentage point performance
decline until 2014, but performance improved again in 2015 and 2016.
DK
DE
NL FI
SE
UK BE IE
FR
LU AT
SI CZ
EE EL
ES IT CY
LV
LT
HU MT
PL
PT
SK
HR BG
RO
20
40
60
80
100
120
140
160
-15 -10 -5 0 5 10 15 20 25
Inno
vati
on
index
20
16
rela
tive
to E
U in
20
10
Change in innovation index between 2010 and 2016 (both relative to EU in 2010 )
Figure 6: Change in innovation performance not related to performance levels
The vertical axis shows Member States’ performance in 2016 relative to that of the EU in 2010. The horizontal axis shows the change in performance between
2010 and 2016 relative to that of the EU in 2010. The dashed lines show the respective scores for the EU.
14 The correlation coefficient between the change and the levels in both 2010 and 2016 is statistically not significant.

17European Innovation Scoreboard 2017
For the Strong Innovators, performance improved until 2013, after
which it declined in 2014 and 2015, and increased strongly in 2016,
raising average performance by 3 percentage points compared to 2010.
The performance gap to the Innovation Leaders narrowed between
2010 and 2016.
Performance has improved for all Strong Innovators, but most strongly
for Austria, in particular due to a strong increase in 2016. Also for
Ireland, performance increased strongly in 2016 (6.9 percentage points).
For Belgium and France, performance in 2016 increased at slightly lower
rates, whereas it declined marginally for Slovenia and more strongly for
Luxembourg.
100
110
120
130
140
150
160
2010 2011 2012 2013 2014 2015 2016
Sweden
Denmark
Finland
Netherlands
United Kingdom
Germany
100
110
120
130
140
150
160
2010 2011 2012 2013 2014 2015 2016
INNOVATION LEADERS
Figure 7: Performance Innovation Leaders
Performance is relative to that of the EU in 2010. The graph on the le� shows the average performance of the Innovation Leaders, calculated as the unweighted
average of the respective Member States.
80
90
100
110
120
130
140
2010 2011 2012 2013 2014 2015 2016
Luxembourg
Austria
Belgium
Ireland
France
Slovenia
80
90
100
110
120
130
140
2010 2011 2012 2013 2014 2015 2016
STRONG INNOVATORS
Figure 8: Performance Strong Innovators
Performance is relative to that of the EU in 2010. The graph on the le� shows the average performance of the Strong Innovators, calculated as the unweighted
average of the respective Member States.

18 European Innovation Scoreboard 2017
For the Moderate Innovators, performance has been increasing in
a cyclical pattern, with performance increases in odd-numbered years
and performance decreases in even-numbered years. The performance
gap to the Strong Innovators widened between 2010 and 2016.
For five Moderate Innovators, performance has increased. For Lithuania,
performance improved very strongly by 21.1 percentage points, with
performance improvements in most years but in particular in 2016.
Performance also increased strongly for Malta between 2010 and 2016,
in particular in 2013 and 2014, when performance grew by 9 percentage
points on average per year. For both Latvia and Slovakia, performance
increased by almost 8 percentage points. For Latvia, strong performance
increases in 2014 and 2015 are partly offset by performance declines
in 2012 and 2016. For Slovakia, performance increased strongly until
2013, but has declined between 2013 and 2016. For Greece and
Poland, performance has increased at more moderate rates.
For Italy, performance in 2016 is just below that in 2010. For Croatia
and Spain, performance declined by about 1.5 percentage points, with
performance increasing in 2015 and 2016 for both countries. For the
Czech Republic, Estonia, and Hungary, performance declined between 3
and 5 percentage points, but performance patterns over time are quite
different. For the Czech Republic, annual performance has been changing
at relatively moderate rates, with a stronger decline in 2012. For Estonia,
performance has been improving up until 2015, followed by a very
strong decline of almost 12 percentage points in 2016. For Hungary,
a performance decline until 2013 has been followed by a performance
increase between 2013 and 2016. For Cyprus, performance has declined
most strongly, in particular due to a very strong performance decline in
2014.
For the Modest Innovators, performance declined between 2010 and
2016, leading to a widening of the performance gap to the Moderate
Innovators. For Bulgaria, performance in 2016 is almost the same as in
2010, where a strong decline in 2012 has almost been matched with
performance increases in all other years. For Romania, performance
has declined strongly by 14.1 percentage points but, after four years of
declining performance, performance increased again in 2016.
40
50
60
70
80
90
100
2010 2011 2012 2013 2014 2015 2016
Czech Republic
Portugal
Lithuania
Spain
Estonia
Malta
Italy
Cyprus
30
40
50
60
70
80
90
2010 2011 2012 2013 2014 2015 2016
Greece
Hungary
Slovakia
Latvia
Poland
Croatia
Bulgaria
Romania
40
50
60
70
80
90
100
2010 2011 2012 2013 2014 2015 2016
MODERATE INNOVATORS
30
40
50
60
70
80
90
2010 2011 2012 2013 2014 2015 2016
MODEST INNOVATORS
Figure 9: Performance Moderate and Modest Innovators
Performance is relative to that of the EU in 2010. The graph on the top-le� shows the average performance of the Moderate Innovators, calculated
as the unweighted average of the respective Member States. The graph on the bottom-right shows the average performance of the Modest Innovators,
calculated as the unweighted average of the respective Member States.

19European Innovation Scoreboard 2017
3. Performance of the EU innovation systemPerformance of the EU innovation system has improved by 2.0
percentage points between 2010 and 2016. However, not all elements
of the EU innovation system have been improving at the same rate.
Figure 10 shows the improvement for each dimension and indicator
compared to the performance of that dimension or indicator in 2010.
Performance has improved most (21.0 percentage points) in Human
resources, with increasing performance in ‘Doctorate graduates’ and
‘Tertiary education’15. Performance in Innovation-friendly environment
has improved due to a strong improvement in ‘Broadband penetration’.
Performance for all three indicators captured in Firm investments has
improved, leading to a 13.6 percentage point performance increase.
A 54.2 percentage point increase in ‘International scientific co-
publications’ has been the main driver of the performance increase for
Attractive research systems.
For Sales impact, performance has improved by almost 3 percentage
points, with increasing performance for all three indicators. Performance
in Intellectual assets and Employment impact has almost not changed.
For Employment impact, the increase in ‘Employment in knowledge-
intensive activities’ has been offset by a decline in ‘Employment of
fast-growing enterprises in innovative sectors’. For Intellectual assets,
performance has increased for ‘Trademark applications’ but remained
stable or declined for the other two indicators.
Performance has declined for three dimensions. For Finance and support,
performance in both ‘Public R&D expenditures’ and ‘Venture capital
investments’ has declined. For Innovators, performance has declined for
all three indicators. For Linkages, performance has declined for ‘Public-
private co-publications’ and remained almost the same for the other
two indicators.
121
112
114
84
114
86
95
100
100
103
127 132
101
154 104
109
144 93
98 65
109 109
121
82 82
93
101 86
99
100 110
94
108 95
103 105
101
40 60 80 100 120 140 160
HUMAN RESOURCES Doctorate graduates
Tertiary education Lifelong learning
ATTRACTIVE RESEARCH SYSTEMS International co-publications
Most cited publications Foreign doctorate students
INNOVATION-FRIENDLY ENVIRONMENT Broadband penetration
Opportunity-driven entrepreneurship FINANCE AND SUPPORT Public R&D expenditure
Venture capital investment FIRM INVESTMENTS
Business R&D expenditure Non-R&D Innovation expenditure
Upgrading ICT skills INNOVATORS
Product/process innovators Organisational/marketing innovators
SMEs innovating in-house LINKAGES
Innovative SMEs collaborating with others Public-private co-publications Private co-funding public R&D
INTELLECTUAL ASSETS PCT patent applications Trademark applications
Design applications EMPLOYMENT IMPACT
Employment in knowledge-intensive act. Empl. fast-growing firms inn. sectors
SALES IMPACT Medium & high tech product exports
Knowledge-intensive services exports Sales of new to market & firm products
Dimensions Indicators
Figure 10: EU Performance change between 2010 and 2016 by dimension and indicator
Normalised scores in 2016 relative to those in 2010 (=100)
15 Performance in Lifelong learning has not improved as due to a break in series in 2013, data are only available for three years, where performance has not changed over these three years.

20 European Innovation Scoreboard 2017
4. Innovation dimensionsThe order of performance groups observed for the Summary Innovation
Index also applies to most dimensions. The Innovation Leaders perform
best in all but one dimension, followed by the Strong Innovators, the
Moderate Innovators and the Modest Innovators (Figure 11) (Annex G
shows the composite indicator scores for each dimension).
In the Innovators dimension, the Strong Innovators show the best
performance. In other dimensions, performance differences can be
small between the country groups. In Sales impact and Research
systems, the performance difference is relatively small, compared
to the average difference between the Innovation Leaders and the
Strong Innovators across all dimensions. Between the Strong and
Moderate Innovators, performance differences are relatively small for
Finance and support and Employment impact. Between the Moderate
and Modest Innovators, performance differences are relatively small
for Intellectual assets, Innovation-friendly environment, Employment
impact, and Sales impact. Performance differences between the
Innovation Leaders and Strong Innovators are relatively high for Finance
and support. Performance differences between the Strong Innovators
and Moderate Innovators are relatively high for Research systems and
Linkages. Performance differences between the Moderate Innovators
and Modest Innovators are relatively high for Finance and support and
Research systems.
The country rankings in Human resources and Attractive research systems
come close to the overall classification of performance groups. This also
holds, although to a lesser extent, for Finance and support, Innovators and
Linkages. The dimensions Innovation-friendly environment and Sales impact
deviate most from the overall classification. The dimensions Employment
impacts, Intellectual assets and Firm investments also deviate from the
overall classification, but to a lesser extent. These deviations demonstrate
that countries can perform well in particular dimensions, while their overall
performance is lower, resulting in being a member of a lower innovation
performance group. Analogously, a Leading Innovator can perform poorly
in particular dimensions, but compensate such relative weaknesses with
stronger performance in other dimensions.
0 20 40 60 80 100 120 140 160 180
HUMAN RESOURCES
ATTRACTIVE RESEARCH SYSTEMS
INNOVATION-FRIENDLY ENVIRONMENT
FINANCE AND SUPPORT
FIRM INVESTMENTS
INNOVATORS
LINKAGES
INTELLECTUAL ASSETS
EMPLOYMENT IMPACT
SALES IMPACT
INNOVATION LEADERS STRONG INNOVATORS
MODERATE INNOVATORS MODEST INNOVATORS
Figure 11: Performance groups: innovation performance per dimension
Average scores for each performance group equal the unweighted average of the relative-to-EU scores of the Member States within that group. As these
unweighted averages do not take into account differences in country size, results are not directly comparable. Average scores for the performance groups have
been adjusted such that their average equals 100 for each dimension.

21European Innovation Scoreboard 2017
Performance in Human resources reflects (well) the overall classification
into four performance groups. The Innovation Leaders are the best
performing countries taking four of the top-5 positions, with only
Germany performing less well. Except for Belgium, all Strong Innovators
perform above the EU average. Most of the Moderate Innovators
perform below the EU average, with only Spain and Lithuania performing
above the EU average. The Modest Innovators perform least well, with
Romania being the worst performer but Bulgaria performing better than
two Moderate Innovators.
For all countries except Portugal, performance has improved between
2010 and 2016. The highest rate of performance increase is for
Denmark (60.0%), followed by Slovenia (59.7%), Austria (41.1%),
Bulgaria (38.1%), and Greece (34.85). For Portugal, performance has
decreased by almost 9 percentage points. The EU average increased by
21.0% between 2010 and 2016.
Human resources
Coloured columns show Member States’ performance in 2016, using the most recent data for the indicators in this dimension, relative to that of the EU in 2010.
The horizontal hyphens show performance in 2015, using the next most recent data for the indicators in this dimension, relative to that of the EU in 2010.
Grey columns show performance in 2010 relative to that of the EU in 2010.
Attractive research systems
Coloured columns show Member States’ performance in 2016, using the most recent data for the indicators in this dimension, relative to that of the EU in 2010.
The horizontal hyphens show performance in 2015, using the next most recent data for the indicators in this dimension, relative to that of the EU in 2010.
Grey columns show performance in 2010 relative to that of the EU in 2010.
0
50
100
150
200
250
RO MT HU BG IT PL HR EL LV CZ SK EE PT CY BE EU DE LT ES AT LU FR IE NL SI UK FI SE DK
0
50
100
150
200
250
BG RO PL LT LV HR SK HU CZ MT EE ES IT EL SI DE EU PT CY FR IE FI AT BE UK SE NL DK LU
Performance in Attractive research systems also reflects (well) the overall
classification into four performance groups with Innovation Leaders
taking four of the top-5 positions. However, the overall best performer
is Luxembourg, one of the Strong Innovators. Germany, one of the
Innovation Leaders, performs below the EU average. All Strong Innovators
perform above the EU average, except for Slovenia. Most of the Moderate
Innovators perform below the EU average, where only Cyprus and Portugal
perform above the EU average. The Modest Innovators perform least well,
taking the last two positions in the performance ranking.
For all countries except Lithuania, performance has improved between
2010 and 2016. The highest rate of performance increase is for
Luxembourg (54.0%), followed by Cyprus (48.6%), Sweden (43.7%),
Denmark (43.4%), and Finland (43.3%). For Lithuania performance has
decreased by almost 2 percentage points. The EU average increased by
11.8% between 2010 and 2016.

22 European Innovation Scoreboard 2017
Performance in Finance and support reflects to some extent the overall
classification into four performance groups with four Innovation Leaders
in the top-5 positions, but the second best performer is Estonia, one
of the Moderate Innovators. Three out of the six Strong Innovators
perform above the EU average: France, Austria, and Belgium. Most of the
Moderate Innovators perform below the EU average, except for Estonia
and Lithuania. Bulgaria and Romania, both Modest Innovators, close the
ranking at the bottom.
The highest rate of performance increase between 2010 and 2016 is
observed in Slovakia (57.9%), followed by Lithuania (48.0%), and Estonia
(47.1%). Other strong improvements are observed in Latvia and Greece.
Ireland has had the highest rate of decrease in performance (-53.6%).
Ten countries show a rate of decrease in performance of more than
30%. The EU average decreased by 16.3% between 2010 and 2016.
Innovation-friendly environment
Coloured columns show Member States’ performance in 2016, using the most recent data for the indicators in this dimension, relative to that of the EU in 2010.
The horizontal hyphens show performance in 2015, using the next most recent data for the indicators in this dimension, relative to that of the EU in 2010.
Grey columns show performance in 2010 relative to that of the EU in 2010.
Finance and support
Coloured columns show Member States’ performance in 2016, using the most recent data for the indicators in this dimension, relative to that of the EU in 2010.
The horizontal hyphens show performance in 2015, using the next most recent data for the indicators in this dimension, relative to that of the EU in 2010.
Grey columns show performance in 2010 relative to that of the EU in 2010.
0
50
100
150
200
250
EL HR CY BG SK IT PL RO HU CZ UK DE MT AT IE EE EU SI FR ES BE LT PT LV NL LU FI SE DK
0
50
100
150
200
BG RO MT SI HU CY EL IT HR PL IE ES LU SK LV CZ PT EU BE UK AT FR LT DE DK NL SE EE FI
Performance in Innovation-friendly environment does not reflect the
overall classification for all countries. Four out of six Innovation Leaders
are in the top-5 positions, but Germany and the UK are performing below
the EU average. The Strong Innovators are even more dispersed, with
Luxembourg in the top-5, Slovenia, France, and Belgium above the EU
average, and Austria and Ireland below. The Moderate Innovators show
a strong performance on this dimension, in particular Latvia, Portugal,
Lithuania, and Spain.
The highest rate of performance increase between 2010 and 2016 is
observed in Portugal (50.3%), followed by Finland (41.0%) and Poland
(38.9%). Other strong improvements are observed in Sweden, Latvia,
Spain, Lithuania, Germany, and Ireland. Austria has had the highest
rate of decrease in performance (-50.7%), other strong decreases are
observed in Slovenia and Belgium. The EU average increased by 14.3%
between 2010 and 2016.

23European Innovation Scoreboard 2017
Firm investments
Coloured columns show Member States’ performance in 2016, using the most recent data for the indicators in this dimension, relative to that of the EU in 2010.
The horizontal hyphens show performance in 2015, using the next most recent data for the indicators in this dimension, relative to that of the EU in 2010.
Grey columns show performance in 2010 relative to that of the EU in 2010.
Innovators
Coloured columns show Member States’ performance in 2016, using the most recent data for the indicators in this dimension, relative to that of the EU in 2010.
The horizontal hyphens show performance in 2015, using the next most recent data for the indicators in this dimension, relative to that of the EU in 2010.
Grey columns show performance in 2010 relative to that of the EU in 2010.
0
50
100
150
200
RO LV CY BG IT EL MT SK EE ES NL LU PL PT HU LT FR HR IE EU CZ UK DK SI FI BE AT SE DE
0
50
100
150
200
RO PL BG LV HU EE SK ES HR MT CZ SI LT EU UK CY IT DK PT EL FR SE NL FI AT LU DE BE IE
Performance in Firm investments reflects to some extent the overall
classification into four performance groups with three Innovation
Leaders in the top-5. The Innovation Leaders and Strong Innovators,
except for the Netherlands, are the best performing countries for the
Firm investments dimension. The Czech Republic, a Moderate Innovator,
is amongst the top-10 countries in terms of performance. Germany is
the overall leader, Sweden ranks second and Austria third. Luxembourg,
France, and Ireland, all Strong Innovators, perform below the EU average.
The highest rate of performance increase between 2010 and 2016
is observed in Lithuania (51.3%), followed by Germany (34.0%) and
Austria (32.7%). Other strong improvements are observed in Belgium,
the UK, and Sweden. The EU average increased by 13.6% between
2010 and 2016, for 12 Member States performance decreased, most
notably Cyprus (-87.4%), Romania (-52.5%), Estonia (-38.8%), and
Finland (-38.7%). Other strong decreases are observed in Malta, Latvia,
and Ireland.
Performance in the Innovators dimension reflects to some extent the
overall classification into four performance groups. Innovation Leaders
and Strong Innovators, except for Slovenia, are the best performing
countries. Ireland is the overall leader, and Belgium ranks second; both
countries are Strong Innovators. Germany, an Innovation Leader, ranks
third. There are four Moderate Innovators that perform above the EU
average on this indicator: Greece, Portugal, Italy, and Cyprus.
The highest rate of performance increase between 2010 and 2016 is
observed in Lithuania (36.4%), followed by the Netherlands (34.0%)
and the UK (24.8%). For 19 EU Member States, performance decreased,
most notably in Estonia (-87.6%), Cyprus (-49.2%), Germany (-44.6%),
and Romania (-38.5%). Other strong decreases are observed in the
Czech Republic, Spain, Portugal, Denmark, and Poland. The EU average
decreased by 14.5% between 2010 and 2016.

24 European Innovation Scoreboard 2017
Performance in the Intellectual assets dimension reflects the overall
classification into four performance groups less well with only two
Innovation Leaders in the top-5 positions. Luxembourg, a Strong
Innovator, is the best performing country in Intellectual assets, followed
by Malta, a Moderate Innovator. Denmark ranks third and Austria fourth.
Most of the Innovation Leaders, except the UK, are amongst the leading
countries in this dimension. Bulgaria, a Modest Innovator, performs just
below the EU average. Strong Innovators Ireland, France, and Belgium all
perform below the EU average.
The highest rate of performance increase between 2010 and 2016 is
observed in Malta (83.8%), followed by Bulgaria (48.5%) and Cyprus
(39.6%). Other high increases over time are observed for Luxembourg,
Estonia, and Poland. For 21 Member States performance increased
between 2010 and 2016. The EU average has increased by 0.4%.
Strong decreases are observed in Latvia (-16.3%), Germany (-13.7%),
and Ireland (-11.6%).
Linkages
Coloured columns show Member States’ performance in 2016, using the most recent data for the indicators in this dimension, relative to that of the EU in 2010.
The horizontal hyphens show performance in 2015, using the next most recent data for the indicators in this dimension, relative to that of the EU in 2010.
Grey columns show performance in 2010 relative to that of the EU in 2010.
Intellectual assets
Coloured columns show Member States’ performance in 2016, using the most recent data for the indicators in this dimension, relative to that of the EU in 2010.
The horizontal hyphens show performance in 2015, using the next most recent data for the indicators in this dimension, relative to that of the EU in 2010.
Grey columns show performance in 2010 relative to that of the EU in 2010.
0
50
100
150
200
BG MT PL RO PT LV CY IT LU HR ES EE HU SK CZ IE EL FR EU SI LT DK SE FI UK DE AT NL BE
0
50
100
150
200
RO SK HR EL HU LV LT CZ IE PT PL ES FR BE UK SI EE BG EU IT CY NL DE FI SE AT DK MT LU
Performance in the dimension Linkages reflects to some extent the overall
classification into four performance groups. The Innovation Leaders are
represented amongst the top group of countries, together with Strong
Innovator countries such as Belgium, which is the overall leader in
this dimension, Austria and Slovenia. On the other hand, Luxembourg,
also a Strong Innovator, performs well below the EU average. Ireland
and France also perform below the EU average. Moderate Innovator
Lithuania shows a strong performance above the EU average.
The highest rate of performance increase between 2010 and 2016
is observed in Austria (16.0%), followed by Slovakia (11.3%), and
Lithuania (8.7%). For 20 EU Member States, performance decreased,
most notably in Estonia (-51.3%), Cyprus (-40.9%), Denmark (-37.9%),
and Finland (-37.4%). Other strong decreases are observed in Croatia,
Hungary, and Luxembourg. The EU average decreased by 4.7% between
2010 and 2016.

25European Innovation Scoreboard 2017
Employment impacts
Coloured columns show Member States’ performance in 2016, using the most recent data for the indicators in this dimension, relative to that of the EU in 2010.
The horizontal hyphens show performance in 2015, using the next most recent data for the indicators in this dimension, relative to that of the EU in 2010.
Grey columns show performance in 2010 relative to that of the EU in 2010.
Sales impacts
Coloured columns show Member States’ performance in 2016, using the most recent data for the indicators in this dimension, relative to that of the EU in 2010.
The horizontal hyphens show performance in 2015, using the next most recent data for the indicators in this dimension, relative to that of the EU in 2010.
Grey columns show performance in 2010 relative to that of the EU in 2010.
0
50
100
150
200
RO CY HR LT PT EE EL IT ES SI BE AT FI LV PL FR CZ BG EU DE DK SK HU NL SE LU UK MT IE
0
50
100
150
200
HR BG LT PT LV MT EL PL RO CY EE FI IT SI BE DK AT ES SE NL LU CZ HU EU SK FR DE IE UK
Performance in Employment impacts reflects the overall classification
into four performance groups less well with only two Innovation Leaders
in the top-5 positions. Ireland, a Strong Innovator, is the best performing
country in the Employment impacts dimension, followed by Malta,
a Moderate Innovator, and the United Kingdom ranks third. Most of the
Innovation Leaders, except Finland, are amongst the leading countries in
this dimension and perform above the EU average. Bulgaria, a Modest
Innovator, shows a strong performance just below the EU average.
Innovation Leader Finland and Strong Innovators Slovenia, Belgium,
Austria, and France all perform below the EU average.
The highest rate of performance increase between 2010 and 2016
is observed in Malta (31.6%), followed by Latvia (29.1%), and Croatia
(27.3%). Other strong increases over time are observed for Estonia,
Portugal, Ireland, and Romania. For 18 EU Member States, performance
increased between 2010 and 2016. The EU average has increased by
0.1%. Strong decreases are observed in Denmark (-29.0%), Germany
(-20.8%), and the Czech Republic (-20.3%).
Performance in Sales impacts reflects the overall classification of
performance groups less well. Just two out of six Innovation Leaders are
in the top-5 positions, Finland, Sweden, and the Netherlands perform
below the EU average.16 The Strong Innovators are also dispersed:
Ireland and France are amongst the top-5, whereas Slovenia, Belgium,
Austria, and Luxembourg perform below the EU average.
The highest rate of performance increase between 2010 and 2016 is
observed in the UK (37.8%), followed by Ireland (21.3%), and Slovakia
(13.9%). Other strong improvements are observed in the Netherlands,
Estonia, and France. Greece has had the highest rate of decrease in
performance (-39.0%), other high decreases are observed in Cyprus, Malta,
and Croatia. The EU average increased by 2.9% between 2010 and 2016.
16 Compared to the other dimensions, the EU’s rank position is relatively high in this dimension. This can be explained by the strong performance of France, Germany and the United Kingdom,
which are among the biggest Member States, and which have a strong positive impact on the EU average in Sales impacts.

26 European Innovation Scoreboard 2017
5. Benchmarking innovation performance with non-EU countries
5.1 Benchmarking against other European countries and regional neighbours
As discussed in the Introduction, the measurement framework has been
revised, and results in this year’s report are not comparable to those in
last year’s report.17
Switzerland is the overall Innovation Leader in Europe, outperforming
all EU Member States (Figure 12). Switzerland’s strong performance
is linked to being the best performer on as many as ten indicators,
in particular in Attractive research systems, where it has the best
performance on all three indicators, Human resources, where it has
best performance on two indicators (‘New doctorate graduates’ and
‘Lifelong learning’) and Innovators, where it has best performance on
two indicators (‘SMEs with marketing or organisational innovations’ and
‘SMEs innovating in-house’). Switzerland’s performance relative to the
EU in 2010 has improved strongly by almost 11%-points.
Iceland, Israel, and Norway are Strong Innovators. Iceland’s performance
relative to the EU in 2010 has remained stable. The performance of
Norway relative to EU in 2010 has increased strongly18, whereas the
relative performance of Israel has declined. Serbia and Turkey are
Moderate Innovators, and for both countries performance relative
to the EU has increased strongly. The Former Yugoslav Republic of
Macedonia and Ukraine are Modest Innovators, where performance
relative to the EU has increased strongly for the first but decreased
for the latter.
Figure 12: Performance of European and neighbouring countries’ systems of innovation
Coloured columns show countries’ performance in 2016, using the most recent data for 27 indicators, relative to that of the EU in 2010. The horizontal hyphens
show performance in 2015, using the next most recent data for 27 indicators, relative to that of the EU in 2010. Grey columns show countries’ performance in
2010 relative to that of the EU in 2010. For all years the same measurement methodology has been used. The dashed lines show the threshold values between
the performance groups in 2016, comparing countries’ performance in 2016 relative to that of the EU in 2016. Scores relative to EU 2016 used for determining
group membership are shown in Annex F.
Non-EU countries include: Iceland (IS), Israel (IL), the Former Yugoslav Republic of Macedonia (MK), Norway (NO), Serbia (RS), Switzerland (CH), Turkey (TR) and
Ukraine (UA).
0
20
40
60
80
100
120
140
160
180
UA RO MK BG HR PL LV TR RS HU EL SK CY IT MT ES LT EE PT CZ SI EU FR IL IE NO BE LU AT IS DE UK NL FI DK SE CH
MODEST INNOVATORS MODERATE INNOVATORS STRONG INNOVATORS INNOVATION LEADERS 2010 2015
17 Average data availability for this year’s report is good with data available for 27 indicators for Norway, 25 indicators for the Former Yugoslav Republic of Macedonia and Switzerland, 24 for
Turkey, 23 indicators for Serbia, 22 indicators for Iceland, 20 indicators for Israel, and 19 indicators for Ukraine. Data availability for both Israel and Ukraine is below the threshold of 75%,
which has been used in previous years to decide whether or not to include a European country in the EIS. In the interest of continuity, both countries are included in the EIS 2017.
18 For Norway, the sharp increase in 2016 is almost entirely due to a change in the collection of CIS data. The average percentage increase over the last year for the indicators using
CIS data is 125%, for the other indicators it is 0.5%. The strong increase in the results for the six indicators using CIS data is caused by the fact that CIS 2014 data were collected in
a separate innovation survey whereas CIS data up until the CIS 2012 were collected in a combined innovation and R&D survey. More details are available in the EIS 2017 Methodology
Report.

27European Innovation Scoreboard 2017
5.2 Benchmarking against global competitors
This section provides a comparison of the EU to some of its main global
economic competitors including Australia, the BRICS countries (Brazil,
Russia, India, China, and South Africa), Canada, Japan, South Korea and
the United States.
South Korea and Japan have an increasing performance lead over the EU
(Figure 13 and Figure 14), Australia has a stable performance lead over
the EU, and Canada and the United States have a decreasing performance
lead over the EU. The EU has a decreasing performance lead over Brazil,
China, India, Russia, and South Africa. (Annex H includes the most recent
data used and the changes over time).
Methodology
The economic and population size of most global competitors outweighs
that of many of the individual Member States, and innovation performance
is therefore compared to the aggregate of the Member States, i.e. the EU.
Data availability is more limited for global competitors than for the European
countries. Therefore, a more restricted set of 16 indicators (Table 2) has been
used for the international comparison of the EU with its global competitors.
(Annex H includes the most recent data used and the changes over time).
The most significant improvement compared to last year is the availability of
non-EU data for several of the indicators using innovation survey data. These
data were extracted from the OECD, which collected a set of harmonised
innovation survey statistics in 2013 and 2015. Data are available for
‘Product and/or process innovators’, ‘Marketing and/or organisational
innovators’ and ‘Innovators that co-operate’, and complemented with more
recent data from different National Statistical Offices.
For some indicators, different definitions have been used as compared to
the previous chapters:
• For ‘Trademark applications’, comparable data on resident and non-
resident applications have been used from the World Development
Indicators;
• For ‘Design applications’, comparable data on resident and non-
resident applications have been used from the World Development
Indicators;
• For ‘Medium and high tech product exports’ and ‘Knowledge-
intensive services exports’, the data for the EU exclude trade
between Member States (so-called intra-EU trade) and only include
exports to non-Member States (so-called extra-EU trade). Indicator
values in the international comparison using only extra-EU trade
are higher for the EU compared to those used for the EU in the
comparison between Member States;
• For ‘Knowledge-intensive services exports’, data have been used
from the UN Comtrade database using an older EBOPS classification.
Aggregate results for the EU are not comparable to those used in
the European benchmarking analysis.
For each of the international competitors, the following pages very briefly
discuss the performance of their innovation system compared to the EU
and relative strengths and weaknesses for the different indicators. For each
country, a table with structural data is included comparable to those for
the European and neighbouring countries in Chapter 7. For the international
comparison, these tables also include data on the number of so-called
unicorns, i.e. start-ups with a value of more than $1 billion. The countries
are ordered following their performance rank order (cf. Figure 13).
Data have been extracted from various sources including Eurostat,
OECD (MSTI, Education at a Glance), different UN data sources including
UNESCO Institute for Statistics, United Nations (Comtrade) and UNIDO,
Web of Science, World Bank (World Development Indicators) and National
Statistical Offices of the countries included in this international comparison.
Figure 14: Change in global performance
Change in performance is measured as the difference between the performance
in 2016 relative to the EU in 2010 and the performance in 2010 relative to the
EU in 2010.
Figure 13: Global performance
Bars show countries’ performance in 2016 relative to that of the EU in 2010.
44.2
50.2
52.6
58.7
80.0
101.8
102.3
111.5
114.6
123.1
130.7
0 25 50 75 100 125 150
India
South Africa
Russia
Brazil
China
EU
United States
Japan
Australia
Canada
South Korea
-4.1
-0.4
1.8
1.8
2.2
2.3
3.9
5.5
5.9
8.0
13.9
-12 -8 -4 0 4 8 12 16 20
Canada
United States
Australia
EU
South Africa
India
Brazil
Russia
Japan
South Korea
China

28 European Innovation Scoreboard 2017
Table 2: Indicators used in the international comparison
Data source Year
FRAMEWORK CONDITIONS
Human resources
1.1.1 New doctorate graduates (per 1000 population aged 25-34) OECD 2014
1.1.2 Population aged 25-64 having completed tertiary education OECD 2015
Attractive research systems
1.2.1 International scientific co-publications (per million population) Web of Science* 2016
1.2.2 Scientific publications among the top 10% most cited publications worldwide (share of total scientific
publications of the country)
Web of Science* 2014
Innovation-friendly environment - No indicator included in international comparison
INVESTMENTS
Finance and support
2.1.1 R&D expenditure in the public sector (percentage of GDP) OECD 2015
Firm investments
2.2.1 R&D expenditure in the business sector (percentage of GDP) OECD 2015
INNOVATION ACTIVITIES
Innovators
3.1.1 SMEs introducing product or process innovations (%-share) OECD 2014
3.1.2 SMEs introducing marketing or organisational innovations (%-share) OECD 2014
Linkages
3.2.1 Innovative SMEs collaborating with others (%-share) OECD 2014
3.2.2 Public-private co-publications (per million population) Web of Science* 2015
3.2.3 Private co-funding of public R&D expenditures (percentage of GDP) OECD 2015
Intellectual assets
3.3.1 PCT patent applications (per billion GDP) Patents: OECD
GDP: World Bank
2013
3.3.2 Trademark applications (per billion GDP) World Bank 2015
3.3.3 Design applications (per billion GDP) World Bank 2015
IMPACTS
Employment impacts - No indicator included in international comparison
Sales effects
4.2.1 Medium and high tech product exports (share of total product exports) United Nations 2016
4.2.2 Knowledge-intensive services exports (share of total service exports) United Nations 2015
* Data provided by CWTS (Leiden University) as part of a contract to the European Commission (DG Research and Innovation)

29European Innovation Scoreboard 2017
The performance of South Korea is well
above that of the EU, and the country is an
Innovation Leader. Performance has increased
since 2010. South Korea’s relative strengths
are in Business R&D expenditures and IP
applications. Performance increase has been highest in Marketing and
organisational innovators.
Performance in 2010 and 2016
South Korea 2010Rel. to EU
2016Rel. to EU 2010-16
Doctorate graduates 68.6 87.1 18.5
Tertiary education (25-64 year olds) 143.8 141.1 -2.7
International co-publications 104.3 105.9 1.6
Most cited publications 63.1 62.2 -0.9
R&D expenditure public sector 114.2 126.5 12.3
R&D expenditure business sector 213.0 241.8 28.8
Product/process innovators 102.6 95.5 -7.1
Marketing/organisational innovators 39.8 88.0 48.2
Innovation collaboration 102.5 19.6 -82.9
Public-private co-publications 143.5 139.8 -3.8
Private co-funding public R&D exp. 107.9 117.2 9.3
PCT patent applications 132.3 168.4 36.0
Trademark applications 284.0 276.7 -7.3
Design applications 219.6 222.9 3.3
Medium & high tech product exports 121.3 121.6 0.2
Knowledge-intensive services exports 96.8 102.6 5.8
Best three and worst three indicators highlighted.
Structural differences
The relative size of South Korea’s manufacturing sector is twice that of
the EU. Top R&D spending enterprises spend almost twice as much on
R&D as top EU enterprises.
KR EUStructure of the economy
Share of employment in Agriculture, avg 2011-15 5.9 4.8
Share of employment in Industry, avg 2011-15 24.7 24.5
Share of employment in Services, avg 2011-15 69.4 70.7
Share of manufacturing in total value added, 2015 29.0 14.1
Business indicators
Top R&D spending firms per 10 mln population, 2011-15 13.0 29.9
- average R&D spending, mln Euros, 2011-15 311.7 165.8
Number of Unicorns (May 2017) 3 19
Buyer sophistication 1-7 (best), 2013-14 4.1 3.6
Ease of starting a business, Doing Business 2017 84.1 76.5
Socio-demographic indicators
GDP per capita, PPP (current int. $), avg 2011-2015 33,000 36,500
Change in GDP between 2010 and 2015, % 15.7 5.3
Population size, avg 2011-2015, millions 50.2 506.7
Change in population between 2010 and 2015, % 2.4 1.0
Share of population aged 15-64, avg 2011-2015 72.9 66.0
0
20
40
60
80
100
120
140
160
2010 2011 2012 2013 2014 2015 2016
Relative to EU in 2010 Relative to EU in 2016
123 126 126 122 124 127 131
128
Columns show performance scores relative to EU in 2010. The red triangle shows performance relative to EU 2016.
The performance of Canada is well above
that of the EU, and the country is an Innovation
Leader. Performance has decreased since
2010. Canada’s relative strengths are
in Tertiary education, International co-
publications, and Trademark applications. Performance increase has
been highest in R&D expenditures in the business sector.
Performance in 2010 and 2016
Canada 2010Rel. to EU
2016Rel. to EU 2010-16
Doctorate graduates 79.2 77.7 -1.6
Tertiary education (25-64 year olds) 184.1 171.1 -13.0
International co-publications 191.4 181.7 -9.6
Most cited publications 114.5 114.0 -0.4
R&D expenditure public sector 128.2 114.2 -14.0
R&D expenditure business sector 118.8 143.3 24.5
Product/process innovators 163.6 170.5 6.9
Marketing/organisational innovators 156.0 160.5 4.5
Innovation collaboration n/a n/a n/a
Public-private co-publications 128.0 86.4 -41.6
Private co-funding public R&D exp. 129.6 97.8 -31.8
PCT patent applications 81.8 83.7 1.9
Trademark applications 202.5 201.2 -1.3
Design applications 65.6 70.7 5.1
Medium & high tech product exports 59.0 65.7 6.7
Knowledge-intensive services exports 107.5 101.6 -5.8
Best three and worst three indicators highlighted.
Structural differences
Notable differences are a lower employment share in industry and
a higher employment share in services.
CA EUStructure of the economy
Share of employment in Agriculture, avg 2011-15 1.7 4.8
Share of employment in Industry, avg 2011-15 20.2 24.5
Share of employment in Services, avg 2011-15 78.0 70.7
Share of manufacturing in total value added, 2015 9.7 14.1
Business indicators
Top R&D spending firms per 10 mln population, 2011-15 6.3 29.9
- average R&D spending, mln Euros, 2011-15 174.5 165.8
Number of Unicorns (May 2017) 1 19
Buyer sophistication 1-7 (best), 2013-14 4.3 3.6
Ease of starting a business, Doing Business 2017 78.6 76.5
Socio-demographic indicators
GDP per capita, PPP (current int. $), avg 2011-2015 43,400 36,500
Change in GDP between 2010 and 2015, % 11.3 5.3
Population size, avg 2011-2015, millions 35.1 506.7
Change in population between 2010 and 2015, % 5.4 1.0
Share of population aged 15-64, avg 2011-2015 68.6 66.0
0
20
40
60
80
100
120
140
160
2010 2011 2012 2013 2014 2015 2016
Relative to EU in 2010 Relative to EU in 2016
127 126 127 127 123 123 123
121
Columns show performance scores relative to EU in 2010. The red triangle shows performance relative to EU 2016.

30 European Innovation Scoreboard 2017
The performance of Australia is above that of
the EU, and the country is a Strong Innovator.
Performance has increased since 2010.
Australia’s strengths are in International co-
publications, Product and process innovation,
and Trademark applications. Performance increase has been highest in
Enterprises with innovative activities.
Performance in 2010 and 2016
Australia2010
Rel. to EU
2016
Rel. to EU 2010-16
Doctorate graduates 116.3 126.0 9.7
Tertiary education (25-64 year olds) 137.2 133.0 -4.2
International co-publications 201.1 181.7 -19.4
Most cited publications 114.7 118.1 3.4
R&D expenditure public sector 117.3 119.5 2.3
R&D expenditure business sector 124.4 97.2 -27.2
Product/process innovators 154.2 179.3 25.0
Marketing/organisational innovators 126.2 141.8 15.6
Innovation collaboration 116.4 120.1 3.7
Public-private co-publications 96.3 88.2 -8.1
Private co-funding public R&D exp. 115.9 103.2 -12.7
PCT patent applications 86.0 78.7 -7.3
Trademark applications 252.2 242.4 -9.8
Design applications 88.0 93.0 5.0
Medium & high tech product exports 15.4 16.5 1.1
Knowledge-intensive services exports 28.4 32.7 4.3
Best three and worst three indicators highlighted.
Structural differences
Australia has a relatively small manufacturing sector. Australia has
experienced faster GDP growth and much faster population growth.
AU EUStructure of the economy
Share of employment in Agriculture, avg 2011-15 2.7 4.8
Share of employment in Industry, avg 2011-15 20.4 24.5
Share of employment in Services, avg 2011-15 76.9 70.7
Share of manufacturing in total value added, 2015 6.1 14.1
Business indicators
Top R&D spending firms per 10 mln population, 2011-15 6.2 29.9
- average R&D spending, mln Euros, 2011-15 205.1 165.8
Number of Unicorns (May 2017) -- 19
Buyer sophistication 1-7 (best), 2013-14 3.7 3.6
Ease of starting a business, Doing Business 2017 80.3 76.5
Socio-demographic indicators
GDP per capita, PPP (current int. $), avg 2011-2015 44,500 36,500
Change in GDP between 2010 and 2015, % 13.9 5.3
Population size, avg 2011-2015, millions 23.1 506.7
Change in population between 2010 and 2015, % 8.0 1.0
Share of population aged 15-64, avg 2011-2015 66.8 66.0
0
20
40
60
80
100
120
140
160
2010 2011 2012 2013 2014 2015 2016
Relative to EU in 2010 Relative to EU in 2016
113 114 114 113 112 114 115
113
Columns show performance scores relative to EU in 2010. The red triangle shows performance relative to EU 2016.
The performance of Japan is above that of
the EU, and the country is a Strong Innovator.
Performance has increased since 2010.
Japan’s relative strengths are in Business
R&D expenditures, Innovation collaboration,
and IP applications. Performance increase has been highest in Innovation
collaboration and Trademark applications.
Performance in 2010 and 2016
Japan2010
Rel. to EU
2016
Rel. to EU 2010-16
Doctorate graduates 67.2 64.1 -3.1
Tertiary education (25-64 year olds) 162.8 153.7 -9.1
International co-publications 86.4 80.8 -5.6
Most cited publications 63.9 58.5 -5.4
R&D expenditure public sector 109.3 101.1 -8.2
R&D expenditure business sector 246.1 227.6 -18.6
Product/process innovators 75.3 79.4 4.1
Marketing/organisational innovators 94.0 98.7 4.7
Innovation collaboration 94.0 151.0 57.0
Public-private co-publications 145.4 131.5 -13.8
Private co-funding public R&D exp. 27.0 35.1 8.1
PCT patent applications 149.8 168.4 18.6
Trademark applications 92.0 137.0 45.0
Design applications 97.9 89.2 -8.7
Medium & high tech product exports 121.2 121.0 -0.2
Knowledge-intensive services exports 119.7 114.8 -4.9
Best three and worst three indicators highlighted.
Structural differences
Japan’s top R&D spending firms spend almost 70% more on R&D as
compared to EU top R&D spending firms. The structure of the economy is
comparable to that of the EU.
JP EUStructure of the economy
Share of employment in Agriculture, avg 2011-15 4.3 4.8
Share of employment in Industry, avg 2011-15 25.4 24.5
Share of employment in Services, avg 2011-15 70.3 70.7
Share of manufacturing in total value added, 2015 18.8 14.1
Business indicators
Top R&D spending firms per 10 mln population, 2011-15 27.5 29.9
- average R&D spending, mln Euros, 2011-15 277.3 165.8
Number of Unicorns (May 2017) 1 19
Buyer sophistication 1-7 (best), 2013-14 5.3 3.6
Ease of starting a business, Doing Business 2017 75.5 76.5
Socio-demographic indicators
GDP per capita, PPP (current int. $), avg 2011-2015 38,400 36,500
Change in GDP between 2010 and 2015, % 5.0 5.3
Population size, avg 2011-2015, millions 127.4 506.7
Change in population between 2010 and 2015, % -0.9 1.0
Share of population aged 15-64, avg 2011-2015 62.0 66.0
0
20
40
60
80
100
120
140
160
2010 2011 2012 2013 2014 2015 2016
Relative to EU in 2010 Relative to EU in 2016
106 105 106 106 107 107 111
109
Columns show performance scores relative to EU in 2010. The red triangle shows performance relative to EU 2016.

31European Innovation Scoreboard 2017
The performance of the United States is
above that of the EU, and the country is
a Strong Innovator. Performance has decreased
since 2010. Relative strengths are in R&D
expenditures and scientific collaboration with
the public sector. Performance increase has been highest in Product and
process innovations and Design applications.
Performance in 2010 and 2016
United States2010
Rel. to EU
2016
Rel. to EU 2010-16
Doctorate graduates 91.5 83.6 -7.9
Tertiary education (25-64 year olds) 153.3 138.4 -14.9
International co-publications 129.0 127.2 -1.8
Most cited publications 140.1 132.1 -8.0
R&D expenditure public sector 105.6 97.6 -8.0
R&D expenditure business sector 178.7 158.1 -20.6
Product/process innovators 65.2 71.8 6.6
Marketing/organisational innovators n/a n/a n/a
Innovation collaboration n/a n/a n/a
Public-private co-publications 178.7 181.6 2.9
Private co-funding public R&D exp. 46.2 42.1 -4.1
PCT patent applications 101.9 106.4 4.5
Trademark applications 55.1 58.9 3.8
Design applications 48.5 54.9 6.4
Medium & high tech product exports 86.1 83.9 -2.2
Knowledge-intensive services exports 100.2 106.1 5.9
Best three and worst three indicators highlighted.
Structural differences
The US economy has grown twice as fast as the EU. Top R&D spending
firms spend about 76% more on R&D. The US has lower respectively
higher employment shares in industry and services.
US EUStructure of the economy
Share of employment in Agriculture, avg 2011-15 1.6 4.8
Share of employment in Industry, avg 2011-15 18.3 24.5
Share of employment in Services, avg 2011-15 80.1 70.7
Share of manufacturing in total value added, 2015 11.8 14.1
Business indicators
Top R&D spending firms per 10 mln population, 2011-15 22.9 29.9
- average R&D spending, mln Euros, 2011-15 292.6 165.8
Number of Unicorns (May 2017) 102 19
Buyer sophistication 1-7 (best), 2013-14 4.5 3.6
Ease of starting a business, Doing Business 2017 82.5 76.5
Socio-demographic indicators
GDP per capita, PPP (current int. $), avg 2011-2015 52,900 36,500
Change in GDP between 2010 and 2015, % 10.9 5.3
Population size, avg 2011-2015, millions 316.5 506.7
Change in population between 2010 and 2015, % 3.9 1.0
Share of population aged 15-64, avg 2011-2015 66.8 66.0
0
20
40
60
80
100
120
140
160
2010 2011 2012 2013 2014 2015 2016
Relative to EU in 2010 Relative to EU in 2016
103 104 105 105 105 105 102
101
Columns show performance scores relative to EU in 2010. The red triangle shows performance relative to EU 2016.
The performance of China is below that of the
EU, and the country is a Moderate Innovator.
Performance has increased since 2010.
Relative strengths are in R&D expenditures
and Trademark and Design applications.
Performance increase has also been highest in these business
activities.
Performance in 2010 and 2016
China2010
Rel. to EU
2016
Rel. to EU 2010-16
Doctorate graduates 12.9 11.0 -1.9
Tertiary education (25-64 year olds) 27.1 35.8 8.6
International co-publications 38.1 43.4 5.3
Most cited publications 59.0 76.5 17.5
R&D expenditure public sector 64.0 68.8 4.8
R&D expenditure business sector 96.6 129.2 32.6
Product/process innovators n/a n/a n/a
Marketing/organisational innovators n/a n/a n/a
Innovation collaboration n/a n/a n/a
Public-private co-publications 7.8 18.6 10.8
Private co-funding public R&D exp. 123.1 113.1 -10.0
PCT patent applications 46.4 72.2 25.8
Trademark applications 165.5 279.7 114.2
Design applications 203.7 197.3 -6.3
Medium & high tech product exports 95.4 91.0 -4.4
Knowledge-intensive services exports 88.6 67.7 -20.9
Best three and worst three indicators highlighted.
Structural differences
Agriculture accounts for almost one-third of employment. The relative
size of the manufacturing sector is more than twice that of the EU.
China has experienced much faster GDP growth.
CN EUStructure of the economy
Share of employment in Agriculture, avg 2011-15 31.5 4.8
Share of employment in Industry, avg 2011-15 29.8 24.5
Share of employment in Services, avg 2011-15 38.7 70.7
Share of manufacturing in total value added, 2015 32.8 14.1
Business indicators
Top R&D spending firms per 10 mln population, 2011-15 1.4 29.9
- average R&D spending, mln Euros, 2011-15 139.6 165.8
Number of Unicorns (May 2017) 46 19
Buyer sophistication 1-7 (best), 2013-14 4.3 3.6
Ease of starting a business, Doing Business 2017 64.3 76.5
Socio-demographic indicators
GDP per capita, PPP (current int. $), avg 2011-2015 12,400 36,500
Change in GDP between 2010 and 2015, % 46.0 5.3
Population size, avg 2011-2015, millions 1357.5 506.7
Change in population between 2010 and 2015, % 2.5 1.0
Share of population aged 15-64, avg 2011-2015 73.9 66.0
0
20
40
60
80
100
120
140
160
2010 2011 2012 2013 2014 2015 2016
Relative to EU in 2010 Relative to EU in 2016
66 72 76 79 77 78 80
79
Columns show performance scores relative to EU in 2010. The red triangle shows performance relative to EU 2016.

32 European Innovation Scoreboard 2017
The performance of Brazil is below that of the
EU, and the country is a Moderate Innovator.
Performance has increased since 2010.
Brazil’s relative strengths are in innovation
activities and Exports of knowledge-intensive
services. Performance increase has been highest in Marketing and
organisational innovators.
Performance in 2010 and 2016
Brazil2010
Rel. to EU
2016
Rel. to EU 2010-16
Doctorate graduates 23.6 24.5 0.9
Tertiary education (25-64 year olds) 64.0 41.6 -22.4
International co-publications 45.2 51.4 6.2
Most cited publications 44.4 48.5 4.1
R&D expenditure public sector 82.1 90.4 8.3
R&D expenditure business sector 45.6 42.5 -3.2
Product/process innovators 107.6 113.7 6.1
Marketing/organisational innovators 168.4 188.6 20.1
Innovation collaboration 48.6 48.4 -0.2
Public-private co-publications 5.4 4.9 -0.4
Private co-funding public R&D exp. n/a n/a n/a
PCT patent applications 27.6 26.8 -0.8
Trademark applications 97.7 102.0 4.3
Design applications 52.1 50.6 -1.5
Medium & high tech product exports 40.6 43.7 3.0
Knowledge-intensive services exports 103.6 113.8 10.2
Best three and worst three indicators highlighted.
Structural differences
Brazil has a relatively high share of employment in agriculture. Top R&D
spending enterprises spend more on R&D, the result of relatively large
enterprises in Oil, Mining and Aerospace.
BR EUStructure of the economy
Share of employment in Agriculture, avg 2011-15 12.3 4.8
Share of employment in Industry, avg 2011-15 20.6 24.5
Share of employment in Services, avg 2011-15 67.2 70.7
Share of manufacturing in total value added, 2015 12.2 14.1
Business indicators
Top R&D spending firms per 10 mln population, 2011-15 0.4 29.9
- average R&D spending, mln Euros, 2011-15 260.4 165.8
Number of Unicorns (May 2017) -- 19
Buyer sophistication 1-7 (best), 2013-14 3.5 3.6
Ease of starting a business, Doing Business 2017 56.5 76.5
Socio-demographic indicators
GDP per capita, PPP (current int. $), avg 2011-2015 15,500 36,500
Change in GDP between 2010 and 2015, % 5.5 5.3
Population size, avg 2011-2015, millions 204.2 506.7
Change in population between 2010 and 2015, % 4.6 1.0
Share of population aged 15-64, avg 2011-2015 68.7 66.0
0
20
40
60
80
100
120
140
160
2010 2011 2012 2013 2014 2015 2016
Relative to EU in 2010 Relative to EU in 2016
55 55 56 56 56 58 59
58
Columns show performance scores relative to EU in 2010. The red triangle shows performance relative to EU 2016.
The performance of Russia is below that
of the EU, and the country is a Moderate
Innovator. Performance has increased since
2010. Russia’s relative strengths are in
Tertiary education, Private co-funding of
public R&D, where performance increase has also been highest, and
Trademark applications.
Performance in 2010 and 2016
Russia2010
Rel. to EU
2016
Rel. to EU 2010-16
Doctorate graduates 93.1 76.3 -16.8
Tertiary education (25-64 year olds) 199.4 165.9 -33.5
International co-publications 53.8 53.3 -0.5
Most cited publications 29.3 33.3 4.0
R&D expenditure public sector 63.1 66.0 2.9
R&D expenditure business sector 59.5 57.8 -1.7
Product/process innovators 11.2 15.3 4.1
Marketing/organisational innovators 6.0 6.9 0.9
Innovation collaboration 6.1 9.0 2.9
Public-private co-publications 6.2 3.1 -3.1
Private co-funding public R&D exp. 114.7 139.7 25.1
PCT patent applications 29.5 32.7 3.3
Trademark applications 145.3 125.8 -19.5
Design applications 50.0 47.7 -2.3
Medium & high tech product exports 14.2 21.2 6.9
Knowledge-intensive services exports 86.7 94.3 7.6
Best three and worst three indicators highlighted.
Structural differences
Top R&D spending enterprises spend more on R&D, the result of relatively
large enterprises in Oil and gas, and Defence. Russia’s economy has
grown at about the same rate as the EU.
RU EUStructure of the economy
Share of employment in Agriculture, avg 2011-15 7.1 4.8
Share of employment in Industry, avg 2011-15 27.5 24.5
Share of employment in Services, avg 2011-15 65.4 70.7
Share of manufacturing in total value added, 2015 13.1 14.1
Business indicators
Top R&D spending firms per 10 mln population, 2011-15 0.3 29.9
- average R&D spending, mln Euros, 2011-15 211.2 165.8
Number of Unicorns (May 2017) -- 19
Buyer sophistication 1-7 (best), 2013-14 3.7 3.6
Ease of starting a business, Doing Business 2017 73.2 76.5
Socio-demographic indicators
GDP per capita, PPP (current int. $), avg 2011-2015 24,600 36,500
Change in GDP between 2010 and 2015, % 6.0 5.3
Population size, avg 2011-2015, millions 143.5 506.7
Change in population between 2010 and 2015, % 0.9 1.0
Share of population aged 15-64, avg 2011-2015 70.9 66.0
0
20
40
60
80
100
120
140
160
2010 2011 2012 2013 2014 2015 2016
Relative to EU in 2010 Relative to EU in 2016
47 49 42 46 42 48
53
52
Columns show performance scores relative to EU in 2010. The red triangle shows performance relative to EU 2016.

33European Innovation Scoreboard 2017
The performance of South Africa is below
that of the EU, and the country is a Modest
Innovator. Performance has increased since
2010. Relative strengths are in innovation
activities. Performance increase has been
highest in Marketing and organisational innovators.
Performance in 2010 and 2016
South Africa2010
Rel. to EU
2016
Rel. to EU 2010-16
Doctorate graduates 8.4 10.7 2.3
Tertiary education (25-64 year olds) 23.7 45.3 21.6
International co-publications 61.1 68.0 6.9
Most cited publications 74.6 67.9 -6.7
R&D expenditure public sector 51.8 55.7 3.9
R&D expenditure business sector 45.5 28.2 -17.3
Product/process innovators n/a n/a n/a
Marketing/organisational innovators 144.0 164.8 20.9
Innovation collaboration 155.6 154.9 -0.7
Public-private co-publications 8.7 4.7 -4.0
Private co-funding public R&D exp. 57.6 56.7 -0.9
PCT patent applications 48.2 39.2 -8.9
Trademark applications 103.1 104.7 1.6
Design applications 67.8 60.5 -7.3
Medium & high tech product exports 53.5 56.4 2.9
Knowledge-intensive services exports 22.6 21.8 -0.7
Best three and worst three indicators highlighted.
Structural differences
The structure of South Africa’s economy as measured by employment
shares is comparable to that of the EU. GDP and population have been
growing at faster rates than the EU.
SA EUStructure of the economy
Share of employment in Agriculture, avg 2011-15 5.1 4.8
Share of employment in Industry, avg 2011-15 24.8 24.5
Share of employment in Services, avg 2011-15 70.1 70.7
Share of manufacturing in total value added, 2015 12.5 14.1
Business indicators
Top R&D spending firms per 10 mln population, 2011-15 0.3 29.9
- average R&D spending, mln Euros, 2011-15 73.2 165.8
Number of Unicorns (May 2017) 1 19
Buyer sophistication 1-7 (best), 2013-14 4.0 3.6
Ease of starting a business, Doing Business 2017 65.2 76.5
Socio-demographic indicators
GDP per capita, PPP (current int. $), avg 2011-2015 12,800 36,500
Change in GDP between 2010 and 2015, % 11.2 5.3
Population size, avg 2011-2015, millions 53.3 506.7
Change in population between 2010 and 2015, % 7.9 1.0
Share of population aged 15-64, avg 2011-2015 65.0 66.0
0
20
40
60
80
100
120
140
160
2010 2011 2012 2013 2014 2015 2016
Relative to EU in 2010 Relative to EU in 2016
48 42 46 46 49 48 50
49
Columns show performance scores relative to EU in 2010. The red triangle shows performance relative to EU 2016.
The performance of India is below that of
the EU, and the country is a Modest Innovator.
Performance has increased since 2010.
Relative strengths are in Marketing and
organisational innovators, where the increase
of performance has also been highest, and Exports of knowledge-
intensive services.
Performance in 2010 and 2016
India2010
Rel. to EU
2016
Rel. to EU 2010-16
Doctorate graduates 6.8 5.9 -0.9
Tertiary education (25-64 year olds) 36.5 30.4 -6.1
International co-publications 18.7 19.8 1.2
Most cited publications 58.5 60.8 2.4
R&D expenditure public sector 82.5 76.1 -6.4
R&D expenditure business sector 21.4 23.8 2.4
Product/process innovators 50.8 57.8 7.0
Marketing/organisational innovators 121.8 139.5 17.7
Innovation collaboration n/a n/a n/a
Public-private co-publications 1.9 2.1 0.3
Private co-funding public R&D exp. n/a n/a n/a
PCT patent applications 32.9 32.1 -0.8
Trademark applications 66.5 74.5 7.9
Design applications 41.0 41.8 0.7
Medium & high tech product exports 42.1 48.5 6.4
Knowledge-intensive services exports 120.1 122.9 2.8
Best three and worst three indicators highlighted.
Structural differences
India has a very high share of employment in agriculture. GDP and
population have been growing at faster rates than the EU.
IN EUStructure of the economy
Share of employment in Agriculture, avg 2011-15 51.1 4.8
Share of employment in Industry, avg 2011-15 22.4 24.5
Share of employment in Services, avg 2011-15 26.6 70.7
Share of manufacturing in total value added, 2015 12.7 14.1
Business indicators
Top R&D spending firms per 10 mln population, 2011-15 0.2 29.9
- average R&D spending, mln Euros, 2011-15 134.9 165.8
Number of Unicorns (May 2017) 9 19
Buyer sophistication 1-7 (best), 2013-14 3.8 3.6
Ease of starting a business, Doing Business 2017 55.3 76.5
Socio-demographic indicators
GDP per capita, PPP (current int. $), avg 2011-2015 5,300 36,500
Change in GDP between 2010 and 2015, % 38.6 5.3
Population size, avg 2011-2015, millions 1279.4 506.7
Change in population between 2010 and 2015, % 6.5 1.0
Share of population aged 15-64, avg 2011-2015 65.0 66.0
0
20
40
60
80
100
120
140
2010 2011 2012 2013 2014 2015 2016
Relative to EU in 2010 Relative to EU in 2016
42 42 41 42 43 44 44
43
Columns show performance scores relative to EU in 2010. The red triangle shows performance relative to EU 2016.

34 European Innovation Scoreboard 2017
6. Expected short-term changes in EU innovation performance
This year’s report includes, for the second time, a forward-looking analysis
of EU innovation performance discussing more recent developments,
trends, and expected changes. The aim is to cover the need for more
recent information, since available statistical data for the indicators
used for constructing the innovation index are, on average, two to three
years old. This year’s analysis will be more restricted than that in the
EIS 2016, as for the six indicators using Community Innovation Survey
(CIS) data, the most recent CIS 2014 data have been included in the
main benchmarking exercise and ‘fast track’ CIS 2016 data will not be
available until 2018 (cf. Section 6.3).
Figure 15: Expected EU innovation performance
100 100 99 100 99 101
102 103
104
90
95
100
105
110
2010 2011 2012 2013 2014 2015 2016 2017 2018
Summary Innovation Index relative to 2010 Nowcast
In summary, the analysis suggests that EU innovation performance
will continue to increase for the majority of indicators, leading to an
increase in EU innovation performance from 102 this year to
104 in two years’ time (Figure 15). Of the expected 2 percentage
point increase, more than half is the result of an expected increase of
‘Broadband penetration’ by more than 10%19.
Table 3 shows a summary of the results for those 19 indicators for
which the calculation of relatively reliable short-term changes proved
possible. EU innovation performance is expected to increase strongly
by at least five percent for five indicators, to increase more moderately
between one and five percent for seven indicators, to remain stable for
one indicator, and to decrease moderately for six indicators.
Section 6.1 first discusses the accuracy of last year’s predictions. Section
6.2 discusses trend performance of the EU compared to four of its main
international competitors. Section 6.3 explores EU trend performance
for individual indicators, and Section 6.4 provides details on some of
the methodologies used for estimating short-term changes. Section 6.5
discusses the possible use of Big data for providing more timely and
policy-relevant innovation-related indicators.
19 Assuming that the expected performance on Broadband penetration did not change, the expected EU innovation performance would increase to 103.0 in two years’ time.

35European Innovation Scoreboard 2017
6.1 Looking back at last year’s estimates
The EIS 2016 report suggested – over a period of two years – an increase
in the EIS innovation index by about 2.5% and a strong increase of more
than 10% for four indicators, a more moderate increase between 1%
and 10% for 11 indicators, more or less the same performance for
two indicators, and a decrease for three indicators. For five indicators,
expected two-year changes could not be calculated.
At the time of writing in 2016, it was expected that the EIS 2017 would
discuss how accurate these forecasts have been. But with the revised
measurement framework introduced in the EIS 2017, a direct comparison
with last year’s innovation index is not possible, as several of the indicators
for which expected changed were provided in the EIS 2016 have been
either removed or revised. For 13 indicators included in both the EIS 2016
and EIS 2017 using the same definitions, Table 4 provides a comparison
of the predicted two-year change and the real one-year change achieved
since last year.20 For eight indicators, last year’s prediction turned out to be
good, for three indicators, it was fairly good, and for two indicators, it was
poor. For ‘New doctorate graduates’, the prediction was poor as this year’s
unchanged performance is well below last year’s estimate of an increase
by more than 10% in two years’ time. For ‘PCT patent applications’,
performance has declined, whereas no notable change was predicted.
Overall, the average accuracy of the expected changes is sufficiently high
to use the same methodology for most indicators in this year’s forward-
looking analysis.
Table 3: Changes in two years’ time in EU innovation performance
CURRENT
SCORE
EXPECTED CHANGE IN
TWO YEARS’ TIME
METHODOLOGY FOR ESTIMATING EXPECTED
CHANGE
Human resources
1.1.2 Population aged 25-34 with tertiary education 38.2 1-5% increase Linear regression
Attractive research systems
1.2.1 International scientific co-publications 493.6 >10% increase Linear regression
1.2.2 Most-cited scientific publications 10.6 1-5% increase Linear regression
1.2.3 Foreign doctorate students 25.6 1-5% increase Linear regression
Innovation-friendly environment
1.3.1 Broadband penetration 13.0 >10% increase Trend extrapolation
1.3.2 Opportunity-driven entrepreneurship 3.1 1-5% decrease Linear regression
Finance and support
2.1.2 Venture capital investment 0.063 1-5% decrease More recent data from Invest Europe
Firm investments
2.2.1 R&D expenditure in the business sector 1.30 1-5% decrease Survey on industrial R&D Investment Trends
2.2.2 Non-R&D innovation expenditures 0.76 5-10% increase Linear regression
2.3.3 Training ICT skills 22.0 5-10% increase Linear regression
Innovators
3.1.1 SMEs with product or process innovations 30.9 1-5% decrease Linear regression
3.1.2 SMEs with marketing or organisational innovations 34.9 1-5% decrease Linear regression
Linkages
3.2.1 Innovative SMEs collaborating with others 11.2 5-10% increase Linear regression
Intellectual assets
3.3.1 PCT patent applications 3.70 No notable change Econometric model using GDP and R&D
3.3.2 Trademark applications 7.60 1-5% increase Linear regression
3.3.3 Design applications 4.33 1-5% decrease Linear regression
Employment impact
4.1.1 Employment in knowledge-intensive activities 14.1 1-5% increase Linear regression
Sales impact
4.1.1 Medium and high tech product exports 56.2 1-5% increase Trend extrapolation
4.1.2 Knowledge-intensive services exports 69.3 1-5% increase Linear regression
20 For the following six indicators included in last year’s analysis, a comparison is not possible for the following reasons: for ‘Population aged 30-34 with tertiary education’, the definition this
year was changed to include a larger age group 25-34; the indicator Youth aged 20-24 with upper secondary education has been removed; for Non-EU doctorate students, the definition
this year covers all foreign students from other Member States and from outside the EU; for Venture capital investment, data is the same as last year; the indicator PCT patent applications
in societal challenges has been removed; for the indicator Trademark applications, the definition this year includes not only data from the European Union Intellectual Property Office but
also from the World Intellectual Property Office on trademark applications applied for under the Madrid Protocol; the indicator License and patent revenues from abroad has been removed
(i.e. it has been integrated in the revised indicator measuring Exports of knowledge-intensive services).

36 European Innovation Scoreboard 2017
6.2 EU trend performance compared to China, Japan, South Korea, and the United States
A statistical trend analysis using performance data for 2010 to 2016
shows that the EU performance gap towards Japan and South Korea
is expected to increase, that the gap towards the United States is
expected to decrease, and that the performance lead over China
is expected to decrease. Nowcasts for 2017 and 2018 have been
calculated for the EU, China, Japan, South Korea, and the United States,
using estimates based on nowcasting three-year averages. Details are
explained in Section 6.4.
Table 4: Accuracy of EIS 2016 predictions for short-term changes in EU innovation performance
EIS 2016
SCORE
EXPECTED CHANGE
IN TWO YEARS’ TIME
REVISED
SCORE FOR
EIS 2016
EIS 2017
SCORE
REALISED CHANGE
IN ONE-YEAR
ACCURACY
OF EIS 2016
PREDICTION
New doctorate graduates 1.84 >10% increase 1.85 1.85 No notable change Poor
International scientific co-publications 459.2 >10% increase 463.5 493.6 1-5% increase Good
Most-cited scientific publications 10.51 1-5% increase 10.51 10.56 No notable change Fairly good
R&D expenditure in the public sector 0.72 1-5% decrease 0.73 0.71 1-5% decrease Good
R&D expenditure in the business sector 1.30 1-5% increase 1.30 1.30 No notable change Fairly good
Non-R&D innovation expenditures 0.69 >10% increase 0.69 0.76 >10% increase Good
SMEs innovating in-house 28.7 No notable change 28.7 28.8 No notable change Good
Innovative SMEs collaborating with others 10.3 5-10% increase 10.3 11.2 5-10% increase Good
PCT patent applications 3.53 No notable change 3.80 3.70 1-5% decrease Poor
SMEs introducing product or process innovations 30.6 1-5% increase 30.6 30.9 1-5% increase Good
SMEs introducing marketing or organisational
innovations36.2 1-5% decrease 36.2 34.9 1-5% decrease Good
Employment in knowledge-intensive activities 13.9 1-5% increase 14.0 14. No notable change Fairly good
Sales of new-to-market and new-to-firm innovations 12.4 5-10% increase 12.3 13.4 5-10% increase Good
131.6 133.3
60
80
100
120
140
160
60
80
100
120
140
160
2010 2011 2012 2013 2014 2015 2016 2017 2018
South Korea
Relative to EU in 2010 Relative to EU in same year
112.2 113.7
2010 2011 2012 2013 2014 2015 2016 2017 2018
Japan
Relative to EU in 2010 Relative to EU in same year
103.0 102.6
2010 2011 2012 2013 2014 2015 2016 2017 2018
United States
Relative to EU in 2010 Relative to EU in same year
80.6 83.9
60
80
100
120
140
160
60
80
100
120
140
160
2010 2011 2012 2013 2014 2015 2016 2017 2018
China
Relative to EU in 2010 Relative to EU in same year
Figure 16: Expected short-term changes in innovation performance for EU’s main competitors

37European Innovation Scoreboard 2017
For South Korea, the trend analysis foresees an increase in the
relative-to-EU performance from 131.6 this year to 133.3 in two years’
time, leading to a further increase of South Korea’s lead over the EU
(Figure 16). For Japan, the trend analysis foresees an increase of
the relative-to-EU performance from 112.2 this year to 113.7 in two
years’ time, leading to a further increase of Japan’s lead over the EU.
For the United States, the trend analysis foresees a decrease of the
relative-to-EU performance from 103.0 this year to 102.6 in two years’
time. Following this decrease, the EU gap to the US is expected to close
within two years, but only if the assumption of further declining US
performance holds true. For China, the trend analysis foresees a strong
increase of the relative-to-EU performance from 80.6 this year to 83.9
in two years’ time. Due to this strong increase, the lead of the EU over
China is expected to decrease further.
6.3 Short-term changes in EU innovation performance by indicator
This section discusses expected short-term changes for 19 indicators.
For 13 of these indicators, changes have been calculated applying
a simple linear regression using time series data (see Section 6.4 for
more details). For the other indicators, a mix of techniques has been
used, which will be discussed in this section.
Human resources
For ‘New doctorate graduates’, the EIS 2016 used more recent data on
doctoral students to forecast the development for doctorate graduates.
This methodology will not be used in the EIS 2017, as last year’s
forecasts were of poor accuracy (cf. Section 6.1). The results using
a linear regression are also of insufficient quality, and no short-term
changes have been calculated, assuming that the indicator will have the
same value in two years’ time as the current value.
‘Population aged 25-34 having completed tertiary education’ has been
increasing every year between 2009 and 2016. Annual change has been
1 percentage point or more until 2012, whereas annual changes have
been below 1 percentage point since 2013. A simple linear regression
for the same period has been used to estimate an increase from 38.2 to
40.5 in two years’ time.
For ‘Lifelong learning’, the regression results using a linear regression
are of insufficient quality. The value of the indicator has been stable
between 10.7 and 10.8 between 2013 and 201621. With no reliable
expected change and a stable development in the past, it is assumed
that the indicator will be at the same level in two years’ time.
Attractive research systems
‘International scientific co-publications’ has shown a steady increase
between 2009 and 2016. A simple linear regression for the same period
has been used to estimate an increase from 493.6 to 544.8 in two
years’ time.
The share of ‘Most-cited scientific publications’ has been increasing
consistently between 2008 and 2015. A simple linear regression for
2008-2015 has been used to estimate an increase from 10.56 to 10.67
in two years’ time.
The share of ‘Foreign doctorate students’ has been increasing for most
years except for a one-time decrease between 2012 and 2013. A simple
linear regression for 2008-2015 has been used to estimate an increase
from 25.6 to 26.2 in two years’ time.
Innovation-friendly environment
For ‘Broadband penetration’, data are available for three years only. As
the number of observations is too small for a linear regression, a simple
trend extrapolation has been used instead. The indicator’s score was 9.0
in 2014, 11.0 in 2015 and 13.0 in 2016, and it is assumed that this 2
percentage point annual increase will continue, resulting in an expected
score of 17.0 in two years’ time.
‘Opportunity-driven entrepreneurship’ has shown a consistent decrease
between 2009 and 2015, followed by an increase in 2016. A simple
linear regression for the same period would suggest an estimated
decrease from 3.14 to 2.87 in two years’ time. However, this expected
decrease is in contrast with the observed real increase between 2015 and
2016. The strongest decrease was between 2009 and 2012, followed
by a more modest decrease between 2012 and 2015. Restricting the
regression analysis to this latter period would result in a more modest
expected decrease to 3.06 in two years’ time.
Finance and support
The EIS 2016 used data from government budget plans of six
Member States22 to estimate a 0.01 percentage point decrease in
two-year’s time for ‘R&D expenditure in the public sector’. Although
the methodology used last year turned out to give relatively accurate
results, with a real decrease from 0.73 in 2014 to 0.71 in 2015, this
methodology is not applied in the EIS 2017, as it uses budget data of
only a few Member States from the two most innovative performance
groups. Linear regression results are of insufficient quality, and it has
therefore been assumed that the indicator will hold its value in two
years’ time.
For ‘Venture capital investments’, 2016 results were published by
Invest Europe after the cut-off day of 25 April 2017 for collecting EIS
data23. For all European countries24, venture capital expenditures will
increase by 1.2% in 2016. Assuming the same percentage increase
for 2017 and combining this with a real GDP increase of 0.7% in 2016
and an expected GDP increase of 1.8% in 2017, results in an expected
value of the indicator of 0.062 in two years’ time. For the EIS, which
uses a three-year average for this indicator, this suggests an expected
21 For Lifelong learning, there was a break in series in 2013, resulting in an upward shi� of the indicator from 9.2 in 2012 to 107 in 2013. Before the break, the indicator had declined from
9.3 in 2009 to 9.2 in 2012. A�er the break, the indicator has increased from 10.7 in 2013 to 10.8 in 2016.
22 Austria, France, Germany, Italy, Netherlands and United Kingdom.
23 Invest Europe, 2016 European Private Equity Activity: Statistics on Fundraising, Investments & Divestments, 15 May 2017.
24 Including EU Member States, but also Bosnia-Herzegovina, the Former Yugoslav Republic of Macedonia, Montenegro, Norway, Serbia, Switzerland and Ukraine.

38 European Innovation Scoreboard 2017
three-year average of 0.062, a small decline compared to the current
three-year average of 0.063.
Firm investments
For ‘R&D expenditures in the business sector as a percentage of GDP’,
last year’s methodology has been used to estimate short-term changes.
The 2016 EU Survey on R&D Investment Business Trends25 shows that
larger EU companies expect their R&D expenditures in the EU to increase,
on average, by 0.5% for 2016-2017. Nominal GDP has increased by
0.7% in 2016 and is expected to increase by 1.8% in 201726. The EU’s
business R&D intensity is therefore expected to decrease from 1.30 in
2015 to 1.28 in 2017 or two years’ time.
The indicator ‘Non-R&D innovation expenditures’ uses data from the CIS.
In the EIS 2016, provisional CIS 2014 data, made available by National
Statistics Offices as part of a ‘fast-track’ approach27, were used, but
provisional CIS 2016 data are not yet available. Linear regression results
for the full period are of insufficient quality, which seems to be the result
of differences in performance behaviour after 2009 compared to the
period before 2009. Between 2009 (CIS 2008 data) and 2011 (CIS
2010 data), performance declined from 0.70 to 0.57, but since 2011,
performance has been increasing at a steady rate from 0.57 in 2011
(CIS 2010 data) to 0.69 in 2013 (CIS 2012 data) to 0.76 in 2015 (CIS
2014) data. Extrapolating this more recent data using a linear regression
for these years only results in an expected increase in two years’ time
from 0.76 to 0.81.
For ‘Enterprises providing training to develop or upgrade ICT skills of
their personnel’, data are available for 2012 and from 2014 onwards,
showing an increase from 19.0 in 2012 to 22.0 in 2015. A linear
regression over this period results in a further increase from 22.0 to
23.8 in two years’ time.
Innovators
All three indicators in this dimension use data from the CIS, and for the
same reasons as for ‘Non-R&D innovation expenditures’, provisional CIS
2016 data are not yet available to repeat the forecasting exercise of
last year. However, for two of these indicators, linear regressions provide
good estimates. For ‘SMEs with product and/or process innovations’,
performance has been decreasing since 2009 (CIS 2010). A linear
regression for the full period has been used to estimate a further
decrease from 30.9 to 30.2 in two years’ time.
For ‘SMEs with marketing and/or organisational innovations’, performance
has been decreasing since 2009 (CIS 2010). A linear regression for the
full period has been used to estimate a further decrease from 34.9 to
33.5 in two years’ time.
For ‘SMEs innovating in-house’, the regression results using a linear
regression are of insufficient quality, and it is assumed that the indicator
will be at the same level in two years’ time.
Linkages
The indicator ‘Innovative SMEs collaborating with others’ uses data
from the CIS, and for the same reasons as for ‘Non-R&D innovation
expenditures’, provisional CIS 2016 data are not yet available to repeat
the forecasting exercise of last year. Linear regression results for the
full period are of insufficient quality, which seems to be the result of
different performance behaviour up to and after 2009. Between 2009
(CIS 2008 data) and 2011 (CIS 2010 data), performance declined
from 11.2 to 8.9, but since 2011, performance has been increasing at
a steady rate from 8.9 in 2011 (CIS 2010 data) to 10.3 in 2013 (CIS
2012 data) to 11.2 in 2015 (CIS 2014) data. Extrapolating this more
recent data using a linear regression for these years only results in an
expected increase in two years’ time from 11.2 to 11.8.
For ‘Public-private co-publications’, a period of increasing performance
until 2011 was followed by a period of decreasing performance.
Regression results using a linear regression are of insufficient quality,
and it is assumed that the indicator will be at the same level in two
years’ time.
‘Private co-funding of public R&D expenditures’ has remained at a stable
level of about 0.052 for the period 2009-2015. Regression results using
a linear regression are of insufficient quality, and it is assumed that the
indicator will be at the same level in two years’ time.
Intellectual assets
A working paper by Eurostat28 discusses several options for nowcasting
patent data, including six econometric models using data on GDP,
R&D expenditures, researchers, and human resources in science and
technology. Three of these models have been explored29, of which the
model assuming a linear logarithmic dependence with GDP and R&D
expenditures performs best. ‘PCT patent applications per billion GDP’ are
expected to further decrease from 3.70 to 3.68 in two years’ time.
25 This survey is carried out by the Industrial Research and Innovation (IRI) action of the European Commission’s Joint Research Centre (JRC), Institute for Prospective Technological Studies
(IPTS). Survey results are available at http://iri.jrc.ec.europa.eu/survey.html
26 EU Winter 2017 Economic Forecast: https://ec.europa.eu/info/business-economy-euro/economic-performance-and-forecasts/economic-forecasts/winter-2017-economic-forecast_en
27 The Community Innovation Survey (CIS) is a survey of innovation activity in enterprises. Each CIS covers a three-year period. The CIS 2012, the most recent CIS available in the EIS
2016, covered the three-year period from the beginning of 2010 to the end of 2012, and the CIS 2014, the most recent CIS available in the EIS 2017, covered the three-year period
from the beginning of 2012 to the end of 2014. According to Commission Regulation No 995/2012, national CIS statistics must be delivered to Eurostat within 18 months of the end
of the reference year, i.e. June in even-numbered years (e.g., June 2016 for the CIS 2014). Data are then checked and corrected for detected inconsistencies by Eurostat. Final CIS data
are then made available by Eurostat in October or November of the year following the reference year. For the EIS 2016, final CIS 2014 were not available, but following a request from
Eurostat to share provisional CIS 2014 data for the indicators used in the EIS, such data were received from 18 Member States and two other European countries. There provisional data
were then used to calculate estimates of expected CIS 2014 aggregate data for the EU. The EIS 2017 uses final CIS 2014 data, but provisional CIS 2016 data will not be available until
2018 as these data are currently being collected.
28 Eurostat, Patent Statistics – Working Paper: Methods for Nowcasting Patent Data, Final version, 21 December 2010.
29 The first model assumes that the number of patent applications is linearly dependent on GDP and R&D expenditures, the second model assumes a linear logarithmic dependence
between the same variables, and the third model assumes a linear dependence on R&D expenditures only. The estimates for the first two models are almost identical, but the second
model performs better in predicting the decline in the indicator in 2014.

39European Innovation Scoreboard 2017
‘Trademark applications per billion GDP’ have been increasing between
2010 and 2016 by almost 0.8 percentage points. A linear regression
estimates a further increase from 7.60 to 7.86 in two years’ time.
‘Design applications per billion GDP’ have been decreasing between
2010 and 2016 by about 0.3 percentage points. A linear regression
estimates a further decrease from 4.33 to 4.31 in two years’ time.
Employment impacts
Between 2008 and 2015, the ‘Employment share in knowledge-
intensive activities’ has increased by over 0.1%-points a year. A linear
regression for 2008-2015 has been used to estimate an increase from
14.1 to 14.3 in two years’ time.
For ‘Employment in fast-growing enterprises of innovative sectors’, data
are only available for three years. The number of observations is too
small for a linear regression, and the indicator’s score was 5.0 in 2014,
5.3 in 2015, and 4.8 in 2016. There is no clear trend in this three-year
period, and it is assumed that the indicator will be at the same level in
two years’ time.
Sales impacts
For ‘Medium and high-tech products exports’, the regression results
using a linear regression are of insufficient quality. The value of the
indicator fluctuated around 54.0 between 2008 and 2013, followed by
an increase of 1.2 percentage points in 2014 and 1.8 percentage points
in 2015. Extrapolating the increases in 2014 and 2015 would result in
an estimated increase to 58.0 in two years’ time.
For ‘Knowledge-intensive services exports’, data are available from
2010 onwards. Between 2010 and 2015, the indicator has increased
from 67.0 to 69.3, and a linear regression suggests a further increase to
70.1 in two years’ time.
‘Sales share due to new-to-market or new-to-firm product innovations’
uses data from the CIS, and for the same reasons as for ‘Non-R&D
innovation expenditures’, provisional CIS 2016 data are not yet available
to repeat the forecasting exercise of last year. Linear regression results
for the full period are of insufficient quality, which seems to be the result
of a fluctuating performance behaviour with an increase in 2009 (CIS
2010) and 2011 (CIS 2010) followed by a decrease in 2013 (CIS 2012)
followed by an increase in 2015 (CIS 2014). There is no clear trend in
this period, and it is assumed that the indicator will be at the same level
in two years’ time.
6.4 Methodology section
6.4.1 Nowcasting the innovation index for the EU and
some of its major competitors
Nowcasts for 2017 and 2018 have been calculated using the following
methodology30:
• Step 1: Using the innovation index scores for 2009-2016, three-
year averages have been calculated for 2010-2015; e.g., the three-
year average for 2010 is the unweighted average of the innovation
indexes for 2009-2011.
• Step 2: A linear regression has been estimated on the 2010-2015
three-year averages.
• Step 3: Using the intercept and the slope of the linear regression,
estimates for three-year averages have been calculated for
2009-2018.
• Step 4: Adjusted estimates for the three-year averages for 2016-
2018 have been calculated, correcting the estimates in Step 3 by
adjusting for the difference in 2015 between the three-year average
calculated in Step 1 and the estimate calculated in Step 3.
• Step 5: An estimate has been calculated for the innovation index in
2017 by taking the difference between the estimates, as calculated
in Step 4, for the three-year averages in 2016 and 2017 and the
innovation index score in 2016. Similarly, estimates have been
calculated for the innovation index in 2018.
• Step 6: Scores relative to the EU have been calculated by dividing
the estimates for the respective country by those for the EU and
multiplying by 100, either using the EU score in 2010 or that in 2016.
6.4.2 Using linear regression for estimating short-term
changes for individual indicators
For 13 indicators discussed in section 6.2, the coefficients of the slope
have been used to estimate results for the EU one (T+1) and two years
(T+2) from now by adding the slope to the last known value. Table 5
shows the regression results for these indicators.
30 This methodology has proven to correctly estimate innovation index scores for 2010-2015. For the EU, the estimated innovation index scores for 2010-2015 are on average 0.3% below
the real scores. For the US, estimates are on average the same as real scores, for Japan, estimates are on average 0.1% above real scores, for South Korea, estimates are on average
0.2% below real scores, and for China, estimates are on average 0.3% below real scores.

40 European Innovation Scoreboard 2017
Table 5: Nowcasts for ten indicators using linear regressions
SLOPE ADJUSTED R2CURRENT
SCORE
EXPECTED SCORE
IN TWO YEARS
1.1.2 Population aged 30-34 with tertiary education 0.876 0.9750 38.2 40.5
1.2.1 International scientific co-publications 25.6 0.9977 493.6 544.8
1.2.2 Most-cited scientific publications 0.057 0.8660 10.6 10.7
1.2.3 Foreign doctorate students 0.324 0.6261 25.6 26.2
1.3.2 Opportunity-driven entrepreneurship -0.036 0.5178 3.1 2.9
2.2.3 Non-R&D innovation expenditures 0.046 0.9586 0.76 0.81
2.3.3 Training ICT skills 0.900 0.8007 22.0 23.8
3.1.1 SMEs with product or process innovations -0.670 .07,488 30.9 30.2
3.1.2 SMEs with marketing or organisational innovations -1.362 0.7414 34.9 33.5
3.3.2 Trademark applications 0.129 0.8251 7.60 7.86
3.3.3 Design applications -0.038 0.6315 4.33 4.25
4.1.1 Employment in knowledge-intensive activities 0.095 0.9526 14.1 14.3
4.1.2 Knowledge-intensive services exports 0.285 0.6840 69.3 69.9
6.5 Big data as a statistical source for innovation indicators
Big data are perceived to be a possible source for providing more timely
and policy-relevant innovation-related indicators. However, it will not
be possible in the short run to include any indicators using Big data in
the main EIS measurement framework. So far, almost all initiatives to
develop new indicators using Big data are limited to ad-hoc studies for
individual countries leading to results which suffer from clear limitations
to be compared over time and across countries.
As with other indicators that have been developed in the past (e.g.,
R&D statistics relying on the guidelines in the Frascati Manual and
innovation survey statistics relying on the guidelines in the Oslo Manual),
a harmonised approach by National Statistical Offices will be needed in
the longer run to develop indicators that are directly comparable across
countries and that will be made available timely and regularly over time.
An expert workshop was held in February 2017 gathering expert views
and opinions on the possible use of Big data in the EIS. The workshop
presentations included several interesting examples where Big data
already provides information on innovation, but the information (or data)
is limited to local, regional or at best country-level statistics.
Results from one study showed that a web search on R&D-related
keywords identified many more enterprises with R&D activities than
revealed in official R&D statistics. This result could suggest that in
official statistics R&D activities are underreported. Official statistics
could use this information to expand their list of known enterprises with
R&D activities to better target when sending out R&D or innovation
survey questionnaires. A study on the internet economy showed
that using Big data can identify enterprises with activities related to
a particular economic sector outside that sector. Similar studies might be
able to identify innovative enterprises in economic sectors not perceived
as being innovative and which are not included among the mandatory
economic sectors covered in the Community Innovation Survey.
The workshop revealed that some indicators could be constructed using Big
data, but a lack of a harmonised approach with consistent methodologies
(‘codebooks’) so far impedes the construction of indicators which are
comparable across countries. For reports like the EIS, which need to cover
all 28 EU Member States, indicators based on Big data could only be
used if data were available for a sufficient number of countries. Ensuring
a large coverage of countries requires an organisation coordinating efforts.
Beyond the construction of new indicators, Big data could also be used
to provide Nowcasts for some of the traditional innovation indicators
by exploiting more recent information, e.g. data available on websites.
However, it is not clear if indicators based on Big data would relate to
(or correlate with) indicators using official data, and without evidence of
significant and stable relations, Big data results should not be used for
Nowcasting official statistics. Instead, the use of Big data seems much
more promising in enriching existing statistics by offering more detailed
analyses. For instance, one of the indicators used in the EIS captures
the share of new doctorate graduates without distinguishing between
quality and career prospects of these graduates. Big data could be used
to find such additional and more qualitative information, which could be
very useful for policy-makers.
Methodologies of Big data analytics for the construction of indicators
are still in development and are facing many quality concerns, but
this should not stop their further development. Other now commonly
accepted statistics faced similar concerns in the past (e.g. Community
Innovation Survey data and Bibliometric data), and more experiments
are needed so that one can learn from ‘failures’ to make methodologies
more robust. This will facilitate the acceptance of Big data statistics by
practitioners (including academics) and policy-makers.
A number of ongoing and forthcoming initiatives on Big data, including
pilot actions, are run by the European Commission. The results of those
will feed into the next edition of the European Innovation Scoreboard. In
addition, national and international developments around this dynamic
field will be closely monitored to fully exploit their potential for future
editions of the report. Adequate comparability and quality of the
underlying data and indicators will remain essential in this context.

41European Innovation Scoreboard 2017
7. Country profilesThis section provides individual profiles for the EU Member States and
eight other European and neighbouring countries (Iceland, Israel, Former
Yugoslav Republic of Macedonia, Norway, Serbia, Switzerland, Turkey
and Ukraine). Each profile includes the following information:
• A graph showing the development of the country’s innovation
index over time between 2010 and 2016 as compared to the EU
performance score in 2010 and relative performance to the EU in
2016 (the data are shown in Annex F);
• A table providing a comparison of the respective country’s innovation
performance in 2010 and 2016 by indicator and dimension relative
to that of the EU in 2010. Different colour codes highlight strengths
and weaknesses in 2016. The table also includes the performance
change between 2010 and 2016 using different font colours
showing whether performance has increased or decreased over
time31 (Annex B and Annex C show for each country and each
indicator respectively the most recent data and the performance
change over time);
• A table providing data for the contextual indicators which are used
as proxies for structural differences between countries. The EIS
2017 Methodology Report provides detailed definitions for these
indicators.
31 For those dimensions where data are missing for at least one indicator, relative scores for the dimension have been calculated compared to the EU dimension score using all indicators.
This can result in relative dimension scores which do not match the relative performance scores for the indicators belonging to that dimension as the dimension score for the country has
been calculated using data for less indicators than the dimension score for the EU. These potential cases are highlighted in the tables with an §.

42 European Innovation Scoreboard 2017
Belgium is a Strong Innovator. Over time,
performance has increased by 1.4% relative
to that of the EU in 2010.
Innovation system
Relative strengths of the innovation system are in Attractive research
systems, Linkages, and Firm investments. Relative weaknesses are in
Employment impacts, Sales impacts, and Intellectual assets.
Structural differences
Notable differences are a smaller share of Agriculture & Mining in total
employment, a larger share of Public administration in total employment,
a larger share of micro enterprises in turnover, a smaller share of foreign
controlled enterprises, a higher number of Top R&D spending enterprises
but a lower average R&D spending of these enterprises, a smaller share
of enterprise births, higher GDP per capita, a higher growth rate of
population, and higher population density.
BE EU
Structure of the economy
Composition of employment, average 2011-15
- Agriculture & Mining (NACE A-B) (%) 1.3 5.1
- Manufacturing (NACE C) (%) 13.2 15.6
of which High and Medium high-tech (%) 36.6 36.4
- Utilities and Construction (NACE D-F) (%) 8.6 8.6
- Services (NACE G-N) (%) 67.3 63.6
of which Knowledge-intensive services (%) 62.1 58.0
- Public administration, etc. (NACE O-U) (%) 9.5 7.1
Business indicators
Composition of turnover, average 2011-2014
- Micro enterprises (0-9 employees) (%) 24.3 17.3
- SMEs (10-249 employees) (%) 39.0 38.0
- Large enterprises (250+ employees) (%) 36.8 44.1
Share of foreign controlled enterprises, 2014 (%) 0.25 1.18
Top R&D spending enterprises
- average number per 10 mln population, 2011-15 44.2 29.9
- average R&D spending, mln Euros, 2011-15 69.7 165.8
Enterprise births (10+ empl.) (%), avg 2012-14 0.4 1.5
Buyer sophistication 1-7 (best), 2013-14 4.3 3.6
Ease of starting a business, Doing Business 2017 73.0 76.5
Socio-demographic indicators
GDP per capita, PPS, avg 2011-13 30,500 25,400
Change in GDP between 2010 and 2015, (%) 5.1 5.4
Population size, avg 2011-15 (millions) 11.1 505.5
Change in population between 2010 and 2015 (%) 3.7 1.1
Population aged 15-64, avg 2011-2015 (%) 65.4 66.1
Population density, average 2011-15 368.5 116.4
Degree of urbanisation, average 2011-15 (%) 86.6 74.4
Values in green show performance above 120% of EU, values in red show performance below 80% of EU.
120 119 119 118 118 118 121
119
0
20
40
60
80
100
120
140
160
180
2010 2011 2012 2013 2014 2015 2016
Relative to EU in 2010 Relative to EU in 2016
Belgium
Performance
relative to EU
2010 inChange
2010-
20162010 2016
SUMMARY INNOVATION INDEX 119.6 120.9 1.4
Human resources 110.9 121.4 10.5
New doctorate graduates 92.3 122.0 29.7
Population with tertiary education 169.1 172.4 3.3
Lifelong learning 65.3 61.1 -4.2
Attractive research systems 152.2 189.7 37.5
International scientific co-publications 323.9 467.4 143.5
Most cited publications 121.9 127.7 5.8
Foreign doctorate students 134.6 180.3 45.6
Innovation-friendly environment 157.5 136.5 -21.0
Broadband penetration 188.9 255.6 66.7
Opportunity-driven entrepreneurship 135.4 52.5 -82.8
Finance and support 124.1 84.9 -39.2
R&D expenditure in the public sector 91.1 92.9 1.8
Venture capital expenditures 165.7 74.9 -90.9
Firm investments 124.8 148.7 23.9
R&D expenditure in the business sector 110.3 149.8 39.5
Non-R&D innovation expenditures 77.4 75.4 -2.0
Enterprises providing ICT training 178.6 207.1 28.6
Innovators 132.6 139.1 6.5
SMEs product/process innovations 138.2 156.5 18.3
SMEs marketing/organizational innovations 114.4 118.1 3.7
SMEs innovating in-house 145.7 143.4 -2.2
Linkages 157.4 160.4 3.0
Innovative SMEs collaborating with others 210.9 217.4 6.5
Public-private co-publications 135.2 132.1 -3.1
Private co-funding of public R&D exp. 132.7 138.1 5.4
Intellectual assets 95.5 87.7 -7.8
PCT patent applications 96.4 95.0 -1.3
Trademark applications 112.9 111.4 -1.5
Design applications 81.0 59.7 -21.4
Employment impacts 73.1 76.0 2.9
Employment in knowledge-intensive activities 116.7 121.8 5.1
Employment fast-growing enterprises 41.2 42.6 1.4
Sales impacts 84.8 77.5 -7.3
Medium and high tech product exports 86.9 81.7 -5.1
Knowledge-intensive services exports 101.4 101.7 0.2
Sales of new-to-market/firm innovations 62.8 44.1 -18.8
Dark green: normalised performance above 120% of EU; light green: normalised performance between 90% and 120% of EU; yellow: normalised performance between 50% and 90% of EU; orange: normalised performance below 50% of EU. Normalised performance uses the data after a possible imputation of missing data and transformation of the data.
Change highlighted in green is positive; change highlighted in light red is negative.
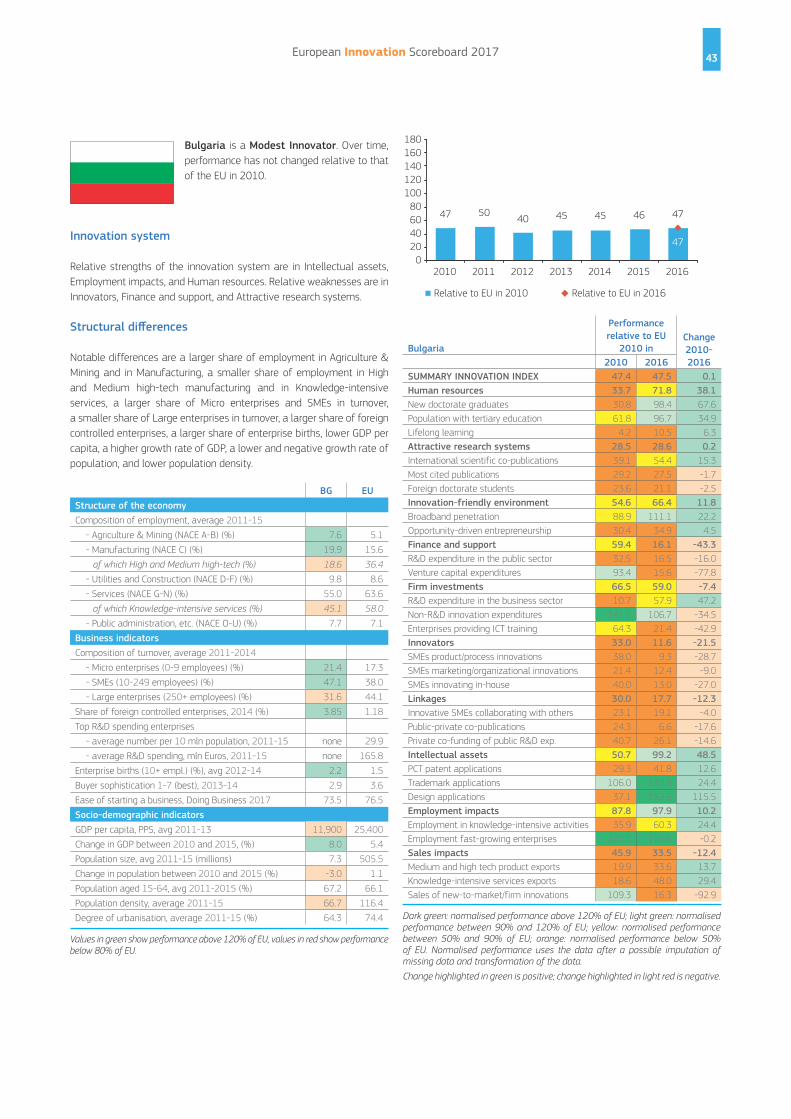
43European Innovation Scoreboard 2017
Bulgaria is a Modest Innovator. Over time,
performance has not changed relative to that
of the EU in 2010.
Innovation system
Relative strengths of the innovation system are in Intellectual assets,
Employment impacts, and Human resources. Relative weaknesses are in
Innovators, Finance and support, and Attractive research systems.
Structural differences
Notable differences are a larger share of employment in Agriculture &
Mining and in Manufacturing, a smaller share of employment in High
and Medium high-tech manufacturing and in Knowledge-intensive
services, a larger share of Micro enterprises and SMEs in turnover,
a smaller share of Large enterprises in turnover, a larger share of foreign
controlled enterprises, a larger share of enterprise births, lower GDP per
capita, a higher growth rate of GDP, a lower and negative growth rate of
population, and lower population density.
BG EU
Structure of the economy
Composition of employment, average 2011-15
- Agriculture & Mining (NACE A-B) (%) 7.6 5.1
- Manufacturing (NACE C) (%) 19.9 15.6
of which High and Medium high-tech (%) 18.6 36.4
- Utilities and Construction (NACE D-F) (%) 9.8 8.6
- Services (NACE G-N) (%) 55.0 63.6
of which Knowledge-intensive services (%) 45.1 58.0
- Public administration, etc. (NACE O-U) (%) 7.7 7.1
Business indicators
Composition of turnover, average 2011-2014
- Micro enterprises (0-9 employees) (%) 21.4 17.3
- SMEs (10-249 employees) (%) 47.1 38.0
- Large enterprises (250+ employees) (%) 31.6 44.1
Share of foreign controlled enterprises, 2014 (%) 3.85 1.18
Top R&D spending enterprises
- average number per 10 mln population, 2011-15 none 29.9
- average R&D spending, mln Euros, 2011-15 none 165.8
Enterprise births (10+ empl.) (%), avg 2012-14 2.2 1.5
Buyer sophistication 1-7 (best), 2013-14 2.9 3.6
Ease of starting a business, Doing Business 2017 73.5 76.5
Socio-demographic indicators
GDP per capita, PPS, avg 2011-13 11,900 25,400
Change in GDP between 2010 and 2015, (%) 8.0 5.4
Population size, avg 2011-15 (millions) 7.3 505.5
Change in population between 2010 and 2015 (%) -3.0 1.1
Population aged 15-64, avg 2011-2015 (%) 67.2 66.1
Population density, average 2011-15 66.7 116.4
Degree of urbanisation, average 2011-15 (%) 64.3 74.4
Values in green show performance above 120% of EU, values in red show performance below 80% of EU.
47 5040 45 45 46 47
47
0
20
40
60
80
100
120
140
160
180
2010 2011 2012 2013 2014 2015 2016
Relative to EU in 2010 Relative to EU in 2016
Bulgaria
Performance
relative to EU
2010 inChange
2010-
20162010 2016
SUMMARY INNOVATION INDEX 47.4 47.5 0.1
Human resources 33.7 71.8 38.1
New doctorate graduates 30.8 98.4 67.6
Population with tertiary education 61.8 96.7 34.9
Lifelong learning 4.2 10.5 6.3
Attractive research systems 28.5 28.6 0.2
International scientific co-publications 39.1 54.4 15.3
Most cited publications 29.2 27.5 -1.7
Foreign doctorate students 23.6 21.1 -2.5
Innovation-friendly environment 54.6 66.4 11.8
Broadband penetration 88.9 111.1 22.2
Opportunity-driven entrepreneurship 30.4 34.9 4.5
Finance and support 59.4 16.1 -43.3
R&D expenditure in the public sector 32.5 16.5 -16.0
Venture capital expenditures 93.4 15.6 -77.8
Firm investments 66.5 59.0 -7.4
R&D expenditure in the business sector 10.7 57.9 47.2
Non-R&D innovation expenditures 141.2 106.7 -34.5
Enterprises providing ICT training 64.3 21.4 -42.9
Innovators 33.0 11.6 -21.5
SMEs product/process innovations 38.0 9.3 -28.7
SMEs marketing/organizational innovations 21.4 12.4 -9.0
SMEs innovating in-house 40.0 13.0 -27.0
Linkages 30.0 17.7 -12.3
Innovative SMEs collaborating with others 23.1 19.1 -4.0
Public-private co-publications 24.3 6.6 -17.6
Private co-funding of public R&D exp. 40.7 26.1 -14.6
Intellectual assets 50.7 99.2 48.5
PCT patent applications 29.3 41.8 12.6
Trademark applications 106.0 130.4 24.4
Design applications 37.1 152.5 115.5
Employment impacts 87.8 97.9 10.2
Employment in knowledge-intensive activities 35.9 60.3 24.4
Employment fast-growing enterprises 125.7 125.5 -0.2
Sales impacts 45.9 33.5 -12.4
Medium and high tech product exports 19.9 33.6 13.7
Knowledge-intensive services exports 18.6 48.0 29.4
Sales of new-to-market/firm innovations 109.3 16.3 -92.9
Dark green: normalised performance above 120% of EU; light green: normalised performance between 90% and 120% of EU; yellow: normalised performance between 50% and 90% of EU; orange: normalised performance below 50% of EU. Normalised performance uses the data after a possible imputation of missing data and transformation of the data.
Change highlighted in green is positive; change highlighted in light red is negative.

44 European Innovation Scoreboard 2017
The Czech Republic is a Moderate Innovator.
Over time, performance has declined by 3.5%
relative to that of the EU in 2010.
Innovation system
Relative strengths of the innovation system are in Firm investments,
Employment impacts, and Sales impacts. Relative weaknesses are in
Intellectual assets, Linkages, and Innovators.
Structural differences
Notable differences are a smaller share of employment in Agriculture &
Mining, a larger share of employment in Manufacturing, a larger share
of employment in Utilities and Construction, a lower number of Top
R&D spending enterprises and a lower average R&D spending of these
enterprises, a smaller share of enterprise births, a higher growth rate of
GDP, a lower growth rate of population, and lower population density.
CZ EU
Structure of the economy
Composition of employment, average 2011-15
- Agriculture & Mining (NACE A-B) (%) 3.8 5.1
- Manufacturing (NACE C) (%) 26.6 15.6
of which High and Medium high-tech (%) 40.2 36.4
- Utilities and Construction (NACE D-F) (%) 10.6 8.6
- Services (NACE G-N) (%) 52.6 63.6
of which Knowledge-intensive services (%) 54.4 58.0
- Public administration, etc. (NACE O-U) (%) 6.4 7.1
Business indicators
Composition of turnover, average 2011-2014
- Micro enterprises (0-9 employees) (%) 18.3 17.3
- SMEs (10-249 employees) (%) 39.3 38.0
- Large enterprises (250+ employees) (%) 42.3 44.1
Share of foreign controlled enterprises, 2014 (%) 1.37 1.18
Top R&D spending enterprises
- average number per 10 mln population, 2011-15 3.3 29.9
- average R&D spending, mln Euros, 2011-15 24.8 165.8
Enterprise births (10+ empl.) (%), avg 2012-14 1.1 1.5
Buyer sophistication 1-7 (best), 2013-14 3.4 3.6
Ease of starting a business, Doing Business 2017 76.7 76.5
Socio-demographic indicators
GDP per capita, PPS, avg 2011-13 20,500 25,400
Change in GDP between 2010 and 2015, (%) 8.1 5.4
Population size, avg 2011-15 (millions) 10.5 505.5
Change in population between 2010 and 2015 (%) 0.7 1.1
Population aged 15-64, avg 2011-2015 (%) 68.4 66.1
Population density, average 2011-15 136.3 116.4
Degree of urbanisation, average 2011-15 (%) 63.9 74.4
Values in green show performance above 120% of EU, values in red show performance below 80% of EU.
88 89 86 85 83 85 84
83
0
20
40
60
80
100
120
140
160
180
2010 2011 2012 2013 2014 2015 2016
Relative to EU in 2010 Relative to EU in 2016
Czech Republic
Performance
relative to EU
2010 inChange
2010-
20162010 2016
SUMMARY INNOVATION INDEX 87.9 84.4 -3.5
Human resources 70.7 97.4 26.6
New doctorate graduates 92.3 113.6 21.3
Population with tertiary education 29.6 95.4 65.8
Lifelong learning 92.6 80.0 -12.6
Attractive research systems 60.8 82.6 21.9
International scientific co-publications 131.9 220.9 89.0
Most cited publications 55.6 62.6 6.9
Foreign doctorate students 42.8 62.3 19.5
Innovation-friendly environment 76.7 94.2 17.5
Broadband penetration 88.9 111.1 22.2
Opportunity-driven entrepreneurship 68.2 82.3 14.1
Finance and support 114.7 77.5 -37.1
R&D expenditure in the public sector 71.6 128.4 56.9
Venture capital expenditures 169.1 13.3 -155.7
Firm investments 108.7 114.6 5.9
R&D expenditure in the business sector 60.5 88.8 28.3
Non-R&D innovation expenditures 155.4 139.5 -15.9
Enterprises providing ICT training 121.4 121.4 0.0
Innovators 105.6 73.7 -31.8
SMEs product/process innovations 98.8 81.5 -17.3
SMEs marketing/organizational innovations 120.6 50.6 -70.0
SMEs innovating in-house 97.0 89.7 -7.3
Linkages 66.9 63.0 -3.9
Innovative SMEs collaborating with others 101.1 88.6 -12.5
Public-private co-publications 80.5 46.5 -34.0
Private co-funding of public R&D exp. 27.2 56.2 29.0
Intellectual assets 54.4 60.8 6.4
PCT patent applications 51.0 53.9 2.9
Trademark applications 65.0 78.1 13.2
Design applications 50.9 56.9 6.0
Employment impacts 115.8 95.4 -20.3
Employment in knowledge-intensive activities 84.6 91.0 6.4
Employment fast-growing enterprises 138.5 98.6 -39.9
Sales impacts 102.4 95.0 -7.5
Medium and high tech product exports 119.9 124.5 4.6
Knowledge-intensive services exports 40.9 49.2 8.2
Sales of new-to-market/firm innovations 153.4 112.9 -40.5
Dark green: normalised performance above 120% of EU; light green: normalised performance between 90% and 120% of EU; yellow: normalised performance between 50% and 90% of EU; orange: normalised performance below 50% of EU. Normalised performance uses the data after a possible imputation of missing data and transformation of the data.
Change highlighted in green is positive; change highlighted in light red is negative.

45European Innovation Scoreboard 2017
Denmark is an Innovation Leader. Over
time, performance has declined by 2.8%
relative to that of the EU in 2010.
Innovation system
Relative strengths of the innovation system are in Innovation-friendly
environment, Human resources, and Attractive research systems.
Relative weaknesses are in Sales impacts, Innovators, and Employment
impacts.
Structural differences
Notable differences are a smaller share of employment in Agriculture
& Mining, in Manufacturing and in Public administration, a larger share
of foreign controlled enterprises, a higher number of Top R&D spending
enterprises but a lower average R&D spending of these enterprises,
a smaller share of enterprise births, higher GDP per capita, and a higher
growth rate of population.
DK EU
Structure of the economy
Composition of employment, average 2011-15
- Agriculture & Mining (NACE A-B) (%) 2.7 5.1
- Manufacturing (NACE C) (%) 12.2 15.6
of which High and Medium high-tech (%) 42.1 36.4
- Utilities and Construction (NACE D-F) (%) 7.1 8.6
- Services (NACE G-N) (%) 72.3 63.6
of which Knowledge-intensive services (%) 65.0 58.0
- Public administration, etc. (NACE O-U) (%) 5.7 7.1
Business indicators
Composition of turnover, average 2011-2014
- Micro enterprises (0-9 employees) (%) n/a 17.3
- SMEs (10-249 employees) (%) n/a 38.0
- Large enterprises (250+ employees) (%) 40.3 44.1
Share of foreign controlled enterprises, 2014 (%) 1.74 1.18
Top R&D spending enterprises
- average number per 10 mln population, 2011-15 94.2 29.9
- average R&D spending, mln Euros, 2011-15 111.3 165.8
Enterprise births (10+ empl.) (%), avg 2012-14 0.5 1.5
Buyer sophistication 1-7 (best), 2013-14 3.7 3.6
Ease of starting a business, Doing Business 2017 84.9 76.5
Socio-demographic indicators
GDP per capita, PPS, avg 2011-13 31,900 25,400
Change in GDP between 2010 and 2015, (%) 5.9 5.4
Population size, avg 2011-15 (millions) 5.6 505.5
Change in population between 2010 and 2015 (%) 2.3 1.1
Population aged 15-64, avg 2011-2015 (%) 64.8 66.1
Population density, average 2011-15 130.9 116.4
Degree of urbanisation, average 2011-15 (%) 59.0 74.4
Values in green show performance above 120% of EU, values in red show performance below 80% of EU.
0
20
40
60
80
100
120
140
160
180
2010 2011 2012 2013 2014 2015 2016
Relative to EU in 2010 Relative to EU in 2016
140 141 145 146 143 140 137
134
Denmark
Performance
relative to EU
2010 inChange
2010-
20162010 2016
SUMMARY INNOVATION INDEX 139.5 136.7 -2.8
Human resources 168.3 228.3 60.0
New doctorate graduates 115.4 234.1 118.7
Population with tertiary education 128.3 178.9 50.7
Lifelong learning 278.9 278.9 0.0
Attractive research systems 158.6 202.0 43.4
International scientific co-publications 427.6 649.2 221.6
Most cited publications 144.3 137.1 -7.3
Foreign doctorate students 83.3 136.4 53.1
Innovation-friendly environment 221.2 229.9 8.7
Broadband penetration 277.8 277.8 0.0
Opportunity-driven entrepreneurship 181.3 196.1 14.8
Finance and support 127.2 115.7 -11.4
R&D expenditure in the public sector 133.8 158.6 24.9
Venture capital expenditures 118.8 61.6 -57.3
Firm investments 142.8 124.1 -18.7
R&D expenditure in the business sector 181.6 158.4 -23.2
Non-R&D innovation expenditures 66.5 30.7 -35.8
Enterprises providing ICT training 164.3 164.3 0.0
Innovators 119.7 96.3 -23.4
SMEs product/process innovations 110.7 97.9 -12.8
SMEs marketing/organizational innovations 100.2 100.1 -0.1
SMEs innovating in-house 148.3 90.8 -57.5
Linkages 152.6 114.8 -37.9
Innovative SMEs collaborating with others 215.5 120.7 -94.8
Public-private co-publications 204.3 200.3 -4.0
Private co-funding of public R&D exp. 56.7 36.4 -20.4
Intellectual assets 139.1 148.3 9.2
PCT patent applications 138.8 128.6 -10.2
Trademark applications 134.1 151.4 17.3
Design applications 143.2 172.3 29.2
Employment impacts 132.4 103.3 -29.0
Employment in knowledge-intensive activities 129.5 129.5 0.0
Employment fast-growing enterprises 134.5 84.2 -50.2
Sales impacts 89.7 79.8 -9.9
Medium and high tech product exports 63.4 79.8 16.4
Knowledge-intensive services exports 123.3 115.7 -7.5
Sales of new-to-market/firm innovations 82.0 37.7 -44.2
Dark green: normalised performance above 120% of EU; light green: normalised performance between 90% and 120% of EU; yellow: normalised performance between 50% and 90% of EU; orange: normalised performance below 50% of EU. Normalised performance uses the data after a possible imputation of missing data and transformation of the data.
Change highlighted in green is positive; change highlighted in light red is negative.

46 European Innovation Scoreboard 2017
Germany is an Innovation Leader. Over
time, performance has declined by 3.7%
relative to that of the EU in 2010.
Innovation system
Relative strengths of the innovation system are in Firm investments,
Innovators, and Intellectual assets. Relative weaknesses are in Finance
and support, Employment impacts, and Attractive research systems.
Structural differences
Notable differences are a smaller share of employment in Agriculture
& Mining and a larger share of employment in Manufacturing and
particularly in High and Medium high-tech manufacturing, a smaller
share of Micro enterprises in turnover, a higher number of Top R&D
spending enterprises and a higher average R&D spending of these
enterprises, a smaller share of enterprise births, higher GDP per capita,
a higher growth rate of GDP, a lower and negative growth rate of
population, and higher population density.
DE EU
Structure of the economy
Composition of employment, average 2011-15
- Agriculture & Mining (NACE A-B) (%) 1.7 5.1
- Manufacturing (NACE C) (%) 19.6 15.6
of which High and Medium high-tech (%) 49.8 36.4
- Utilities and Construction (NACE D-F) (%) 8.2 8.6
- Services (NACE G-N) (%) 63.4 63.6
of which Knowledge-intensive services (%) 58.3 58.0
- Public administration, etc. (NACE O-U) (%) 7.1 7.1
Business indicators
Composition of turnover, average 2011-2014
- Micro enterprises (0-9 employees) (%) 11.3 17.3
- SMEs (10-249 employees) (%) 36.1 38.0
- Large enterprises (250+ employees) (%) 52.5 44.1
Share of foreign controlled enterprises, 2014 (%) 1.19 1.18
Top R&D spending enterprises
- average number per 10 mln population, 2011-15 41.8 29.9
- average R&D spending, mln Euros, 2011-15 255.7 165.8
Enterprise births (10+ empl.) (%), avg 2012-14 0.6 1.5
Buyer sophistication 1-7 (best), 2013-14 4.3 3.6
Ease of starting a business, Doing Business 2017 79.9 76.5
Socio-demographic indicators
GDP per capita, PPS, avg 2011-13 31,400 25,400
Change in GDP between 2010 and 2015, (%) 8.2 5.4
Population size, avg 2011-15 (millions) 80.6 505.5
Change in population between 2010 and 2015 (%) -0.7 1.1
Population aged 15-64, avg 2011-2015 (%) 65.9 66.1
Population density, average 2011-15 226.3 116.4
Degree of urbanisation, average 2011-15 (%) 80.7 74.4
Values in green show performance above 120% of EU, values in red show performance below 80% of EU.
127 129 129 129 124 125 123
121
0
20
40
60
80
100
120
140
160
180
2010 2011 2012 2013 2014 2015 2016
Relative to EU in 2010 Relative to EU in 2016
Germany
Performance
relative to EU
2010 inChange
2010-
20162010 2016
SUMMARY INNOVATION INDEX 127.1 123.4 -3.7
Human resources 104.6 124.0 19.4
New doctorate graduates 184.6 204.1 19.5
Population with tertiary education 52.0 81.6 29.6
Lifelong learning 69.5 76.8 7.4
Attractive research systems 96.1 104.1 8.0
International scientific co-publications 174.6 251.6 77.0
Most cited publications 110.5 113.4 2.8
Foreign doctorate students 47.2 38.2 -9.0
Innovation-friendly environment 75.5 107.0 31.5
Broadband penetration 100.0 133.3 33.3
Opportunity-driven entrepreneurship 58.3 88.4 30.1
Finance and support 100.0 99.0 -0.9
R&D expenditure in the public sector 128.4 137.3 8.9
Venture capital expenditures 64.0 50.7 -13.3
Firm investments 141.1 175.1 34.0
R&D expenditure in the business sector 155.8 165.3 9.4
Non-R&D innovation expenditures 128.8 192.5 63.7
Enterprises providing ICT training 135.7 171.4 35.7
Innovators 176.0 131.5 -44.6
SMEs product/process innovations 179.5 127.6 -51.8
SMEs marketing/organizational innovations 176.6 131.8 -44.8
SMEs innovating in-house 172.1 135.0 -37.1
Linkages 138.7 129.7 -9.1
Innovative SMEs collaborating with others 106.1 89.3 -16.8
Public-private co-publications 124.2 112.0 -12.2
Private co-funding of public R&D exp. 177.9 177.9 0.0
Intellectual assets 145.2 131.5 -13.7
PCT patent applications 136.6 130.8 -5.8
Trademark applications 135.2 128.9 -6.3
Design applications 164.5 134.3 -30.1
Employment impacts 121.5 100.7 -20.8
Employment in knowledge-intensive activities 124.4 116.7 -7.7
Employment fast-growing enterprises 119.4 89.0 -30.4
Sales impacts 128.2 117.9 -10.3
Medium and high tech product exports 127.0 134.3 7.4
Knowledge-intensive services exports 118.9 115.5 -3.3
Sales of new-to-market/firm innovations 140.7 100.7 -39.9
Dark green: normalised performance above 120% of EU; light green: normalised performance between 90% and 120% of EU; yellow: normalised performance between 50% and 90% of EU; orange: normalised performance below 50% of EU. Normalised performance uses the data after a possible imputation of missing data and transformation of the data.
Change highlighted in green is positive; change highlighted in light red is negative.

47European Innovation Scoreboard 2017
Estonia is a Moderate Innovator. Over time,
performance has declined by 3.6% relative to
that of the EU in 2010.
Innovation system
Relative strengths of the innovation system are in Finance and support,
Human resources, and Innovation-friendly environment. Relative
weaknesses are in Innovators, Linkages, and Sales impacts.
Structural differences
Notable differences are a larger share of employment in Manufacturing
but a smaller share in High and Medium high-tech manufacturing,
a larger share of employment in Utilities and Construction, a larger
share of Micro enterprises and SMEs in turnover, a smaller share of large
enterprises in turnover, a smaller share of enterprise births, lower GDP
per capita, a higher growth rate of GDP, a lower and negative growth rate
of population, and lower population density.
EE EU
Structure of the economy
Composition of employment, average 2011-15
- Agriculture & Mining (NACE A-B) (%) 4.9 5.1
- Manufacturing (NACE C) (%) 18.9 15.6
of which High and Medium high-tech (%) 21.0 36.4
- Utilities and Construction (NACE D-F) (%) 11.3 8.6
- Services (NACE G-N) (%) 58.1 63.6
of which Knowledge-intensive services (%) 53.3 58.0
- Public administration, etc. (NACE O-U) (%) 6.8 7.1
Business indicators
Composition of turnover, average 2011-2014
- Micro enterprises (0-9 employees) (%) 30.3 17.3
- SMEs (10-249 employees) (%) 47.1 38.0
- Large enterprises (250+ employees) (%) 22.6 44.1
Share of foreign controlled enterprises, 2014 (%) 24.80 1.18
Top R&D spending enterprises
- average number per 10 mln population, 2011-15 none 3.0
- average R&D spending, mln Euros, 2011-15 none 165.8
Enterprise births (10+ empl.) (%), avg 2012-14 0.9 1.5
Buyer sophistication 1-7 (best), 2013-14 3.0 3.6
Ease of starting a business, Doing Business 2017 81.1 76.5
Socio-demographic indicators
GDP per capita, PPS, avg 2011-13 18,100 25,400
Change in GDP between 2010 and 2015, (%) 18.7 5.4
Population size, avg 2011-15 (millions) 1.3 505.5
Change in population between 2010 and 2015 (%) -1.4 1.1
Population aged 15-64, avg 2011-2015 (%) 66.3 66.1
Population density, average 2011-15 30.3 116.4
Degree of urbanisation, average 2011-15 (%) 59.0 74.4
Values in green show performance above 120% of EU, values in red show performance below 80% of EU.
0
20
40
60
80
100
120
140
160
180
2010 2011 2012 2013 2014 2015 2016
Relative to EU in 2010 Relative to EU in 2016
83 89 90 91 87 9180
78
Estonia
Performance
relative to EU
2010 inChange
2010-
20162010 2016
SUMMARY INNOVATION INDEX 83.3 79.8 -3.6
Human resources 95.6 122.1 26.5
New doctorate graduates 53.8 67.9 14.0
Population with tertiary education 132.2 152.0 19.7
Lifelong learning 103.2 152.6 49.5
Attractive research systems 56.5 93.6 37.2
International scientific co-publications 174.7 337.8 163.1
Most cited publications 51.4 74.2 22.8
Foreign doctorate students 21.7 34.7 13.0
Innovation-friendly environment 85.7 112.8 27.1
Broadband penetration 88.9 133.3 44.4
Opportunity-driven entrepreneurship 83.4 98.3 14.9
Finance and support 77.4 124.4 47.1
R&D expenditure in the public sector 103.6 110.7 7.1
Venture capital expenditures 44.3 141.8 97.5
Firm investments 115.1 76.3 -38.8
R&D expenditure in the business sector 51.1 57.1 6.0
Non-R&D innovation expenditures 277.8 124.7 -153.1
Enterprises providing ICT training 50.0 57.1 7.1
Innovators 111.2 23.6 -87.6
SMEs product/process innovations 137.8 23.5 -114.3
SMEs marketing/organizational innovations 79.7 13.3 -66.3
SMEs innovating in-house 117.0 34.1 -82.9
Linkages 109.0 57.7 -51.3
Innovative SMEs collaborating with others 211.5 95.9 -115.7
Public-private co-publications 77.9 10.0 -68.0
Private co-funding of public R&D exp. 51.8 67.5 15.7
Intellectual assets 75.0 96.9 21.9
PCT patent applications 71.9 60.6 -11.3
Trademark applications 117.2 181.2 64.0
Design applications 46.9 81.3 34.4
Employment impacts 49.3 69.9 20.6
Employment in knowledge-intensive activities 52.6 89.7 37.2
Employment fast-growing enterprises 46.8 55.4 8.6
Sales impacts 55.6 64.4 8.8
Medium and high tech product exports 41.9 65.7 23.9
Knowledge-intensive services exports 57.5 56.0 -1.5
Sales of new-to-market/firm innovations 70.0 72.6 2.6
Dark green: normalised performance above 120% of EU; light green: normalised performance between 90% and 120% of EU; yellow: normalised performance between 50% and 90% of EU; orange: normalised performance below 50% of EU. Normalised performance uses the data after a possible imputation of missing data and transformation of the data.
Change highlighted in green is positive; change highlighted in light red is negative.

48 European Innovation Scoreboard 2017
Ireland is a Strong Innovator. Over time,
performance has increased by 3.5% relative
to that of the EU in 2010.
Innovation system
Relative strengths of the innovation system are in Employment impacts,
Human resources, and Attractive research systems. Relative weaknesses
are in Finance and support, Intellectual assets, and Linkages.
Structural differences
Notable differences are a smaller share of employment in Manufacturing
but a larger share in High and Medium high-tech manufacturing,
a smaller share of employment in Public administration, a larger share
of large enterprises in turnover, a larger share of foreign controlled
enterprises, a higher number of Top R&D spending enterprises and
a higher average R&D spending of these enterprises, a smaller share of
enterprise births, higher GDP per capita, a higher growth rate of GDP32,
a higher growth rate of population, and lower population density.
IE EU
Structure of the economy
Composition of employment, average 2011-15
- Agriculture & Mining (NACE A-B) (%) 5.3 5.1
- Manufacturing (NACE C) (%) 11.4 15.6
of which High and Medium high-tech (%) 44.6 36.4
- Utilities and Construction (NACE D-F) (%) 6.9 8.6
- Services (NACE G-N) (%) 71.0 63.6
of which Knowledge-intensive services (%) 60.9 58.0
- Public administration, etc. (NACE O-U) (%) 5.4 7.1
Business indicators
Composition of turnover, average 2011-2014
- Micro enterprises (0-9 employees) (%) 15.8 17.3
- SMEs (10-249 employees) (%) 35.7 38.0
- Large enterprises (250+ employees) (%) 54.1 44.1
Share of foreign controlled enterprises, 2014 (%) 2.45 1.18
Top R&D spending enterprises
- average number per 10 mln population, 2011-15 66.0 29.9
- average R&D spending, mln Euros, 2011-15 246.0 165.8
Enterprise births (10+ empl.) (%), avg 2012-14 0.4 1.5
Buyer sophistication 1-7 (best), 2013-14 4.2 3.6
Ease of starting a business, Doing Business 2017 79.5 76.5
Socio-demographic indicators
GDP per capita, PPS, avg 2011-13 32,600 25,400
Change in GDP between 2010 and 2015, (%) 36.9 5.4
Population size, avg 2011-15 (millions) 4.6 505.5
Change in population between 2010 and 2015 (%) 1.7 1.1
Population aged 15-64, avg 2011-2015 (%) 66.0 66.1
Population density, average 2011-15 67.2 116.4
Degree of urbanisation, average 2011-15 (%) 34.1 74.4
Values in green show performance above 120% of EU, values in red show performance below 80% of EU.
0
20
40
60
80
100
120
140
160
180
2010 2011 2012 2013 2014 2015 2016
Relative to EU in 2010 Relative to EU in 2016
112 112 110 112 109 109 116
114
Ireland
Performance
relative to EU
2010 inChange
2010-
20162010 2016
SUMMARY INNOVATION INDEX 112.2 115.7 3.5
Human resources 125.4 156.7 31.3
New doctorate graduates 107.7 178.0 70.4
Population with tertiary education 198.7 221.7 23.0
Lifelong learning 61.1 54.7 -6.3
Attractive research systems 146.2 148.1 2.0
International scientific co-publications 261.9 395.0 133.1
Most cited publications 109.4 122.0 12.5
Foreign doctorate students 158.1 98.0 -60.1
Innovation-friendly environment 81.7 112.0 30.3
Broadband penetration 111.1 166.7 55.6
Opportunity-driven entrepreneurship 60.9 73.4 12.5
Finance and support 110.2 56.5 -53.6
R&D expenditure in the public sector 62.7 30.7 -32.0
Venture capital expenditures 170.0 89.1 -80.9
Firm investments 134.1 113.4 -20.7
R&D expenditure in the business sector 92.3 91.4 -0.9
Non-R&D innovation expenditures 151.1 61.7 -89.4
Enterprises providing ICT training 164.3 178.6 14.3
Innovators 138.6 146.6 8.0
SMEs product/process innovations 130.9 145.5 14.7
SMEs marketing/organizational innovations 105.6 143.7 38.1
SMEs innovating in-house 179.8 150.6 -29.2
Linkages 60.7 68.9 8.2
Innovative SMEs collaborating with others 86.5 127.8 41.4
Public-private co-publications 79.5 77.1 -2.3
Private co-funding of public R&D exp. 23.6 13.6 -10.0
Intellectual assets 74.3 62.7 -11.6
PCT patent applications 86.3 82.0 -4.4
Trademark applications 93.5 81.8 -11.8
Design applications 43.4 22.1 -21.3
Employment impacts 152.6 169.4 16.7
Employment in knowledge-intensive activities 176.9 180.8 3.8
Employment fast-growing enterprises 134.9 161.0 26.1
Sales impacts 107.2 128.4 21.3
Medium and high tech product exports 91.0 92.7 1.7
Knowledge-intensive services exports 149.0 149.0 0.0
Sales of new-to-market/firm innovations 77.8 147.5 69.7
Dark green: normalised performance above 120% of EU; light green: normalised performance between 90% and 120% of EU; yellow: normalised performance between 50% and 90% of EU; orange: normalised performance below 50% of EU. Normalised performance uses the data after a possible imputation of missing data and transformation of the data.
Change highlighted in green is positive; change highlighted in light red is negative.
32 This strong increase is due to a revision in Irish GDP. As of 2015, several big economic opera-
tors were relocated to Ireland: http://ec.europa.eu/eurostat/documents/24,987/63,90465/
Irish_GDP_communication.pdf

49European Innovation Scoreboard 2017
Greece is a Moderate Innovator. Over time,
performance has increased by 0.7% relative
to that of the EU in 2010.
Innovation system
Relative strengths of the innovation system are in Innovators, Attractive
research systems, and Human resources. Relative weaknesses are in
Innovation-friendly environment, Intellectual assets, and Finance and
support.
Structural differences
Notable differences are a larger share of employment in Agriculture &
Mining, a smaller share of employment in Manufacturing, in High and
Medium high-tech manufacturing and in Utilities and Construction,
a larger share of employment in Public administration, a larger share
of micro enterprises in turnover, a smaller share of large enterprises in
turnover, a smaller share of foreign controlled enterprises, a lower number
of Top R&D spending enterprises and a lower average R&D spending of
these enterprises, lower GDP per capita, a lower and negative growth
rate of GDP, a lower and negative growth rate of population, and lower
population density.
EL EU
Structure of the economy
Composition of employment, average 2011-15
- Agriculture & Mining (NACE A-B) (%) 13.3 5.1
- Manufacturing (NACE C) (%) 9.4 15.6
of which High and Medium high-tech (%) 13.6 36.4
- Utilities and Construction (NACE D-F) (%) 6.3 8.6
- Services (NACE G-N) (%) 62.1 63.6
of which Knowledge-intensive services (%) 49.6 58.0
- Public administration, etc. (NACE O-U) (%) 8.9 7.1
Business indicators
Composition of turnover, average 2011-2014
- Micro enterprises (0-9 employees) (%) 35.9 17.3
- SMEs (10-249 employees) (%) 36.5 38.0
- Large enterprises (250+ employees) (%) 28.1 44.1
Share of foreign controlled enterprises, 2014 (%) 0.23 1.18
Top R&D spending enterprises
- average number per 10 mln population, 2011-15 4.2 29.9
- average R&D spending, mln Euros, 2011-15 30.2 165.8
Enterprise births (10+ empl.) (%), avg 2012-14 n/a 1.5
Buyer sophistication 1-7 (best), 2013-14 3.3 3.6
Ease of starting a business, Doing Business 2017 68.7 76.5
Socio-demographic indicators
GDP per capita, PPS, avg 2011-13 19,900 25,400
Change in GDP between 2010 and 2015, (%) -18.4 5.4
Population size, avg 2011-15 (millions) 11.0 505.5
Change in population between 2010 and 2015 (%) -2.3 1.1
Population aged 15-64, avg 2011-2015 (%) 65.3 66.1
Population density, average 2011-15 83.0 116.4
Degree of urbanisation, average 2011-15 (%) 68.5 74.4
Values in green show performance above 120% of EU, values in red show performance below 80% of EU.
0
20
40
60
80
100
120
140
160
180
2010 2011 2012 2013 2014 2015 2016
Relative to EU in 2010 Relative to EU in 2016
67 69 69 7062 64 68
67
Greece
Performance
relative to EU
2010 inChange
2010-
20162010 2016
SUMMARY INNOVATION INDEX 67.5 68.2 0.7
Human resources 51.5 86.4 34.8
New doctorate graduates 46.2 71.2 25.0
Population with tertiary education 82.2 150.7 68.4
Lifelong learning 22.1 29.5 7.4
Attractive research systems § 85.7 100.9 15.1
International scientific co-publications 120.8 187.4 66.7
Most cited publications 81.0 84.2 3.1
Foreign doctorate students N/A N/A N/A
Innovation-friendly environment 39.6 33.6 -6.0
Broadband penetration 22.2 22.2 0.0
Opportunity-driven entrepreneurship 51.8 41.7 -10.2
Finance and support 27.5 47.3 19.8
R&D expenditure in the public sector 41.4 84.0 42.6
Venture capital expenditures 10.0 1.0 -9.0
Firm investments 61.3 65.3 4.0
R&D expenditure in the business sector 17.6 25.3 7.7
Non-R&D innovation expenditures 105.4 109.3 3.9
Enterprises providing ICT training 71.4 71.4 0.0
Innovators 121.3 101.2 -20.1
SMEs product/process innovations 109.4 97.7 -11.6
SMEs marketing/organizational innovations 139.5 100.7 -38.8
SMEs innovating in-house 114.7 105.3 -9.4
Linkages 78.6 82.3 3.7
Innovative SMEs collaborating with others 121.5 136.0 14.5
Public-private co-publications 53.9 39.3 -14.6
Private co-funding of public R&D exp. 64.7 75.3 10.6
Intellectual assets 22.6 42.9 20.3
PCT patent applications 33.1 38.3 5.3
Trademark applications 20.8 70.0 49.2
Design applications 9.9 28.2 18.3
Employment impacts § 57.4 70.3 13.0
Employment in knowledge-intensive activities 67.9 83.3 15.4
Employment fast-growing enterprises N/A N/A N/A
Sales impacts 89.7 50.7 -39.0
Medium and high tech product exports 21.0 10.6 -10.4
Knowledge-intensive services exports 88.1 54.2 -33.9
Sales of new-to-market/firm innovations 174.5 95.0 -79.6
Dark green: normalised performance above 120% of EU; light green: normalised performance between 90% and 120% of EU; yellow: normalised performance between 50% and 90% of EU; orange: normalised performance below 50% of EU. Normalised performance uses the data after a possible imputation of missing data and transformation of the data.
§ Due to missing data, the relative dimension score does not necessarily reflect that of the indicators.
Change highlighted in green is positive; change highlighted in light red is negative.

50 European Innovation Scoreboard 2017
Spain is a Moderate Innovator. Over time,
performance has declined by 1.8% relative to
that of the EU in 2010.
Innovation system
Relative strengths of the innovation system are in Human resources,
Innovation-friendly environment, and Attractive research systems.
Relative weaknesses are in Innovators, Linkages, and Finance and
support.
Structural differences
Notable differences are a larger share of micro enterprises in turnover,
a smaller share of foreign controlled enterprises, a lower and negative
growth rate of GDP, a lower and negative growth rate of population, and
lower population density.
ES EU
Structure of the economy
Composition of employment, average 2011-15
- Agriculture & Mining (NACE A-B) (%) 4.4 5.1
- Manufacturing (NACE C) (%) 12.5 15.6
of which High and Medium high-tech (%) 31.0 36.4
- Utilities and Construction (NACE D-F) (%) 7.6 8.6
- Services (NACE G-N) (%) 67.9 63.6
of which Knowledge-intensive services (%) 51.2 58.0
- Public administration, etc. (NACE O-U) (%) 7.6 7.1
Business indicators
Composition of turnover, average 2011-2014
- Micro enterprises (0-9 employees) (%) 23.3 17.3
- SMEs (10-249 employees) (%) 38.2 38.0
- Large enterprises (250+ employees) (%) 38.6 44.1
Share of foreign controlled enterprises, 2014 (%) 0.44 1.18
Top R&D spending enterprises
- average number per 10 mln population, 2011-15 7.0 29.9
- average R&D spending, mln Euros, 2011-15 197.4 165.8
Enterprise births (10+ empl.) (%), avg 2012-14 1.5 1.5
Buyer sophistication 1-7 (best), 2013-14 3.4 3.6
Ease of starting a business, Doing Business 2017 75.7 76.5
Socio-demographic indicators
GDP per capita, PPS, avg 2011-13 24,400 25,400
Change in GDP between 2010 and 2015, (%) -1.2 5.4
Population size, avg 2011-15 (millions) 46.6 505.5
Change in population between 2010 and 2015 (%) -0.1 1.1
Population aged 15-64, avg 2011-2015 (%) 67.1 66.1
Population density, average 2011-15 92.8 116.4
Degree of urbanisation, average 2011-15 (%) 74.4 74.4
Values in green show performance above 120% of EU, values in red show performance below 80% of EU.
0
20
40
60
80
100
120
140
160
180
2010 2011 2012 2013 2014 2015 2016
Relative to EU in 2010 Relative to EU in 2016
80 80 80 79 73 74 78
77
Spain
Performance
relative to EU
2010 inChange
2010-
20162010 2016
SUMMARY INNOVATION INDEX 80.1 78.3 -1.8
Human resources 100.3 124.9 24.6
New doctorate graduates 61.5 131.9 70.4
Population with tertiary education 146.1 150.7 4.6
Lifelong learning 93.7 86.3 -7.4
Attractive research systems 93.6 94.6 1.0
International scientific co-publications 134.0 225.3 91.3
Most cited publications 83.8 93.2 9.3
Foreign doctorate students 93.4 50.2 -43.2
Innovation-friendly environment 92.3 124.4 32.1
Broadband penetration 111.1 222.2 111.1
Opportunity-driven entrepreneurship 79.1 55.4 -23.7
Finance and support 95.2 60.7 -34.5
R&D expenditure in the public sector 87.6 73.3 -14.2
Venture capital expenditures 104.8 44.6 -60.1
Firm investments 65.4 76.5 11.1
R&D expenditure in the business sector 57.9 52.8 -5.2
Non-R&D innovation expenditures 58.8 43.2 -15.6
Enterprises providing ICT training 78.6 128.6 50.0
Innovators 65.5 35.7 -29.8
SMEs product/process innovations 67.2 28.9 -38.3
SMEs marketing/organizational innovations 66.6 49.8 -16.8
SMEs innovating in-house 62.6 28.0 -34.6
Linkages 69.2 56.6 -12.7
Innovative SMEs collaborating with others 41.5 54.9 13.4
Public-private co-publications 66.2 49.7 -16.5
Private co-funding of public R&D exp. 94.6 63.9 -30.6
Intellectual assets 76.4 80.9 4.5
PCT patent applications 60.2 65.1 4.9
Trademark applications 106.6 126.7 20.1
Design applications 75.1 67.0 -8.1
Employment impacts 67.6 74.1 6.5
Employment in knowledge-intensive activities 78.2 84.6 6.4
Employment fast-growing enterprises 59.9 66.4 6.5
Sales impacts 85.3 83.9 -1.4
Medium and high tech product exports 83.8 79.7 -4.1
Knowledge-intensive services exports 51.9 51.9 0.0
Sales of new-to-market/firm innovations 126.2 126.5 0.3
Dark green: normalised performance above 120% of EU; light green: normalised performance between 90% and 120% of EU; yellow: normalised performance between 50% and 90% of EU; orange: normalised performance below 50% of EU. Normalised performance uses the data after a possible imputation of missing data and transformation of the data.
Change highlighted in green is positive; change highlighted in light red is negative.

51European Innovation Scoreboard 2017
France is a Strong Innovator. Over time,
performance has increased by 2.8% relative
to that of the EU in 2010.
Innovation system
Relative strengths of the innovation system are in Human resources,
Attractive research systems, and Innovation-friendly environment.
Relative weaknesses are in Linkages, Finance, and support and
Innovators.
Structural differences
Notable differences are a smaller share of employment in Agriculture
& Mining, a larger share of employment in Public administration,
a larger share of micro enterprises in turnover, a smaller share of foreign
controlled enterprises, a lower average R&D spending of Top R&D
spending enterprises, a smaller share of enterprise births, and a higher
growth rate of population.
FR EU
Structure of the economy
Composition of employment, average 2011-15
- Agriculture & Mining (NACE A-B) (%) 3.0 5.1
- Manufacturing (NACE C) (%) 12.7 15.6
of which High and Medium high-tech (%) 36.2 36.4
- Utilities and Construction (NACE D-F) (%) 8.5 8.6
- Services (NACE G-N) (%) 66.3 63.6
of which Knowledge-intensive services (%) 62.0 58.0
- Public administration, etc. (NACE O-U) (%) 9.5 7.1
Business indicators
Composition of turnover, average 2011-2014
- Micro enterprises (0-9 employees) (%) 21.7 17.3
- SMEs (10-249 employees) (%) 34.9 38.0
- Large enterprises (250+ employees) (%) 42.0 44.1
Share of foreign controlled enterprises, 2014 (%) 0.74 1.18
Top R&D spending enterprises
- average number per 10 mln population, 2011-15 28.7 29.9
- average R&D spending, mln Euros, 2011-15 234.9 165.8
Enterprise births (10+ empl.) (%), avg 2012-14 0.9 1.5
Buyer sophistication 1-7 (best), 2013-14 3.9 3.6
Ease of starting a business, Doing Business 2017 76.3 76.5
Socio-demographic indicators
GDP per capita, PPS, avg 2011-13 27,600 25,400
Change in GDP between 2010 and 2015, (%) 4.8 5.4
Population size, avg 2011-15 (millions) 65.7 505.5
Change in population between 2010 and 2015 (%) 2.8 1.1
Population aged 15-64, avg 2011-2015 (%) 63.8 66.1
Population density, average 2011-15 103.9 116.4
Degree of urbanisation, average 2011-15 (%) 70.2 74.4
Values in green show performance above 120% of EU, values in red show performance below 80% of EU.
0
20
40
60
80
100
120
140
160
180
2010 2011 2012 2013 2014 2015 2016
Relative to EU in 2010 Relative to EU in 2016
106 107 105 106 107 106 109
107
France
Performance
relative to EU
2010 inChange
2010-
20162010 2016
SUMMARY INNOVATION INDEX 106.4 109.2 2.8
Human resources 145.4 155.0 9.6
New doctorate graduates 100.0 115.1 15.1
Population with tertiary education 161.8 170.4 8.6
Lifelong learning 181.1 185.3 4.2
Attractive research systems 136.6 147.0 10.4
International scientific co-publications 162.4 224.9 62.5
Most cited publications 104.2 111.5 7.3
Foreign doctorate students 174.4 170.6 -3.8
Innovation-friendly environment 110.5 119.1 8.7
Broadband penetration 100.0 100.0 0.0
Opportunity-driven entrepreneurship 117.9 132.6 14.8
Finance and support 105.6 96.0 -9.6
R&D expenditure in the public sector 108.9 103.6 -5.3
Venture capital expenditures 101.4 86.6 -14.9
Firm investments 96.6 101.1 4.5
R&D expenditure in the business sector 114.6 122.3 7.7
Non-R&D innovation expenditures 60.3 66.2 6.0
Enterprises providing ICT training 107.1 107.1 0.0
Innovators 93.6 104.4 10.9
SMEs product/process innovations 86.9 101.4 14.6
SMEs marketing/organizational innovations 95.0 105.8 10.8
SMEs innovating in-house 98.7 106.0 7.3
Linkages 93.9 91.5 -2.4
Innovative SMEs collaborating with others 123.5 120.5 -3.1
Public-private co-publications 100.5 92.4 -8.1
Private co-funding of public R&D exp. 64.0 67.0 2.9
Intellectual assets 93.6 87.6 -6.0
PCT patent applications 102.6 106.0 3.4
Trademark applications 90.2 87.9 -2.2
Design applications 84.2 62.5 -21.6
Employment impacts 103.9 94.0 -9.9
Employment in knowledge-intensive activities 106.4 109.0 2.6
Employment fast-growing enterprises 102.0 83.1 -18.9
Sales impacts 100.3 108.5 8.3
Medium and high tech product exports 109.0 109.5 0.5
Knowledge-intensive services exports 91.6 100.0 8.4
Sales of new-to-market/firm innovations 99.9 117.4 17.5
Dark green: normalised performance above 120% of EU; light green: normalised performance between 90% and 120% of EU; yellow: normalised performance between 50% and 90% of EU; orange: normalised performance below 50% of EU. Normalised performance uses the data after a possible imputation of missing data and transformation of the data.
Change highlighted in green is positive; change highlighted in light red is negative.
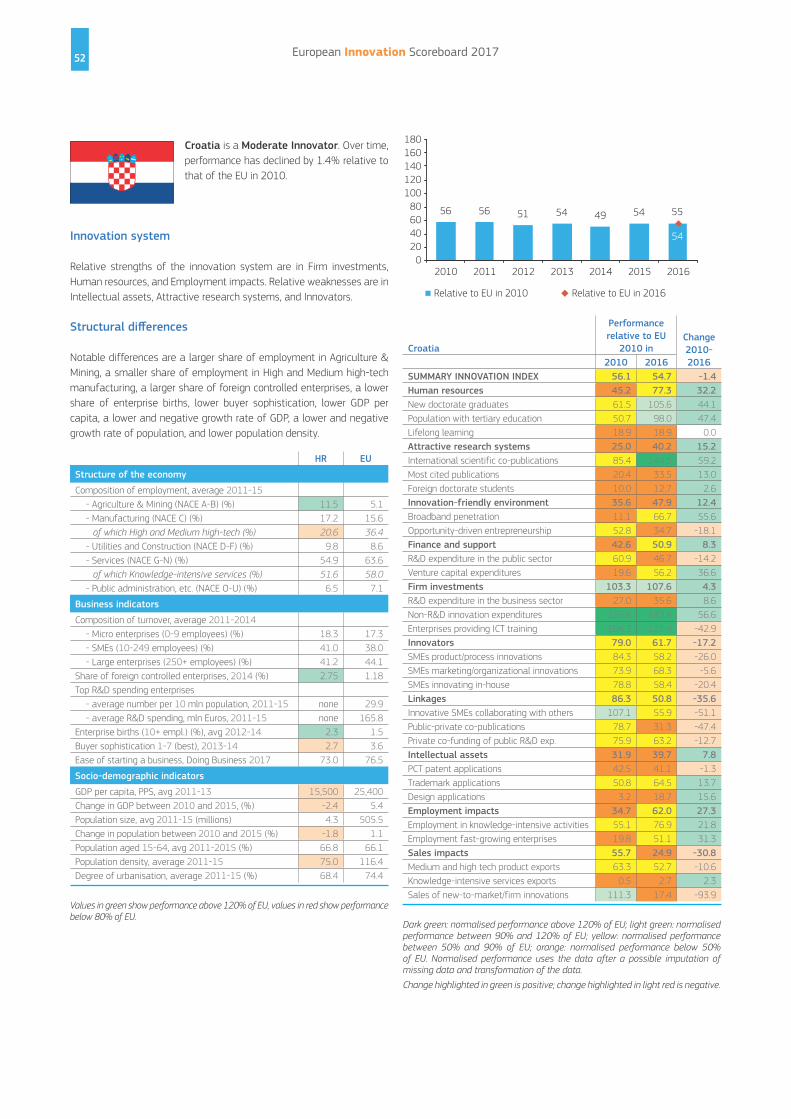
52 European Innovation Scoreboard 2017
Croatia is a Moderate Innovator. Over time,
performance has declined by 1.4% relative to
that of the EU in 2010.
Innovation system
Relative strengths of the innovation system are in Firm investments,
Human resources, and Employment impacts. Relative weaknesses are in
Intellectual assets, Attractive research systems, and Innovators.
Structural differences
Notable differences are a larger share of employment in Agriculture &
Mining, a smaller share of employment in High and Medium high-tech
manufacturing, a larger share of foreign controlled enterprises, a lower
share of enterprise births, lower buyer sophistication, lower GDP per
capita, a lower and negative growth rate of GDP, a lower and negative
growth rate of population, and lower population density.
HR EU
Structure of the economy
Composition of employment, average 2011-15
- Agriculture & Mining (NACE A-B) (%) 11.5 5.1
- Manufacturing (NACE C) (%) 17.2 15.6
of which High and Medium high-tech (%) 20.6 36.4
- Utilities and Construction (NACE D-F) (%) 9.8 8.6
- Services (NACE G-N) (%) 54.9 63.6
of which Knowledge-intensive services (%) 51.6 58.0
- Public administration, etc. (NACE O-U) (%) 6.5 7.1
Business indicators
Composition of turnover, average 2011-2014
- Micro enterprises (0-9 employees) (%) 18.3 17.3
- SMEs (10-249 employees) (%) 41.0 38.0
- Large enterprises (250+ employees) (%) 41.2 44.1
Share of foreign controlled enterprises, 2014 (%) 2.75 1.18
Top R&D spending enterprises
- average number per 10 mln population, 2011-15 none 29.9
- average R&D spending, mln Euros, 2011-15 none 165.8
Enterprise births (10+ empl.) (%), avg 2012-14 2.3 1.5
Buyer sophistication 1-7 (best), 2013-14 2.7 3.6
Ease of starting a business, Doing Business 2017 73.0 76.5
Socio-demographic indicators
GDP per capita, PPS, avg 2011-13 15,500 25,400
Change in GDP between 2010 and 2015, (%) -2.4 5.4
Population size, avg 2011-15 (millions) 4.3 505.5
Change in population between 2010 and 2015 (%) -1.8 1.1
Population aged 15-64, avg 2011-2015 (%) 66.8 66.1
Population density, average 2011-15 75.0 116.4
Degree of urbanisation, average 2011-15 (%) 68.4 74.4
Values in green show performance above 120% of EU, values in red show performance below 80% of EU.
56 56 51 54 49 54 55
54
0
20
40
60
80
100
120
140
160
180
2010 2011 2012 2013 2014 2015 2016
Relative to EU in 2010 Relative to EU in 2016
Croatia
Performance
relative to EU
2010 inChange
2010-
20162010 2016
SUMMARY INNOVATION INDEX 56.1 54.7 -1.4
Human resources 45.2 77.3 32.2
New doctorate graduates 61.5 105.6 44.1
Population with tertiary education 50.7 98.0 47.4
Lifelong learning 18.9 18.9 0.0
Attractive research systems 25.0 40.2 15.2
International scientific co-publications 85.4 144.5 59.2
Most cited publications 20.4 33.5 13.0
Foreign doctorate students 10.0 12.7 2.6
Innovation-friendly environment 35.6 47.9 12.4
Broadband penetration 11.1 66.7 55.6
Opportunity-driven entrepreneurship 52.8 34.7 -18.1
Finance and support 42.6 50.9 8.3
R&D expenditure in the public sector 60.9 46.7 -14.2
Venture capital expenditures 19.6 56.2 36.6
Firm investments 103.3 107.6 4.3
R&D expenditure in the business sector 27.0 35.6 8.6
Non-R&D innovation expenditures 126.8 183.4 56.6
Enterprises providing ICT training 164.3 121.4 -42.9
Innovators 79.0 61.7 -17.2
SMEs product/process innovations 84.3 58.2 -26.0
SMEs marketing/organizational innovations 73.9 68.3 -5.6
SMEs innovating in-house 78.8 58.4 -20.4
Linkages 86.3 50.8 -35.6
Innovative SMEs collaborating with others 107.1 55.9 -51.1
Public-private co-publications 78.7 31.3 -47.4
Private co-funding of public R&D exp. 75.9 63.2 -12.7
Intellectual assets 31.9 39.7 7.8
PCT patent applications 42.5 41.1 -1.3
Trademark applications 50.8 64.5 13.7
Design applications 3.2 18.7 15.6
Employment impacts 34.7 62.0 27.3
Employment in knowledge-intensive activities 55.1 76.9 21.8
Employment fast-growing enterprises 19.8 51.1 31.3
Sales impacts 55.7 24.9 -30.8
Medium and high tech product exports 63.3 52.7 -10.6
Knowledge-intensive services exports 0.5 2.7 2.3
Sales of new-to-market/firm innovations 111.3 17.4 -93.9
Dark green: normalised performance above 120% of EU; light green: normalised performance between 90% and 120% of EU; yellow: normalised performance between 50% and 90% of EU; orange: normalised performance below 50% of EU. Normalised performance uses the data after a possible imputation of missing data and transformation of the data.
Change highlighted in green is positive; change highlighted in light red is negative.

53European Innovation Scoreboard 2017
Italy is a Moderate Innovator. Over time,
performance has declined by 0.2% relative to
that of the EU in 2010.
Innovation system
Relative strengths of the innovation system are in Intellectual assets,
Attractive research systems, and Innovators. Relative weaknesses are in
Linkages, Finance and support, and Firm investments.
Structural differences
Notable differences are a smaller share of employment in Agriculture &
Mining, a larger share of micro enterprises in turnover, a smaller share
of large enterprises in turnover, a smaller share of foreign controlled
enterprises, a lower number of Top R&D spending enterprises, a smaller
share of enterprise births, a lower and negative growth rate of GDP,
a higher growth rate of population, and higher population density.
IT EU
Structure of the economy
Composition of employment, average 2011-15
- Agriculture & Mining (NACE A-B) (%) 3.8 5.1
- Manufacturing (NACE C) (%) 18.5 15.6
of which High and Medium high-tech (%) 32.2 36.4
- Utilities and Construction (NACE D-F) (%) 8.7 8.6
- Services (NACE G-N) (%) 63.0 63.6
of which Knowledge-intensive services (%) 55.6 58.0
- Public administration, etc. (NACE O-U) (%) 6.0 7.1
Business indicators
Composition of turnover, average 2011-2014
- Micro enterprises (0-9 employees) (%) 25.2 17.3
- SMEs (10-249 employees) (%) 43.1 38.0
- Large enterprises (250+ employees) (%) 31.2 44.1
Share of foreign controlled enterprises, 2014 (%) 0.33 1.18
Top R&D spending enterprises
- average number per 10 mln population, 2011-15 12.1 29.9
- average R&D spending, mln Euros, 2011-15 185.4 165.8
Enterprise births (10+ empl.) (%), avg 2012-14 1.1 1.5
Buyer sophistication 1-7 (best), 2013-14 3.8 3.6
Ease of starting a business, Doing Business 2017 72.3 76.5
Socio-demographic indicators
GDP per capita, PPS, avg 2011-13 25,400 25,400
Change in GDP between 2010 and 2015, (%) -3.2 5.4
Population size, avg 2011-15 (millions) 60.0 505.5
Change in population between 2010 and 2015 (%) 2.7 1.1
Population aged 15-64, avg 2011-2015 (%) 64.9 66.1
Population density, average 2011-15 200.9 116.4
Degree of urbanisation, average 2011-15 (%) 78.5 74.4
Values in green show performance above 120% of EU, values in red show performance below 80% of EU.
75 75 77 75 76 78 75
74
0
20
40
60
80
100
120
140
160
180
2010 2011 2012 2013 2014 2015 2016
Relative to EU in 2010 Relative to EU in 2016
Italy
Performance
relative to EU
2010 inChange
2010-
20162010 2016
SUMMARY INNOVATION INDEX 75.4 75.1 -0.2
Human resources 60.3 75.8 15.5
New doctorate graduates 107.7 102.2 -5.5
Population with tertiary education 17.8 49.3 31.6
Lifelong learning 52.6 74.7 22.1
Attractive research systems 73.3 95.1 21.8
International scientific co-publications 119.2 189.4 70.1
Most cited publications 88.8 99.3 10.4
Foreign doctorate students 34.4 55.5 21.0
Innovation-friendly environment 88.3 72.1 -16.2
Broadband penetration 55.6 55.6 0.0
Opportunity-driven entrepreneurship 111.4 83.8 -27.6
Finance and support 57.4 50.1 -7.3
R&D expenditure in the public sector 66.2 71.6 5.3
Venture capital expenditures 46.2 23.0 -23.2
Firm investments 58.7 61.9 3.2
R&D expenditure in the business sector 53.6 61.4 7.7
Non-R&D innovation expenditures 84.6 77.1 -7.5
Enterprises providing ICT training 42.9 50.0 7.1
Innovators 101.5 90.6 -10.8
SMEs product/process innovations 84.3 89.4 5.1
SMEs marketing/organizational innovations 102.3 81.4 -20.9
SMEs innovating in-house 117.6 101.3 -16.3
Linkages 48.6 44.2 -4.4
Innovative SMEs collaborating with others 48.0 55.4 7.4
Public-private co-publications 80.9 59.4 -21.5
Private co-funding of public R&D exp. 21.3 21.9 0.6
Intellectual assets 100.8 106.3 5.6
PCT patent applications 73.2 76.4 3.2
Trademark applications 95.5 115.9 20.4
Design applications 141.9 139.4 -2.6
Employment impacts 73.6 71.4 -2.2
Employment in knowledge-intensive activities 102.6 105.1 2.6
Employment fast-growing enterprises 52.5 46.8 -5.6
Sales impacts 81.3 75.9 -5.4
Medium and high tech product exports 90.7 91.5 0.8
Knowledge-intensive services exports 68.0 66.2 -1.8
Sales of new-to-market/firm innovations 85.5 68.4 -17.1
Dark green: normalised performance above 120% of EU; light green: normalised performance between 90% and 120% of EU; yellow: normalised performance between 50% and 90% of EU; orange: normalised performance below 50% of EU. Normalised performance uses the data after a possible imputation of missing data and transformation of the data.
Change highlighted in green is positive; change highlighted in light red is negative.

54 European Innovation Scoreboard 2017
Cyprus is a Moderate Innovator. Over time,
performance has declined by 12.7% relative
to that of the EU in 2010.
Innovation system
Relative strengths of the innovation system are in Attractive research
systems, Human resources, and Intellectual assets. Relative weaknesses
are in Linkages, Finance and support, and Firm investments.
Structural differences
Notable differences are a smaller share of employment in Agriculture
& Mining, a smaller share of employment in Manufacturing and High
and Medium high-tech manufacturing, a larger share of employment in
Utilities and Construction, a larger share of micro enterprises and SMEs
in turnover, a smaller share of large enterprises in turnover, a smaller
share of foreign controlled enterprises, a lower number of Top R&D
spending enterprises and a lower average R&D spending of these
enterprises, a lower and negative growth rate of GDP, a higher growth
rate of population, and lower population density.
CY EU
Structure of the economy
Composition of employment, average 2011-15
- Agriculture & Mining (NACE A-B) (%) 3.7 5.1
- Manufacturing (NACE C) (%) 7.7 15.6
of which High and Medium high-tech (%) 10.7 36.4
- Utilities and Construction (NACE D-F) (%) 10.5 8.6
- Services (NACE G-N) (%) 70.5 63.6
of which Knowledge-intensive services (%) 55.6 58.0
- Public administration, etc. (NACE O-U) (%) 7.6 7.1
Business indicators
Composition of turnover, average 2011-2014
- Micro enterprises (0-9 employees) (%) 24.0 17.3
- SMEs (10-249 employees) (%) 55.8 38.0
- Large enterprises (250+ employees) (%) 20.3 44.1
Share of foreign controlled enterprises, 2014 (%) 0.66 1.18
Top R&D spending enterprises
- average number per 10 mln population, 2011-15 3.3 29.9
- average R&D spending, mln Euros, 2011-15 13.7 165.8
Enterprise births (10+ empl.) (%), avg 2012-14 1.4 1.5
Buyer sophistication 1-7 (best), 2013-14 3.8 3.6
Ease of starting a business, Doing Business 2017 72.7 76.5
Socio-demographic indicators
GDP per capita, PPS, avg 2011-13 23,000 25,400
Change in GDP between 2010 and 2015, (%) -8.5 5.4
Population size, avg 2011-15 (millions) 0.9 505.5
Change in population between 2010 and 2015 (%) 3.4 1.1
Population aged 15-64, avg 2011-2015 (%) 70.1 66.1
Population density, average 2011-15 92.8 116.4
Degree of urbanisation, average 2011-15 (%) 75.1 74.4
Values in green show performance above 120% of EU, values in red show performance below 80% of EU.
87 91 86 8974 75 75
73
0
20
40
60
80
100
120
140
160
180
2010 2011 2012 2013 2014 2015 2016
Relative to EU in 2010 Relative to EU in 2016
Cyprus
Performance
relative to EU
2010 inChange
2010-
20162010 2016
SUMMARY INNOVATION INDEX 87.5 74.8 -12.7
Human resources 89.8 111.2 21.4
New doctorate graduates 0.0 27.0 27.0
Population with tertiary education 197.4 242.1 44.7
Lifelong learning 72.6 60.0 -12.6
Attractive research systems 67.6 116.2 48.6
International scientific co-publications 202.9 375.5 172.6
Most cited publications 53.6 99.7 46.1
Foreign doctorate students 39.7 47.8 8.1
Innovation-friendly environment 38.9 52.7 13.8
Broadband penetration 0.0 33.3 33.3
Opportunity-driven entrepreneurship 66.4 66.4 0.0
Finance and support 53.4 46.7 -6.7
R&D expenditure in the public sector 25.4 25.4 0.0
Venture capital expenditures 88.8 73.7 -15.2
Firm investments 136.4 49.0 -87.4
R&D expenditure in the business sector 5.6 4.7 -0.9
Non-R&D innovation expenditures 270.9 17.0 -253.9
Enterprises providing ICT training 164.3 121.4 -42.9
Innovators 135.9 86.7 -49.2
SMEs product/process innovations 130.5 90.1 -40.4
SMEs marketing/organizational innovations 125.7 69.3 -56.5
SMEs innovating in-house 151.7 101.1 -50.5
Linkages 84.7 43.8 -40.9
Innovative SMEs collaborating with others 201.6 105.0 -96.6
Public-private co-publications 64.9 36.5 -28.4
Private co-funding of public R&D exp. 6.0 0.0 -6.0
Intellectual assets 71.6 111.2 39.6
PCT patent applications 34.5 46.4 11.8
Trademark applications 195.2 275.8 80.6
Design applications 26.9 72.5 45.7
Employment impacts 56.4 60.0 3.5
Employment in knowledge-intensive activities 111.5 135.9 24.4
Employment fast-growing enterprises 16.2 4.5 -11.7
Sales impacts 98.1 63.5 -34.6
Medium and high tech product exports 67.9 67.0 -0.9
Knowledge-intensive services exports 104.0 102.8 -1.2
Sales of new-to-market/firm innovations 127.7 13.4 -114.4
Dark green: normalised performance above 120% of EU; light green: normalised performance between 90% and 120% of EU; yellow: normalised performance between 50% and 90% of EU; orange: normalised performance below 50% of EU. Normalised performance uses the data after a possible imputation of missing data and transformation of the data.
Change highlighted in green is positive; change highlighted in light red is negative.

55European Innovation Scoreboard 2017
Latvia is a Moderate Innovator. Over time,
performance has increased by 8.5% relative
to that of the EU in 2010.
Innovation system
Relative strengths of the innovation system are in Innovation-friendly
environment, Human resources, and Employment impacts. Relative
weaknesses are in Innovators, Attractive research systems, and Linkages.
Structural differences
Notable differences are a larger share of employment in Agriculture &
Mining, a smaller share of employment in High and Medium high-tech
manufacturing, a larger share of micro enterprises and SMEs in turnover,
a smaller share of large enterprises in turnover, a larger share of foreign
controlled enterprises, lower GDP per capita, a higher growth rate of GDP,
a lower and negative growth rate of population, and lower population
density.
LV EU
Structure of the economy
Composition of employment, average 2011-15
- Agriculture & Mining (NACE A-B) (%) 8.5 5.1
- Manufacturing (NACE C) (%) 13.6 15.6
of which High and Medium high-tech (%) 11.4 36.4
- Utilities and Construction (NACE D-F) (%) 9.6 8.6
- Services (NACE G-N) (%) 61.5 63.6
of which Knowledge-intensive services (%) 51.2 58.0
- Public administration, etc. (NACE O-U) (%) 6.8 7.1
Business indicators
Composition of turnover, average 2011-2014
- Micro enterprises (0-9 employees) (%) 26.1 17.3
- SMEs (10-249 employees) (%) 51.4 38.0
- Large enterprises (250+ employees) (%) 22.5 44.1
Share of foreign controlled enterprises, 2014 (%) 6.13 1.18
Top R&D spending enterprises
- average number per 10 mln population, 2011-15 none 29.9
- average R&D spending, mln Euros, 2011-15 none 165.8
Enterprise births (10+ empl.) (%), avg 2012-14 2.0 1.5
Buyer sophistication 1-7 (best), 2013-14 3.1 3.6
Ease of starting a business, Doing Business 2017 80.6 76.5
Socio-demographic indicators
GDP per capita, PPS, avg 2011-13 16,200 25,400
Change in GDP between 2010 and 2015, (%) 19.2 5.4
Population size, avg 2011-15 (millions) 2.0 505.5
Change in population between 2010 and 2015 (%) -6.3 1.1
Population aged 15-64, avg 2011-2015 (%) 66.7 66.1
Population density, average 2011-15 32.4 116.4
Degree of urbanisation, average 2011-15 (%) 62.4 74.4
Values in green show performance above 120% of EU, values in red show performance below 80% of EU.
50 52 48 49 55 61 58
57
0
20
40
60
80
100
120
140
160
180
2010 2011 2012 2013 2014 2015 2016
Relative to EU in 2010 Relative to EU in 2016
Latvia
Performance
relative to EU
2010 inChange
2010-
20162010 2016
SUMMARY INNOVATION INDEX 49.6 58.1 8.5
Human resources 61.9 93.2 31.3
New doctorate graduates 30.8 54.5 23.7
Population with tertiary education 109.2 157.9 48.7
Lifelong learning 44.2 64.2 20.0
Attractive research systems 14.1 37.6 23.5
International scientific co-publications 21.4 75.5 54.1
Most cited publications 20.5 28.7 8.3
Foreign doctorate students 2.3 36.9 34.6
Innovation-friendly environment 122.7 160.1 37.4
Broadband penetration 200.0 244.4 44.4
Opportunity-driven entrepreneurship 68.1 100.5 32.4
Finance and support 39.4 75.9 36.6
R&D expenditure in the public sector 23.6 55.6 32.0
Venture capital expenditures 59.3 101.6 42.3
Firm investments 68.5 44.0 -24.5
R&D expenditure in the business sector 11.6 10.7 -0.9
Non-R&D innovation expenditures 182.3 79.7 -102.6
Enterprises providing ICT training 35.7 50.0 14.3
Innovators 20.0 11.9 -8.1
SMEs product/process innovations 22.9 0.0 -22.9
SMEs marketing/organizational innovations 9.5 27.0 17.5
SMEs innovating in-house 27.9 8.4 -19.5
Linkages 33.3 41.4 8.1
Innovative SMEs collaborating with others 20.9 15.8 -5.1
Public-private co-publications 20.5 0.1 -20.3
Private co-funding of public R&D exp. 54.3 97.7 43.4
Intellectual assets 66.2 49.8 -16.3
PCT patent applications 44.8 28.7 -16.1
Trademark applications 105.4 102.6 -2.8
Design applications 64.9 37.9 -26.9
Employment impacts 55.4 84.5 29.1
Employment in knowledge-intensive activities 48.7 69.2 20.5
Employment fast-growing enterprises 60.4 95.7 35.4
Sales impacts 47.2 46.7 -0.6
Medium and high tech product exports 38.1 43.6 5.4
Knowledge-intensive services exports 73.8 71.5 -2.3
Sales of new-to-market/firm innovations 27.1 21.4 -5.7
Dark green: normalised performance above 120% of EU; light green: normalised performance between 90% and 120% of EU; yellow: normalised performance between 50% and 90% of EU; orange: normalised performance below 50% of EU. Normalised performance uses the data after a possible imputation of missing data and transformation of the data.
Change highlighted in green is positive; change highlighted in light red is negative.

56 European Innovation Scoreboard 2017
Lithuania is a Moderate Innovator. Over
time, performance has increased by 21.0%
relative to that of the EU in 2010.
Innovation system
Relative strengths of the innovation system are in Innovation-friendly
environment, Human resources, and Linkages. Relative weaknesses are
in Sales impacts, Attractive research systems, and Intellectual assets.
Structural differences
Notable differences are a larger share of employment in Agriculture
& Mining, a smaller share of employment in High and Medium high-
tech manufacturing, a larger share of SMEs in turnover, a smaller share
of large enterprises in turnover, a larger share of foreign controlled
enterprises, a larger share of enterprise births, lower GDP per capita,
a higher growth rate of GDP, a lower and negative growth rate of
population, and lower population density.
LT EU
Structure of the economy
Composition of employment, average 2011-15
- Agriculture & Mining (NACE A-B) (%) 9.0 5.1
- Manufacturing (NACE C) (%) 15.4 15.6
of which High and Medium high-tech (%) 12.1 36.4
- Utilities and Construction (NACE D-F) (%) 9.4 8.6
- Services (NACE G-N) (%) 60.2 63.6
of which Knowledge-intensive services (%) 50.0 58.0
- Public administration, etc. (NACE O-U) (%) 6.0 7.1
Business indicators
Composition of turnover, average 2011-2014
- Micro enterprises (0-9 employees) (%) 17.0 17.3
- SMEs (10-249 employees) (%) 48.2 38.0
- Large enterprises (250+ employees) (%) 34.7 44.1
Share of foreign controlled enterprises, 2014 (%) 2.23 1.18
Top R&D spending enterprises
- average number per 10 mln population, 2011-15 none 29.9
- average R&D spending, mln Euros, 2011-15 none 165.8
Enterprise births (10+ empl.) (%), avg 2012-14 2.4 1.5
Buyer sophistication 1-7 (best), 2013-14 3.2 3.6
Ease of starting a business, Doing Business 2017 78.8 76.5
Socio-demographic indicators
GDP per capita, PPS, avg 2011-13 18,100 25,400
Change in GDP between 2010 and 2015, (%) 20.1 5.4
Population size, avg 2011-15 (millions) 3.0 505.5
Change in population between 2010 and 2015 (%) -7.0 1.1
Population aged 15-64, avg 2011-2015 (%) 67.0 66.1
Population density, average 2011-15 47.2 116.4
Degree of urbanisation, average 2011-15 (%) 42.6 74.4
Values in green show performance above 120% of EU, values in red show performance below 80% of EU.
58 58 61 62 61 6579
78
0
20
40
60
80
100
120
140
160
180
2010 2011 2012 2013 2014 2015 2016
Relative to EU in 2010 Relative to EU in 2016
Lithuania
Performance
relative to EU
2010 inChange
2010-
20162010 2016
SUMMARY INNOVATION INDEX 58.3 79.4 21.0
Human resources 96.2 124.0 27.8
New doctorate graduates 61.5 70.7 9.1
Population with tertiary education 185.5 242.1 56.6
Lifelong learning 33.7 50.5 16.8
Attractive research systems 36.5 34.6 -1.9
International scientific co-publications 48.8 119.7 70.8
Most cited publications 56.1 26.6 -29.5
Foreign doctorate students 3.8 15.9 12.1
Innovation-friendly environment 107.0 138.9 31.9
Broadband penetration 177.8 233.3 55.6
Opportunity-driven entrepreneurship 57.0 72.3 15.3
Finance and support 49.2 97.2 48.0
R&D expenditure in the public sector 82.2 107.1 24.9
Venture capital expenditures 7.5 84.8 77.2
Firm investments 49.0 100.3 51.3
R&D expenditure in the business sector 15.0 21.9 6.9
Non-R&D innovation expenditures 109.1 280.8 171.6
Enterprises providing ICT training 35.7 35.7 0.0
Innovators 43.0 79.4 36.4
SMEs product/process innovations 43.2 93.8 50.6
SMEs marketing/organizational innovations 35.5 44.5 9.0
SMEs innovating in-house 50.5 100.7 50.2
Linkages 99.9 108.6 8.7
Innovative SMEs collaborating with others 68.5 140.3 71.8
Public-private co-publications 39.1 2.4 -36.7
Private co-funding of public R&D exp. 177.9 173.9 -3.9
Intellectual assets 34.9 52.9 18.0
PCT patent applications 38.5 46.4 7.9
Trademark applications 57.0 93.0 36.0
Design applications 13.0 30.9 17.9
Employment impacts 66.7 66.6 -0.2
Employment in knowledge-intensive activities 38.5 51.3 12.8
Employment fast-growing enterprises 87.4 77.7 -9.7
Sales impacts 32.2 33.5 1.4
Medium and high tech product exports 37.0 43.0 5.9
Knowledge-intensive services exports 0.3 6.7 6.4
Sales of new-to-market/firm innovations 63.7 53.7 -10.0
Dark green: normalised performance above 120% of EU; light green: normalised performance between 90% and 120% of EU; yellow: normalised performance between 50% and 90% of EU; orange: normalised performance below 50% of EU. Normalised performance uses the data after a possible imputation of missing data and transformation of the data.
Change highlighted in green is positive; change highlighted in light red is negative.

57European Innovation Scoreboard 2017
Luxembourg is a Strong Innovator. Over
time, performance has increased by 1.4%
relative to that of the EU in 2010.
Innovation system
Relative strengths of the innovation system are in Attractive research
systems, Innovation-friendly environment, and Intellectual assets.
Relative weaknesses are in Linkages, Finance and support, and Sales
impacts.
Structural differences
Notable differences are a smaller share of employment in Agriculture
& Mining, in Manufacturing and in High and Medium high-tech
manufacturing, a larger share of employment in Knowledge-intensive
services and in Public administration, a larger share of SMEs in turnover,
a smaller share of large enterprises in turnover, a larger share of foreign
controlled enterprises, a higher number of Top R&D spending enterprises
but a lower average R&D spending of these enterprises, a smaller share
of enterprise births, higher buyer sophistication, higher GDP per capita,
a higher growth rate of GDP, a higher growth rate of population, and
higher population density.
LU EU
Structure of the economy
Composition of employment, average 2011-15
- Agriculture & Mining (NACE A-B) (%) 1.3 5.1
- Manufacturing (NACE C) (%) 5.4 15.6
of which High and Medium high-tech (%) 17.9 36.4
- Utilities and Construction (NACE D-F) (%) 6.9 8.6
- Services (NACE G-N) (%) 68.3 63.6
of which Knowledge-intensive services (%) 73.5 58.0
- Public administration, etc. (NACE O-U) (%) 18.1 7.1
Business indicators
Composition of turnover, average 2011-2014
- Micro enterprises (0-9 employees) (%) 14.8 17.3
- SMEs (10-249 employees) (%) 57.3 38.0
- Large enterprises (250+ employees) (%) 27.9 44.1
Share of foreign controlled enterprises, 2014 (%) 29.47 1.18
Top R&D spending enterprises
- average number per 10 mln population, 2011-15 388.7 29.9
- average R&D spending, mln Euros, 2011-15 35.4 165.8
Enterprise births (10+ empl.) (%), avg 2012-14 1.1 1.5
Buyer sophistication 1-7 (best), 2013-14 4.7 3.6
Ease of starting a business, Doing Business 2017 68.8 76.5
Socio-demographic indicators
GDP per capita, PPS, avg 2011-13 67,200 25,400
Change in GDP between 2010 and 2015, (%) 15.2 5.4
Population size, avg 2011-15 (millions) 0.5 505.5
Change in population between 2010 and 2015 (%) 12.1 1.1
Population aged 15-64, avg 2011-2015 (%) 68.9 66.1
Population density, average 2011-15 210.2 116.4
Degree of urbanisation, average 2011-15 (%) 62.0 74.4
Values in green show performance above 120% of EU, values in red show performance below 80% of EU.
120 123 130 130 125 125 121
119
0
20
40
60
80
100
120
140
160
180
2010 2011 2012 2013 2014 2015 2016
Relative to EU in 2010 Relative to EU in 2016
Luxembourg
Performance
relative to EU
2010 inChange
2010-
20162010 2016
SUMMARY INNOVATION INDEX 120.0 121.4 1.4
Human resources 128.3 147.0 18.7
New doctorate graduates 46.2 62.4 16.3
Population with tertiary education 171.7 219.7 48.0
Lifelong learning 176.8 164.2 -12.6
Attractive research systems 161.2 215.1 54.0
International scientific co-publications 280.5 572.4 291.9
Most cited publications 83.2 115.8 32.6
Foreign doctorate students 231.4 231.4 0.0
Innovation-friendly environment 174.7 172.9 -1.9
Broadband penetration 144.4 233.3 88.9
Opportunity-driven entrepreneurship 196.1 130.2 -65.9
Finance and support 114.5 69.3 -45.3
R&D expenditure in the public sector 46.7 85.8 39.1
Venture capital expenditures 200.2 48.5 -151.7
Firm investments 68.4 81.5 13.1
R&D expenditure in the business sector 58.8 55.4 -3.4
Non-R&D innovation expenditures 24.5 4.9 -19.6
Enterprises providing ICT training 114.3 171.4 57.1
Innovators 135.2 122.6 -12.6
SMEs product/process innovations 127.3 107.8 -19.5
SMEs marketing/organizational innovations 145.2 150.1 4.9
SMEs innovating in-house 132.6 109.1 -23.5
Linkages 69.7 44.2 -25.4
Innovative SMEs collaborating with others 111.7 80.0 -31.6
Public-private co-publications 92.8 42.4 -50.4
Private co-funding of public R&D exp. 15.4 16.5 1.1
Intellectual assets 141.0 166.8 25.8
PCT patent applications 67.3 71.8 4.4
Trademark applications 275.8 275.8 0.0
Design applications 137.0 211.3 74.3
Employment impacts 126.1 139.8 13.6
Employment in knowledge-intensive activities 220.5 217.9 -2.6
Employment fast-growing enterprises 57.2 82.7 25.5
Sales impacts 108.0 94.4 -13.7
Medium and high tech product exports 114.3 91.7 -22.5
Knowledge-intensive services exports 145.5 149.0 3.4
Sales of new-to-market/firm innovations 56.6 33.6 -23.0
Dark green: normalised performance above 120% of EU; light green: normalised performance between 90% and 120% of EU; yellow: normalised performance between 50% and 90% of EU; orange: normalised performance below 50% of EU. Normalised performance uses the data after a possible imputation of missing data and transformation of the data.
Change highlighted in green is positive; change highlighted in light red is negative.

58 European Innovation Scoreboard 2017
Hungary is a Moderate Innovator. Over
time, performance has declined by 3.5%
relative to that of the EU in 2010.
Innovation system
Relative strengths of the innovation system are in Employment
impacts, Sales impacts, and Innovation-friendly environment. Relative
weaknesses are in Innovators, Finance and support, and Intellectual
assets.
Structural differences
Notable differences are a larger share of employment in Manufacturing
and in Public administration, a larger share of foreign controlled
enterprises, a lower number of Top R&D spending enterprises and
a lower average R&D spending of these enterprises, a larger share
of enterprise births, lower buyer sophistication, lower GDP per capita,
a higher growth rate of GDP, and a lower and negative growth rate of
population.
HU EU
Structure of the economy
Composition of employment, average 2011-15
- Agriculture & Mining (NACE A-B) (%) 5.1 5.1
- Manufacturing (NACE C) (%) 21.2 15.6
of which High and Medium high-tech (%) 41.2 36.4
- Utilities and Construction (NACE D-F) (%) 8.8 8.6
- Services (NACE G-N) (%) 55.9 63.6
of which Knowledge-intensive services (%) 53.2 58.0
- Public administration, etc. (NACE O-U) (%) 8.9 7.1
Business indicators
Composition of turnover, average 2011-2014
- Micro enterprises (0-9 employees) (%) 20.4 17.3
- SMEs (10-249 employees) (%) 36.6 38.0
- Large enterprises (250+ employees) (%) 43.4 44.1
Share of foreign controlled enterprises, 2014 (%) 3.47 1.18
Top R&D spending enterprises
- average number per 10 mln population, 2011-15 1.8 29.9
- average R&D spending, mln Euros, 2011-15 108.8 165.8
Enterprise births (10+ empl.) (%), avg 2012-14 1.8 1.5
Buyer sophistication 1-7 (best), 2013-14 2.7 3.6
Ease of starting a business, Doing Business 2017 73.1 76.5
Socio-demographic indicators
GDP per capita, PPS, avg 2011-13 17,000 25,400
Change in GDP between 2010 and 2015, (%) 9.7 5.4
Population size, avg 2011-15 (millions) 9.9 505.5
Change in population between 2010 and 2015 (%) -1.6 1.1
Population aged 15-64, avg 2011-2015 (%) 68.3 66.1
Population density, average 2011-15 106.5 116.4
Degree of urbanisation, average 2011-15 (%) 65.8 74.4
Values in green show performance above 120% of EU, values in red show performance below 80% of EU.
71 71 66 66 67 67 67
66
0
20
40
60
80
100
120
140
160
180
2010 2011 2012 2013 2014 2015 2016
Relative to EU in 2010 Relative to EU in 2016
Hungary
Performance
relative to EU
2010 inChange
2010-
20162010 2016
SUMMARY INNOVATION INDEX 70.9 67.4 -3.5
Human resources 55.9 64.8 8.9
New doctorate graduates 53.8 58.5 4.6
Population with tertiary education 52.6 80.9 28.3
Lifelong learning 62.1 53.7 -8.4
Attractive research systems 54.4 55.5 1.1
International scientific co-publications 87.9 137.6 49.7
Most cited publications 63.6 53.1 -10.5
Foreign doctorate students 29.3 29.8 0.5
Innovation-friendly environment 78.9 93.4 14.5
Broadband penetration 100.0 133.3 33.3
Opportunity-driven entrepreneurship 63.9 65.2 1.3
Finance and support 48.6 44.4 -4.2
R&D expenditure in the public sector 55.6 34.3 -21.3
Venture capital expenditures 39.8 57.2 17.5
Firm investments 72.3 88.9 16.6
R&D expenditure in the business sector 53.6 84.5 30.9
Non-R&D innovation expenditures 106.1 107.1 1.0
Enterprises providing ICT training 64.3 78.6 14.3
Innovators 24.4 14.4 -10.0
SMEs product/process innovations 21.2 13.7 -7.5
SMEs marketing/organizational innovations 32.4 14.0 -18.4
SMEs innovating in-house 19.5 15.5 -3.9
Linkages 89.7 60.4 -29.3
Innovative SMEs collaborating with others 59.7 50.0 -9.6
Public-private co-publications 76.9 76.5 -0.4
Private co-funding of public R&D exp. 125.3 54.9 -70.4
Intellectual assets 45.9 46.9 1.0
PCT patent applications 60.5 59.6 -0.9
Trademark applications 52.3 59.5 7.2
Design applications 21.4 20.1 -1.3
Employment impacts 128.0 126.7 -1.3
Employment in knowledge-intensive activities 89.7 83.3 -6.4
Employment fast-growing enterprises 155.9 158.3 2.5
Sales impacts 111.8 98.0 -13.8
Medium and high tech product exports 143.1 139.8 -3.3
Knowledge-intensive services exports 62.9 59.9 -3.0
Sales of new-to-market/firm innovations 131.4 92.1 -39.2
Dark green: normalised performance above 120% of EU; light green: normalised performance between 90% and 120% of EU; yellow: normalised performance between 50% and 90% of EU; orange: normalised performance below 50% of EU. Normalised performance uses the data after a possible imputation of missing data and transformation of the data.
Change highlighted in green is positive; change highlighted in light red is negative.
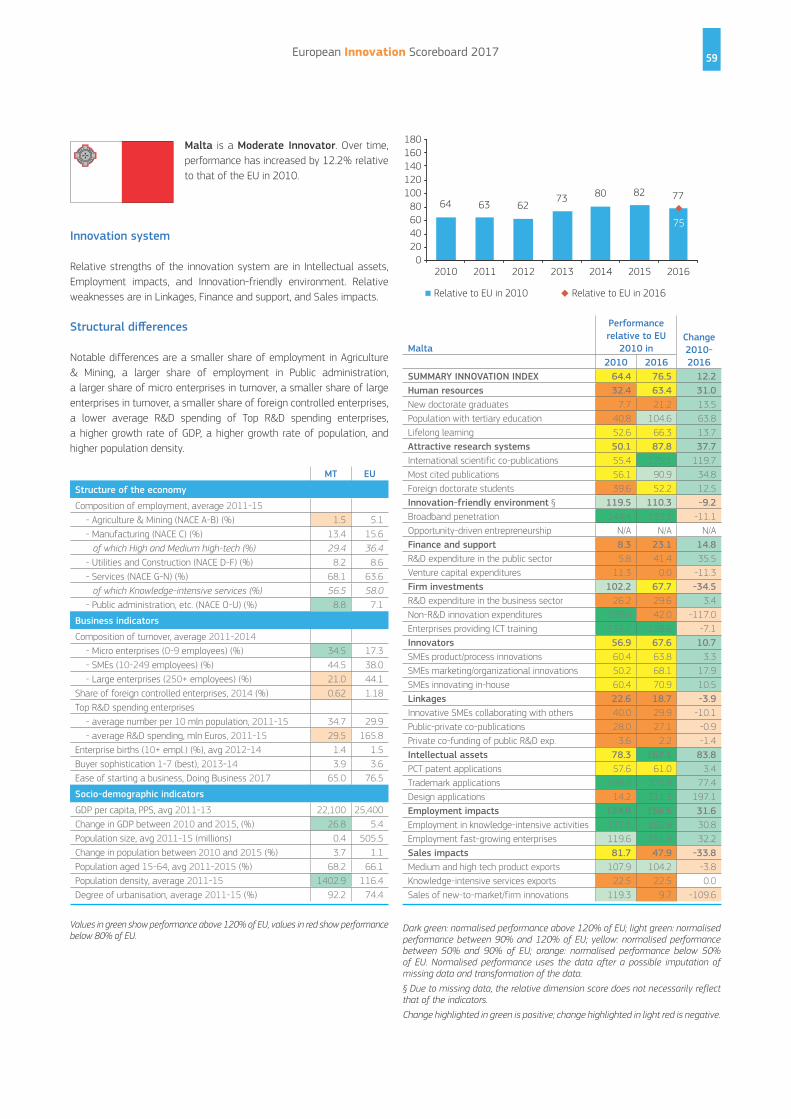
59European Innovation Scoreboard 2017
Malta is a Moderate Innovator. Over time,
performance has increased by 12.2% relative
to that of the EU in 2010.
Innovation system
Relative strengths of the innovation system are in Intellectual assets,
Employment impacts, and Innovation-friendly environment. Relative
weaknesses are in Linkages, Finance and support, and Sales impacts.
Structural differences
Notable differences are a smaller share of employment in Agriculture
& Mining, a larger share of employment in Public administration,
a larger share of micro enterprises in turnover, a smaller share of large
enterprises in turnover, a smaller share of foreign controlled enterprises,
a lower average R&D spending of Top R&D spending enterprises,
a higher growth rate of GDP, a higher growth rate of population, and
higher population density.
MT EU
Structure of the economy
Composition of employment, average 2011-15
- Agriculture & Mining (NACE A-B) (%) 1.5 5.1
- Manufacturing (NACE C) (%) 13.4 15.6
of which High and Medium high-tech (%) 29.4 36.4
- Utilities and Construction (NACE D-F) (%) 8.2 8.6
- Services (NACE G-N) (%) 68.1 63.6
of which Knowledge-intensive services (%) 56.5 58.0
- Public administration, etc. (NACE O-U) (%) 8.8 7.1
Business indicators
Composition of turnover, average 2011-2014
- Micro enterprises (0-9 employees) (%) 34.5 17.3
- SMEs (10-249 employees) (%) 44.5 38.0
- Large enterprises (250+ employees) (%) 21.0 44.1
Share of foreign controlled enterprises, 2014 (%) 0.62 1.18
Top R&D spending enterprises
- average number per 10 mln population, 2011-15 34.7 29.9
- average R&D spending, mln Euros, 2011-15 29.5 165.8
Enterprise births (10+ empl.) (%), avg 2012-14 1.4 1.5
Buyer sophistication 1-7 (best), 2013-14 3.9 3.6
Ease of starting a business, Doing Business 2017 65.0 76.5
Socio-demographic indicators
GDP per capita, PPS, avg 2011-13 22,100 25,400
Change in GDP between 2010 and 2015, (%) 26.8 5.4
Population size, avg 2011-15 (millions) 0.4 505.5
Change in population between 2010 and 2015 (%) 3.7 1.1
Population aged 15-64, avg 2011-2015 (%) 68.2 66.1
Population density, average 2011-15 1402.9 116.4
Degree of urbanisation, average 2011-15 (%) 92.2 74.4
Values in green show performance above 120% of EU, values in red show performance below 80% of EU.
0
20
40
60
80
100
120
140
160
180
2010 2011 2012 2013 2014 2015 2016
Relative to EU in 2010 Relative to EU in 2016
64 63 6273
80 82 77
75
Malta
Performance
relative to EU
2010 inChange
2010-
20162010 2016
SUMMARY INNOVATION INDEX 64.4 76.5 12.2
Human resources 32.4 63.4 31.0
New doctorate graduates 7.7 21.2 13.5
Population with tertiary education 40.8 104.6 63.8
Lifelong learning 52.6 66.3 13.7
Attractive research systems 50.1 87.8 37.7
International scientific co-publications 55.4 175.1 119.7
Most cited publications 56.1 90.9 34.8
Foreign doctorate students 39.6 52.2 12.5
Innovation-friendly environment § 119.5 110.3 -9.2
Broadband penetration 144.4 133.3 -11.1
Opportunity-driven entrepreneurship N/A N/A N/A
Finance and support 8.3 23.1 14.8
R&D expenditure in the public sector 5.8 41.4 35.5
Venture capital expenditures 11.3 0.0 -11.3
Firm investments 102.2 67.7 -34.5
R&D expenditure in the business sector 26.2 29.6 3.4
Non-R&D innovation expenditures 159.0 42.0 -117.0
Enterprises providing ICT training 135.7 128.6 -7.1
Innovators 56.9 67.6 10.7
SMEs product/process innovations 60.4 63.8 3.3
SMEs marketing/organizational innovations 50.2 68.1 17.9
SMEs innovating in-house 60.4 70.9 10.5
Linkages 22.6 18.7 -3.9
Innovative SMEs collaborating with others 40.0 29.9 -10.1
Public-private co-publications 28.0 27.1 -0.9
Private co-funding of public R&D exp. 3.6 2.2 -1.4
Intellectual assets 78.3 162.1 83.8
PCT patent applications 57.6 61.0 3.4
Trademark applications 198.3 275.8 77.4
Design applications 14.2 211.3 197.1
Employment impacts 124.9 156.5 31.6
Employment in knowledge-intensive activities 132.1 162.8 30.8
Employment fast-growing enterprises 119.6 151.8 32.2
Sales impacts 81.7 47.9 -33.8
Medium and high tech product exports 107.9 104.2 -3.8
Knowledge-intensive services exports 22.5 22.5 0.0
Sales of new-to-market/firm innovations 119.3 9.7 -109.6
Dark green: normalised performance above 120% of EU; light green: normalised performance between 90% and 120% of EU; yellow: normalised performance between 50% and 90% of EU; orange: normalised performance below 50% of EU. Normalised performance uses the data after a possible imputation of missing data and transformation of the data.
§ Due to missing data, the relative dimension score does not necessarily reflect that of the indicators.
Change highlighted in green is positive; change highlighted in light red is negative.

60 European Innovation Scoreboard 2017
The Netherlands is an Innovation Leader.
Over time, performance has increased by
10.4% relative to that of the EU in 2010.
Innovation system
Relative strengths of the innovation system are in Attractive research
systems, Human resources, and Linkages. Relative weaknesses are in
Firm investments, Sales impacts, and Intellectual assets.
Structural differences
Notable differences are a smaller share of employment in Agriculture &
Mining, Manufacturing, High and Medium high-tech manufacturing and
Utilities and Construction, a larger share of SMEs in turnover, a higher
number of Top R&D spending enterprises and a higher average R&D
spending of these enterprises, higher GDP per capita, a lower growth
rate of GDP, a higher growth rate of population, and higher population
density.
NL EU
Structure of the economy
Composition of employment, average 2011-15
- Agriculture & Mining (NACE A-B) (%) 2.6 5.1
- Manufacturing (NACE C) (%) 10.2 15.6
of which High and Medium high-tech (%) 28.9 36.4
- Utilities and Construction (NACE D-F) (%) 6.4 8.6
- Services (NACE G-N) (%) 74.1 63.6
of which Knowledge-intensive services (%) 63.5 58.0
- Public administration, etc. (NACE O-U) (%) 6.7 7.1
Business indicators
Composition of turnover, average 2011-2014
- Micro enterprises (0-9 employees) (%) 14.6 17.3
- SMEs (10-249 employees) (%) 48.6 38.0
- Large enterprises (250+ employees) (%) 36.8 44.1
Share of foreign controlled enterprises, 2014 (%) 1.14 1.18
Top R&D spending enterprises
- average number per 10 mln population, 2011-15 46.0 29.9
- average R&D spending, mln Euros, 2011-15 271.5 165.8
Enterprise births (10+ empl.) (%), avg 2012-14 1.2 1.5
Buyer sophistication 1-7 (best), 2013-14 4.3 3.6
Ease of starting a business, Doing Business 2017 76.4 76.5
Socio-demographic indicators
GDP per capita, PPS, avg 2011-13 32,500 25,400
Change in GDP between 2010 and 2015, (%) 3.8 5.4
Population size, avg 2011-15 (millions) 16.8 505.5
Change in population between 2010 and 2015 (%) 2.0 1.1
Population aged 15-64, avg 2011-2015 (%) 66.1 66.1
Population density, average 2011-15 498.7 116.4
Degree of urbanisation, average 2011-15 (%) 88.7 74.4
Values in green show performance above 120% of EU, values in red show performance below 80% of EU.
0
20
40
60
80
100
120
140
160
180
2010 2011 2012 2013 2014 2015 2016
Relative to EU in 2010 Relative to EU in 2016
119 119128 129 127 129 130
127
Netherlands
Performance
relative to EU
2010 inChange
2010-
20162010 2016
SUMMARY INNOVATION INDEX 119.1 129.5 10.4
Human resources 143.9 173.3 29.4
New doctorate graduates 115.4 158.4 43.1
Population with tertiary education 146.1 178.3 32.2
Lifelong learning 175.8 185.3 9.5
Attractive research systems 179.3 198.3 19.0
International scientific co-publications 343.1 522.5 179.5
Most cited publications 148.9 147.7 -1.2
Foreign doctorate students 164.8 155.9 -8.9
Innovation-friendly environment 161.8 164.4 2.6
Broadband penetration 166.7 244.4 77.8
Opportunity-driven entrepreneurship 158.4 107.9 -50.4
Finance and support 122.7 117.9 -4.8
R&D expenditure in the public sector 121.3 132.0 10.7
Venture capital expenditures 124.5 100.1 -24.4
Firm investments 80.9 79.7 -1.2
R&D expenditure in the business sector 92.3 94.0 1.7
Non-R&D innovation expenditures 69.2 10.2 -59.0
Enterprises providing ICT training 78.6 121.4 42.9
Innovators 75.6 109.6 34.0
SMEs product/process innovations 84.7 133.5 48.8
SMEs marketing/organizational innovations 60.6 74.1 13.5
SMEs innovating in-house 81.9 122.0 40.1
Linkages 154.5 156.6 2.0
Innovative SMEs collaborating with others 118.0 163.1 45.1
Public-private co-publications 162.2 145.3 -16.9
Private co-funding of public R&D exp. 177.9 161.0 -16.9
Intellectual assets 114.7 112.5 -2.2
PCT patent applications 127.5 126.3 -1.2
Trademark applications 128.7 131.4 2.7
Design applications 86.7 79.4 -7.3
Employment impacts 122.2 127.8 5.5
Employment in knowledge-intensive activities 146.2 151.3 5.1
Employment fast-growing enterprises 104.7 110.6 5.9
Sales impacts 81.5 93.2 11.7
Medium and high tech product exports 67.9 81.6 13.6
Knowledge-intensive services exports 116.8 120.0 3.3
Sales of new-to-market/firm innovations 56.4 75.7 19.3
Dark green: normalised performance above 120% of EU; light green: normalised performance between 90% and 120% of EU; yellow: normalised performance between 50% and 90% of EU; orange: normalised performance below 50% of EU. Normalised performance uses the data after a possible imputation of missing data and transformation of the data.
Change highlighted in green is positive; change highlighted in light red is negative.

61European Innovation Scoreboard 2017
Austria is a Strong Innovator. Over time,
performance has increased by 8.9% relative
to that of the EU in 2010.
Innovation system
Relative strengths of the innovation system are in Firm investments,
Attractive research systems, and Intellectual assets. Relative weaknesses
are in Employment impacts, Sales impacts, and Finance and support.
Structural differences
Notable differences are a larger share of SMEs in turnover, a lower share
of large enterprises in turnover, a higher number of Top R&D spending
enterprises but a lower average R&D spending of these enterprises,
higher GDP per capita, and higher population density.
AT EU
Structure of the economy
Composition of employment, average 2011-15
- Agriculture & Mining (NACE A-B) (%) 4.7 5.1
- Manufacturing (NACE C) (%) 15.8 15.6
of which High and Medium high-tech (%) 36.8 36.4
- Utilities and Construction (NACE D-F) (%) 9.9 8.6
- Services (NACE G-N) (%) 62.7 63.6
of which Knowledge-intensive services (%) 54.4 58.0
- Public administration, etc. (NACE O-U) (%) 6.8 7.1
Business indicators
Composition of turnover, average 2011-2014
- Micro enterprises (0-9 employees) (%) 17.1 17.3
- SMEs (10-249 employees) (%) 48.8 38.0
- Large enterprises (250+ employees) (%) 34.1 44.1
Share of foreign controlled enterprises, 2014 (%) 3.16 1.18
Top R&D spending enterprises
- average number per 10 mln population, 2011-15 49.7 29.9
- average R&D spending, mln Euros, 2011-15 35.7 165.8
Enterprise births (10+ empl.) (%), avg 2012-14 1.5 1.5
Buyer sophistication 1-7 (best), 2013-14 3.7 3.6
Ease of starting a business, Doing Business 2017 78.9 76.5
Socio-demographic indicators
GDP per capita, PPS, avg 2011-13 32,900 25,400
Change in GDP between 2010 and 2015, (%) 5.4 5.4
Population size, avg 2011-15 (millions) 8.5 505.5
Change in population between 2010 and 2015 (%) 2.7 1.1
Population aged 15-64, avg 2011-2015 (%) 67.5 66.1
Population density, average 2011-15 103.1 116.4
Degree of urbanisation, average 2011-15 (%) 63.8 74.4
Values in green show performance above 120% of EU, values in red show performance below 80% of EU.
113 113 114 115 115 115 121
119
0
20
40
60
80
100
120
140
160
180
2010 2011 2012 2013 2014 2015 2016
Relative to EU in 2010 Relative to EU in 2016
Austria
Performance
relative to EU
2010 inChange
2010-
20162010 2016
SUMMARY INNOVATION INDEX 112.5 121.5 8.9
Human resources 97.5 138.6 41.1
New doctorate graduates 146.2 130.7 -15.5
Population with tertiary education 17.1 142.1 125.0
Lifelong learning 132.6 144.2 11.6
Attractive research systems 137.1 157.6 20.5
International scientific co-publications 290.0 442.7 152.7
Most cited publications 113.3 116.9 3.6
Foreign doctorate students 116.9 114.9 -2.1
Innovation-friendly environment 161.2 110.5 -50.7
Broadband penetration 133.3 133.3 0.0
Opportunity-driven entrepreneurship 180.9 94.4 -86.5
Finance and support 84.6 95.9 11.2
R&D expenditure in the public sector 117.8 130.2 12.4
Venture capital expenditures 42.8 52.5 9.7
Firm investments 132.4 165.1 32.7
R&D expenditure in the business sector 150.7 185.0 34.3
Non-R&D innovation expenditures 61.0 61.5 0.5
Enterprises providing ICT training 171.4 228.6 57.1
Innovators 115.9 122.3 6.4
SMEs product/process innovations 119.0 124.0 5.0
SMEs marketing/organizational innovations 109.9 121.3 11.4
SMEs innovating in-house 118.9 121.6 2.7
Linkages 113.9 129.8 16.0
Innovative SMEs collaborating with others 135.4 193.3 57.9
Public-private co-publications 130.1 127.9 -2.2
Private co-funding of public R&D exp. 82.3 79.5 -2.8
Intellectual assets 146.6 139.7 -6.8
PCT patent applications 109.4 115.5 6.0
Trademark applications 170.4 163.4 -7.0
Design applications 178.3 154.3 -24.0
Employment impacts 77.3 78.5 1.2
Employment in knowledge-intensive activities 111.5 114.1 2.6
Employment fast-growing enterprises 52.3 52.5 0.2
Sales impacts 77.8 82.7 4.9
Medium and high tech product exports 97.5 106.6 9.0
Knowledge-intensive services exports 55.6 54.1 -1.5
Sales of new-to-market/firm innovations 80.1 87.3 7.2
Dark green: normalised performance above 120% of EU; light green: normalised performance between 90% and 120% of EU; yellow: normalised performance between 50% and 90% of EU; orange: normalised performance below 50% of EU. Normalised performance uses the data after a possible imputation of missing data and transformation of the data.
Change highlighted in green is positive; change highlighted in light red is negative.

62 European Innovation Scoreboard 2017
Poland is a Moderate Innovator. Over time,
performance has increased by 2.0% relative
to that of the EU in 2010.
Innovation system
Relative strengths of the innovation system are in Employment impacts,
Firm investments, and Innovation-friendly environment. Relative
weaknesses are in Innovators, Linkages, and Attractive research systems.
Structural differences
Notable differences are a larger share of employment in Agriculture &
Mining and Manufacturing, a smaller share of employment in High and
Medium high-tech manufacturing and Services, a larger share of foreign
controlled enterprises, a lower number of Top R&D spending enterprises
and a lower average R&D spending of these enterprises, lower GDP
per capita, a higher growth rate of GDP, and a lower growth rate of
population.
PL EU
Structure of the economy
Composition of employment, average 2011-15
- Agriculture & Mining (NACE A-B) (%) 13.6 5.1
- Manufacturing (NACE C) (%) 19.0 15.6
of which High and Medium high-tech (%) 26.5 36.4
- Utilities and Construction (NACE D-F) (%) 9.9 8.6
- Services (NACE G-N) (%) 50.7 63.6
of which Knowledge-intensive services (%) 52.1 58.0
- Public administration, etc. (NACE O-U) (%) 6.7 7.1
Business indicators
Composition of turnover, average 2011-2014
- Micro enterprises (0-9 employees) (%) 20.3 17.3
- SMEs (10-249 employees) (%) 35.5 38.0
- Large enterprises (250+ employees) (%) 44.2 44.1
Share of foreign controlled enterprises, 2014 (%) 9.23 1.18
Top R&D spending enterprises
- average number per 10 mln population, 2011-15 1.0 29.9
- average R&D spending, mln Euros, 2011-15 11.2 165.8
Enterprise births (10+ empl.) (%), avg 2012-14 1.8 1.5
Buyer sophistication 1-7 (best), 2013-14 3.2 3.6
Ease of starting a business, Doing Business 2017 77.8 76.5
Socio-demographic indicators
GDP per capita, PPS, avg 2011-13 17,000 25,400
Change in GDP between 2010 and 2015, (%) 16.1 5.4
Population size, avg 2011-15 (millions) 38.0 505.5
Change in population between 2010 and 2015 (%) 0.0 1.1
Population aged 15-64, avg 2011-2015 (%) 70.4 66.1
Population density, average 2011-15 122.6 116.4
Degree of urbanisation, average 2011-15 (%) 63.9 74.4
Values in green show performance above 120% of EU, values in red show performance below 80% of EU.
53 53 51 51 51 52 55
54
0
20
40
60
80
100
120
140
160
180
2010 2011 2012 2013 2014 2015 2016
Relative to EU in 2010 Relative to EU in 2016
Poland
Performance
relative to EU
2010 inChange
2010-
20162010 2016
SUMMARY INNOVATION INDEX 52.8 54.8 2.0
Human resources 69.4 77.4 8.0
New doctorate graduates 46.2 32.9 -13.2
Population with tertiary education 125.0 167.1 42.1
Lifelong learning 32.6 26.3 -6.3
Attractive research systems 22.7 33.0 10.3
International scientific co-publications 44.5 79.8 35.3
Most cited publications 26.5 39.2 12.6
Foreign doctorate students 9.4 7.4 -2.0
Innovation-friendly environment 44.8 83.7 38.9
Broadband penetration 77.8 122.2 44.4
Opportunity-driven entrepreneurship 21.5 56.5 35.0
Finance and support 46.0 51.2 5.3
R&D expenditure in the public sector 57.4 68.0 10.7
Venture capital expenditures 31.6 30.1 -1.5
Firm investments 71.8 85.1 13.3
R&D expenditure in the business sector 14.1 38.2 24.0
Non-R&D innovation expenditures 190.7 188.8 -1.8
Enterprises providing ICT training 35.7 50.0 14.3
Innovators 25.0 2.2 -22.8
SMEs product/process innovations 24.3 5.9 -18.4
SMEs marketing/organizational innovations 25.9 0.6 -25.3
SMEs innovating in-house 24.8 0.0 -24.8
Linkages 37.4 26.8 -10.6
Innovative SMEs collaborating with others 52.1 23.0 -29.1
Public-private co-publications 19.2 22.7 3.5
Private co-funding of public R&D exp. 40.9 33.3 -7.6
Intellectual assets 56.0 77.9 21.9
PCT patent applications 31.3 39.6 8.3
Trademark applications 51.8 79.7 27.9
Design applications 92.5 128.1 35.6
Employment impacts 92.2 88.0 -4.2
Employment in knowledge-intensive activities 42.3 55.1 12.8
Employment fast-growing enterprises 128.6 111.9 -16.7
Sales impacts 68.5 55.2 -13.4
Medium and high tech product exports 93.3 84.2 -9.1
Knowledge-intensive services exports 45.0 44.4 -0.7
Sales of new-to-market/firm innovations 66.2 32.7 -33.5
Dark green: normalised performance above 120% of EU; light green: normalised performance between 90% and 120% of EU; yellow: normalised performance between 50% and 90% of EU; orange: normalised performance below 50% of EU. Normalised performance uses the data after a possible imputation of missing data and transformation of the data.
Change highlighted in green is positive; change highlighted in light red is negative.

63European Innovation Scoreboard 2017
Portugal is a Moderate Innovator. Over
time, performance has declined by 2.4%
relative to that of the EU in 2010.
Innovation system
Relative strengths of the innovation system are in Innovation-friendly
environment, Attractive research systems, and Human resources.
Relative weaknesses are in Linkages, Sales impacts, and Employment
impacts.
Structural differences
Notable differences are a larger share of employment in Agriculture &
Mining, a lower share of employment in High and Medium high-tech
manufacturing, a larger share of micro enterprises and SMEs in turnover,
a smaller share of large enterprises in turnover, a smaller share of
foreign controlled enterprises, a lower number of Top R&D spending
enterprises and a lower average R&D spending of these enterprises,
lower GDP per capita, a lower and negative growth rate of GDP, and
a lower and negative growth rate of population.
PT EU
Structure of the economy
Composition of employment, average 2011-15
- Agriculture & Mining (NACE A-B) (%) 8.6 5.1
- Manufacturing (NACE C) (%) 16.7 15.6
of which High and Medium high-tech (%) 17.3 36.4
- Utilities and Construction (NACE D-F) (%) 8.2 8.6
- Services (NACE G-N) (%) 59.8 63.6
of which Knowledge-intensive services (%) 53.7 58.0
- Public administration, etc. (NACE O-U) (%) 6.8 7.1
Business indicators
Composition of turnover, average 2011-2014
- Micro enterprises (0-9 employees) (%) 24.1 17.3
- SMEs (10-249 employees) (%) 48.1 38.0
- Large enterprises (250+ employees) (%) 30.7 44.1
Share of foreign controlled enterprises, 2014 (%) 0.65 1.18
Top R&D spending enterprises
- average number per 10 mln population, 2011-15 8.7 29.9
- average R&D spending, mln Euros, 2011-15 47.1 165.8
Enterprise births (10+ empl.) (%), avg 2012-14 1.7 1.5
Buyer sophistication 1-7 (best), 2013-14 3.5 3.6
Ease of starting a business, Doing Business 2017 77.4 76.5
Socio-demographic indicators
GDP per capita, PPS, avg 2011-13 19,400 25,400
Change in GDP between 2010 and 2015, (%) -4.5 5.4
Population size, avg 2011-15 (millions) 10.5 505.5
Change in population between 2010 and 2015 (%) -1.9 1.1
Population aged 15-64, avg 2011-2015 (%) 65.8 66.1
Population density, average 2011-15 113.3 116.4
Degree of urbanisation, average 2011-15 (%) 74.3 74.4
Values in green show performance above 120% of EU, values in red show performance below 80% of EU.
85 84 82 83 84 85 83
81
0
20
40
60
80
100
120
140
160
180
2010 2011 2012 2013 2014 2015 2016
Relative to EU in 2010 Relative to EU in 2016
Portugal
Performance
relative to EU
2010 inChange
2010-
20162010 2016
SUMMARY INNOVATION INDEX 85.4 83.0 -2.4
Human resources 120.5 111.6 -9.0
New doctorate graduates 200.0 131.0 -69.0
Population with tertiary education 48.7 111.2 62.5
Lifelong learning 108.4 88.4 -20.0
Attractive research systems 80.7 112.4 31.7
International scientific co-publications 145.7 284.3 138.6
Most cited publications 84.8 85.5 0.8
Foreign doctorate students 51.6 90.0 38.4
Innovation-friendly environment 103.3 153.6 50.3
Broadband penetration 144.4 277.8 133.3
Opportunity-driven entrepreneurship 74.2 66.0 -8.2
Finance and support 84.1 81.7 -2.4
R&D expenditure in the public sector 92.9 89.3 -3.6
Venture capital expenditures 73.1 72.0 -1.0
Firm investments 94.9 88.6 -6.3
R&D expenditure in the business sector 62.2 49.3 -12.9
Non-R&D innovation expenditures 95.6 90.0 -5.6
Enterprises providing ICT training 128.6 128.6 0.0
Innovators 127.2 100.2 -26.9
SMEs product/process innovations 154.2 129.9 -24.3
SMEs marketing/organizational innovations 113.5 92.6 -21.0
SMEs innovating in-house 114.4 78.8 -35.6
Linkages 55.8 38.0 -17.8
Innovative SMEs collaborating with others 121.4 65.7 -55.7
Public-private co-publications 45.0 34.9 -10.1
Private co-funding of public R&D exp. 11.4 18.1 6.7
Intellectual assets 69.0 75.9 6.9
PCT patent applications 41.2 43.4 2.3
Trademark applications 76.2 105.1 28.8
Design applications 100.9 97.2 -3.7
Employment impacts 50.7 69.4 18.7
Employment in knowledge-intensive activities 43.6 66.7 23.1
Employment fast-growing enterprises 55.9 71.4 15.5
Sales impacts 72.1 45.5 -26.6
Medium and high tech product exports 49.7 49.2 -0.5
Knowledge-intensive services exports 51.9 54.1 2.2
Sales of new-to-market/firm innovations 122.8 30.9 -91.9
Dark green: normalised performance above 120% of EU; light green: normalised performance between 90% and 120% of EU; yellow: normalised performance between 50% and 90% of EU; orange: normalised performance below 50% of EU. Normalised performance uses the data after a possible imputation of missing data and transformation of the data.
Change highlighted in green is positive; change highlighted in light red is negative.

64 European Innovation Scoreboard 2017
Romania is a Modest Innovator. Over time,
performance has declined by 14.1% relative
to that of the EU in 2010.
Innovation system
Relative strengths of the innovation system are in Innovation-friendly
environment, Sales impacts, and Human resources. Relative weaknesses
are in Innovators, Firm investments, and Finance and support.
Structural differences
Notable differences are a larger share of employment in Agriculture &
Mining, a lower share of employment in High and Medium high-tech
manufacturing, Services and Public administration, a larger share of
foreign controlled enterprises, a lower number of Top R&D spending
enterprises and a lower average R&D spending of these enterprises,
a larger share of enterprise births, lower GDP per capita, a higher growth
rate of GDP, a lower and negative growth rate of population, and lower
population density.
RO EU
Structure of the economy
Composition of employment, average 2011-15
- Agriculture & Mining (NACE A-B) (%) 29.3 5.1
- Manufacturing (NACE C) (%) 18.1 15.6
of which High and Medium high-tech (%) 27.6 36.4
- Utilities and Construction (NACE D-F) (%) 9.5 8.6
- Services (NACE G-N) (%) 38.1 63.6
of which Knowledge-intensive services (%) 46.9 58.0
- Public administration, etc. (NACE O-U) (%) 5.0 7.1
Business indicators
Composition of turnover, average 2011-2014
- Micro enterprises (0-9 employees) (%) 16.5 17.3
- SMEs (10-249 employees) (%) 41.5 38.0
- Large enterprises (250+ employees) (%) 42.0 44.1
Share of foreign controlled enterprises, 2014 (%) 5.31 1.18
Top R&D spending enterprises
- average number per 10 mln population, 2011-15 0.3 29.9
- average R&D spending, mln Euros, 2011-15 11.0 165.8
Enterprise births (10+ empl.) (%), avg 2012-14 3.4 1.5
Buyer sophistication 1-7 (best), 2013-14 3.0 3.6
Ease of starting a business, Doing Business 2017 74.3 76.5
Socio-demographic indicators
GDP per capita, PPS, avg 2011-13 13,500 25,400
Change in GDP between 2010 and 2015, (%) 12.8 5.4
Population size, avg 2011-15 (millions) 20.0 505.5
Change in population between 2010 and 2015 (%) -2.1 1.1
Population aged 15-64, avg 2011-2015 (%) 67.9 66.1
Population density, average 2011-15 87.9 116.4
Degree of urbanisation, average 2011-15 (%) 54.4 74.4
Values in green show performance above 120% of EU, values in red show performance below 80% of EU.
48 49 44 42 34 32 34
330
20
40
60
80
100
120
140
160
180
2010 2011 2012 2013 2014 2015 2016
Relative to EU in 2010 Relative to EU in 2016
Romania
Performance
relative to EU
2010 inChange
2010-
20162010 2016
SUMMARY INNOVATION INDEX 47.9 33.8 -14.1
Human resources 42.3 49.8 7.4
New doctorate graduates 100.0 96.4 -3.6
Population with tertiary education 17.1 44.1 27.0
Lifelong learning 2.1 0.0 -2.1
Attractive research systems 23.4 30.0 6.5
International scientific co-publications 23.4 47.6 24.2
Most cited publications 31.1 40.1 9.0
Foreign doctorate students 12.3 9.0 -3.4
Innovation-friendly environment 74.9 89.8 14.9
Broadband penetration 122.2 144.4 22.2
Opportunity-driven entrepreneurship 41.5 51.2 9.7
Finance and support 52.6 18.1 -34.6
R&D expenditure in the public sector 27.1 21.8 -5.3
Venture capital expenditures 84.8 13.3 -71.5
Firm investments 64.4 11.9 -52.5
R&D expenditure in the business sector 13.3 15.9 2.6
Non-R&D innovation expenditures 209.4 21.3 -188.1
Enterprises providing ICT training 0.0 0.0 0.0
Innovators 38.5 0.0 -38.5
SMEs product/process innovations 26.4 0.0 -26.4
SMEs marketing/organizational innovations 50.8 0.0 -50.8
SMEs innovating in-house 38.0 0.0 -38.0
Linkages 52.3 29.4 -22.9
Innovative SMEs collaborating with others 10.7 5.8 -4.9
Public-private co-publications 39.3 15.0 -24.3
Private co-funding of public R&D exp. 97.5 61.1 -36.4
Intellectual assets 15.9 24.9 9.0
PCT patent applications 21.1 26.7 5.6
Trademark applications 16.6 31.3 14.8
Design applications 8.5 17.5 9.0
Employment impacts 21.0 37.0 16.0
Employment in knowledge-intensive activities 3.8 19.2 15.4
Employment fast-growing enterprises 33.6 50.0 16.4
Sales impacts 84.8 62.2 -22.7
Medium and high tech product exports 87.1 93.4 6.4
Knowledge-intensive services exports 56.0 54.7 -1.3
Sales of new-to-market/firm innovations 115.9 33.2 -82.7
Dark green: normalised performance above 120% of EU; light green: normalised performance between 90% and 120% of EU; yellow: normalised performance between 50% and 90% of EU; orange: normalised performance below 50% of EU. Normalised performance uses the data after a possible imputation of missing data and transformation of the data.
Change highlighted in green is positive; change highlighted in light red is negative.

65European Innovation Scoreboard 2017
Slovenia is a Strong Innovator. Over time,
performance has declined by 0.2% relative to
that of the EU in 2010.
Innovation system
Relative strengths of the innovation system are in Human resources, Firm
investments, and Innovation-friendly environment. Relative weaknesses
are in Finance and support, Sales impacts, and Innovators.
Structural differences
Notable differences are a larger share of employment in Agriculture &
Mining and Manufacturing, a larger share of micro enterprises and SMEs
in turnover, a smaller share of large enterprises in turnover, a larger share
of foreign controlled enterprises, a lower number of Top R&D spending
enterprises and a lower average R&D spending of these enterprises,
a smaller share of enterprise births, lower buyer sophistication, a lower
growth rate of GDP, and a lower growth rate of population.
SI EU
Structure of the economy
Composition of employment, average 2011-15
- Agriculture & Mining (NACE A-B) (%) 8.4 5.1
- Manufacturing (NACE C) (%) 23.0 15.6
of which High and Medium high-tech (%) 37.0 36.4
- Utilities and Construction (NACE D-F) (%) 8.0 8.6
- Services (NACE G-N) (%) 54.2 63.6
of which Knowledge-intensive services (%) 57.1 58.0
- Public administration, etc. (NACE O-U) (%) 6.3 7.1
Business indicators
Composition of turnover, average 2011-2014
- Micro enterprises (0-9 employees) (%) 20.8 17.3
- SMEs (10-249 employees) (%) 47.1 38.0
- Large enterprises (250+ employees) (%) 32.1 44.1
Share of foreign controlled enterprises, 2014 (%) 4.37 1.18
Top R&D spending enterprises
- average number per 10 mln population, 2011-15 21.3 29.9
- average R&D spending, mln Euros, 2011-15 40.6 165.8
Enterprise births (10+ empl.) (%), avg 2012-14 1.1 1.5
Buyer sophistication 1-7 (best), 2013-14 2.9 3.6
Ease of starting a business, Doing Business 2017 76.1 76.5
Socio-demographic indicators
GDP per capita, PPS, avg 2011-13 21,300 25,400
Change in GDP between 2010 and 2015, (%) 2.2 5.4
Population size, avg 2011-15 (millions) 2.1 505.5
Change in population between 2010 and 2015 (%) 0.8 1.1
Population aged 15-64, avg 2011-2015 (%) 68.4 66.1
Population density, average 2011-15 102.2 116.4
Degree of urbanisation, average 2011-15 (%) 53.4 74.4
Values in green show performance above 120% of EU, values in red show performance below 80% of EU.
98 99 98 97 99 98 98
96
0
20
40
60
80
100
120
140
160
180
2010 2011 2012 2013 2014 2015 2016
Relative to EU in 2010 Relative to EU in 2016
Slovenia
Performance
relative to EU
2010 inChange
2010-
20162010 2016
SUMMARY INNOVATION INDEX 98.0 97.8 -0.2
Human resources 113.2 172.9 59.7
New doctorate graduates 100.0 234.1 134.1
Population with tertiary education 86.8 163.8 77.0
Lifelong learning 160.0 109.5 -50.5
Attractive research systems 76.3 101.6 25.3
International scientific co-publications 229.7 371.6 141.8
Most cited publications 66.7 80.8 14.1
Foreign doctorate students 35.6 35.6 -0.1
Innovation-friendly environment 138.3 114.3 -24.0
Broadband penetration 144.4 177.8 33.3
Opportunity-driven entrepreneurship 134.0 69.5 -64.6
Finance and support 50.9 40.4 -10.5
R&D expenditure in the public sector 85.8 66.2 -19.5
Venture capital expenditures 6.8 7.7 0.9
Firm investments 143.0 141.0 -2.0
R&D expenditure in the business sector 151.5 142.9 -8.6
Non-R&D innovation expenditures 114.5 118.5 4.0
Enterprises providing ICT training 157.1 157.1 0.0
Innovators 86.8 76.6 -10.2
SMEs product/process innovations 82.3 72.2 -10.1
SMEs marketing/organizational innovations 98.1 76.5 -21.6
SMEs innovating in-house 79.7 81.0 1.3
Linkages 129.0 105.7 -23.2
Innovative SMEs collaborating with others 130.8 119.9 -11.0
Public-private co-publications 144.9 106.2 -38.7
Private co-funding of public R&D exp. 113.7 93.8 -20.0
Intellectual assets 91.2 93.6 2.4
PCT patent applications 90.1 89.9 -0.2
Trademark applications 133.8 137.9 4.1
Design applications 60.0 64.6 4.6
Employment impacts 71.3 74.3 2.9
Employment in knowledge-intensive activities 98.7 102.6 3.8
Employment fast-growing enterprises 51.4 53.6 2.3
Sales impacts 87.8 75.7 -12.1
Medium and high tech product exports 107.2 102.3 -5.0
Knowledge-intensive services exports 31.7 34.6 2.9
Sales of new-to-market/firm innovations 130.1 91.8 -38.3
Dark green: normalised performance above 120% of EU; light green: normalised performance between 90% and 120% of EU; yellow: normalised performance between 50% and 90% of EU; orange: normalised performance below 50% of EU. Normalised performance uses the data after a possible imputation of missing data and transformation of the data.
Change highlighted in green is positive; change highlighted in light red is negative.

66 European Innovation Scoreboard 2017
Slovakia is a Moderate Innovator. Over
time, performance has increased by 8.0%
relative to that of the EU in 2010.
Innovation system
Relative strengths of the innovation system are in Employment impacts,
Sales impacts, and Human resources. Relative weaknesses are in
Innovators, Intellectual assets, and Attractive research systems.
Structural differences
Notable differences are a smaller share of employment in Agriculture
& Mining, a larger share of employment in Manufacturing, Utilities
and Construction and Public administration, a smaller share of foreign
controlled enterprises, a larger share of enterprise births, lower buyer
sophistication, lower GDP per capita, a higher growth rate of GDP, and
a lower growth rate of population.
SK EU
Structure of the economy
Composition of employment, average 2011-15
- Agriculture & Mining (NACE A-B) (%) 3.7 5.1
- Manufacturing (NACE C) (%) 24.0 15.6
of which High and Medium high-tech (%) 41.4 36.4
- Utilities and Construction (NACE D-F) (%) 12.0 8.6
- Services (NACE G-N) (%) 51.7 63.6
of which Knowledge-intensive services (%) 51.6 58.0
- Public administration, etc. (NACE O-U) (%) 8.6 7.1
Business indicators
Composition of turnover, average 2011-2014
- Micro enterprises (0-9 employees) (%) 18.2 17.3
- SMEs (10-249 employees) (%) 36.7 38.0
- Large enterprises (250+ employees) (%) 45.2 44.1
Share of foreign controlled enterprises, 2014 (%) 0.87 1.18
Top R&D spending enterprises
- average number per 10 mln population, 2011-15 none 29.9
- average R&D spending, mln Euros, 2011-15 none 165.8
Enterprise births (10+ empl.) (%), avg 2012-14 2.1 1.5
Buyer sophistication 1-7 (best), 2013-14 2.7 3.6
Ease of starting a business, Doing Business 2017 75.6 76.5
Socio-demographic indicators
GDP per capita, PPS, avg 2011-13 19,300 25,400
Change in GDP between 2010 and 2015, (%) 13.0 5.4
Population size, avg 2011-15 (millions) 5.4 505.5
Change in population between 2010 and 2015 (%) 0.6 1.1
Population aged 15-64, avg 2011-2015 (%) 71.4 66.1
Population density, average 2011-15 110.5 116.4
Degree of urbanisation, average 2011-15 (%) 57.6 74.4
Values in green show performance above 120% of EU, values in red show performance below 80% of EU.
62 67 69 72 66 71 70
69
0
20
40
60
80
100
120
140
160
180
2010 2011 2012 2013 2014 2015 2016
Relative to EU in 2010 Relative to EU in 2016
Slovakia
Performance
relative to EU
2010 inChange
2010-
20162010 2016
SUMMARY INNOVATION INDEX 62.0 70.0 8.0
Human resources 74.8 96.5 21.8
New doctorate graduates 146.2 157.6 11.4
Population with tertiary education 38.8 100.7 61.8
Lifelong learning 30.5 17.9 -12.6
Attractive research systems 45.8 52.5 6.7
International scientific co-publications 85.9 124.8 38.9
Most cited publications 46.7 44.5 -2.2
Foreign doctorate students 30.1 38.2 8.1
Innovation-friendly environment 66.9 70.4 3.5
Broadband penetration 100.0 100.0 0.0
Opportunity-driven entrepreneurship 43.6 49.5 5.9
Finance and support 14.5 72.4 57.9
R&D expenditure in the public sector 21.8 123.1 101.3
Venture capital expenditures 5.3 8.5 3.1
Firm investments 84.1 69.4 -14.6
R&D expenditure in the business sector 14.1 26.2 12.0
Non-R&D innovation expenditures 102.1 78.9 -23.2
Enterprises providing ICT training 142.9 107.1 -35.7
Innovators 40.4 28.6 -11.8
SMEs product/process innovations 30.8 20.8 -10.0
SMEs marketing/organizational innovations 59.6 39.1 -20.5
SMEs innovating in-house 30.3 25.6 -4.7
Linkages 51.1 62.4 11.3
Innovative SMEs collaborating with others 45.8 72.4 26.6
Public-private co-publications 61.3 45.7 -15.6
Private co-funding of public R&D exp. 46.7 68.6 21.9
Intellectual assets 34.9 38.6 3.8
PCT patent applications 30.4 34.8 4.4
Trademark applications 48.2 65.7 17.6
Design applications 30.7 23.1 -7.6
Employment impacts 118.5 111.8 -6.7
Employment in knowledge-intensive activities 60.3 55.1 -5.1
Employment fast-growing enterprises 161.0 153.2 -7.9
Sales impacts 91.7 105.6 13.9
Medium and high tech product exports 118.3 131.1 12.8
Knowledge-intensive services exports 35.8 34.6 -1.1
Sales of new-to-market/firm innovations 125.0 157.8 32.8
Dark green: normalised performance above 120% of EU; light green: normalised performance between 90% and 120% of EU; yellow: normalised performance between 50% and 90% of EU; orange: normalised performance below 50% of EU. Normalised performance uses the data after a possible imputation of missing data and transformation of the data.
Change highlighted in green is positive; change highlighted in light red is negative.

67European Innovation Scoreboard 2017
Finland is an Innovation Leader. Over time,
performance has declined by 5.1% relative to
that of the EU in 2010.
Innovation system
Relative strengths of the innovation system are in Human resources,
Innovation-friendly environment, and Attractive research systems.
Relative weaknesses are in Sales impacts, Employment impacts, and
Innovators.
Structural differences
Notable differences are a smaller share of employment in Public
administration, a higher number of Top R&D spending enterprises but
a lower average R&D spending of these enterprises, a smaller share of
enterprise births, higher buyer sophistication, a lower growth rate of GDP,
a higher growth rate of population, and lower population density.
FI EU
Structure of the economy
Composition of employment, average 2011-15
- Agriculture & Mining (NACE A-B) (%) 4.5 5.1
- Manufacturing (NACE C) (%) 14.1 15.6
of which High and Medium high-tech (%) 36.2 36.4
- Utilities and Construction (NACE D-F) (%) 8.1 8.6
- Services (NACE G-N) (%) 68.8 63.6
of which Knowledge-intensive services (%) 64.5 58.0
- Public administration, etc. (NACE O-U) (%) 4.5 7.1
Business indicators
Composition of turnover, average 2011-2014
- Micro enterprises (0-9 employees) (%) 15.5 17.3
- SMEs (10-249 employees) (%) 37.4 38.0
- Large enterprises (250+ employees) (%) 47.1 44.1
Share of foreign controlled enterprises, 2014 (%) 1.26 1.18
Top R&D spending enterprises
- average number per 10 mln population, 2011-15 124.6 29.9
- average R&D spending, mln Euros, 2011-15 114.5 165.8
Enterprise births (10+ empl.) (%), avg 2012-14 0.5 1.5
Buyer sophistication 1-7 (best), 2013-14 4.6 3.6
Ease of starting a business, Doing Business 2017 80.8 76.5
Socio-demographic indicators
GDP per capita, PPS, avg 2011-13 29,100 25,400
Change in GDP between 2010 and 2015, (%) 0.0 5.4
Population size, avg 2011-15 (millions) 5.4 505.5
Change in population between 2010 and 2015 (%) 2.2 1.1
Population aged 15-64, avg 2011-2015 (%) 64.8 66.1
Population density, average 2011-15 17.9 116.4
Degree of urbanisation, average 2011-15 (%) 63.9 74.4
Values in green show performance above 120% of EU, values in red show performance below 80% of EU.
136 135 135 134 130 131 131
128
0
20
40
60
80
100
120
140
160
180
2010 2011 2012 2013 2014 2015 2016
Relative to EU in 2010 Relative to EU in 2016
Finland
Performance
relative to EU
2010 inChange
2010-
20162010 2016
SUMMARY INNOVATION INDEX 136.1 130.9 -5.1
Human resources 190.3 203.7 13.4
New doctorate graduates 207.7 206.0 -1.7
Population with tertiary education 138.8 148.7 9.9
Lifelong learning 229.5 265.3 35.8
Attractive research systems 108.6 151.8 43.3
International scientific co-publications 336.9 524.9 188.1
Most cited publications 100.4 106.6 6.3
Foreign doctorate students 39.1 84.2 45.1
Innovation-friendly environment 157.9 198.9 41.0
Broadband penetration 233.3 277.8 44.4
Opportunity-driven entrepreneurship 104.6 143.2 38.6
Finance and support 161.4 127.6 -33.8
R&D expenditure in the public sector 158.6 140.9 -17.8
Venture capital expenditures 164.9 110.8 -54.1
Firm investments 181.6 142.9 -38.7
R&D expenditure in the business sector 217.6 164.4 -53.2
Non-R&D innovation expenditures 77.3 36.1 -41.2
Enterprises providing ICT training 228.6 207.1 -21.4
Innovators 112.2 121.8 9.6
SMEs product/process innovations 128.8 138.5 9.7
SMEs marketing/organizational innovations 70.6 90.7 20.1
SMEs innovating in-house 138.2 136.9 -1.2
Linkages 161.3 123.9 -37.4
Innovative SMEs collaborating with others 141.4 156.2 14.8
Public-private co-publications 164.4 134.5 -29.9
Private co-funding of public R&D exp. 175.0 88.5 -86.6
Intellectual assets 127.6 132.9 5.3
PCT patent applications 156.8 149.5 -7.3
Trademark applications 112.5 149.9 37.3
Design applications 99.7 97.7 -2.1
Employment impacts 88.4 83.7 -4.7
Employment in knowledge-intensive activities 121.8 128.2 6.4
Employment fast-growing enterprises 64.0 51.1 -12.8
Sales impacts 99.6 74.7 -24.9
Medium and high tech product exports 89.0 71.0 -17.9
Knowledge-intensive services exports 90.6 90.6 0.0
Sales of new-to-market/firm innovations 123.1 60.6 -62.6
Dark green: normalised performance above 120% of EU; light green: normalised performance between 90% and 120% of EU; yellow: normalised performance between 50% and 90% of EU; orange: normalised performance below 50% of EU. Normalised performance uses the data after a possible imputation of missing data and transformation of the data.
Change highlighted in green is positive; change highlighted in light red is negative.

68 European Innovation Scoreboard 2017
Sweden is an Innovation Leader. Over time,
performance has increased by 2.3% relative
to that of the EU in 2010.
Innovation system
Relative strengths of the innovation system are in Human resources,
Innovation-friendly environment, and Attractive research systems.
Relative weaknesses are in Sales impacts, Innovators, and Linkages.
Structural differences
Notable differences are a smaller share of employment in Agriculture
& Mining and Manufacturing, a larger share of foreign controlled
enterprises, a higher number of Top R&D spending enterprises but
a lower average R&D spending of these enterprises, a smaller share
of enterprise births, higher buyer sophistication, higher GDP per capita,
a higher growth rate of GDP, a higher growth rate of population, and
lower population density.
SE EU
Structure of the economy
Composition of employment, average 2011-15
- Agriculture & Mining (NACE A-B) (%) 2.2 5.1
- Manufacturing (NACE C) (%) 11.2 15.6
of which High and Medium high-tech (%) 39.6 36.4
- Utilities and Construction (NACE D-F) (%) 7.7 8.6
- Services (NACE G-N) (%) 72.6 63.6
of which Knowledge-intensive services (%) 67.8 58.0
- Public administration, etc. (NACE O-U) (%) 6.3 7.1
Business indicators
Composition of turnover, average 2011-2014
- Micro enterprises (0-9 employees) (%) 18.6 17.3
- SMEs (10-249 employees) (%) 38.6 38.0
- Large enterprises (250+ employees) (%) 42.1 44.1
Share of foreign controlled enterprises, 2014 (%) 1.82 1.18
Top R&D spending enterprises
- average number per 10 mln population, 2011-15 138.8 29.9
- average R&D spending, mln Euros, 2011-15 113.3 165.8
Enterprise births (10+ empl.) (%), avg 2012-14 0.3 1.5
Buyer sophistication 1-7 (best), 2013-14 4.5 3.6
Ease of starting a business, Doing Business 2017 82.1 76.5
Socio-demographic indicators
GDP per capita, PPS, avg 2011-13 32,100 25,400
Change in GDP between 2010 and 2015, (%) 10.7 5.4
Population size, avg 2011-15 (millions) 9.6 505.5
Change in population between 2010 and 2015 (%) 4.4 1.1
Population aged 15-64, avg 2011-2015 (%) 64.0 66.1
Population density, average 2011-15 23.6 116.4
Degree of urbanisation, average 2011-15 (%) 61.9 74.4
Values in green show performance above 120% of EU, values in red show performance below 80% of EU.
141 143 145 145 142 143 144
141
0
20
40
60
80
100
120
140
160
180
2010 2011 2012 2013 2014 2015 2016
Relative to EU in 2010 Relative to EU in 2016
Sweden
Performance
relative to EU
2010 inChange
2010-
20162010 2016
SUMMARY INNOVATION INDEX 141.3 143.6 2.3
Human resources 208.2 224.9 16.8
New doctorate graduates 223.1 208.5 -14.5
Population with tertiary education 159.2 192.1 32.9
Lifelong learning 247.4 283.2 35.8
Attractive research systems 148.9 192.7 43.7
International scientific co-publications 416.1 649.2 233.1
Most cited publications 110.1 117.1 7.1
Foreign doctorate students 109.9 139.1 29.2
Innovation-friendly environment 179.4 217.2 37.8
Broadband penetration 244.4 277.8 33.3
Opportunity-driven entrepreneurship 133.5 174.5 40.9
Finance and support 163.7 119.8 -43.9
R&D expenditure in the public sector 149.8 148.0 -1.8
Venture capital expenditures 181.2 84.2 -97.0
Firm investments 151.3 168.8 17.4
R&D expenditure in the business sector 208.2 192.7 -15.5
Non-R&D innovation expenditures 105.9 169.6 63.8
Enterprises providing ICT training 128.6 142.9 14.3
Innovators 114.2 109.1 -5.1
SMEs product/process innovations 123.5 122.7 -0.8
SMEs marketing/organizational innovations 88.8 83.2 -5.7
SMEs innovating in-house 131.0 122.1 -8.9
Linkages 139.4 116.4 -22.9
Innovative SMEs collaborating with others 153.5 123.5 -30.0
Public-private co-publications 187.2 161.9 -25.3
Private co-funding of public R&D exp. 86.7 71.6 -15.1
Intellectual assets 132.7 135.9 3.3
PCT patent applications 156.8 156.8 0.0
Trademark applications 124.2 143.2 19.0
Design applications 106.6 102.3 -4.3
Employment impacts 138.2 139.1 1.0
Employment in knowledge-intensive activities 143.6 162.8 19.2
Employment fast-growing enterprises 134.2 121.8 -12.4
Sales impacts 91.9 86.6 -5.2
Medium and high tech product exports 100.4 98.8 -1.7
Knowledge-intensive services exports 110.7 116.5 5.8
Sales of new-to-market/firm innovations 59.5 37.0 -22.4
Dark green: normalised performance above 120% of EU; light green: normalised performance between 90% and 120% of EU; yellow: normalised performance between 50% and 90% of EU; orange: normalised performance below 50% of EU. Normalised performance uses the data after a possible imputation of missing data and transformation of the data.
Change highlighted in green is positive; change highlighted in light red is negative.

69European Innovation Scoreboard 2017
The United Kingdom is an Innovation
Leader. Over time, performance has
increased by 11.7% relative to that of the EU
in 2010.
Innovation system
Relative strengths of the innovation system are in Attractive research
systems, Human resources, and Employment impacts. Relative
weaknesses are in Innovators, Finance and support, and Intellectual
assets.
Structural differences
Notable differences are a smaller share of employment in Agriculture
& Mining and Manufacturing, a smaller share of micro enterprises in
turnover, a larger share of large enterprises in turnover, a higher number
of Top R&D spending enterprises but a lower average R&D spending
of these enterprises, a larger share of enterprise births, higher buyer
sophistication, a higher growth rate of GDP, a higher growth rate of
population, and higher population density.
UK EU
Structure of the economy
Composition of employment, average 2011-15
- Agriculture & Mining (NACE A-B) (%) 1.6 5.1
- Manufacturing (NACE C) (%) 9.8 15.6
of which High and Medium high-tech (%) 38.2 36.4
- Utilities and Construction (NACE D-F) (%) 8.7 8.6
- Services (NACE G-N) (%) 73.6 63.6
of which Knowledge-intensive services (%) 63.3 58.0
- Public administration, etc. (NACE O-U) (%) 6.3 7.1
Business indicators
Composition of turnover, average 2011-2014
- Micro enterprises (0-9 employees) (%) 13.0 17.3
- SMEs (10-249 employees) (%) 31.2 38.0
- Large enterprises (250+ employees) (%) 55.8 44.1
Share of foreign controlled enterprises, 2014 (%) 1.21 1.18
Top R&D spending enterprises
- average number per 10 mln population, 2011-15 62.3 29.9
- average R&D spending, mln Euros, 2011-15 100.2 165.8
Enterprise births (10+ empl.) (%), avg 2012-14 3.6 1.5
Buyer sophistication 1-7 (best), 2013-14 4.6 3.6
Ease of starting a business, Doing Business 2017 82.7 76.5
Socio-demographic indicators
GDP per capita, PPS, avg 2011-13 26,700 25,400
Change in GDP between 2010 and 2015, (%) 10.4 5.4
Population size, avg 2011-15 (millions) 63.9 505.5
Change in population between 2010 and 2015 (%) 3.8 1.1
Population aged 15-64, avg 2011-2015 (%) 65.2 66.1
Population density, average 2011-15 264.7 116.4
Degree of urbanisation, average 2011-15 (%) 86.5 74.4
Values in green show performance above 120% of EU, values in red show performance below 80% of EU.
114 113 113 113 116 118 125
123
0
20
40
60
80
100
120
140
160
180
2010 2011 2012 2013 2014 2015 2016
Relative to EU in 2010 Relative to EU in 2016
United Kingdom
Performance
relative to EU
2010 inChange
2010-
20162010 2016
SUMMARY INNOVATION INDEX 113.6 125.3 11.7
Human resources 167.5 185.3 17.8
New doctorate graduates 153.8 217.6 63.7
Population with tertiary education 154.6 191.4 36.8
Lifelong learning 198.9 138.9 -60.0
Attractive research systems 177.4 190.6 13.2
International scientific co-publications 244.3 379.4 135.2
Most cited publications 143.5 149.3 5.8
Foreign doctorate students 202.7 183.0 -19.7
Innovation-friendly environment 94.0 103.0 9.0
Broadband penetration 88.9 111.1 22.2
Opportunity-driven entrepreneurship 97.5 97.2 -0.3
Finance and support 124.4 87.1 -37.3
R&D expenditure in the public sector 85.8 71.6 -14.2
Venture capital expenditures 173.1 106.7 -66.4
Firm investments 99.7 118.9 19.2
R&D expenditure in the business sector 89.7 94.0 4.3
Non-R&D innovation expenditures 33.3 95.2 61.9
Enterprises providing ICT training 164.3 164.3 0.0
Innovators 61.0 85.8 24.8
SMEs product/process innovations 65.0 89.0 24.0
SMEs marketing/organizational innovations 69.1 119.1 50.1
SMEs innovating in-house 48.8 48.8 0.0
Linkages 128.5 124.0 -4.6
Innovative SMEs collaborating with others 217.4 217.4 0.0
Public-private co-publications 127.0 109.1 -17.9
Private co-funding of public R&D exp. 57.2 60.3 3.1
Intellectual assets 81.5 87.8 6.3
PCT patent applications 94.4 93.6 -0.8
Trademark applications 89.7 106.3 16.6
Design applications 57.8 65.9 8.0
Employment impacts 140.5 151.6 11.2
Employment in knowledge-intensive activities 147.4 162.8 15.4
Employment fast-growing enterprises 135.4 143.5 8.1
Sales impacts 95.0 132.8 37.8
Medium and high tech product exports 103.4 98.9 -4.5
Knowledge-intensive services exports 132.4 132.2 -0.2
Sales of new-to-market/firm innovations 41.1 174.5 133.4
Dark green: normalised performance above 120% of EU; light green: normalised performance between 90% and 120% of EU; yellow: normalised performance between 50% and 90% of EU; orange: normalised performance below 50% of EU. Normalised performance uses the data after a possible imputation of missing data and transformation of the data.
Change highlighted in green is positive; change highlighted in light red is negative.

70 European Innovation Scoreboard 2017
Iceland is a Strong Innovator. Over time,
performance has increased by 0.2% relative
to that of the EU in 2010.
Innovation system
Relative strengths of the innovation system are in Innovation-friendly
environment, Attractive research systems, and Employment impacts.
Relative weaknesses are in Sales impacts, Intellectual assets, and
Finance and support.
Structural differences
Notable differences are a smaller share of employment in Manufacturing,
High and Medium high-tech manufacturing and Public administration,
a higher number of Top R&D spending enterprises but a lower average
R&D spending of these enterprises, a higher growth rate of GDP, a higher
growth rate of population, and lower population density.
IS EU
Structure of the economy
Composition of employment, average 2011-15
- Agriculture & Mining (NACE A-B) (%) 4.9 5.1
- Manufacturing (NACE C) (%) 11.1 15.6
of which High and Medium high-tech (%) 13.8 36.4
- Utilities and Construction (NACE D-F) (%) 7.2 8.6
- Services (NACE G-N) (%) 72.2 63.6
of which Knowledge-intensive services (%) 64.9 58.0
- Public administration, etc. (NACE O-U) (%) 4.7 7.1
Business indicators
Composition of turnover, average 2011-2014
- Micro enterprises (0-9 employees) (%) n/a 17.3
- SMEs (10-249 employees) (%) n/a 38.0
- Large enterprises (250+ employees) (%) n/a 44.1
Share of foreign controlled enterprises, 2014 (%) n/a 1.18
Top R&D spending enterprises
- average number per 10 mln population, 2011-15 46.6 29.9
- average R&D spending, mln Euros, 2011-15 52.7 165.8
Enterprise births (10+ empl.) (%), avg 2012-14 n/a 1.5
Buyer sophistication 1-7 (best), 2013-14 3.8 3.6
Ease of starting a business, Doing Business 2017 78.9 76.5
Socio-demographic indicators
GDP per capita, PPS, avg 2011-13 29,400 25,400
Change in GDP between 2010 and 2015, (%) 14.4 5.4
Population size, avg 2011-15 (millions) 0.3 505.5
Change in population between 2010 and 2015 (%) 3.6 1.1
Population aged 15-64, avg 2011-2015 (%) 66.4 66.1
Population density, average 2011-15 3.2 116.4
Degree of urbanisation, average 2011-15 (%) 93.9 74.4
Values in green show performance above 120% of EU, values in red show performance below 80% of EU.
121 123 127 126 126 124 122
119
0
20
40
60
80
100
120
140
160
180
2010 2011 2012 2013 2014 2015 2016
Relative to EU in 2010 Relative to EU in 2016
Iceland
Performance
relative to EU
2010 inChange
2010-
20162010 2016
SUMMARY INNOVATION INDEX 121.4 121.7 0.2
Human resources 130.4 150.1 19.7
New doctorate graduates 38.5 53.8 15.4
Population with tertiary education 119.1 166.4 47.4
Lifelong learning 254.7 247.4 -7.4
Attractive research systems 164.6 183.0 18.3
International scientific co-publications 649.2 649.2 0.0
Most cited publications 91.4 96.3 4.9
Foreign doctorate students 97.8 142.1 44.3
Innovation-friendly environment § 225.3 229.9 4.6
Broadband penetration N/A N/A N/A
Opportunity-driven entrepreneurship 192.1 196.1 3.9
Finance and support § 123.5 123.5 0.0
R&D expenditure in the public sector 110.7 110.7 0.0
Venture capital expenditures N/A N/A N/A
Firm investments § 134.9 140.7 5.8
R&D expenditure in the business sector 82.0 119.7 37.8
Non-R&D innovation expenditures N/A N/A N/A
Enterprises providing ICT training 171.4 142.9 -28.6
Innovators § 151.1 125.0 -26.1
SMEs product/process innovations 181.9 139.4 -42.5
SMEs marketing/organizational innovations 120.9 110.7 -10.2
SMEs innovating in-house N/A N/A N/A
Linkages 150.7 146.6 -4.1
Innovative SMEs collaborating with others 163.1 194.7 31.7
Public-private co-publications 206.8 206.8 0.0
Private co-funding of public R&D exp. 92.4 55.4 -37.0
Intellectual assets 68.5 73.0 4.5
PCT patent applications 83.1 93.4 10.3
Trademark applications 106.4 128.7 22.3
Design applications 19.7 2.7 -16.9
Employment impacts § 134.2 152.6 18.4
Employment in knowledge-intensive activities 159.0 180.8 21.8
Employment fast-growing enterprises N/A N/A N/A
Sales impacts 59.0 42.9 -16.1
Medium and high tech product exports 0.0 0.0 0.0
Knowledge-intensive services exports 96.3 99.1 2.8
Sales of new-to-market/firm innovations 86.4 28.9 -57.6
Dark green: normalised performance above 120% of EU; light green: normalised performance between 90% and 120% of EU; yellow: normalised performance between 50% and 90% of EU; orange: normalised performance below 50% of EU. Normalised performance uses the data after a possible imputation of missing data and transformation of the data.
§ Due to missing data, the relative dimension score does not necessarily reflect that of the indicators.
Change highlighted in green is positive; change highlighted in light red is negative.

71European Innovation Scoreboard 2017
Israel is a Strong Innovator. Over time,
performance has declined by 8.1% relative to
that of the EU in 2010.
Innovation system
Relative strengths of the innovation system are in Firm investments,
Employment impacts, and Intellectual assets. Relative weaknesses are
in Finance and support, Innovators, and Linkages.
Structural differences
Notable differences are a smaller share of employment in Industry,
a lower average R&D spending of Top R&D spending enterprises,
a higher growth rate of GDP, a higher growth rate of population, and
higher population density.
IL EU
Structure of the economy
Share of employment in Agriculture, avg 2011-15 1.3 4.8
Share of employment in Industry, avg 2011-15 17.9 24.4
Share of employment in Services, avg 2011-15 79.0 70.2
Business indicators
Top R&D spending enterprises
- average number per 10 mln population, 2011-15 24.1 29.9
- average R&D spending, mln Euros, 2011-15 118.1 165.8
Buyer sophistication 1-7 (best), 2013-14 3.8 3.6
Ease of starting a business, Doing Business 2017 71.7 76.5
Socio-demographic indicators
GDP per capita, PPS, avg 2011-13 24,600 25,400
Change in GDP between 2010 and 2015, (%) 18.7 5.4
Population size, avg 2011-15 (millions) 8.1 505.5
Change in population between 2010 and 2015 (%) 9.9 1.1
Population aged 15-64, avg 2011-2015 (%) 61.5 66.1
Population density, average 2011-15 372.8 116.4
Degree of urbanisation, average 2011-15 (%) 92.0 74.4
Values in green show performance above 120% of EU, values in red show performance below 80% of EU.
119 118 118 119111 112 111
109
0
20
40
60
80
100
120
140
160
180
2010 2011 2012 2013 2014 2015 2016
Relative to EU in 2010 Relative to EU in 2016
Israel
Performance
relative to EU
2010 inChange
2010-
20162010 2016
SUMMARY INNOVATION INDEX 119.2 111.0 -8.1
Human resources § 94.3 105.5 11.2
New doctorate graduates 87.8 98.2 10.5
Population with tertiary education N/A N/A N/A
Lifelong learning N/A N/A N/A
Attractive research systems § 119.0 129.9 10.9
International scientific co-publications 234.1 301.0 66.8
Most cited publications 96.0 93.7 -2.4
Foreign doctorate students N/A N/A N/A
Innovation-friendly environment § 86.2 104.2 18.0
Broadband penetration N/A N/A N/A
Opportunity-driven entrepreneurship 73.5 88.9 15.4
Finance and support 49.5 47.3 -2.2
R&D expenditure in the public sector 83.2 77.4 -5.7
Venture capital expenditures 7.0 9.2 2.2
Firm investments § 239.4 239.4 0.0
R&D expenditure in the business sector 217.6 217.6 0.0
Non-R&D innovation expenditures N/A N/A N/A
Enterprises providing ICT training N/A N/A N/A
Innovators 117.9 74.4 -43.5
SMEs product/process innovations 82.2 44.3 -37.9
SMEs marketing/organizational innovations 176.6 117.2 -59.3
SMEs innovating in-house 93.4 60.6 -32.9
Linkages 122.8 94.9 -27.9
Innovative SMEs collaborating with others 159.5 117.3 -42.1
Public-private co-publications 102.6 72.9 -29.7
Private co-funding of public R&D exp. 110.1 95.5 -14.6
Intellectual assets 125.9 131.7 5.8
PCT patent applications 156.8 156.8 0.0
Trademark applications 207.9 210.6 2.8
Design applications 21.6 37.5 15.9
Employment impacts § 186.1 186.1 0.0
Employment in knowledge-intensive activities 220.5 220.5 0.0
Employment fast-growing enterprises N/A N/A N/A
Sales impacts 93.5 97.3 3.7
Medium and high tech product exports 95.2 96.1 0.9
Knowledge-intensive services exports 107.0 107.6 0.6
Sales of new-to-market/firm innovations 75.7 86.5 10.9
Dark green: normalised performance above 120% of EU; light green: normalised performance between 90% and 120% of EU; yellow: normalised performance between 50% and 90% of EU; orange: normalised performance below 50% of EU. Normalised performance uses the data after a possible imputation of missing data and transformation of the data.
§ Due to missing data, the relative dimension score does not necessarily reflect that of the indicators.
Change highlighted in green is positive; change highlighted in light red is negative.

72 European Innovation Scoreboard 2017
The Former Yugoslav Republic of
Macedonia (FYROM) is a Modest Innovator.
Over time, performance has increased by
10.4% relative to that of the EU in 2010.
Innovation system
Relative strengths of the innovation system are in Sales impacts, Firm
investment, and Innovation-friendly environment. Relative weaknesses
are in Finance and support, Employment impacts, and Intellectual assets.
Structural differences
Notable differences are a larger share of employment in Industry,
a smaller share of employment in Services, lower buyer sophistication,
lower GDP per capita, a higher growth rate of GDP, a lower growth rate
of population, and lower population density.
MK EU
Structure of the economy
Share of employment in Agriculture, avg 2011-15 18.2 4.8
Share of employment in Industry, avg 2011-15 30.2 24.4
Share of employment in Services, avg 2011-15 53.6 70.2
Business indicators
Top R&D spending enterprises
- average number per 10 mln population, 2011-15 none 29.9
- average R&D spending, mln Euros, 2011-15 none 165.8
Buyer sophistication 1-7 (best), 2013-14 2.8 3.6
Ease of starting a business, Doing Business 2017 81.7 76.5
Socio-demographic indicators
GDP per capita, PPS, avg 2011-13 3600 25,400
Change in GDP between 2010 and 2015, (%) 12.5 5.4
Population size, avg 2011-15 (millions) 2.1 505.5
Change in population between 2010 and 2015 (%) 0.8 1.1
Population aged 15-64, avg 2011-2015 (%) 70.8 66.1
Population density, average 2011-15 82.2 116.4
Degree of urbanisation, average 2011-15 (%) 57.0 74.4
Values in green show performance above 120% of EU, values in red show performance below 80% of EU.
34 37 38 37 40 42 44
430
20
40
60
80
100
120
140
160
180
2010 2011 2012 2013 2014 2015 2016
Relative to EU in 2010 Relative to EU in 2016
Former Yugoslav Republic of Macedonia
(FYROM)
Performance
relative to EU
2010 inChange
2010-
20162010 2016
SUMMARY INNOVATION INDEX 33.8 44.2 10.4
Human resources 21.1 49.3 28.2
New doctorate graduates 15.4 33.1 17.7
Population with tertiary education 24.3 92.8 68.4
Lifelong learning 24.2 17.9 -6.3
Attractive research systems 14.7 25.3 10.6
International scientific co-publications 12.6 35.5 22.9
Most cited publications 22.0 27.7 5.7
Foreign doctorate students 4.7 18.1 13.4
Innovation-friendly environment 34.7 61.7 27.0
Broadband penetration 77.8 122.2 44.4
Opportunity-driven entrepreneurship 4.2 18.9 14.7
Finance and support 0.0 2.8 2.8
R&D expenditure in the public sector 0.1 5.1 5.0
Venture capital expenditures 0.0 0.0 0.0
Firm investments 60.7 67.9 7.2
R&D expenditure in the business sector 1.5 0.8 -0.7
Non-R&D innovation expenditures 132.7 132.7 0.0
Enterprises providing ICT training 64.3 85.7 21.4
Innovators 66.2 66.2 0.0
SMEs product/process innovations 117.5 117.5 0.0
SMEs marketing/organizational innovations 68.2 68.2 0.0
SMEs innovating in-house 13.5 13.5 0.0
Linkages § 38.6 41.2 2.5
Innovative SMEs collaborating with others 84.2 84.2 0.0
Public-private co-publications 0.0 5.3 5.3
Private co-funding of public R&D exp. N/A N/A N/A
Intellectual assets 13.8 13.9 0.2
PCT patent applications 22.8 14.7 -8.1
Trademark applications 15.0 29.6 14.5
Design applications 0.6 1.0 0.3
Employment impacts § 16.2 8.7 -7.6
Employment in knowledge-intensive activities 19.2 10.3 -9.0
Employment fast-growing enterprises N/A N/A N/A
Sales impacts 46.2 70.6 24.4
Medium and high tech product exports 33.0 104.9 71.9
Knowledge-intensive services exports 42.3 38.5 -3.8
Sales of new-to-market/firm innovations 66.8 66.8 0.0
Dark green: normalised performance above 120% of EU; light green: normalised performance between 90% and 120% of EU; yellow: normalised performance between 50% and 90% of EU; orange: normalised performance below 50% of EU. Normalised performance uses the data after a possible imputation of missing data and transformation of the data.
§ Due to missing data, the relative dimension score does not necessarily reflect that of the indicators.
Change highlighted in green is positive; change highlighted in light red is negative.

73European Innovation Scoreboard 2017
Norway is a Strong Innovator. Over time,
performance has increased by 14.7% relative
to that of the EU in 2010.
Innovation system
Relative strengths of the innovation system are in Innovation-friendly
environment, Human resources, and Attractive research systems.
Relative weaknesses are in Intellectual assets, Sales impacts, and
Employment impacts.
Structural differences
Notable differences are a smaller share of employment in Manufacturing,
a larger share of micro enterprises in turnover, a larger share of foreign
controlled enterprises, a lower average R&D spending among Top R&D
spending enterprises, a smaller share of enterprise births, higher GDP per
capita, a higher growth rate of GDP, a higher growth rate of population,
and lower population density.
NO EU
Structure of the economy
Composition of employment, average 2011-15
- Agriculture & Mining (NACE A-B) (%) 4.8 5.1
- Manufacturing (NACE C) (%) 9.0 15.6
of which High and Medium high-tech (%) 33.2 36.4
- Utilities and Construction (NACE D-F) (%) 8.8 8.6
- Services (NACE G-N) (%) 71.4 63.6
of which Knowledge-intensive services (%) 67.0 58.0
- Public administration, etc. (NACE O-U) (%) 6.1 7.1
Business indicators
Composition of turnover, average 2011-2014
- Micro enterprises (0-9 employees) (%) 24.3 17.3
- SMEs (10-249 employees) (%) 35.5 38.0
- Large enterprises (250+ employees) (%) 39.3 44.1
Share of foreign controlled enterprises, 2014 (%) 2.29 1.18
Top R&D spending enterprises
- average number per 10 mln population, 2011-15 32.4 29.9
- average R&D spending, mln Euros, 2011-15 93.7 165.8
Enterprise births (10+ empl.) (%), avg 2012-14 0.6 1.5
Buyer sophistication 1-7 (best), 2013-14 4.3 3.6
Ease of starting a business, Doing Business 2017 82.8 76.5
Socio-demographic indicators
GDP per capita, PPS, avg 2011-13 48,500 25,400
Change in GDP between 2010 and 2015, (%) 8.5 5.4
Population size, avg 2011-15 (millions) 5.0 505.5
Change in population between 2010 and 2015 (%) 6.3 1.1
Population aged 15-64, avg 2011-2015 (%) 66.0 66.1
Population density, average 2011-15 30.9 116.4
Degree of urbanisation, average 2011-15 (%) 57.0 69.3
Values in green show performance above 120% of EU, values in red show performance below 80% of EU.
101 103 102 102 100 101116
114
0
20
40
60
80
100
120
140
160
180
2010 2011 2012 2013 2014 2015 2016
Relative to EU in 2010 Relative to EU in 2016
Norway
Performance
relative to EU
2010 inChange
2010-
20162010 2016
SUMMARY INNOVATION INDEX 101.1 115.8 14.7
Human resources 155.5 178.0 22.5
New doctorate graduates 115.4 139.3 23.9
Population with tertiary education 177.0 204.6 27.6
Lifelong learning 178.9 193.7 14.7
Attractive research systems 151.3 162.6 11.3
International scientific co-publications 369.0 588.0 219.0
Most cited publications 116.8 110.0 -6.8
Foreign doctorate students 123.6 87.0 -36.6
Innovation-friendly environment 159.6 202.3 42.7
Broadband penetration 144.4 211.1 66.7
Opportunity-driven entrepreneurship 170.3 196.1 25.8
Finance and support 116.2 107.0 -9.2
R&D expenditure in the public sector 119.5 128.4 8.9
Venture capital expenditures 111.9 80.0 -31.9
Firm investments 107.0 136.8 29.8
R&D expenditure in the business sector 74.2 88.0 13.7
Non-R&D innovation expenditures 0.0 87.2 87.2
Enterprises providing ICT training 228.6 228.6 0.0
Innovators 73.1 119.9 46.7
SMEs product/process innovations 73.2 125.5 52.3
SMEs marketing/organizational innovations 68.2 111.5 43.3
SMEs innovating in-house 78.0 122.8 44.8
Linkages 120.2 118.6 -1.6
Innovative SMEs collaborating with others 119.0 178.9 59.9
Public-private co-publications 151.4 100.8 -50.6
Private co-funding of public R&D exp. 94.4 84.6 -9.8
Intellectual assets 55.3 50.0 -5.3
PCT patent applications 87.8 85.5 -2.4
Trademark applications 45.8 42.4 -3.4
Design applications 18.7 8.1 -10.6
Employment impacts 96.1 106.3 10.2
Employment in knowledge-intensive activities 111.5 121.8 10.3
Employment fast-growing enterprises 84.9 95.0 10.1
Sales impacts 44.4 50.4 6.0
Medium and high tech product exports 0.0 0.0 0.0
Knowledge-intensive services exports 115.3 119.8 4.5
Sales of new-to-market/firm innovations 14.7 29.8 15.1
Dark green: normalised performance above 120% of EU; light green: normalised performance between 90% and 120% of EU; yellow: normalised performance between 50% and 90% of EU; orange: normalised performance below 50% of EU. Normalised performance uses the data after a possible imputation of missing data and transformation of the data.
§ Due to missing data, the relative dimension score does not necessarily reflect that of the indicators.
Change highlighted in green is positive; change highlighted in light red is negative.

74 European Innovation Scoreboard 2017
Serbia is a Moderate Innovator. Over time,
performance has increased by 17.3% relative
to that of the EU in 2010.
Innovation system
Relative strengths of the innovation system are in Firm investments,
Employment impacts, and Innovators. Relative weaknesses are in
Intellectual assets, Innovation-friendly environment, and Linkages.
Structural differences
Notable differences are a smaller share of employment in Services,
lower buyer sophistication, lower GDP per capita, a lower growth rate
of GDP, a lower and negative growth rate of population, and lower
population density.
RS EU
Structure of the economy
Share of employment in Agriculture, avg 2011-15 20.8 4.8
Share of employment in Industry, avg 2011-15 25.6 24.4
Share of employment in Services, avg 2011-15 53.6 70.2
Business indicators
Top R&D spending enterprises
- average number per 10 mln population, 2011-15 none 29.9
- average R&D spending, mln Euros, 2011-15 none 165.8
Buyer sophistication 1-7 (best), 2013-14 2.4 3.6
Ease of starting a business, Doing Business 2017 72.3 76.5
Socio-demographic indicators
GDP per capita, PPS, avg 2011-13 9000 25,400
Change in GDP between 2010 and 2015, (%) 1.8 5.4
Population size, avg 2011-15 (millions) 7.2 505.5
Change in population between 2010 and 2015 (%) -2.6 1.1
Population aged 15-64, avg 2011-2015 (%) 67.9 66.1
Population density, average 2011-15 81.9 116.4
Degree of urbanisation, average 2011-15 (%) 55.4 74.4
Values in green show performance above 120% of EU, values in red show performance below 80% of EU.
47 4659 61 62 63 64
63
0
20
40
60
80
100
120
140
160
180
2010 2011 2012 2013 2014 2015 2016
Relative to EU in 2010 Relative to EU in 2016
Serbia
Performance
relative to EU
2010 inChange
2010-
20162010 2016
SUMMARY INNOVATION INDEX 46.8 64.2 17.3
Human resources § 28.1 76.8 48.7
New doctorate graduates 26.2 71.5 45.4
Population with tertiary education N/A N/A N/A
Lifelong learning N/A N/A N/A
Attractive research systems 30.5 44.1 13.6
International scientific co-publications 46.8 97.8 51.0
Most cited publications 33.7 42.7 9.0
Foreign doctorate students 20.2 27.0 6.8
Innovation-friendly environment 39.2 37.0 -2.2
Broadband penetration 33.3 33.3 0.0
Opportunity-driven entrepreneurship 43.4 39.5 -3.8
Finance and support 66.9 43.9 -23.0
R&D expenditure in the public sector 103.9 78.7 -25.2
Venture capital expenditures 20.2 0.0 -20.2
Firm investments 78.5 130.2 51.7
R&D expenditure in the business sector 8.5 21.9 13.4
Non-R&D innovation expenditures 116.1 280.8 164.7
Enterprises providing ICT training 121.4 121.4 0.0
Innovators 46.8 81.2 34.4
SMEs product/process innovations 27.7 70.6 42.9
SMEs marketing/organizational innovations 23.8 87.7 63.8
SMEs innovating in-house 89.0 85.1 -3.9
Linkages 31.0 42.6 11.6
Innovative SMEs collaborating with others 23.1 73.2 50.1
Public-private co-publications 37.4 25.8 -11.6
Private co-funding of public R&D exp. 32.0 32.0 0.0
Intellectual assets § 24.1 22.7 -1.4
PCT patent applications N/A N/A N/A
Trademark applications 65.4 59.3 -6.1
Design applications 0.0 1.7 1.7
Employment impacts § 71.6 94.0 22.4
Employment in knowledge-intensive activities 84.9 111.4 26.5
Employment fast-growing enterprises N/A N/A N/A
Sales impacts 45.4 65.3 19.9
Medium and high tech product exports 20.0 55.8 35.8
Knowledge-intensive services exports 52.5 52.9 0.5
Sales of new-to-market/firm innovations 67.9 91.2 23.4
Dark green: normalised performance above 120% of EU; light green: normalised performance between 90% and 120% of EU; yellow: normalised performance between 50% and 90% of EU; orange: normalised performance below 50% of EU. Normalised performance uses the data after a possible imputation of missing data and transformation of the data.
§ Due to missing data, the relative dimension score does not necessarily reflect that of the indicators.
Change highlighted in green is positive; change highlighted in light red is negative.

75European Innovation Scoreboard 2017
Switzerland is an Innovation Leader. Over time,
performance has increased by 9.2% relative to that
of the EU in 2010.
Innovation system
Relative strengths of the innovation system are in Attractive research
systems, Human resources, and Firm investments. Relative weaknesses
are in Finance and support, Sales impacts, and Employment impacts.
Structural differences
Notable differences are a smaller share of employment in Agriculture
& Mining, a larger share of employment in High and Medium high-tech
manufacturing, a smaller share of employment in Public administration,
a smaller share of micro enterprises in turnover, a higher number of
Top R&D spending enterprises and a higher average R&D spending
of these enterprises, a smaller share of enterprise births, higher buyer
sophistication, higher GDP per capita, a higher growth rate of GDP,
a higher growth rate of population, and higher population density.
CH EU
Structure of the economy
Composition of employment, average 2011-15
- Agriculture & Mining (NACE A-B) (%) 3.5 5.1
- Manufacturing (NACE C) (%) 13.6 15.6
of which High and Medium high-tech (%) 45.5 36.4
- Utilities and Construction (NACE D-F) (%) 7.3 8.6
- Services (NACE G-N) (%) 70.4 63.6
of which Knowledge-intensive services (%) 65.6 58.0
- Public administration, etc. (NACE O-U) (%) 5.3 7.1
Business indicators
Composition of turnover, average 2011-2014
- Micro enterprises (0-9 employees) (%) 8.5 17.3
- SMEs (10-249 employees) (%) n/a 38.0
- Large enterprises (250+ employees) (%) n/a 44.1
Share of foreign controlled enterprises, 2014 (%) n/a 1.18
Top R&D spending enterprises
- average number per 10 mln population, 2011-15 98.8 29.9
- average R&D spending, mln Euros, 2011-15 444.8 165.8
Enterprise births (10+ empl.) (%), avg 2012-14 0.2 1.5
Buyer sophistication 1-7 (best), 2013-14 5.0 3.6
Ease of starting a business, Doing Business 2017 76.1 76.5
Socio-demographic indicators
GDP per capita, PPS, avg 2011-13 39,900 25,400
Change in GDP between 2010 and 2015, (%) 7.7 5.4
Population size, avg 2011-15 (millions) 8.0 505.5
Change in population between 2010 and 2015 (%) 5.8 1.1
Population aged 15-64, avg 2011-2015 (%) 67.7 66.1
Population density, average 2011-15 204.8 116.4
Degree of urbanisation, average 2011-15 (%) 73.8 74.4
Values in green show performance above 120% of EU, values in red show performance below 80% of EU.
155 156 154 158 158 162 165
161
0
20
40
60
80
100
120
140
160
180
2010 2011 2012 2013 2014 2015 2016
Relative to EU in 2010 Relative to EU in 2016
Switzerland
Performance
relative to EU
2010 inChange
2010-
20162010 2016
SUMMARY INNOVATION INDEX 155.4 164.6 9.2
Human resources 217.7 242.3 24.6
New doctorate graduates 234.1 234.1 0.0
Population with tertiary education 144.7 215.8 71.1
Lifelong learning 283.2 283.2 0.0
Attractive research systems 234.5 246.2 11.7
International scientific co-publications 642.4 649.2 6.9
Most cited publications 157.5 157.2 -0.3
Foreign doctorate students 200.5 231.4 30.9
Innovation-friendly environment § 189.6 154.0 -35.6
Broadband penetration N/A N/A N/A
Opportunity-driven entrepreneurship 161.7 131.4 -30.3
Finance and support 91.6 105.5 13.9
R&D expenditure in the public sector 92.9 133.8 40.9
Venture capital expenditures 89.9 69.8 -20.1
Firm investments § 168.8 215.8 47.0
R&D expenditure in the business sector 170.4 174.7 4.3
Non-R&D innovation expenditures 176.1 280.8 104.7
Enterprises providing ICT training N/A N/A N/A
Innovators 149.8 162.9 13.2
SMEs product/process innovations 181.9 156.0 -25.9
SMEs marketing/organizational innovations 176.6 176.6 0.0
SMEs innovating in-house 90.7 155.9 65.2
Linkages 123.3 154.8 31.5
Innovative SMEs collaborating with others 82.2 75.7 -6.5
Public-private co-publications 206.8 206.8 0.0
Private co-funding of public R&D exp. 85.2 174.8 89.6
Intellectual assets 163.3 151.0 -12.3
PCT patent applications 142.3 134.2 -8.1
Trademark applications 221.8 203.5 -18.4
Design applications 146.9 133.5 -13.4
Employment impacts 111.7 123.6 11.9
Employment in knowledge-intensive activities 182.1 210.3 28.2
Employment fast-growing enterprises 60.4 60.4 0.0
Sales impacts 128.7 111.5 -17.2
Medium and high tech product exports 121.3 82.1 -39.2
Knowledge-intensive services exports 97.3 98.1 0.8
Sales of new-to-market/firm innovations 174.5 162.9 -11.7
Dark green: normalised performance above 120% of EU; light green: normalised performance between 90% and 120% of EU; yellow: normalised performance between 50% and 90% of EU; orange: normalised performance below 50% of EU. Normalised performance uses the data after a possible imputation of missing data and transformation of the data.
§ Due to missing data, the relative dimension score does not necessarily reflect that of the indicators.
Change highlighted in green is positive; change highlighted in light red is negative.

76 European Innovation Scoreboard 2017
Turkey is a Moderate Innovator. Over time,
performance has increased by 13.2% relative
to that of the EU in 2010.
Innovation system
Relative strengths of the innovation system are in Firm investments,
Innovation-friendly environment, and Innovators. Relative weaknesses
are in Employment impacts, Intellectual assets, and Attractive research
systems.
Structural differences
Notable differences are a larger share of employment in Agriculture &
Mining and Manufacturing, a smaller share of employment in High and
Medium high-tech manufacturing, Services and Knowledge-intensive
services, a lower number of Top R&D spending enterprises and a lower
average R&D spending of these enterprises, lower GDP per capita,
a higher growth rate of GDP, a higher growth rate of population, and
a lower degree of urbanisation.
TR EU
Structure of the economy
Composition of employment, average 2011-15
- Agriculture & Mining (NACE A-B) (%) 24.0 5.1
- Manufacturing (NACE C) (%) 18.7 15.6
of which High and Medium high-tech (%) 16.1 36.4
- Utilities and Construction (NACE D-F) (%) 7.1 8.6
- Services (NACE G-N) (%) 44.4 63.6
of which Knowledge-intensive services (%) 39.1 58.0
- Public administration, etc. (NACE O-U) (%) 5.8 7.1
Business indicators
Composition of turnover, average 2011-2014
- Micro + SMEs (1-249 employees) (%) 63.8 55.4
- Large enterprises (250+ employees) (%) 36.2 44.1
Share of foreign controlled enterprises, 2014 (%) n/a 1.18
Top R&D spending enterprises
- average number per 10 mln population, 2011-15 1.3 29.9
- average R&D spending, mln Euros, 2011-15 62.2 165.8
Enterprise births (10+ empl.) (%), avg 2012-14 n/a 1.5
Buyer sophistication 1-7 (best), 2013-14 3.5 3.6
Ease of starting a business, Doing Business 2017 67.2 76.5
Socio-demographic indicators
GDP per capita, PPS, avg 2011-13 13,400 25,400
Change in GDP between 2010 and 2015, (%) 40.9 5.4
Population size, avg 2011-15 (millions) 75.7 505.5
Change in population between 2010 and 2015 (%) 7.1 1.1
Population aged 15-64, avg 2011-2015 (%) 67.5 66.1
Population density, average 2011-15 99.0 116.4
Degree of urbanisation, average 2011-15 (%) 55.4 69.3
Values in green show performance above 120% of EU, values in red show performance below 80% of EU.
47 47 47 4759 61 60
59
0
20
40
60
80
100
120
140
160
180
2010 2011 2012 2013 2014 2015 2016
Relative to EU in 2010 Relative to EU in 2016
Turkey
Performance
relative to EU
2010 inChange
2010-
20162010 2016
SUMMARY INNOVATION INDEX 46.5 59.7 13.2
Human resources 16.8 45.7 29.0
New doctorate graduates 7.7 15.8 8.2
Population with tertiary education 0.0 74.3 74.3
Lifelong learning 47.4 48.4 1.1
Attractive research systems 27.3 27.2 -0.1
International scientific co-publications 3.2 17.3 14.1
Most cited publications 44.3 36.3 -8.0
Foreign doctorate students 11.3 17.6 6.2
Innovation-friendly environment 88.5 110.9 22.4
Broadband penetration 155.6 177.8 22.2
Opportunity-driven entrepreneurship 41.2 63.7 22.5
Finance and support § 69.9 69.9 0.0
R&D expenditure in the public sector 62.7 62.7 0.0
Venture capital expenditures N/A N/A N/A
Firm investments § 22.9 142.1 119.2
R&D expenditure in the business sector 27.0 40.8 13.7
Non-R&D innovation expenditures 18.8 280.8 261.9
Enterprises providing ICT training N/A N/A N/A
Innovators 98.4 83.9 -14.5
SMEs product/process innovations 75.8 84.6 8.7
SMEs marketing/organizational innovations 136.1 102.0 -34.1
SMEs innovating in-house 82.4 64.8 -17.6
Linkages 65.1 62.9 -2.2
Innovative SMEs collaborating with others 40.9 51.1 10.2
Public-private co-publications 13.5 7.2 -6.3
Private co-funding of public R&D exp. 129.4 120.5 -8.9
Intellectual assets 17.3 21.5 4.2
PCT patent applications 35.4 47.4 12.0
Trademark applications 2.2 0.0 -2.2
Design applications 4.5 3.0 -1.4
Employment impacts § 0.0 9.7 9.7
Employment in knowledge-intensive activities 0.0 11.5 11.5
Employment fast-growing enterprises N/A N/A N/A
Sales impacts 38.1 47.8 9.7
Medium and high tech product exports 51.9 51.3 -0.6
Knowledge-intensive services exports 20.3 22.9 2.6
Sales of new-to-market/firm innovations 42.4 72.8 30.4
Dark green: normalised performance above 120% of EU; light green: normalised performance between 90% and 120% of EU; yellow: normalised performance between 50% and 90% of EU; orange: normalised performance below 50% of EU. Normalised performance uses the data after a possible imputation of missing data and transformation of the data.
§ Due to missing data, the relative dimension score does not necessarily reflect that of the indicators.
Change highlighted in green is positive; change highlighted in light red is negative.

77European Innovation Scoreboard 2017
Ukraine is a Modest Innovator. Over time,
performance has declined by 4.2% relative to
that of the EU in 2010.
Innovation system
Relative strengths of the innovation system are in Employment impacts,
Human resources, and Firm investments. Relative weaknesses are in
Linkages, Attractive research systems, and Innovators.
Structural differences
Notable differences are lower GDP per capita, a lower and negative
growth rate of GDP, a lower and negative growth rate of population, and
lower population density.
UA EU
Structure of the economy
Share of employment in Agriculture, avg 2011-15 18.0 4.8
Share of employment in Industry, avg 2011-15 25.4 24.4
Share of employment in Services, avg 2011-15 56.4 70.2
Business indicators
Top R&D spending enterprises
- average number per 10 mln population, 2011-15 none 29.9
- average R&D spending, mln Euros, 2011-15 none 165.8
Buyer sophistication 1-7 (best), 2013-14 3.4 3.6
Ease of starting a business, Doing Business 2017 63.9 76.5
Socio-demographic indicators
GDP per capita, PPS, avg 2011-13 2700 25,400
Change in GDP between 2010 and 2015, (%) -11.0 5.4
Population size, avg 2011-15 (millions) 45.4 505.5
Change in population between 2010 and 2015 (%) -1.6 1.1
Population aged 15-64, avg 2011-2015 (%) 70.1 66.1
Population density, average 2011-15 78.4 116.4
Degree of urbanisation, average 2011-15 (%) 69.3 74.4
Values in green show performance above 120% of EU, values in red show performance below 80% of EU.
33 33 32 31 32 31 29
280
20
40
60
80
100
120
140
160
180
2010 2011 2012 2013 2014 2015 2016
Relative to EU in 2010 Relative to EU in 2016
Ukraine
Performance
relative to EU
2010 inChange
2010-
20162010 2016
SUMMARY INNOVATION INDEX 33.1 28.9 -4.2
Human resources § 66.1 66.1 0.0
New doctorate graduates 61.5 61.5 0.0
Population with tertiary education N/A N/A N/A
Lifelong learning N/A N/A N/A
Attractive research systems § 13.0 14.9 1.9
International scientific co-publications 0.7 5.6 4.9
Most cited publications 16.6 17.8 1.2
Foreign doctorate students N/A N/A N/A
Innovation-friendly environment N/A N/A N/A
Broadband penetration N/A N/A N/A
Opportunity-driven entrepreneurship N/A N/A N/A
Finance and support 23.9 19.0 -4.8
R&D expenditure in the public sector 41.2 32.5 -8.7
Venture capital expenditures 2.1 2.1 0.0
Firm investments § 70.5 46.8 -23.7
R&D expenditure in the business sector 38.3 33.9 -4.4
Non-R&D innovation expenditures 116.1 66.1 -50.0
Enterprises providing ICT training N/A N/A N/A
Innovators 17.1 15.7 -1.4
SMEs product/process innovations 0.0 0.0 0.0
SMEs marketing/organizational innovations 0.0 0.0 0.0
SMEs innovating in-house 51.4 47.3 -4.1
Linkages § 5.7 4.6 -1.0
Innovative SMEs collaborating with others 5.0 3.0 -2.0
Public-private co-publications 7.0 6.8 -0.2
Private co-funding of public R&D exp. N/A N/A N/A
Intellectual assets 16.8 23.6 6.8
PCT patent applications 27.7 38.1 10.4
Trademark applications 19.3 17.3 -2.0
Design applications 0.1 8.8 8.7
Employment impacts § 69.3 77.9 8.7
Employment in knowledge-intensive activities 82.1 92.3 10.3
Employment fast-growing enterprises N/A N/A N/A
Sales impacts 47.0 33.1 -13.9
Medium and high tech product exports 56.8 26.0 -30.8
Knowledge-intensive services exports 63.1 67.4 4.4
Sales of new-to-market/firm innovations 16.4 1.6 -14.8
Dark green: normalised performance above 120% of EU; light green: normalised performance between 90% and 120% of EU; yellow: normalised performance between 50% and 90% of EU; orange: normalised performance below 50% of EU. Normalised performance uses the data after a possible imputation of missing data and transformation of the data.
§ Due to missing data, the relative dimension score does not necessarily reflect that of the indicators.
Change highlighted in green is positive; change highlighted in light red is negative.

78 European Innovation Scoreboard 2017
8. European Innovation Scoreboard methodology
The overall performance of each country’s innovation system has
been summarised in a composite indicator, the Summary Innovation
Index. Full details on the EIS methodology are available in the EIS
2017 Methodology Report33. The methodology used for calculating the
Summary Innovation Index is as follows:
European benchmark
Step 1: Identifying and replacing outliers
Positive outliers are identified as those country scores which are
higher than the mean across all countries plus twice the standard
deviation. Negative outliers are identified as those country scores
which are smaller than the mean across all countries minus twice
the standard deviation. These outliers are replaced by the respective
maximum and minimum values observed over all the years and all
countries.
Step 2: Setting reference years
For each indicator, a reference year is identified based on data
availability for all countries for which data availability is at least
75%. For most indicators, this reference year will be lagging one
or two years behind the year to which the EIS refers (cf. Annex E).
Step 3: Imputing for missing values
Reference year data are then used for “2016”, etc. If data for
a year-in-between is not available, missing values are replaced
with the value for the previous year. If data are not available at
the beginning of the time series, missing values are replaced with
the next available year. The following examples clarify this step and
show how ‘missing’ data are imputed. If data are missing for all
years, no data will be imputed (the indicator will not contribute to
the Summary Innovation Index).
Step 4: Determining Maximum and Minimum scores
The Maximum score is the highest score found for the whole time period
within all countries excluding positive outliers. Similarly, the Minimum
score is the lowest score found for the whole time period within all
countries excluding negative outliers.
Step 5: Transforming data if data are highly skewed
Most of the indicators are fractional indicators with values between 0%
and 100%. Some indicators are unbound indicators, where values are
not limited to an upper threshold. These indicators can be highly volatile
and can have skewed data distributions (where most countries show
low performance levels and a few countries show exceptionally high
performance levels). For these indicators where the degree of skewness
across the full eight-year period is above one, data have been transformed
using a square root transformation. For the following indicators data have
been transformed: Opportunity-driven entrepreneurship, Public-private
co-publications, PCT patent applications, and Trademarks. A square
root transformation means using the square root of the indicator value
instead of the original value.
Step 6: Calculating re-scaled scores
Re-scaled scores of the country scores (after correcting for outliers and
a possible transformation of the data) for all years are calculated by
first subtracting the Minimum score and then dividing by the difference
between the Maximum and Minimum score. The maximum re-scaled
score is thus equal to 1, and the minimum re-scaled score is equal to 0.
For positive and negative outliers, the re-scaled score is equal to 1 or 0,
respectively.
Latest year missing “2016” “2015” “2014” “2013” “2012”
Available data N/A 45 40 35 30
Use most recent year 45 45 40 35 30
Year-in-between missing “2016” “2015” “2014” “2013” “2012”
Available data 50 N/A 40 35 30
Substitute with previous year 50 40 40 35 30
Beginning-of-period missing “2016” “2015” “2014” “2013” “2012”
Available data 50 45 40 35 N/A
Substitute with next available year 50 45 40 35 35
33 http://ec.europa.eu/growth/industry/innovation/facts-figures/scoreboards

79European Innovation Scoreboard 2017
Step 7: Calculating composite innovation indexes
For each year, a composite Summary Innovation Index is calculated as
the unweighted average of the re-scaled scores for all indicators where
all indicators receive the same weight (1/27 if data are available for all
27 indicators).
Step 8: Calculating relative to EU performance scores
Performance scores relative to the EU are then calculated as the SII of
the respective country divided by the SII of the EU multiplied by 100.
Relative performance scores are calculated for the full eight-year period
compared to the performance of the EU in 2010 and for the latest year
also to that of the EU in 2016. For the definition of the performance
groups, only the performance scores relative to the EU in 2016 have
been used.
International benchmark
The methodology for calculating average innovation performance
for the EU and its major global competitors is similar to that used for
calculating average innovation performance for the EU Member States,
but using a smaller set of countries and a smaller set of indicators.
Performance group membership
For determining performance group membership, the EIS uses the
following classification scheme:
• Innovation Leaders are all countries with a relative performance in
2016 more than 20% above the EU average in 2016;
• Strong Innovators are all countries with a relative performance in
2016 between 90% and 120% of the EU average in 2016;
• Moderate Innovators are all countries with a relative performance in
2016 between 50% and 90% of the EU average in 2016;
• Modest Innovators are all countries with a relative performance in
2016 below 50% of the EU average in 2016.

80 European Innovation Scoreboard 2017
Annex A: Country abbreviationsAT Austria IT Italy
AU Australia JP Japan
BE Belgium KR South Korea
BG Bulgaria LT Lithuania
BR Brazil LU Luxembourg
CA Canada LV Latvia
CH Switzerland MK Former Yugoslav Republic of Macedonia
CN China MT Malta
CY Cyprus NL Netherlands
CZ Czech Republic NO Norway
DE Germany PL Poland
DK Denmark PT Portugal
EL Greece RO Romania
EE Estonia RS Serbia
ES Spain RU Russia
FI Finland SA South Africa
FR France SE Sweden
HR Croatia SI Slovenia
HU Hungary SK Slovakia
IE Ireland TR Turkey
IL Israel UA Ukraine
IN India UK United Kingdom
IS Iceland US United States
Annex B: Performance per indicatorAvailable on the EIS website: http://ec.europa.eu/docsroom/documents/23604.

81European Innovation Scoreboard 2017
Anne
x C:
Cur
rent
per
form
ance
EU
28
BE
BG
CZ
DK
DE
EE
IEEL
ES
FR
HR
ITC
YLV
LTLU
HU
MT
FRA
MEW
OR
K C
ON
DIT
ION
S
Hum
an
reso
urc
es
1.1
.1 N
ew
doct
ora
te g
radua
tes
(20
15
)1
.81
.81
.51
.73
.22
.91
.12
.51
.11
.91
.71
.61
.50
.60
.91
.11
.01
.00
.5
1.1
.2 P
opula
tion
com
ple
ted t
ert
iary
educa
tion
(20
16
)3
8.2
44
.33
2.8
32
.64
5.3
30
.54
1.2
51
.84
1.0
41
.04
4.0
33
.02
5.6
56
.34
2.1
54
.95
1.5
30
.43
4.0
1.1
.3 L
ifelo
ng le
arn
ing (
20
16
)1
0.8
7.0
2.2
8.8
27
.78
.51
5.7
6.4
4.0
9.4
18
.83
.08
.36
.97
.36
.01
6.8
6.3
7.5
Att
ract
ive r
ese
arc
h s
yste
ms
1.2
.1 Int
ern
ati
ona
l sci
ent
ific
co-p
ublic
ati
ons
(2
01
6)
49
41
40
82
02
68
82
22
97
78
10
30
11
97
59
17
01
70
04
66
59
61
14
02
64
39
31
71
54
45
55
5
1.2
.2 S
cient
ific
public
ati
ons
am
ong
top 1
0%
most
cit
ed (
20
14
)1
0.6
12
.64
.07
.01
3.4
11
.48
.01
2.1
8.9
9.7
11
.24
.51
0.2
10
.24
.14
.01
1.6
6.2
9.5
1.2
.3 F
ore
ign
doct
ora
te s
tudent
s (2
01
5)
25
.64
2.3
5.1
14
.83
2.1
9.1
8.3
23
.1n/
a1
1.9
40
.13
.21
3.2
11
.48
.83
.98
7.0
7.2
12
.4
Inno
vati
on-
frie
ndly
env
ironm
ent
1.3
.1 B
roa
dba
nd p
ene
tra
tion
(20
16
)1
3.0
23
.01
0.0
10
.03
1.0
12
.01
2.0
15
.02
.02
0.0
9.0
6.0
5.0
3.0
22
.02
1.0
21
.01
2.0
12
.0
1.3
.2 O
pport
uni
ty-d
rive
n ent
repre
neurs
hip
(2
01
6)
3.1
1.5
1.0
2.7
11
.12
.93
.42
.31
.21
.65
.31
.02
.72
.03
.52
.25
.22
.0n/
a
INV
ESTM
ENTS
Fina
nce a
nd s
upport
2.1
.1 R
&D
exp
end
iture
in t
he p
ublic
sect
or
(20
15
)0
.71
0.6
80
.25
0.8
81
.15
0.9
30
.78
0.3
30
.63
0.5
70
.74
0.4
20
.56
0.3
00
.47
0.7
60
.64
0.3
50
.39
2.1
.2 V
ent
ure
ca
pit
al i
nvest
ment
s (2
01
5)
0.0
63
0.0
72
0.0
15
0.0
13
0.0
59
0.0
49
0.1
36
0.0
86
0.0
01
0.0
43
0.0
83
0.0
54
0.0
22
0.0
71
0.0
98
0.0
81
0.0
47
0.0
55
0.0
00
Firm
inve
stm
ent
s
2.2
.1 R
&D
exp
end
iture
in t
he b
usi
ness
sect
or
(20
15
)1
.30
1.7
70
.70
1.0
61
.87
1.9
50
.69
1.0
90
.32
0.6
41
.45
0.4
40
.74
0.0
80
.15
0.2
80
.67
1.0
10
.37
2.2
.2 N
on-
R&
D in
nova
tion
exp
end
iture
(2
01
4)
0.7
60
.56
0.7
40
.94
0.2
91
.26
0.8
50
.47
0.7
60
.36
0.5
01
.20
0.5
70
.21
0.5
82
.01
0.1
30
.75
0.3
6
2.2
.3 E
nterp
rise
s pro
vidin
g IC
T tr
ain
ing (
20
16
)2
2.0
34
.08
.02
2.0
28
.02
9.0
13
.03
0.0
15
.02
3.0
20
.02
2.0
12
.02
2.0
12
.01
0.0
29
.01
6.0
23
.0
INN
OV
ATI
ON
AC
TIV
ITIE
S
Inno
vato
rs
3.1
.1 S
MEs
wit
h p
roduct
or
pro
cess
inno
vati
ons
(2
01
4)
30
.94
8.3
14
.03
0.8
34
.74
1.6
17
.44
5.7
34
.61
8.6
35
.52
5.4
32
.73
2.8
11
.93
3.7
37
.01
5.1
26
.7
3.1
.2 S
MEs
wit
h m
ark
eti
ng o
r org
ani
sati
ona
l inn
ova
tions
(2
01
4)
34
.94
5.1
14
.82
5.7
40
.04
9.1
15
.05
2.5
40
.12
5.5
41
.63
0.8
34
.63
1.1
19
.02
4.0
54
.31
5.2
30
.8
3.1
.3 S
MEs
inno
vati
ng in
-house
(2
01
4)
28
.83
9.8
11
.22
8.0
28
.23
7.9
15
.84
1.3
31
.41
4.5
31
.52
1.1
30
.53
0.5
10
.23
0.4
32
.21
1.7
23
.9
Link
ages
3.2
.1 Inn
ova
tive
SM
Es c
olla
bora
ting
wit
h o
thers
(2
01
4)
11
.22
8.6
3.1
10
.01
3.2
10
.11
0.8
13
.91
4.8
6.7
13
.26
.86
.71
1.7
2.8
15
.29
.26
.24
.2
3.2
.2 P
ublic
-priva
te c
o-p
ublic
ati
ons
(2
01
5)
28
.76
1.0
1.1
10
.21
32
.04
5.3
1.5
23
.57
.91
1.4
32
.25
.71
5.2
7.1
0.5
0.7
8.9
23
.24
.7
3.2
.3 P
riva
te c
o-f
und
ing o
f public
R&
D e
xpend
iture
s (2
01
5)
0.0
50
.07
0.0
10
.03
0.0
20
.12
0.0
40
.01
0.0
40
.03
0.0
40
.03
0.0
10
.00
0.0
50
.09
0.0
10
.03
0.0
0
Inte
llect
ua
l ass
ets
3.3
.1 P
CT
pa
tent
applic
ati
ons
(2
01
4)
3.7
03
.35
0.6
51
.08
6.1
46
.35
1.3
62
.49
0.5
51
.57
4.1
70
.63
2.1
70
.80
0.3
10
.80
1.9
11
.32
1.3
8
3.3
.2 T
radem
ark
applic
ati
ons
(2
01
6)
7.6
07
.75
9.4
95
.14
11
.60
9.3
41
4.9
75
.40
4.5
89
.13
5.8
54
.22
8.1
44
1.3
97
.01
6.2
43
8.5
13
.91
40
.00
3.3
.3 D
esi
gn
applic
ati
ons
(2
01
6)
4.3
32
.75
7.0
22
.62
7.9
36
.18
3.7
41
.02
1.3
03
.08
2.8
80
.86
6.4
13
.34
1.7
51
.42
12
.40
0.9
32
1.0
0
IMPA
CTS
Emplo
yment
impa
cts
4.1
.1 E
mplo
yment
in k
now
ledge-i
ntens
ive a
ctiv
itie
s (2
01
6)
14
.11
5.2
10
.41
2.8
15
.81
4.8
12
.71
9.8
12
.21
2.3
14
.21
1.7
13
.91
6.3
11
.19
.72
2.7
12
.21
8.4
4.1
.2 E
mplo
yment
fa
st-g
row
ing f
irm
s in
nova
tive
sect
ors
(2
01
4)
4.8
2.5
6.1
5.0
4.3
4.5
3.0
8.8
n/a
3.5
4.3
2.8
2.7
0.8
4.8
4.0
4.2
7.6
7.3
Econo
mic
eff
ect
s
4.2
.1 M
ediu
m &
hig
h t
ech
pro
duct
exp
ort
s (2
01
6)
56
.24
8.5
31
.06
4.1
47
.86
7.6
42
.75
2.5
22
.74
7.8
58
.63
8.0
52
.14
3.2
34
.73
4.5
52
.26
9.6
56
.7
4.2
.2 K
now
ledge-i
ntens
ive s
erv
ices
exp
ort
s (2
01
5)
69
.36
7.9
41
.44
2.0
74
.87
4.7
45
.49
4.0
44
.44
3.3
67
.01
9.0
50
.46
8.4
53
.02
1.0
91
.24
7.3
28
.8
4.2
.3 S
ale
s of
new
-to-m
ark
et/
new
-to-f
irm
inno
vati
ons
(2
01
4)
13
.37
7.6
04
.80
14
.57
6.9
61
3.3
41
0.4
91
8.0
71
2.7
51
5.9
41
5.0
24
.91
10
.06
4.4
95
.31
8.5
76
.54
12
.47
4.1
2

82 European Innovation Scoreboard 2017
EU
28
NL
AT
PL
PT
RO
SI
SK
FI
SE
UK
ISIL
MK
NO
RS
CH
TR
UA
FRA
MEW
OR
K C
ON
DIT
ION
S
Hum
an
reso
urc
es
1.1
.1 N
ew
doct
ora
te g
radua
tes
(20
15
)1
.82
.31
.90
.61
.91
.53
.52
.22
.92
.93
.00
.91
.50
.62
.01
.13
.40
.41
.0
1.1
.2 P
opula
tion
com
ple
ted t
ert
iary
educa
tion
(20
16
)3
8.2
45
.23
9.7
43
.53
5.0
24
.84
3.0
33
.44
0.7
47
.34
7.2
43
.4n/
a3
2.2
49
.2n/
a5
0.9
29
.4n/
a
1.1
.3 L
ifelo
ng le
arn
ing (
20
16
)1
0.8
18
.81
4.9
3.7
9.6
1.2
11
.62
.92
6.4
29
.61
4.4
24
.7n/
a2
.91
9.6
n/a
32
.95
.8n/
a
Att
ract
ive r
ese
arc
h s
yste
ms
1.2
.1 Int
ern
ati
ona
l sci
ent
ific
co-p
ublic
ati
ons
(2
01
6)
49
41
56
91
33
62
77
87
31
82
11
28
40
81
57
61
93
91
15
12
91
19
22
14
71
76
03
29
27
98
94
60
1.2
.2 S
cient
ific
public
ati
ons
am
ong
top 1
0%
most
cit
ed (
20
14
)1
0.6
14
.31
1.7
5.0
9.0
5.1
8.6
5.5
10
.81
1.7
14
.59
.99
.74
.11
1.1
5.3
15
.24
.83
.2
1.2
.3 F
ore
ign
doct
ora
te s
tudent
s (2
01
5)
25
.63
6.6
27
.01
.92
1.2
2.3
8.5
9.1
19
.93
2.7
42
.93
3.4
n/a
4.4
20
.56
.55
4.3
4.3
n/a
Inno
vati
on-
frie
ndly
env
ironm
ent
1.3
.1 B
roa
dba
nd p
ene
tra
tion
(20
16
)1
3.0
22
.01
2.0
11
.02
5.0
13
.01
6.0
9.0
26
.03
2.0
10
.0n/
an/
a1
1.0
19
.03
.0n/
a1
6.0
n/a
1.3
.2 O
pport
uni
ty-d
rive
n ent
repre
neurs
hip
(2
01
6)
3.1
3.9
3.2
1.6
2.0
1.5
2.1
1.4
6.0
8.2
3.3
10
.02
.90
.61
2.9
1.1
5.2
1.9
n/a
INV
ESTM
ENTS
Fina
nce a
nd s
upport
2.1
.1 R
&D
exp
end
iture
in t
he p
ublic
sect
or
(20
15
)0
.71
0.9
00
.89
0.5
40
.66
0.2
80
.53
0.8
50
.95
0.9
90
.56
0.7
80
.59
0.1
90
.88
0.6
00
.91
0.5
10
.34
2.1
.2 V
ent
ure
ca
pit
al i
nvest
ment
s (2
01
5)
0.0
63
0.0
96
0.0
51
0.0
29
0.0
69
0.0
13
0.0
07
0.0
08
0.1
07
0.0
81
0.1
03
n/a
0.0
09
0.0
00
0.0
77
0.0
00
0.0
67
n/a
0.0
02
Firm
inve
stm
ent
s
2.2
.1 R
&D
exp
end
iture
in t
he b
usi
ness
sect
or
(20
15
)1
.30
1.1
22
.18
0.4
70
.60
0.2
11
.69
0.3
31
.94
2.2
71
.12
1.4
23
.47
0.0
31
.05
0.2
82
.06
0.5
00
.42
2.2
.2 N
on-
R&
D in
nova
tion
exp
end
iture
(2
01
4)
0.7
60
.16
0.4
71
.24
0.6
40
.23
0.8
10
.58
0.3
21
.12
0.6
7n/
an/
a0
.90
0.6
31
.79
2.0
12
.70
0.5
0
2.2
.3 E
nterp
rise
s pro
vidin
g IC
T tr
ain
ing (
20
16
)2
2.0
22
.03
7.0
12
.02
3.0
5.0
27
.02
0.0
34
.02
5.0
28
.02
5.0
n/a
17
.04
2.0
22
.0n/
an/
an/
a
INN
OV
ATI
ON
AC
TIV
ITIE
S
Inno
vato
rs
3.1
.1 S
MEs
wit
h p
roduct
or
pro
cess
inno
vati
ons
(2
01
4)
30
.94
2.9
40
.71
3.3
42
.14
.92
8.7
16
.74
4.1
40
.43
2.6
44
.32
2.2
39
.24
1.1
28
.34
8.1
31
.57
.4
3.1
.2 S
MEs
wit
h m
ark
eti
ng o
r org
ani
sati
ona
l inn
ova
tions
(2
01
4)
34
.93
2.5
46
.11
1.4
37
.88
.83
3.2
22
.43
7.3
35
.14
5.4
43
.04
4.9
30
.84
3.3
36
.46
2.0
40
.51
0.5
3.1
.3 S
MEs
inno
vati
ng in
-house
(2
01
4)
28
.83
5.0
35
.08
.32
5.6
4.5
26
.11
3.9
38
.33
5.1
19
.0n/
a2
1.6
11
.33
5.2
27
.04
2.5
22
.51
8.7
Link
ages
3.2
.1 Inn
ova
tive
SM
Es c
olla
bora
ting
wit
h o
thers
(2
01
4)
11
.21
7.5
20
.53
.57
.81
.81
3.2
8.4
16
.81
3.5
24
.72
0.6
12
.99
.61
9.0
8.5
8.7
6.3
1.5
3.2
.2 P
ublic
-priva
te c
o-p
ublic
ati
ons
(2
01
5)
28
.77
2.7
57
.63
.76
.72
.34
1.2
10
.06
3.1
88
.74
3.2
17
0.2
21
.41
.03
7.5
4.4
18
3.1
1.2
1.1
3.2
.3 P
riva
te c
o-f
und
ing o
f public
R&
D e
xpend
iture
s (2
01
5)
0.0
50
.08
0.0
40
.02
0.0
10
.03
0.0
50
.04
0.0
50
.04
0.0
30
.03
0.0
5n/
a0
.04
0.0
20
.09
0.0
6n/
a
Inte
llect
ua
l ass
ets
3.3
.1 P
CT
pa
tent
applic
ati
ons
(2
01
4)
3.7
05
.91
4.9
50
.58
0.7
00
.26
3.0
00
.45
8.2
99
.58
3.2
53
.24
12
.01
0.0
82
.71
n/a
6.6
80
.84
0.5
4
3.3
.2 T
radem
ark
applic
ati
ons
(2
01
6)
7.6
09
.58
12
.91
5.2
57
.21
2.3
71
0.2
14
.30
11
.44
10
.75
7.3
29
.32
18
.72
2.2
92
.93
3.9
01
7.7
61
.11
1.7
5
3.3
.3 D
esi
gn
applic
ati
ons
(2
01
6)
4.3
33
.65
7.1
05
.90
4.4
70
.81
2.9
71
.06
4.5
04
.71
3.0
30
.13
1.7
30
.04
0.3
70
.08
6.1
50
.14
0.4
1
IMPA
CTS
Emplo
yment
impa
cts
4.1
.1 E
mplo
yment
in k
now
ledge-i
ntens
ive a
ctiv
itie
s (2
01
6)
14
.11
7.5
14
.61
0.0
10
.97
.21
3.7
10
.01
5.7
18
.41
8.4
19
.82
6.9
6.5
15
.21
4.4
22
.16
.61
2.9
4.1
.2 E
mplo
yment
fa
st-g
row
ing f
irm
s in
nova
tive
sect
ors
(2
01
4)
4.8
5.5
2.9
5.5
3.7
2.8
3.0
7.4
2.8
6.0
6.9
n/a
n/a
n/a
4.8
n/a
3.3
n/a
n/a
Econo
mic
eff
ect
s
4.2
.1 M
ediu
m &
hig
h t
ech
pro
duct
exp
ort
s (2
01
6)
56
.24
8.5
57
.64
9.4
36
.75
2.8
56
.06
6.5
44
.65
4.7
54
.81
0.6
53
.75
6.9
17
.03
9.1
48
.63
7.5
28
.3
4.2
.2 K
now
ledge-i
ntens
ive s
erv
ices
exp
ort
s (2
01
5)
69
.37
6.9
44
.43
9.6
44
.44
4.7
34
.83
4.8
62
.47
5.2
82
.96
6.6
70
.83
6.7
76
.84
3.8
66
.12
9.0
51
.0
4.2
.3 S
ale
s of
new
-to-m
ark
et/
new
-to-f
irm
inno
vati
ons
(2
01
4)
13
.37
10
.81
11
.98
6.4
56
.27
6.5
11
2.4
41
9.1
29
.27
6.8
92
0.8
16
.07
11
.90
9.9
06
.16
12
.38
19
.62
10
.51
3.3
0

83European Innovation Scoreboard 2017
Anne
x D
: Per
form
ance
cha
nge
Perf
orm
anc
e c
ha
nge is
mea
sure
d b
etw
een
the m
ost
rece
nt y
ea
r (a
s sh
own
in A
nnex
C)
and
the s
itua
tion
six
yea
rs e
arlie
r.
EU
28
BE
BG
CZ
DK
DE
EE
IEEL
ES
FR
HR
ITC
YLV
LTLU
HU
MT
FRA
MEW
OR
K C
ON
DIT
ION
S
Hum
an
reso
urc
es
1.1
.1 N
ew
doct
ora
te g
radua
tes
26
.72
9.7
67
.62
1.3
11
8.7
19
.51
4.0
70
.42
5.0
70
.41
5.1
44
.1-5
.52
7.0
23
.79
.11
6.3
4.6
13
.5
1.1
.2 P
opula
tion
com
ple
ted t
ert
iary
educa
tion
32
.23
.33
4.9
65
.85
0.7
29
.61
9.7
23
.06
8.4
4.6
8.6
47
.43
1.6
44
.74
8.7
56
.64
8.0
28
.36
3.8
1.1
.3 L
ifelo
ng le
arn
ing
1.1
-4.2
6.3
-12
.60
.07
.44
9.5
-6.3
7.4
-7.4
4.2
0.0
22
.1-1
2.6
20
.01
6.8
-12
.6-8
.41
3.7
Att
ract
ive r
ese
arc
h s
yste
ms
1.2
.1 Int
ern
ati
ona
l sci
ent
ific
co-p
ublic
ati
ons
54
14
41
58
92
22
77
16
31
33
67
91
63
59
70
17
35
47
12
92
50
12
0
1.2
.2 S
cient
ific
public
ati
ons
am
ong
top 1
0%
most
cit
ed
3.6
5.8
-1.7
6.9
-7.3
2.8
22
.81
2.5
3.1
9.3
7.3
13
.01
0.4
46
.18
.3-2
9.5
32
.6-1
0.5
34
.8
1.2
.3 F
ore
ign
doct
ora
te s
tudent
s8
.64
5.6
-2.5
19
.55
3.1
-9.0
13
.0-6
0.1
n/a
-43
.2-3
.82
.62
1.0
8.1
34
.61
2.1
0.0
0.5
12
.5
Inno
vati
on-
frie
ndly
env
ironm
ent
1.3
.1 B
roa
dba
nd p
ene
tra
tion
44
.46
6.7
22
.22
2.2
0.0
33
.34
4.4
55
.60
.01
11
.10
.05
5.6
0.0
33
.34
4.4
55
.68
8.9
33
.3-1
1.1
1.3
.2 O
pport
uni
ty-d
rive
n ent
repre
neurs
hip
-7.0
-82
.84
.51
4.1
14
.83
0.1
14
.91
2.5
-10
.2-2
3.7
14
.8-1
8.1
-27
.60
.03
2.4
15
.3-6
5.9
1.3
n/a
INV
ESTM
ENTS
Fina
nce a
nd s
upport
2.1
.1 R
&D
exp
end
iture
in t
he p
ublic
sect
or
-1.8
1.8
-16
.05
6.9
24
.98
.97
.1-3
2.0
42
.6-1
4.2
-5.3
-14
.25
.30
.03
2.0
24
.93
9.1
-21
.33
5.5
2.1
.2 V
ent
ure
ca
pit
al i
nvest
ment
s-3
4.6
-90
.9-7
7.8
-15
5.7
-57
.3-1
3.3
97
.5-8
0.9
-9.0
-60
.1-1
4.9
36
.6-2
3.2
-15
.24
2.3
77
.2-1
51
.71
7.5
-11
.3
Firm
inve
stm
ent
s
2.2
.1 R
&D
exp
end
iture
in t
he b
usi
ness
sect
or
9.4
39
.54
7.2
28
.3-2
3.2
9.4
6.0
-0.9
7.7
-5.2
7.7
8.6
7.7
-0.9
-0.9
6.9
-3.4
30
.93
.4
2.2
.2 N
on-
R&
D in
nova
tion
exp
end
iture
9.3
-2.0
-34
.5-1
5.9
-35
.86
3.7
-15
3.1
-89
.43
.9-1
5.6
6.0
56
.6-7
.5-2
53
.9-1
02
.61
71
.6-1
9.6
1.0
-11
7.0
2.2
.3 E
nterp
rise
s pro
vidin
g IC
T tr
ain
ing
21
.42
8.6
-42
.90
.00
.03
5.7
7.1
14
.30
.05
0.0
0.0
-42
.97
.1-4
2.9
14
.30
.05
7.1
14
.3-7
.1
INN
OV
ATI
ON
AC
TIV
ITIE
S
Inno
vato
rs
3.1
.1 S
MEs
wit
h p
roduct
or
pro
cess
inno
vati
ons
-18
.21
8.3
-28
.7-1
7.3
-12
.8-5
1.8
-11
4.3
14
.7-1
1.6
-38
.31
4.6
-26
.05
.1-4
0.4
-22
.95
0.6
-19
.5-7
.53
.3
3.1
.2 S
MEs
wit
h m
ark
eti
ng o
r org
ani
sati
ona
l inn
ova
tions
-17
.63
.7-9
.0-7
0.0
-0.1
-44
.8-6
6.3
38
.1-3
8.8
-16
.81
0.8
-5.6
-20
.9-5
6.5
17
.59
.04
.9-1
8.4
17
.9
3.1
.3 S
MEs
inno
vati
ng in
-house
-6.7
-2.2
-27
.0-7
.3-5
7.5
-37
.1-8
2.9
-29
.2-9
.4-3
4.6
7.3
-20
.4-1
6.3
-50
.5-1
9.5
50
.2-2
3.5
-3.9
10
.5
Link
ages
3.2
.1 Inn
ova
tive
SM
Es c
olla
bora
ting
wit
h o
thers
0.5
6.5
-4.0
-12
.5-9
4.8
-16
.8-1
15
.74
1.4
14
.51
3.4
-3.1
-51
.17
.4-9
6.6
-5.1
71
.8-3
1.6
-9.6
-10
.1
3.2
.2 P
ublic
-priva
te c
o-p
ublic
ati
ons
-13
.5-3
.1-1
7.6
-34
.0-4
.0-1
2.2
-68
.0-2
.3-1
4.6
-16
.5-8
.1-4
7.4
-21
.5-2
8.4
-20
.3-3
6.7
-50
.4-0
.4-0
.9
3.2
.3 P
riva
te c
o-f
und
ing o
f public
R&
D e
xpend
iture
s-1
.35
.4-1
4.6
29
.0-2
0.4
0.0
15
.7-1
0.0
10
.6-3
0.6
2.9
-12
.70
.6-6
.04
3.4
-3.9
1.1
-70
.4-1
.4
Inte
llect
ua
l ass
ets
3.3
.1 P
CT
pa
tent
applic
ati
ons
-0.2
-1.3
12
.62
.9-1
0.2
-5.8
-11
.3-4
.45
.34
.93
.4-1
.33
.21
1.8
-16
.17
.94
.4-0
.93
.4
3.3
.2 T
radem
ark
applic
ati
ons
9.7
-1.5
24
.41
3.2
17
.3-6
.36
4.0
-11
.84
9.2
20
.1-2
.21
3.7
20
.48
0.6
-2.8
36
.00
.07
.27
7.4
3.3
.3 D
esi
gn
applic
ati
ons
-6.0
-21
.41
15
.56
.02
9.2
-30
.13
4.4
-21
.31
8.3
-8.1
-21
.61
5.6
-2.6
45
.7-2
6.9
17
.97
4.3
-1.3
19
7.1
IMPA
CTS
Emplo
yment
impa
cts
4.1
.1 E
mplo
yment
in k
now
ledge-i
ntens
ive a
ctiv
itie
s7
.75
.12
4.4
6.4
0.0
-7.7
37
.23
.81
5.4
6.4
2.6
21
.82
.62
4.4
20
.51
2.8
-2.6
-6.4
30
.8
4.1
.2 E
mplo
yment
fa
st-g
row
ing f
irm
s in
nova
tive
sect
ors
-5.4
1.4
-0.2
-39
.9-5
0.2
-30
.48
.62
6.1
n/a
6.5
-18
.93
1.3
-5.6
-11
.73
5.4
-9.7
25
.52
.53
2.2
Econo
mic
eff
ect
s
4.2
.1 M
ediu
m &
hig
h t
ech
pro
duct
exp
ort
s2
.8-5
.11
3.7
4.6
16
.47
.42
3.9
1.7
-10
.4-4
.10
.5-1
0.6
0.8
-0.9
5.4
5.9
-22
.5-3
.3-3
.8
4.2
.2 K
now
ledge-i
ntens
ive s
erv
ices
exp
ort
s4
.60
.22
9.4
8.2
-7.5
-3.3
-1.5
0.0
-33
.90
.08
.42
.3-1
.8-1
.2-2
.36
.43
.4-3
.00
.0
4.2
.3 S
ale
s of
new
-to-m
ark
et/
new
-to-f
irm
inno
vati
ons
1.1
-18
.8-9
2.9
-40
.5-4
4.2
-39
.92
.66
9.7
-79
.60
.31
7.5
-93
.9-1
7.1
-11
4.4
-5.7
-10
.0-2
3.0
-39
.2-1
09
.6

84 European Innovation Scoreboard 2017
EU
28
NL
AT
PL
PT
RO
SI
SK
FI
SE
UK
ISIL
MK
NO
RS
CH
TR
UA
FRA
MEW
OR
K C
ON
DIT
ION
S
Hum
an
reso
urc
es
1.1
.1 N
ew
doct
ora
te g
radua
tes
26
.74
3.1
-15
.5-1
3.2
-69
.0-3
.61
34
.11
1.4
-1.7
-14
.56
3.7
15
.41
0.5
17
.72
3.9
45
.40
.08
.20
.0
1.1
.2 P
opula
tion
com
ple
ted t
ert
iary
educa
tion
32
.23
2.2
12
5.0
42
.16
2.5
27
.07
7.0
61
.89
.93
2.9
36
.84
7.4
n/a
68
.42
7.6
n/a
71
.17
4.3
n/a
1.1
.3 L
ifelo
ng le
arn
ing
1.1
9.5
11
.6-6
.3-2
0.0
-2.1
-50
.5-1
2.6
35
.83
5.8
-60
.0-7
.4n/
a-6
.31
4.7
n/a
0.0
1.1
n/a
Att
ract
ive r
ese
arc
h s
yste
ms
1.2
.1 Int
ern
ati
ona
l sci
ent
ific
co-p
ublic
ati
ons
54
17
91
53
35
13
92
41
42
39
18
82
33
13
50
67
23
21
95
17
14
5
1.2
.2 S
cient
ific
public
ati
ons
am
ong
top 1
0%
most
cit
ed
3.6
-1.2
3.6
12
.60
.89
.01
4.1
-2.2
6.3
7.1
5.8
4.9
-2.4
5.7
-6.8
9.0
-0.3
-8.0
1.2
1.2
.3 F
ore
ign
doct
ora
te s
tudent
s8
.6-8
.9-2
.1-2
.03
8.4
-3.4
-0.1
8.1
45
.12
9.2
-19
.74
4.3
n/a
13
.4-3
6.6
6.8
30
.96
.2n/
a
Inno
vati
on-
frie
ndly
env
ironm
ent
1.3
.1 B
roa
dba
nd p
ene
tra
tion
44
.47
7.8
0.0
44
.41
33
.32
2.2
33
.30
.04
4.4
33
.32
2.2
n/a
n/a
44
.46
6.7
0.0
n/a
22
.2n/
a
1.3
.2 O
pport
uni
ty-d
rive
n ent
repre
neurs
hip
-7.0
-50
.4-8
6.5
35
.0-8
.29
.7-6
4.6
5.9
38
.64
0.9
-0.3
3.9
15
.41
4.7
25
.8-3
.8-3
0.3
22
.5n/
a
INV
ESTM
ENTS
Fina
nce a
nd s
upport
2.1
.1 R
&D
exp
end
iture
in t
he p
ublic
sect
or
-1.8
10
.71
2.4
10
.7-3
.6-5
.3-1
9.5
10
1.3
-17
.8-1
.8-1
4.2
0.0
-5.7
5.0
8.9
-25
.24
0.9
0.0
-8.7
2.1
.2 V
ent
ure
ca
pit
al i
nvest
ment
s-3
4.6
-24
.49
.7-1
.5-1
.0-7
1.5
0.9
3.1
-54
.1-9
7.0
-66
.4n/
a2
.20
.0-3
1.9
-20
.2-2
0.1
n/a
0.0
Firm
inve
stm
ent
s
2.2
.1 R
&D
exp
end
iture
in t
he b
usi
ness
sect
or
9.4
1.7
34
.32
4.0
-12
.92
.6-8
.61
2.0
-53
.2-1
5.5
4.3
37
.80
.0-0
.71
3.7
13
.44
.31
3.7
-4.4
2.2
.2 N
on-
R&
D in
nova
tion
exp
end
iture
9.3
-59
.00
.5-1
.8-5
.6-1
88
.14
.0-2
3.2
-41
.26
3.8
61
.9n/
an/
a0
.08
7.2
16
4.7
10
4.7
26
1.9
-50
.0
2.2
.3 E
nterp
rise
s pro
vidin
g IC
T tr
ain
ing
21
.44
2.9
57
.11
4.3
0.0
0.0
0.0
-35
.7-2
1.4
14
.30
.0-2
8.6
n/a
21
.40
.00
.0n/
an/
an/
a
INN
OV
ATI
ON
AC
TIV
ITIE
S
Inno
vato
rs
3.1
.1 S
MEs
wit
h p
roduct
or
pro
cess
inno
vati
ons
-18
.24
8.8
5.0
-18
.4-2
4.3
-26
.4-1
0.1
-10
.09
.7-0
.82
4.0
-42
.5-3
7.9
0.0
52
.34
2.9
-25
.98
.70
.0
3.1
.2 S
MEs
wit
h m
ark
eti
ng o
r org
ani
sati
ona
l inn
ova
tions
-17
.61
3.5
11
.4-2
5.3
-21
.0-5
0.8
-21
.6-2
0.5
20
.1-5
.75
0.1
-10
.2-5
9.3
0.0
43
.36
3.8
0.0
-34
.10
.0
3.1
.3 S
MEs
inno
vati
ng in
-house
-6.7
40
.12
.7-2
4.8
-35
.6-3
8.0
1.3
-4.7
-1.2
-8.9
0.0
n/a
-32
.90
.04
4.8
-3.9
65
.2-1
7.6
-4.1
Link
ages
3.2
.1 Inn
ova
tive
SM
Es c
olla
bora
ting
wit
h o
thers
0.5
45
.15
7.9
-29
.1-5
5.7
-4.9
-11
.02
6.6
14
.8-3
0.0
0.0
31
.7-4
2.1
0.0
59
.95
0.1
-6.5
10
.2-2
.0
3.2
.2 P
ublic
-priva
te c
o-p
ublic
ati
ons
-13
.5-1
6.9
-2.2
3.5
-10
.1-2
4.3
-38
.7-1
5.6
-29
.9-2
5.3
-17
.90
.0-2
9.7
5.3
-50
.6-1
1.6
0.0
-6.3
-0.2
3.2
.3 P
riva
te c
o-f
und
ing o
f public
R&
D e
xpend
iture
s-1
.3-1
6.9
-2.8
-7.6
6.7
-36
.4-2
0.0
21
.9-8
6.6
-15
.13
.1-3
7.0
-14
.6n/
a-9
.80
.08
9.6
-8.9
n/a
Inte
llect
ua
l ass
ets
3.3
.1 P
CT
pa
tent
applic
ati
ons
-0.2
-1.2
6.0
8.3
2.3
5.6
-0.2
4.4
-7.3
0.0
-0.8
10
.30
.0-8
.1-2
.4n/
a-8
.11
2.0
10
.4
3.3
.2 T
radem
ark
applic
ati
ons
9.7
2.7
-7.0
27
.92
8.8
14
.84
.11
7.6
37
.31
9.0
16
.62
2.3
2.8
14
.5-3
.4-6
.1-1
8.4
-2.2
-2.0
3.3
.3 D
esi
gn
applic
ati
ons
-6.0
-7.3
-24
.03
5.6
-3.7
9.0
4.6
-7.6
-2.1
-4.3
8.0
-16
.91
5.9
0.3
-10
.61
.7-1
3.4
-1.4
8.7
IMPA
CTS
Emplo
yment
impa
cts
4.1
.1 E
mplo
yment
in k
now
ledge-i
ntens
ive a
ctiv
itie
s7
.75
.12
.61
2.8
23
.11
5.4
3.8
-5.1
6.4
19
.21
5.4
21
.80
.0-9
.01
0.3
26
.52
8.2
11
.51
0.3
4.1
.2 E
mplo
yment
fa
st-g
row
ing f
irm
s in
nova
tive
sect
ors
-5.4
5.9
0.2
-16
.71
5.5
16
.42
.3-7
.9-1
2.8
-12
.48
.1n/
an/
an/
a1
0.1
n/a
0.0
n/a
n/a
Econo
mic
eff
ect
s
4.2
.1 M
ediu
m &
hig
h t
ech
pro
duct
exp
ort
s2
.81
3.6
9.0
-9.1
-0.5
6.4
-5.0
12
.8-1
7.9
-1.7
-4.5
0.0
0.9
71
.90
.03
5.8
-39
.2-0
.6-3
0.8
4.2
.2 K
now
ledge-i
ntens
ive s
erv
ices
exp
ort
s4
.63
.3-1
.5-0
.72
.2-1
.32
.9-1
.10
.05
.8-0
.22
.80
.6-3
.84
.50
.50
.82
.64
.4
4.2
.3 S
ale
s of
new
-to-m
ark
et/
new
-to-f
irm
inno
vati
ons
1.1
19
.37
.2-3
3.5
-91
.9-8
2.7
-38
.33
2.8
-62
.6-2
2.4
13
3.4
-57
.61
0.9
0.0
15
.12
3.4
-11
.73
0.4
-14
.8

85European Innovation Scoreboard 2017
Annex E: Definitions of indicators
INDICATOR DEFINITION NUMERATORDEFINITION
DENOMINATOR
MOST RECENT
YEAR FOR
WHICH DATA ARE
AVAILABLE
INTERPRETATION
Source Source
1.1.1 New doctorate
graduates
per 1000
population
aged 25-34
Number of doctorate graduates
Eurostat
Population between
and including 25 and
34 years
Eurostat
2015 The indicator is a measure of the supply of new second-
stage tertiary graduates in all fields of training (ISCED
8). For most countries, ISCED 8 captures PhD graduates.
1.1.2 Percentage
population
aged 25-
34 having
completed
tertiary
education
Number of persons in age
class with some form of post-
secondary education
Eurostat
Population between
and including 25 and
34 years
Eurostat
2016 This is a general indicator of the supply of advanced skills.
It is not limited to science and technical fields, because
the adoption of innovations in many areas, in particular
in the service sectors, depends on a wide range of skills.
The indicator focuses on a younger age cohort of the
population, aged 25 to 34, and will therefore easily and
quickly reflect changes in educational policies leading to
more tertiary graduates.
1.1.3 Lifelong
learning
The target population for lifelong
learning statistics refers to all
persons in private households
aged between 25 and 64 years.
The informa tion collected relates
to all education or training,
whether or not relevant to the
respondent’s current or possible
future job. Data are collected
through the EU labour force
survey (LFS). The reference
period for the participation in
education and training is the four
weeks preceding the interview as
is usual in the LFS.
Eurostat
Total population of
the same age group,
excluding those who
did not answer the
question concerning
participation in (formal
and non-formal)
education and training
Eurostat
2016 Lifelong learning encompasses all purposeful learning
activity, whether formal, non-formal or informal,
undertaken on an ongoing basis with the aim of improving
knowledge, skills and competence. The intention or aim
to learn is the critical point that distinguishes these
activities from non-learning activities, such as cultural
or sporting activities.
1.2.1 International
scientific co-
publications
per million
population
Number of scientific publications
with at least one co-author
based abroad (where abroad is
non-EU for the EU28)
Web of Science *
Total population
Eurostat
2016 International scientific co-publications are a proxy for the
quality of scientific research as collaboration increases
scientific productivity.
1.2.2 Scientific
publications
among the top-
10% most cited
publications
worldwide as
percentage of
total scientific
publications of
the country
Number of scientific publications
among the top-10% most cited
publications worldwide
Web of Science *
Total number of
scientific publications
Web of Science *
2014 The indicator is a measure for the efficiency of the
research system, as highly cited publications are
assumed to be of higher quality. There could be a bias
towards small or English speaking countries given the
coverage of Scopus’ publication data.
1.2.3 Foreign
doctorate
students as
a percentage
of all doctorate
students
Number of doctorate students
from foreign countries
Eurostat
Total number of
doctorate students
Eurostat
2015 The share of foreign doctorate students reflects the
mobility of students as an effective way of diffusing
knowledge. Attracting high-skilled foreign doctorate
students will secure a continuous supply of researchers.

86 European Innovation Scoreboard 2017
INDICATOR DEFINITION NUMERATORDEFINITION
DENOMINATOR
MOST RECENT
YEAR FOR
WHICH DATA ARE
AVAILABLE
INTERPRETATION
Source Source
1.3.1 Broadband
penetration
Number of enterprises with
a maximum contracted download
speed of the fastest fixed
internet connection of at least
100 Mb/s
Eurostat, Community Survey of
ICT Usage and E-commerce in
Enterprises
Total number of
enterprises
Eurostat, Community
Survey of ICT Usage
and E-commerce in
Enterprises
2016 Realising Europe’s full e-potential depends on creating
the conditions for electronic commerce and the Internet
to flourish. This indicator captures the relative use of this
e-potential by the share of enterprises that have access
to fast broadband.
1.3.2 Opportuni-
ty-driven entre-
preneurship
(Motivational
index)
This index is calculated
as the ratio between the
share of persons involved in
improvement-driven entre-
preneurship and the share of
persons involved in necessity-
driven entrepreneurship.
Global Entrepreneurship Monitor
(GEM)
2016 Data from GEM distinguish between two
types of entrepreneurship: 1) improvement-
driven entrepreneurship and 2) necessity-driven
entrepreneurship. The first includes persons involved in
TEA (Total Early-Stage Entrepreneurial Activity) who (i)
claim to be driven by opportunity as opposed to finding
no other option for work; and (ii) who indicate the main
driver for being involved in this opportunity is being
independent or increasing their income, rather than just
maintaining their income; the second includes persons
involved in TEA who are involved in entrepreneurship
because they had no other option for work.
Countries with high relative prevalence of improvement-
driven opportunity entrepreneurship appear to be
primarily innovation-driven countries. In these countries,
opportunities may be expected to be more abundant,
and individuals may have more alternatives to make
a living.
GEM has constructed the Motivational index to
measure the relative degree of improvement-driven
entrepreneurship.
Comment: Three-year averages have been used
2.1.1 R&D
expenditure
in the public
sector
(percentage of
GDP)
All R&D expenditures in the
government sector (GOVERD)
and the higher education sector
(HERD)
Eurostat
Gross Domestic
Product
Eurostat
2015 R&D expenditure represents one of the major drivers of
economic growth in a knowledge-based economy. As
such, trends in the R&D expenditure indicator provide key
indications of the future competitiveness and wealth of
the EU. Research and development spending is essential
for making the transition to a knowledge-based economy
as well as for improving production technologies and
stimulating growth.
2.1.2 Venture capital
(percentage of
GDP)
Venture capital investment
is defined as private equity
being raised for investment
in companies. Management
buyouts, management buy-ins,
and venture purchase of quoted
shares are excluded. Venture
capital includes early stage (seed
+ start-up) and expansion and
replacement capital.
Invest Europe
Gross Domestic
Product
Eurostat
2015 The amount of venture capital is a proxy for the relative
dynamism of new business creation. In particular for
enterprises using or developing new (risky) technologies,
venture capital is often the only available means of
financing their (expanding) business.
Comment: Three-year averages have been used
2.2.1 R&D
expenditure in
the business
sector
(percentage of
GDP)
All R&D expenditures in the
business sector (BERD)
Eurostat
Gross Domestic
Product
Eurostat
2015 The indicator captures the formal creation of new
knowledge within firms. It is particularly important in the
science-based sectors (pharmaceuticals, chemicals and
some areas of electronics) where most new knowledge
is created in or near R&D laboratories.

87European Innovation Scoreboard 2017
INDICATOR DEFINITION NUMERATORDEFINITION
DENOMINATOR
MOST RECENT
YEAR FOR
WHICH DATA ARE
AVAILABLE
INTERPRETATION
Source Source
2.2.2 Non-R&D
innovation
expenditures
(percentage of
turnover)
Sum of total innovation
expenditure for enterprises,
excluding intramural and
extramural R&D expenditures
Eurostat (Community Innovation
Survey)
Total turnover for all
enterprises
Eurostat (Community
Innovation Survey)
2014 This indicator measures non-R&D innovation
expenditure as a percentage of total turnover. Several
of the components of innovation expenditure, such
as investment in equipment and machinery and the
acquisition of patents and licenses, measure the
diffusion of new production technology and ideas.
2.2.3 Enterprises
providing
training to
develop or
upgrade ICT
skills of their
personnel
Number of enterprises that
provided any type of training to
develop ICT related skills of their
personnel
Eurostat, Community Survey of
ICT Usage and E-commerce in
Enterprises
Total number of
enterprises
Eurostat, Community
Survey of ICT Usage
and E-commerce in
Enterprises
2016 ICT skills are particularly important for innovation in an
increasingly digital economy. The share of enterprises
providing training in that respect is a proxy for the overall
skills development of employees.
3.1.1 SMEs
introducing
product or
process
innovations
(percentage of
SMEs)
Number of SMEs who introduced
a new product or a new process
to one of their markets
Eurostat (Community Innovation
Survey)
Total number of SMEs
Eurostat (Community
Innovation Survey)
2014 Technological innovation, as measured by the introduction
of new products (goods or services) and processes, is
a key ingredient to innovation in manufacturing activities.
Higher shares of technological innovators should reflect
a higher level of innovation activities.
3.1.2 SMEs
introducing
marketing or
organisational
innovations
(percentage of
SMEs)
Number of SMEs who introduced
a new marketing innovation or
organisational innovation to one
of their markets
Eurostat (Community Innovation
Survey)
Total number of SMEs
Eurostat (Community
Innovation Survey)
2014 The Community Innovation Survey mainly asks firms
about their technological innovation. Many firms, in
particular in the services sectors, innovate through other
non-technological forms of innovation. Examples of
these are marketing and organisational innovations. This
indicator captures the extent to which SMEs innovate
through non-technological innovation.
3.1.3 SMEs
innovating
in-house
(percentage of
SMEs)
Number of SMEs with in-
house innovation activities.
Innovative enterprises are
defined as enterprises which
have introduced new products or
processes either in-house or in
combination with other firms
Eurostat (Community Innovation
Survey)
Total number of SMEs
Eurostat (Community
Innovation Survey)
2014 This indicator measures the degree to which SMEs,
that have introduced any new or significantly improved
products or production processes, have innovated in-
house. The indicator is limited to SMEs, because almost
all large firms innovate and because countries with an
industrial structure weighted towards larger firms tend
to do better.
3.2.1 Innovative
SMEs
collaborating
with others
(percentage of
SMEs)
Number of SMEs with innovation
co-operation activities, i.e. those
firms that had any co-operation
agreements on innovation
activities with other enterprises
or institutions in the three years
of the survey period
Eurostat (Community Innovation
Survey)
Total number of SMEs
Eurostat (Community
Innovation Survey)
2014 This indicator measures the degree to which SMEs are
involved in innovation co-operation. Complex innovations,
in particular in ICT, often depend on the ability to draw
on diverse sources of information and knowledge, or to
collaborate in the development of an innovation. This
indicator measures the flow of knowledge between
public research institutions and firms, and between
firms and other firms. The indicator is limited to SMEs,
because almost all large firms are involved in innovation
co-operation.
3.2.2 Public-private
co-publications
per million
population
Number of public-private co-
authored research publications.
The definition of the “private
sector” excludes the private
medical and health sector.
Publications are assigned to the
country/countries in which the
business companies or other
private sector organisations are
located.
Web of Science *
Total population
Eurostat
2015 This indicator captures public-private research linkages
and active collaboration activities between business
sector researchers and public sector researchers
resulting in academic publications.

88 European Innovation Scoreboard 2017
INDICATOR DEFINITION NUMERATORDEFINITION
DENOMINATOR
MOST RECENT
YEAR FOR
WHICH DATA ARE
AVAILABLE
INTERPRETATION
Source Source
3.2.3 Private co-
funding of
public R&D
expenditures
(percentage of
GDP)
All R&D expenditures in the
government sector (GOVERD)
and the higher education sector
(HERD) financed by the business
sector; both GOVERD and HERD
according to Frascati Manual
definitions
Eurostat, OECD
Gross Domestic
Product
Eurostat, OECD
2015 This indicator measures public-private co-operation.
University and government R&D financed by the
business sector are expected to explicitly serve the more
short-term research needs of the business sector.
3.3.1 PCT patent
applications per
billion GDP (in
PPS)
Number of patent applications
filed under the PCT, at
international phase, designating
the European Patent Office
(EPO). Patent counts are
based on the priority date, the
inventor’s country of residence
and fractional counts.
OECD
Gross Domestic
Product in Purchasing
Power Standard
Eurostat
2014 The capacity of firms to develop new products will
determine their competitive advantage. One indicator
of the rate of new product innovation is the number
of patents. This indicator measures the number of PCT
patent applications.
3.3.2 Trademarks
applications per
billion GDP (in
PPS)
Number of trademark
applications applied for at
EUIPO plus number of trademark
applications applied for at WIPO
(“yearly Madrid applications by
origin”)
European Union Intellectual
Property Office (EUIPO), World
Intellectual Property Office
(WIPO)
Gross Domestic
Product in Purchasing
Power Standard
Eurostat
2015 Trademarks are an important innovation indicator,
especially for the service sector. The Community
trademark gives its proprietor a uniform right applicable
in all Member States of the European Union through
a single procedure which simplifies trademark policies
at European level. It fulfils the three essential functions
of a trademark: it identifies the origin of goods and
services, guarantees consistent quality through evidence
of the company’s commitment vis-à-vis the consumer,
and it is a form of communication, a basis for publicity
and advertising.
Comment: two-year averages have been used
3.3.3 Designs
applications per
billion GDP (in
PPS)
Number of individual designs
applied for at EUIPO
European Union Intellectual
Property Office (EUIPO)
Gross Domestic
Product in Purchasing
Power Standard
Eurostat
2015 A design is the outward appearance of a product or part
of it resulting from the lines, contours, colours, shape,
texture, materials and/or its ornamentation. A product
can be any industrial or handicraft item including
packaging, graphic symbols and typographic typefaces
but excluding computer programmes. It also includes
products that are composed of multiple components,
which may be disassembled and reassembled.
Community design protection is directly enforceable in
each Member State and it provides both the option of
an unregistered and a registered Community design right
for one area encompassing all Member States.
Comment: two-year averages have been used
4.1.1 Employment
in knowledge-
intensive
activities
(percentage
of total
employment)
Number of employed persons in
knowledge-intensive activities in
business industries. Knowledge-
intensive activities are defined,
based on EU Labour Force
Survey data, as all NACE Rev.2
industries at 2-digit level where
at least 33% of employment
has a higher education degree
(ISCED 5-8)
Eurostat
Total employment
Eurostat
2016 Knowledge-intensive activities provide services directly
to consumers, such as telecommunications, and provide
inputs to the innovative activities of other firms in all
sectors of the economy.

89European Innovation Scoreboard 2017
INDICATOR DEFINITION NUMERATORDEFINITION
DENOMINATOR
MOST RECENT
YEAR FOR
WHICH DATA ARE
AVAILABLE
INTERPRETATION
Source Source
4.1.2 Employment in
fast-growing
enterprises
(percentage
of total
employment)
Number of employees in high-
growth enterprises in 50% ‘most
innovative’ industries34
Eurostat **
Total employment for
enterprises with 10 or
more employees
Eurostat
2014 This indicator provides an indication of the dynamism
of fast-growing firms in innovative sectors as compared
to all fast-growing business activities. It captures the
capacity of a country to transform rapidly its economy
to respond to new needs and to take advantage of
emerging demand.
4.2.1 Exports of
medium and
high technology
products as
a share of total
product exports
Value of medium and high tech
exports, in national currency and
current prices, including exports
of the following SITC Rev.3
products: 266, 267, 512, 513,
525, 533, 54, 553, 554, 562, 57,
58, 591, 593, 597, 598, 629,
653, 671, 672, 679, 71, 72, 731,
733, 737, 74, 751, 752, 759, 76,
77, 78, 79, 812, 87, 88 and 891
Eurostat (ComExt) for Member
States, UN ComTrade for non-EU
countries
Value of total product
exports
Eurostat (ComExt) for
MS, UN ComTrade for
non-MS
2015 The indicator measures the technological compe-
titiveness of the EU, i.e. the ability to commercialise
the results of research and development (R&D) and
innovation in international markets. It also reflects
product specialisation by country. Creating, exploiting
and commercialising new technologies are vital for the
competitiveness of a country in the modern economy.
Medium and high technology products are key drivers
for economic growth, productivity and welfare, and are
generally a source of high value added and well-paid
employment.
4.2.2 Knowledge-
intensive
services exports
as percentage
of total services
exports
Exports of knowledge-intensive
services is defined as the sum of
credits in EBOPS 2010 (Extended
Balance of Payments Services
Classification) items SC1, SC2,
SC3A, SF, SG, SH, SI, SJ and SK135
Eurostat **
Total value of services
exports (S)
Eurostat
2015 The indicator measures the competitiveness of the
knowledge-intensive services sector. Competitiveness-
enhancing measures and innovation strategies can be
mutually reinforcing for the growth of employment,
export shares and turnover at the firm level. It reflects the
ability of an economy, notably resulting from innovation,
to export services with high levels of value added, and
successfully take part in knowledge-intensive global
value chains.
4.2.3 Sales of new-
to-market and
new-to-firm
innovations as
percentage of
turnover
Sum of total turnover of new or
significantly improved products,
either new-to-the-firm or new-
to-the-market, for all enterprises
Eurostat (Community Innovation
Survey)
Total turnover for all
enterprises
Eurostat (Community
Innovation Survey)
2014 This indicator measures the turnover of new or
significantly improved products and includes both
products which are only new to the firm and products
which are also new to the market. The indicator
thus captures both the creation of state-of-the-art
technologies (new-to-market products) and the diffusion
of these technologies (new-to-firm products).
* Data provided by CWTS (Leiden University) as part of a contract to European Commission (DG Research and Innovation).
** Calculations by European Commission (Joint Research Centre). More details on the definitions and calculations are provided in the EIS 2017
Methodology Report.
34 Defined as B06 (Extraction of crude petroleum and natural gas), B09 (Mining support service activities), C11 (Manufacture of beverages), C12 (Manufacture of tobacco products),
C19 (Manufacture of coke and refined petroleum product), C20 (Manufacture of chemicals and chemical products), C21 (Manufacture of basic pharmaceutical products and
pharmaceutical preparations), C26 (Manufacture of computer, electronic and optical products), C27 (Manufacture of electrical equipment), C28 (Manufacture of machinery and equipment
n.e.c.), C29 (Manufacture of motor vehicles, trailers and semi-trailers), C30 (Manufacture of other transport equipment), C32 (Other manufacturing), D35 (Electricity, gas, steam and air
conditioning supply) and E39 (Remediation activities and other waste management services).
35 SC1 (Sea transport), SC2 (Air transport), SC3A (Space transport), SF (Insurance and pension services), SG (Financial services), SH (Charges for the use of intellectual property),
SI (Telecommunications, computer, and information services), SJ (Other business services) and SK1 (Audio-visual and related services)

90 European Innovation Scoreboard 2017
Annex F: Summary Innovation Index (SII) time series
SUMMARY INNOVATION INDEX RELATIVE TO EU IN 2010… in
2016
2010 2011 2012 2013 2014 2015 2016 2010 2011 2012 2013 2014 2015 2016 2016
EU28 0.493 0.496 0.489 0.495 0.489 0.497 0.503 100.0 100.4 99.2 100.3 99.2 100.7 102.0 100.0
BE 0.590 0.588 0.587 0.582 0.583 0.584 0.597 119.6 119.1 119.1 117.9 118.2 118.3 120.9 118.6
BG 0.234 0.245 0.199 0.223 0.223 0.227 0.234 47.4 49.7 40.4 45.2 45.2 46.0 47.5 46.6
CZ 0.434 0.439 0.423 0.421 0.412 0.421 0.416 87.9 89.1 85.8 85.3 83.4 85.3 84.4 82.7
DK 0.688 0.693 0.713 0.718 0.708 0.691 0.675 139.5 140.6 144.6 145.6 143.5 140.1 136.7 134.1
DE 0.627 0.635 0.635 0.636 0.614 0.617 0.609 127.1 128.8 128.7 128.9 124.5 125.0 123.4 121.0
EE 0.411 0.439 0.446 0.451 0.427 0.450 0.393 83.3 89.0 90.3 91.3 86.6 91.2 79.8 78.2
IE 0.554 0.553 0.543 0.550 0.538 0.537 0.571 112.2 112.2 110.1 111.6 109.1 108.9 115.7 113.5
EL 0.333 0.338 0.341 0.346 0.304 0.315 0.337 67.5 68.5 69.1 70.1 61.7 63.8 68.2 66.9
ES 0.395 0.397 0.393 0.389 0.361 0.367 0.386 80.1 80.4 79.8 79.0 73.2 74.3 78.3 76.8
FR 0.525 0.527 0.517 0.522 0.526 0.522 0.539 106.4 106.8 104.8 105.9 106.5 105.8 109.2 107.1
HR 0.277 0.276 0.254 0.265 0.243 0.267 0.270 56.1 55.9 51.5 53.7 49.3 54.1 54.7 53.6
IT 0.372 0.372 0.378 0.370 0.374 0.383 0.371 75.4 75.4 76.7 75.0 75.9 77.6 75.1 73.7
CY 0.432 0.448 0.426 0.437 0.367 0.368 0.369 87.5 90.9 86.4 88.6 74.4 74.7 74.8 73.3
LV 0.244 0.257 0.235 0.241 0.270 0.302 0.287 49.6 52.0 47.6 48.8 54.8 61.2 58.1 57.0
LT 0.288 0.286 0.302 0.304 0.299 0.323 0.391 58.3 57.9 61.2 61.6 60.7 65.4 79.4 77.8
LU 0.592 0.609 0.641 0.641 0.615 0.616 0.599 120.0 123.5 129.9 129.9 124.8 124.8 121.4 119.1
HU 0.350 0.349 0.325 0.326 0.329 0.332 0.332 70.9 70.7 65.9 66.0 66.6 67.2 67.4 66.1
MT 0.318 0.311 0.307 0.359 0.397 0.403 0.378 64.4 62.9 62.2 72.7 80.4 81.6 76.5 75.1
NL 0.588 0.589 0.631 0.638 0.624 0.635 0.639 119.1 119.3 127.9 129.3 126.5 128.6 129.5 127.1
AT 0.555 0.557 0.561 0.567 0.568 0.566 0.599 112.5 113.0 113.8 115.0 115.1 114.7 121.5 119.1
PL 0.261 0.263 0.251 0.254 0.251 0.257 0.270 52.8 53.4 50.9 51.4 50.9 52.2 54.8 53.7
PT 0.421 0.415 0.407 0.411 0.417 0.419 0.409 85.4 84.1 82.5 83.2 84.5 85.0 83.0 81.4
RO 0.236 0.242 0.217 0.205 0.168 0.157 0.167 47.9 49.1 43.9 41.6 34.1 31.9 33.8 33.1
SI 0.483 0.490 0.483 0.480 0.487 0.483 0.482 98.0 99.3 97.9 97.4 98.7 98.0 97.8 95.9
SK 0.306 0.329 0.340 0.357 0.328 0.348 0.345 62.0 66.7 68.9 72.4 66.4 70.6 70.0 68.6
FI 0.671 0.664 0.667 0.660 0.642 0.645 0.646 136.1 134.7 135.2 133.9 130.1 130.8 130.9 128.4
SE 0.697 0.705 0.714 0.716 0.698 0.703 0.708 141.3 142.8 144.7 145.1 141.5 142.6 143.6 140.9
UK 0.560 0.558 0.556 0.557 0.570 0.583 0.618 113.6 113.1 112.7 112.8 115.5 118.1 125.3 122.9
IS 0.599 0.605 0.625 0.623 0.622 0.614 0.600 121.4 122.7 126.6 126.2 126.1 124.5 121.7 119.3
IL 0.588 0.580 0.581 0.586 0.547 0.552 0.548 119.2 117.6 117.8 118.8 110.8 111.9 111.0 108.9
MK 0.167 0.181 0.188 0.182 0.200 0.208 0.218 33.8 36.6 38.2 36.8 40.5 42.1 44.2 43.4
NO 0.499 0.510 0.502 0.504 0.494 0.499 0.571 101.1 103.5 101.8 102.2 100.0 101.1 115.8 113.6
RS 0.231 0.228 0.289 0.299 0.307 0.310 0.317 46.8 46.3 58.5 60.7 62.2 62.8 64.2 62.9
CH 0.767 0.772 0.762 0.780 0.781 0.798 0.812 155.4 156.4 154.4 158.1 158.3 161.8 164.6 161.5
UA 0.163 0.163 0.157 0.153 0.159 0.154 0.142 33.1 33.0 31.7 31.1 32.2 31.3 28.9 28.3
TR 0.229 0.232 0.231 0.231 0.292 0.300 0.294 46.5 47.1 46.7 46.9 59.3 60.9 59.7 58.5

91European Innovation Scoreboard 2017
Annex G: Performance scores per dimensionHuman
resources
Research
systems
Innovation-
friendly
environ ment
Finance
and
support
Firm
invest-
ments
Innovators Linkages
Intellec-
tual
assets
Employ-
ment
impacts
Sales
impacts
2016 2016 2016 2016 2016 2016 2016 2016 2016 2016
EU28 0.481 0.451 0.497 0.473 0.475 0.478 0.479 0.493 0.538 0.664
BE 0.483 0.766 0.594 0.480 0.621 0.776 0.805 0.431 0.408 0.500
BG 0.286 0.116 0.289 0.091 0.247 0.064 0.089 0.487 0.526 0.216
CZ 0.387 0.334 0.410 0.438 0.479 0.411 0.316 0.299 0.513 0.613
DK 0.908 0.815 1.000 0.654 0.519 0.537 0.576 0.728 0.555 0.515
DE 0.493 0.420 0.465 0.559 0.732 0.733 0.651 0.646 0.541 0.761
EE 0.486 0.378 0.491 0.703 0.319 0.131 0.290 0.476 0.376 0.416
IE 0.623 0.598 0.487 0.319 0.474 0.817 0.346 0.308 0.910 0.829
EL 0.344 0.407 0.146 0.267 0.273 0.564 0.413 0.211 0.378 0.327
ES 0.497 0.382 0.541 0.343 0.320 0.199 0.284 0.397 0.398 0.541
FR 0.617 0.593 0.518 0.543 0.422 0.582 0.459 0.430 0.505 0.700
HR 0.308 0.162 0.209 0.288 0.449 0.344 0.255 0.195 0.333 0.161
IT 0.301 0.384 0.314 0.283 0.258 0.505 0.222 0.522 0.384 0.490
CY 0.442 0.469 0.229 0.264 0.204 0.483 0.220 0.546 0.322 0.410
LV 0.371 0.152 0.696 0.429 0.184 0.067 0.208 0.245 0.454 0.301
LT 0.493 0.140 0.604 0.549 0.419 0.443 0.545 0.260 0.358 0.217
LU 0.585 0.868 0.752 0.391 0.341 0.683 0.222 0.819 0.751 0.609
HU 0.258 0.224 0.406 0.251 0.371 0.080 0.303 0.230 0.681 0.632
MT 0.252 0.354 0.480 0.130 0.283 0.377 0.094 0.796 0.841 0.309
NL 0.689 0.800 0.715 0.666 0.333 0.611 0.786 0.552 0.686 0.601
AT 0.551 0.636 0.481 0.542 0.690 0.682 0.652 0.686 0.422 0.534
PL 0.308 0.133 0.364 0.289 0.356 0.012 0.134 0.383 0.473 0.356
PT 0.444 0.454 0.668 0.462 0.370 0.559 0.191 0.373 0.373 0.294
RO 0.198 0.121 0.390 0.102 0.050 0.000 0.148 0.122 0.199 0.401
SI 0.688 0.410 0.497 0.228 0.589 0.427 0.531 0.460 0.399 0.489
SK 0.384 0.212 0.306 0.409 0.290 0.159 0.313 0.190 0.601 0.681
FI 0.810 0.613 0.865 0.721 0.597 0.679 0.622 0.653 0.449 0.482
SE 0.895 0.778 0.945 0.677 0.705 0.608 0.584 0.668 0.748 0.559
UK 0.737 0.769 0.448 0.492 0.497 0.478 0.622 0.431 0.815 0.857
IS 0.597 0.739 1.000 0.698 0.588 0.697 0.736 0.358 0.820 0.277
IL 0.420 0.524 0.453 0.267 1.000 0.415 0.476 0.647 1.000 0.628
RS 0.306 0.178 0.161 0.248 0.544 0.453 0.214 0.112 0.505 0.421
NO 0.708 0.656 0.880 0.605 0.572 0.668 0.595 0.246 0.571 0.325
MK 0.196 0.102 0.268 0.016 0.284 0.369 0.207 0.068 0.047 0.456
CH 0.964 0.994 0.670 0.596 0.901 0.908 0.777 0.742 0.664 0.720
UA 0.263 0.060 n/a 0.108 0.195 0.088 0.023 0.116 0.419 0.214
TR 0.182 0.110 0.482 0.395 0.594 0.468 0.316 0.106 0.052 0.308

92 European Innovation Scoreboard 2017
Annex H: International dataIndicator values (2016)
EU AU BR CA CN IN JP KR RU SA US
1.1.1 New doctorate graduates 1.88 2.37 0.46 1.46 0.21 0.11 1.20 1.64 1.43 0.20 1.57
1.1.2 Population completed tertiary education 32.2 42.9 13.4 55.2 11.5 9.8 49.5 45.5 53.5 14.6 44.6
1.2.1 International scientific co-publications 316.0 1043.4 83.4 1043.4 59.5 12.4 206.1 354.7 89.9 146.3 511.2
1.2.2 Scientific publications among top 10% most cited 10.56 12.47 5.12 12.04 8.08 6.42 6.18 6.57 3.51 7.17 13.95
2.1.1 R&D expenditure in the public sector 0.70 0.83 0.63 0.80 0.48 0.53 0.70 0.88 0.46 0.39 0.68
2.2.1 R&D expenditure in the business sector 1.22 1.19 0.52 1.76 1.58 0.29 2.79 2.96 0.71 0.35 1.94
3.1.1 SMEs with product or process innovations 30.9 55.4 35.1 52.7 n/a 17.9 24.5 29.5 4.7 n/a 22.2
3.1.2 SMEs with marketing or organisational innovations 34.9 49.5 65.8 56.0 n/a 48.7 34.5 30.7 2.4 57.5 n/a
3.2.1 Innovative SMEs collaborating with others 11.2 13.5 5.4 n/a n/a n/a 16.9 2.2 1.0 17.4 n/a
3.2.2 Public-private co-publications 28.7 25.3 1.4 24.8 5.3 0.6 37.7 40.1 0.9 1.3 52.1
3.2.3 Private co-funding of public R&D expenditures 0.05 0.05 n/a 0.05 0.06 n/a 0.02 0.06 0.07 0.03 0.02
3.3.1 PCT patent applications 2.71 1.68 0.19 1.90 1.41 0.28 7.67 7.67 0.29 0.42 3.07
3.3.2 Trademark applications 4.87 11.79 4.96 9.79 13.61 3.62 6.67 13.46 6.12 5.09 2.87
3.3.3 Design applications 0.74 0.64 0.19 0.37 2.87 0.13 0.59 3.66 0.17 0.27 0.22
4.2.1 Medium & high tech product exports 61.2 10.1 26.7 40.2 55.7 29.7 74.1 74.4 13.0 34.5 51.4
4.2.2 Knowledge-intensive services exports 69.3 22.7 78.8 70.4 46.9 85.2 79.5 71.1 65.4 15.1 73.5
Performance in 2016 relative to EU in 2010
AU BR CA CN IN JP KR RU SA US
1.1.1 New doctorate graduates 126.0 24.5 77.7 11.0 5.9 64.1 87.1 76.3 10.7 83.6
1.1.2 Population completed tertiary education 133.0 41.6 171.1 35.8 30.4 153.7 141.1 165.9 45.3 138.4
1.2.1 International scientific co-publications 181.7 51.4 181.7 43.4 19.8 80.8 105.9 53.3 68.0 127.2
1.2.2 Scientific publications among top 10% most cited 118.1 48.5 114.0 76.5 60.8 58.5 62.2 33.3 67.9 132.1
2.1.1 R&D expenditure in the public sector 119.5 90.4 114.2 68.8 76.1 101.1 126.5 66.0 55.7 97.6
2.2.1 R&D expenditure in the business sector 97.2 42.5 143.3 129.2 23.8 227.6 241.8 57.8 28.2 158.1
3.1.1 SMEs with product or process innovations 179.3 113.7 170.5 n/a 57.8 79.4 95.5 15.3 n/a 71.8
3.1.2 SMEs with marketing or organisational innovations 141.8 188.6 160.5 n/a 139.5 98.7 88.0 6.9 164.8 n/a
3.2.1 Innovative SMEs collaborating with others 120.1 48.4 n/a n/a n/a 151.0 19.6 9.0 154.9 n/a
3.2.2 Public-private co-publications 88.2 4.9 86.4 18.6 2.1 131.5 139.8 3.1 4.7 181.6
3.2.3 Private co-funding of public R&D expenditures 103.2 n/a 97.8 113.1 n/a 35.1 117.2 139.7 56.7 42.1
3.3.1 PCT patent applications 78.7 26.8 83.7 72.2 32.1 168.4 168.4 32.7 39.2 106.4
3.3.2 Trademark applications 242.4 102.0 201.2 279.7 74.5 137.0 276.7 125.8 104.7 58.9
3.3.3 Design applications 93.0 50.6 70.7 197.3 41.8 89.2 222.9 47.7 60.5 54.9
4.2.1 Medium & high tech product exports 16.5 43.7 65.7 91.0 48.5 121.0 121.6 21.2 56.4 83.9
4.2.2 Knowledge-intensive services exports 32.7 113.8 101.6 67.7 122.9 114.8 102.6 94.3 21.8 106.1

93European Innovation Scoreboard 2017
Change in performance (2010-2016)
AU BR CA CN IN JP KR RU SA US
1.1.1 New doctorate graduates 9.7 0.9 -1.6 -1.9 -0.9 -3.1 18.5 -16.8 2.3 -7.9
1.1.2 Population completed tertiary education -4.2 -22.4 -13.0 8.6 -6.1 -9.1 -2.7 -33.5 21.6 -14.9
1.2.1 International scientific co-publications -19.4 6.2 -9.6 5.3 1.2 -5.6 1.6 -0.5 6.9 -1.8
1.2.2 Scientific publications among top 10% most cited 3.4 4.1 -0.4 17.5 2.4 -5.4 -0.9 4.0 -6.7 -8.0
2.1.1 R&D expenditure in the public sector 2.3 8.3 -14.0 4.8 -6.4 -8.2 12.3 2.9 3.9 -8.0
2.2.1 R&D expenditure in the business sector -27.2 -3.2 24.5 32.6 2.4 -18.6 28.8 -1.7 -17.3 -20.6
3.1.1 SMEs with product or process innovations 25.0 6.1 6.9 n/a 7.0 4.1 -7.1 4.1 n/a 6.6
3.1.2 SMEs with marketing or organisational innovations 15.6 20.1 4.5 n/a 17.7 4.7 48.2 0.9 20.9 n/a
3.2.1 Innovative SMEs collaborating with others 3.7 -0.2 n/a n/a n/a 57.0 -82.9 2.9 -0.7 n/a
3.2.2 Public-private co-publications -8.1 -0.4 -41.6 10.8 0.3 -13.8 -3.8 -3.1 -4.0 2.9
3.2.3 Private co-funding of public R&D expenditures -12.7 n/a -31.8 -10.0 n/a 8.1 9.3 25.1 -0.9 -4.1
3.3.1 PCT patent applications -7.3 -0.8 1.9 25.8 -0.8 18.6 36.0 3.3 -8.9 4.5
3.3.2 Trademark applications -9.8 4.3 -1.3 114.2 7.9 45.0 -7.3 -19.5 1.6 3.8
3.3.3 Design applications 5.0 -1.5 5.1 -6.3 0.7 -8.7 3.3 -2.3 -7.3 6.4
4.2.1 Medium & high tech product exports 1.1 3.0 6.7 -4.4 6.4 -0.2 0.2 6.9 2.9 -2.2
4.2.2 Knowledge-intensive services exports 4.3 10.2 -5.8 -20.9 2.8 -4.9 5.8 7.6 -0.7 5.9