EU Agricultural Outlook
84
Report Agriculture and Rural Development EU Agricultural Outlook Prospects for EU agricultural markets and income 2015-2025 December 2015
Transcript of EU Agricultural Outlook
ReportAgricultureand RuralDevelopment
Agriculture and Rural Development
EU Agricultural OutlookProspects for EU agricultural markets and income 2015-2025
December 2015

Photos © Shutterstock.comPhotos © Fotolia.com
3
1 EU version of the OECD-FAO AGLINK-COSIMO model.
Note to the reader
This report presents the medium-term outlook for the major EU agricultural commodity markets and agricultural income to 2025, based on a set of coherent macroeconomic assumptions deemed most plausible at the time of the analysis. The projections assume a continuation of current agricultural and trade policies.
Our analysis is based on information available at the end of September 2015 for agricultural production and an agro-economic model used by the European Commission.1
It is accompanied by an uncertainty analysis quantifying potential variations of the results stemming in particular from fluctuations in the macroeconomic environment and yields of the main crops.
As part of the validation process, an external review of the baseline and the uncertainty scenarios was conducted at an outlook workshop in Brussels on 22-23 October 2015. Valuable input was collected from high-level policymakers, European and international modelling and market experts, private companies and other stakeholders, and international organisations such as the International Food Policy Research Institute and the World Bank.
This European Commission publication is a joint effort between the Directorate-General for Agriculture and Rural Development and the Joint Research Centre’s Institute for Prospective Technological Studies (JRC-IPTS). Responsibility for the content rests with the Directorate-General for Agriculture and Rural Development. While every effort is made to provide a robust agricultural market and income outlook, strong uncertainties remain – hence the importance given to the uncertainty analysis. This publication does not necessarily reflect the official opinion of the European Commission.
In the Directorate General for Agriculture and Rural Development, the publication and underlying baseline were prepared by Koen Dillen, Benjamin Van Doorslaer, Pierluigi Londero, Koen Mondelaers and Sophie Hélaine (coordinator). The DG’s outlook groups contributed to the preparation of the baseline.
At JRC-IPTS, the team that helped to prepare the baseline and the uncertainty analysis, and organised the outlook workshop, included Sergio René Araujo Enciso, Thomas Fellmann, Giampiero Genovese, Ignacio Perez Dominguez, Tevecia Ronzon, Fabien Santini (coordinator), Alexandra von der Pahlen. Jean-Michel Terres, Maria Bielza, Adrian Leip, Franz Weiss (JRC-IES) and Szvetlana Acs (JRC) also contributed to the work.
We are grateful to participants in the outlook workshop and many other colleagues for feedback received during preparation of the report.
4 E U A G R I C U L T U R A L O U T L O O K
2 DG Agriculture and Rural Development estimates based on European Commission macroeconomic forecasts and IHS Global Insight
This report presents the medium-term outlook for the major EU agricultural commodity markets and agricultural income to 2025, based on a set of coherent macroeconomic assumptions. It assumes a continuation of current agricultural and trade policies, normal agronomic and climatic conditions and no market disruption. These assumptions imply relatively smooth market developments because they correspond to the average trend agricultural markets are expected to follow if policies would remain unchanged; in reality markets tend to be much more volatile.
The medium-term outlook reflects current agricultural and trade policies, including future changes already agreed upon. Account was taken of common agricultural policy (CAP) implementation options, but the level of aggregation of the model doesn’t allow for all details to be modelled.
Only ratified free-trade agreements are taken into account (i.e. not that with Canada). The import ban on agricultural products and foodstuffs imposed by the Russian Federation until August 2016 (so far) is accounted for and assumed to have been lifted by the end of 2016.
Macroeconomic assumptions2 include a low oil price level, albeit with an increase over the outlook period to reach USD 107 per barrel by 2025 (this remains one of the most sensitive and uncertain assumptions). After two years of a weakening euro, the exchange rate is assumed to appreciate and reach USD 1.37/EUR in 2025. Economic growth in the EU is expected to recover, but to remain below 2 % a year.
In summary, in a general context of lower energy and commodity prices, EU cereals prices are expected to range on average between EUR 150/t and EUR 190/t. Steady growing world demand in a context of affordable feed prices should favour the livestock sector. Therefore, despite the difficulties faced currently on the milk market, the EU dairy sector could grasp these opportunities to further expand, driven also by growing EU domestic demand. After a strong recovery which took place in 2014 and 2015, EU per capita meat consumption is expected to decline slightly except for poultry meat gaining minor market shares over the other meats. Pigmeat small production increase will be driven by export demand, while beef production is expected to decline.
Arable crops
The global market for arable crops has been marked by several consecutive years of record supply, which have led to stock replenishment and a strong drop in prices from the 2012 peak. However, in 2015 cereal prices remained between EUR 150/t and EUR 180/t on the back of solid world demand, which is expected to remain steady in the medium term. In the EU, domestic demand for cereals and oilseeds is driven mainly by feed use. The EU’s cereals export potential will be constrained by a reduction in arable land.
EU cereals production is expected to grow further, to around 320 million t by 2025. Demand is driven by feed demand and good export prospects, in particular for wheat and barley. Growth is constrained by a steady reduction in arable land and slow yield growth in the EU as compared with other regions. It is assumed that maize stocks will recover from their current low level and wheat and barley stocks remain significantly above the 2012 level over the outlook period, albeit below historic levels. Prices are expected to be relatively low, recovering towards the end of the outlook period to close to EUR 190/t for common wheat. Upward price spikes are likely for periods following a production shortfall in a major producer.
In the next decade, developments in the oilseed complex should be driven mainly by the expansion in the livestock sector and the consequent increase in demand for oilseed meals. This should trigger a shift towards more imports of soybeans and especially meals, while domestic rapeseed and sunflower seed production is expected to stabilise at 28 million t in 2025. The proportion of vegetable oils in the biofuels complex is projected to decrease in favour of waste oils and residues. Total food use is expected to decline marginally, bringing total use of vegetable oils down to 22 million t in 2025.
Protein crop production is expected to increase by more than 40 % over the outlook period, given a favourable policy environment (with voluntary coupled support and the ecological focus area obligation) and strong protein demand from more intensive livestock production. It will continue to account for a limited proportion of total area however.
The expiry of sugar and isoglucose quotas in 2017 will have a profound impact on the EU sweetener market. The EU sugar price is expected to approach the world market price, forcing the sector to become more competitive and reducing the incentive for trade partners to export to the EU. Despite lower prices, production of white sugar is expected to increase to
Executive summary

5E X E C U T I V E S U M M A R Y
close to 18 million t in 2025, i.e. around 5 % more than in the years preceding quota expiry. On the domestic market, EU sugar will have to compete with isoglucose, which is expected to become an important sweetener in regions with a sugar production deficit. By the end of the outlook period, the EU should become a net exporter of white sugar, mainly to nearby high-value markets.
Increased biofuels production is expected to drive additional demand only for domestic maize because most of it should stem from non-agricultural feedstock and imports. It is assumed that biofuels will represent only 6.5 % of liquid transport fuels by 2020 (as counted under the Renewable Energy Directive (RED)). Trends in recent years combined with policy uncertainty and a general declining trend in transport fuel use seem to limit the further expansion of biofuels. Production is set to increase by around 15 % by 2020.
Milk and dairy products
The current low prices for dairy commodities and milk are mainly the result of a surge in world and EU supply at a time when China has started to reduce its purchases and Russia has introduced an import ban. However, import demand from other regions of the world has risen significantly and is expected to grow steadily over the outlook period, driven by population growth and a change in diets in favour of dairy products. In addition, Chinese imports should resume growth.
Though lower than in the last decade, the expected 2 % annual increase in world imports and rising EU domestic demand for dairy products are expected to support an increase in deliveries of close to 1 % per year to 164 million t in 2025. The EU’s share of world exports should grow slightly, thanks to its considerable potential to increase production (unlike its main competitor, New Zealand, which is more constrained by the availability of natural resources). We also analyse the dairy outlook for the EU from the point of view of its impact on nitrates and green-house gas (GHG) emissions.
Milk prices are expected to recover to moderate levels in the short term, before increasing further to an average of EUR 360/t in the last five years of the outlook period, in line with expectations for world dairy–commodity prices. The world market should remain thin with only 7.5 % of dairy world production traded in 2025, so that the risk will remain high of short-term market imbalances.
In the next 10 years, around half of the additional milk produced in the EU could be used for powder (mainly SMP) and more than 30 % for cheese. While most of the extra
powder should be exported, the main driver for cheese remains domestic consumption.
Meat
Population and economic growth in developing countries are expected to support higher meat demand and contribute to higher EU meat exports. World meat consumption is expected to increase by 15 % between 2015 and 2025, less than in the previous decade, but still equivalent to a year’s total meat production in the EU.
Thanks to economic recovery and slightly lower prices, overall per capita meat consumption in the EU recovered by a staggering 1.8 kg in 2014. The rise is expected to pick up to 2016, to 67.6 kg (retail weight), before resumption of the previous downward trend. By the end of the outlook period, per capita consumption is expected to fall back to 66.7 kg, close to the 2008 level, with poultry meat taking small market shares from the other meat categories.
EU beef production continues to be driven mainly by dairy herd developments. After the increase in 2014 and 2015, it is expected to fall back into decline albeit at a slower rate, to 7.6 million t in 2025. After decreasing over several years, sheep and goat meat production and consumption are expected to stabilise at the current level thanks to improved profitability and demand remaining steady despite higher prices.
Following a strong recovery in 2014 and 2015, pigmeat production is expected to expand by less than 2 % by 2025 as compared with 2015. In a context of slowly falling internal consumption, pigmeat exports are expected to grow steadily, supported by sustained world demand and slightly improving prices.
EU poultry meat production is expected to expand over the outlook period by close to 4 %, while consumption could increase only marginally. Driven by promising growth in world import demand, EU exports are expected to reach 1.6 million t by 2025 (+15 %) but prices will be under pressure as a result of increased competition from Brazil and the USA.
Agricultural income
Agricultural income per annual working unit (AWU) in the EU-28 is expected to increase substantially by around 15 % in real terms over the 2015-2025 outlook period, as a combined effect of a strong increase in income in the EU-N13 by close to 40 % and a much smaller one in the EU-15 by 2 %. As a result, EU-15/EU-N13 income gap will continue to narrow, but still remain substantial.
6 E U A G R I C U L T U R A L O U T L O O K
The income per AWU figure is a function of the underlying trends for sector income and labour input. Total agricultural income is expected to decline because the more than 10 % increase in total value of production by 2025 does not cover the close to 15 % rise in costs. Therefore, the expected increase in real income per AWU is due to a strong outflow of labour as a result of structural change. Given the large number of small farms and the age of farmers throughout the EU, structural change should continue over the outlook period, but at a slightly slower pace than in the pre-crisis period. The total EU agricultural labour force is expected to fall from 9.9 million AWU in 2014 to 7.3 million in 2025.
Uncertainty analysis and caveats
This outlook for EU agricultural markets and income is based on a specific set of assumptions regarding the future economic, market and policy environment. Also, the baseline assumes normal weather conditions, steady yield trends and no market disruptions (e.g. from animal disease outbreaks, food safety issues, etc.).
An uncertainty analysis accompanying the baseline quantifies some of the upside and downside risks and provides background on possible variation in the results. In particular this takes account of the macroeconomic environment yield variability for the main crops, and selected scenarios: the impact of lower oil prices, greater depreciation of the euro against the US dollar and the possibility of China reducing its livestock production in view of environmental constraints.
7I N D E X
Index
Executive summary ................................................................................................................................................................4
Index ............................................................................................................................................................................................7
Abbreviations ...........................................................................................................................................................................8
1. Introduction – baseline setting ....................................................................................................................................91.1. Domestic policy assumptions ............................................................................................................................................................................................9
1.2. Trade policy assumptions .................................................................................................................................................................................................10
1.3. Macroeconomic environment ..........................................................................................................................................................................................10
Box 1.1 Russian import ban ....................................................................................................................................................................... 11
Box 1.2 How would a depreciation of the euro to the US dollar affect the EU agricultural markets? .................. 14
2. Arable crops .................................................................................................................................................................... 172.1. Land use developments .....................................................................................................................................................................................................17
2.2. Biofuels ........................................................................................................................................................................................................................................20
2.3. Sugar .............................................................................................................................................................................................................................................23
Box 2.1 Isoglucose: The new kid on the block ................................................................................................................................... 25
2.4. Cereals .........................................................................................................................................................................................................................................26
2.5. Rice .................................................................................................................................................................................................................................................29
Box 2.2 Price uncertainty in the medium-term outlook ............................................................................................................... 30
2.6. Protein crops .............................................................................................................................................................................................................................30
2.7. Oilseed complex .....................................................................................................................................................................................................................31
2.8. Feed ...............................................................................................................................................................................................................................................34
Box 2.3 Lower oil prices would impact the main crops prices substantially ..................................................................... 35
3. Milk and dairy products .............................................................................................................................................. 37Box 3.1 Greenhouse gases (GHG) emission and environmental impact for the EU dairy sector by 2025........... 40
Box 3.2 To what extent could structural changes in Chinese livestock sectors affect global and European markets ? ........................................................................................................................................................................................... 48
4. Meat products ................................................................................................................................................................. 514.1. Beef and veal ...........................................................................................................................................................................................................................52
4.2. Sheep and goat meat ..........................................................................................................................................................................................................54
4.3. Pigmeat .......................................................................................................................................................................................................................................55
Box 4.1 Concentration of pigmeat production in some Member States and more piglets traded .......................... 57
4.4. Poultry meat .............................................................................................................................................................................................................................58
5. Agricultural income ...................................................................................................................................................... 615.1. Historical developments.....................................................................................................................................................................................................61
5.2. Income prospects ...................................................................................................................................................................................................................61
6. General consequences of macroeconomic and yield uncertainties ............................................................ 656.1. Exogenous sources of uncertainty ...............................................................................................................................................................................65
6.2. Main impacts of macroeconomic and yield uncertainties..............................................................................................................................67
7. Market outlook - data ................................................................................................................................................. 69
8 E U A G R I C U L T U R A L O U T L O O K
Abbreviations
ACP African, Caribbean and Pacific group of statesASF African swine feverAWU annual working unitBVP bakery, viennoiserie and patisserie productsCAP EU common agricultural policyCPI consumer price indexEAA economic accounts for agricultureEBA “everything but arms”EFA ecological focus areasEU European UnionEU-N13 EU Member States which joined in 2004 or laterEU-15 EU Member States before 2004EU-27 EU Member States excluding Croatia (joined on 1 July 2013)EU-28 current EU Member StatesEUR euroFAO Food and Agriculture Organisation of the United NationsFDP fresh dairy productsFTA free-trade agreementGDP gross domestic productGHG greenhouse gasGM genetically modifiedJRC-IPTS Joint Research Centre — Institute for Perspective Technological StudiesME Middle EastNZ New ZealandOECD Organisation for Economic Cooperation and DevelopmentPDO protected designation of originPEDv porcine epidemic diarrhoea virusPGI protected geographical indicationPSA private storage aidRED Renewable Energy DirectiveROW rest of the worldSMP skimmed milk powderSPS sanitary and phytosanitary TRQ tariff-rate quotaWTA World Trade AtlasUSA/US United States of AmericaUSD US dollarUSDA US Department of AgricultureVCS voluntary coupled supportWMP whole milk powderWTO World Trade Organisation
1st-gen. first-generation2nd-gen. second-generationhl hectolitreskg kilogramst tt.o.e. t oil equivalentw.s.e. white sugar equivalentc.w.e. carcass weight equivalentr.w.e. retail weight equivalentCV coefficients of variation
9
3 See autumn 2015 edition of the Short-term outlook for the arable crop, dairy and meat markets: http://ec.europa.eu/agriculture/markets-and-prices/short-term-outlook/index_en.htm.
4 Historical budget expenditure and future budget envelopes are used to calculate average per ha decoupled payments for the EU-15 and the EU-N13 (after applying transfers between the direct payment and the rural development envelopes as notified by the Member States).
I N T R O D U C T I O N — B A S E L I N E S E T T I N G
1. Introduction – baseline setting
1.1. Domestic policy assumptions
Medium-term projections reflect current agricultural and trade policies, including future changes that have already been agreed upon.
Our policy assumptions take account of the 2013 common agricultural policy (CAP) reform, which entered into force fully in 2015. The following aspects of the reform are expected to have a particular impact on market and income developments:
1) expiry of milk quotas in April 2015;
2) expiry of the quota system for sugar and isoglucose on 30 September 2017;
3) intervention mechanisms: up to 3 million t a year of common wheat, 50 000 t of butter and 109 000 t of skimmed milk powder (SMP) can be bought in each year at fixed intervention prices. Beyond these limits, intervention is open by tender. The Commission may also decide to open intervention by tender for durum wheat, barley, maize, paddy rice, and beef and veal;
4) private storage: the Commission can activate the private storage aided schemes (PSA) for certain products (white sugar, olive oil, linseed, beef, pigmeat, sheep and goat meat, butter, SMP and PDO/PGI cheeses) if the market situation so requires. Since no specific triggers is laid down, these measures are not explicitly modelled;
5) decoupled basic payment scheme:4 while decoupled payments do not affect production decisions directly, further convergence of direct payments among farmers combined with the new distribution of entitlements may sometimes lead to major changes in farmer’s subsidies and income. In addition, the redistribution of direct payments between Member States leads to a gradual increase of direct payments in the EU-N13 in parallel with a reduction in the EU-15; and
6) coupled payments: Member States can couple up to 8 % of their direct payments envelope (up to 13 %, in particular situations, or more subject to Commission approval). In 2014, 27 Member States decided to apply voluntary coupled support (VCS) between 2015 and 2020 for an amount of EUR 4.2 billion per year. Coupled payments are granted per ha or per head within maximum limits. They are added to commodity prices as a top-up to the revenue that can influence production decisions.
This report presents the medium-term outlook for the major EU agricultural commodity markets and agricultural income to 2025, based on a set of coherent macroeconomic assumptions. The baseline assumes normal agronomic and climatic conditions, steady demand and yield trends, and no market disruption (e.g. from animal disease outbreaks, food safety issues, etc.). In addition, the projections assume a continuation of current agricultural and trade policies.
These assumptions imply relatively smooth market developments while in reality markets tend to be much more volatile. Therefore, the outlook is not a forecast. More precisely, the projections correspond to the average trend agricultural markets are expected to follow in a given macroeconomic environment were policies to remain unchanged.
Macroeconomic developments are difficult to predict and compared to last year’s outlook, the assumed oil price is very different given the unanticipated steep decrease in oil price from the end of 2014. We rely on forecasts by macroeconomic specialists and the assumptions used are those deemed most plausible at the time of the analysis. Nevertheless, possible price developments caused by yield variability and different macroeconomic environments are presented systematically around the expected baseline.
The variability of the main results stemming from these uncertainties is summarised at the end of the report. In addition, to address the implications of selected uncertainties, specific scenarios are analysed and presented in dedicated text boxes throughout the report; these include the impact of lower oil prices, a weaker euro against the US dollar and the possibility of China reducing its livestock production because of environmental constraints.
Environmental constraints are not only an issue in China. A text box will illustrate what the projected milk supply increase means in terms of nitrates surplus and GHG emissions in Europe. Also, this year’s outlook contains additional information on the pigmeat market developments at Member-State level.
Assumptions for the world market environment are based on the OECD-FAO’s July 2015 agricultural outlook updated with the most recent global macroeconomic projections. The statistics and market information for the EU are those available at the end of September 20153 and the macroeconomic assumptions are based on projections published in October and November 2015.
10 E U A G R I C U L T U R A L O U T L O O K
5 The Organization of Petroleum Exporting Countries (OPEC) is a permanent, intergovernmental organisation, created at the Baghdad Conference (10–14 September 1960) by Iran, Iraq, Kuwait, Saudi Arabia and Venezuela.
Exceptional market measures can be deployed to address severe market disturbances. These are not explicitly modelled, as decisions are taken case by case. Nevertheless, the effects of the measures adopted in the dairy sector in 2014 and 2015 in response to the Russian import ban are taken into account.
The effects of “greening” are also taken into account to the extent possible. At EU aggregate level, the effects on area allocation, especially crop diversification, are rather limited. Further work is under way to estimate better the impacts of “greening” on individual farmers. Permanent grassland as a proportion of total agricultural area declines very slightly over the outlook period in line with the maintenance of permanent grassland requirement. As regards ecological focus area (EFA), fallow land is only one of the eligible area types: in many Member States, farmers can use other options such as planting areas with nitrogen-fixing crops, catch crops or green cover, and landscape features to meet the EFA requirement on arable land. Therefore, the EFA requirement of 5 % of arable land (and the potential future 7 % requirement) is met despite a small decline in fallow land. Although the impact might seem limited as conditions are broadly met at EU aggregate level, the measures prevent the decline in permanent grassland and fallow land. They will also force some farmers to adapt their farming practices.
Given the geographical aggregation of the model, it is not possible to capture the redistribution of direct payments between and within Member States or the targeted allocation of coupled payments. Similarly, the voluntary capping of payments over EUR 150 000 and specific schemes for small farmers and young farmers are not accounted for. The effect of the redistributive payment, a top-up to the basic payment for the first ha of the holding, as implemented by eight Member States, is also not taken into account. Nevertheless, several elements are included in the expert judgment used to produce the projections.
Environmental policies are not explicitly taken into account in this model. However, the effects of the Nitrates Directive and the need to reduce GHG emissions are factored into the analysis.
1.2. Trade policy assumptions
As regards international trade negotiations and agreements, it is assumed that all commitments under the Uruguay Round Agreement on Agriculture, in particular on market access and subsidised exports, will be fulfilled. No assumptions are
made as to the outcome of the Doha Development Round. The implications of the Bali Ministerial Declaration and the upcoming Nairobi Declaration have not been explicitly taken into account.
The Association Agreements with Moldova and Georgia, as provisionally applied since 1 September 2014, are taken into account. The Deep and Comprehensive Free Trade Agreement with Ukraine, which is part of the Association Agreement, applying as of 1 January 2016 is factored in. However, bilateral and regional trade deals that have still to be ratified, e.g. the FTA with Canada, are not taken into account.
1.3. Macroeconomic environment
Since the unexpected fall in oil prices in the autumn of 2014, the Brent crude oil price has been below USD 70 per barrel throughout 2015. In spring 2015 the price seemed to recover slightly, but it has remained below USD 50 per barrel since the summer. The low oil price can be explained by a combination of lower demand (due to slow economic growth and higher use efficiency) and over supply. The latter is a result of some traditional players, such as Libya, returning to the market and the strong output increase in the USA and Russia, but also of the OPEC5 countries not adjusting production downwards. The combined result is a market oversupply of about 2 million barrels per day.
For the near future upside price risks stem from geo-political developments in the Middle East and Venezuela while downside risks are linked to continuing over supply and build-up of stocks. The latter seems less likely as the current price seems low enough to dampen non-OPEC output with the USA for instance reducing its output in the last quarter of 2015. Our outlook takes a middle view assuming that the price will stay relatively low in 2016 at USD 50 per barrel.
In the longer-term, the price is forecast to rise again to USD 107 per barrel by 2025. This is in line with some expected recovery in world economic growth and higher extraction costs for the non-conventional oil, e.g. in North America, that will be needed to meet increasing world demand. OPEC countries might also contract their output in order to raise the oil price as many oil-exporting countries are currently running budgetary deficits that are not sustainable in the medium-term. One big area of uncertainty as regards price developments is the role of Iran, which used to be an important oil exporter and could return to the market following the deal on its nuclear activities.
11I N T R O D U C T I O N — B A S E L I N E S E T T I N G
6 The EU, the USA, Norway, Canada and Australia
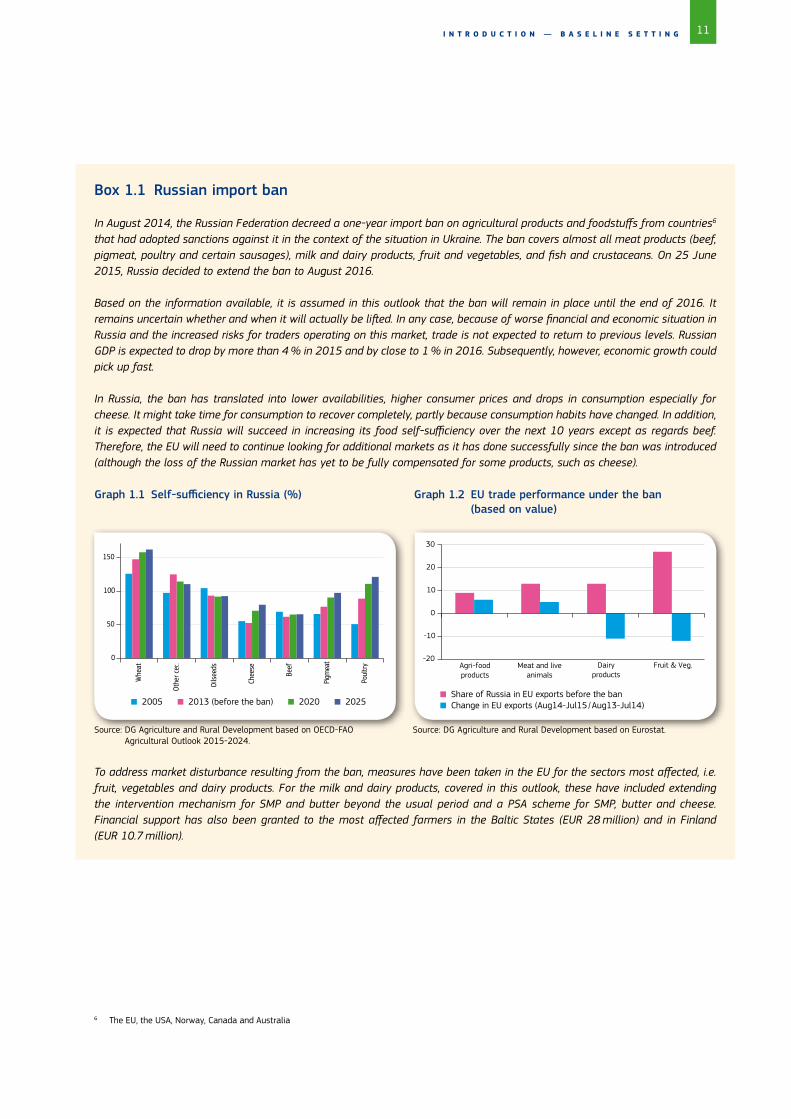
Box 1.1 Russian import ban
In August 2014, the Russian Federation decreed a one-year import ban on agricultural products and foodstuffs from countries6
that had adopted sanctions against it in the context of the situation in Ukraine. The ban covers almost all meat products (beef, pigmeat, poultry and certain sausages), milk and dairy products, fruit and vegetables, and fish and crustaceans. On 25 June 2015, Russia decided to extend the ban to August 2016.
Based on the information available, it is assumed in this outlook that the ban will remain in place until the end of 2016. It remains uncertain whether and when it will actually be lifted. In any case, because of worse financial and economic situation in Russia and the increased risks for traders operating on this market, trade is not expected to return to previous levels. Russian GDP is expected to drop by more than 4 % in 2015 and by close to 1 % in 2016. Subsequently, however, economic growth could pick up fast.
In Russia, the ban has translated into lower availabilities, higher consumer prices and drops in consumption especially for cheese. It might take time for consumption to recover completely, partly because consumption habits have changed. In addition, it is expected that Russia will succeed in increasing its food self-sufficiency over the next 10 years except as regards beef. Therefore, the EU will need to continue looking for additional markets as it has done successfully since the ban was introduced (although the loss of the Russian market has yet to be fully compensated for some products, such as cheese).
Graph 1.1 Self-sufficiency in Russia (%) Graph 1.2 EU trade performance under the ban (based on value)
Source: DG Agriculture and Rural Development based on OECD-FAO Source: DG Agriculture and Rural Development based on Eurostat. Agricultural Outlook 2015-2024.
To address market disturbance resulting from the ban, measures have been taken in the EU for the sectors most affected, i.e. fruit, vegetables and dairy products. For the milk and dairy products, covered in this outlook, these have included extending the intervention mechanism for SMP and butter beyond the usual period and a PSA scheme for SMP, butter and cheese. Financial support has also been granted to the most affected farmers in the Baltic States (EUR 28 million) and in Finland (EUR 10.7 million).
2005 2013 (before the ban) 2020 2025 Share of Russia in EU exports before the ban Change in EU exports (Aug14-Jul15 / Aug13-Jul14)
0
50
100
150
Whe
at
Othe
r cer.
.
Oils
eeds
Chee
se
Beef
Pigm
eat
Poul
try -20
-10
0
10
20
30
Agri-foodproducts
Meat and live animals
Dairyproducts
Fruit & Veg.
12 E U A G R I C U L T U R A L O U T L O O K
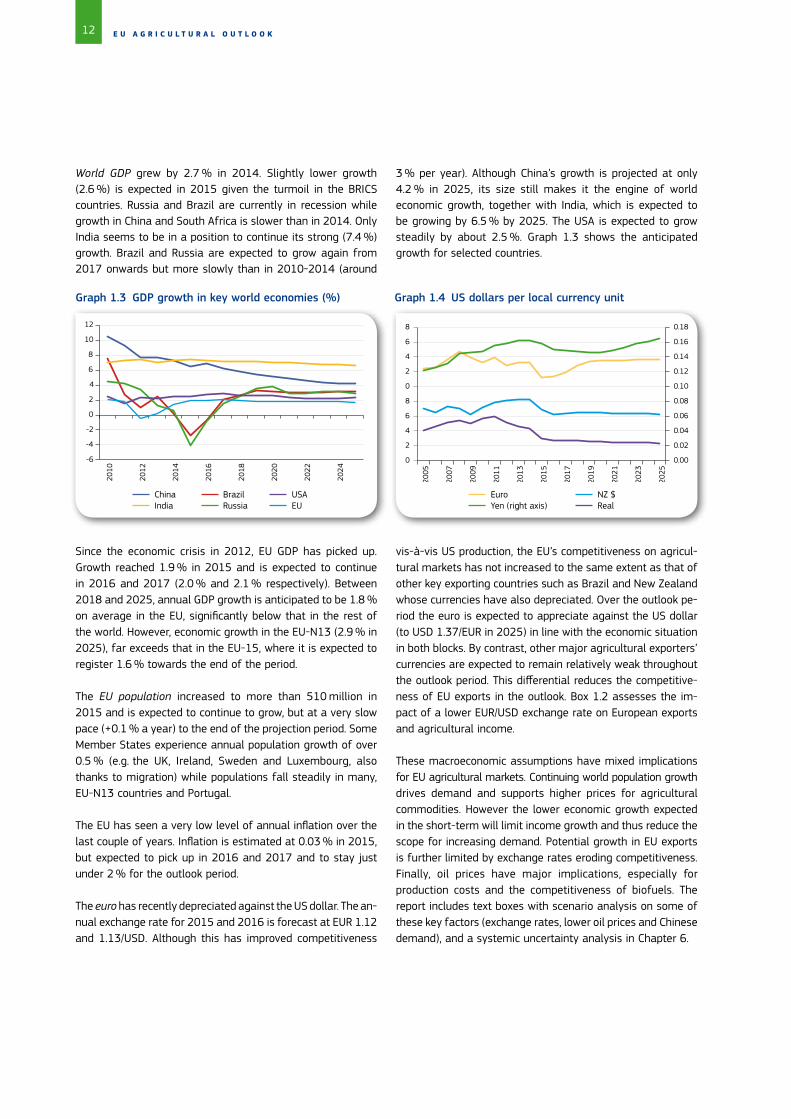
Graph 1.3 GDP growth in key world economies (%) Graph 1.4 US dollars per local currency unit
3 % per year). Although China’s growth is projected at only 4.2 % in 2025, its size still makes it the engine of world economic growth, together with India, which is expected to be growing by 6.5 % by 2025. The USA is expected to grow steadily by about 2.5 %. Graph 1.3 shows the anticipated growth for selected countries.
World GDP grew by 2.7 % in 2014. Slightly lower growth (2.6 %) is expected in 2015 given the turmoil in the BRICS countries. Russia and Brazil are currently in recession while growth in China and South Africa is slower than in 2014. Only India seems to be in a position to continue its strong (7.4 %) growth. Brazil and Russia are expected to grow again from 2017 onwards but more slowly than in 2010-2014 (around
China India
Brazil Russia
USA EU
Euro Yen (right axis)
NZ $ Real
-6
-4
-2
0
2
4
6
8
10
12
2010
2012
2014
2016
2018
2020
2022
2024
0.00
0.02
0.04
0.06
0.08
0.10
0.12
0.14
0.16
0.18
0.0
0.2
0.4
0.6
0.8
1.0
1.2
1.4
1.6
1.8
2005
2007
2009
2011
2013
2015
2017
2019
2021
2023
2025
Since the economic crisis in 2012, EU GDP has picked up. Growth reached 1.9 % in 2015 and is expected to continue in 2016 and 2017 (2.0 % and 2.1 % respectively). Between 2018 and 2025, annual GDP growth is anticipated to be 1.8 % on average in the EU, significantly below that in the rest of the world. However, economic growth in the EU-N13 (2.9 % in 2025), far exceeds that in the EU-15, where it is expected to register 1.6 % towards the end of the period.
The EU population increased to more than 510 million in 2015 and is expected to continue to grow, but at a very slow pace (+0.1 % a year) to the end of the projection period. Some Member States experience annual population growth of over 0.5 % (e.g. the UK, Ireland, Sweden and Luxembourg, also thanks to migration) while populations fall steadily in many, EU-N13 countries and Portugal.
The EU has seen a very low level of annual inflation over the last couple of years. Inflation is estimated at 0.03 % in 2015, but expected to pick up in 2016 and 2017 and to stay just under 2 % for the outlook period.
The euro has recently depreciated against the US dollar. The an-nual exchange rate for 2015 and 2016 is forecast at EUR 1.12 and 1.13/USD. Although this has improved competitiveness
vis-à-vis US production, the EU’s competitiveness on agricul-tural markets has not increased to the same extent as that of other key exporting countries such as Brazil and New Zealand whose currencies have also depreciated. Over the outlook pe-riod the euro is expected to appreciate against the US dollar (to USD 1.37/EUR in 2025) in line with the economic situation in both blocks. By contrast, other major agricultural exporters’ currencies are expected to remain relatively weak throughout the outlook period. This differential reduces the competitive-ness of EU exports in the outlook. Box 1.2 assesses the im-pact of a lower EUR/USD exchange rate on European exports and agricultural income.
These macroeconomic assumptions have mixed implications for EU agricultural markets. Continuing world population growth drives demand and supports higher prices for agricultural commodities. However the lower economic growth expected in the short-term will limit income growth and thus reduce the scope for increasing demand. Potential growth in EU exports is further limited by exchange rates eroding competitiveness. Finally, oil prices have major implications, especially for production costs and the competitiveness of biofuels. The report includes text boxes with scenario analysis on some of these key factors (exchange rates, lower oil prices and Chinese demand), and a systemic uncertainty analysis in Chapter 6.
13I N T R O D U C T I O N — B A S E L I N E S E T T I N G
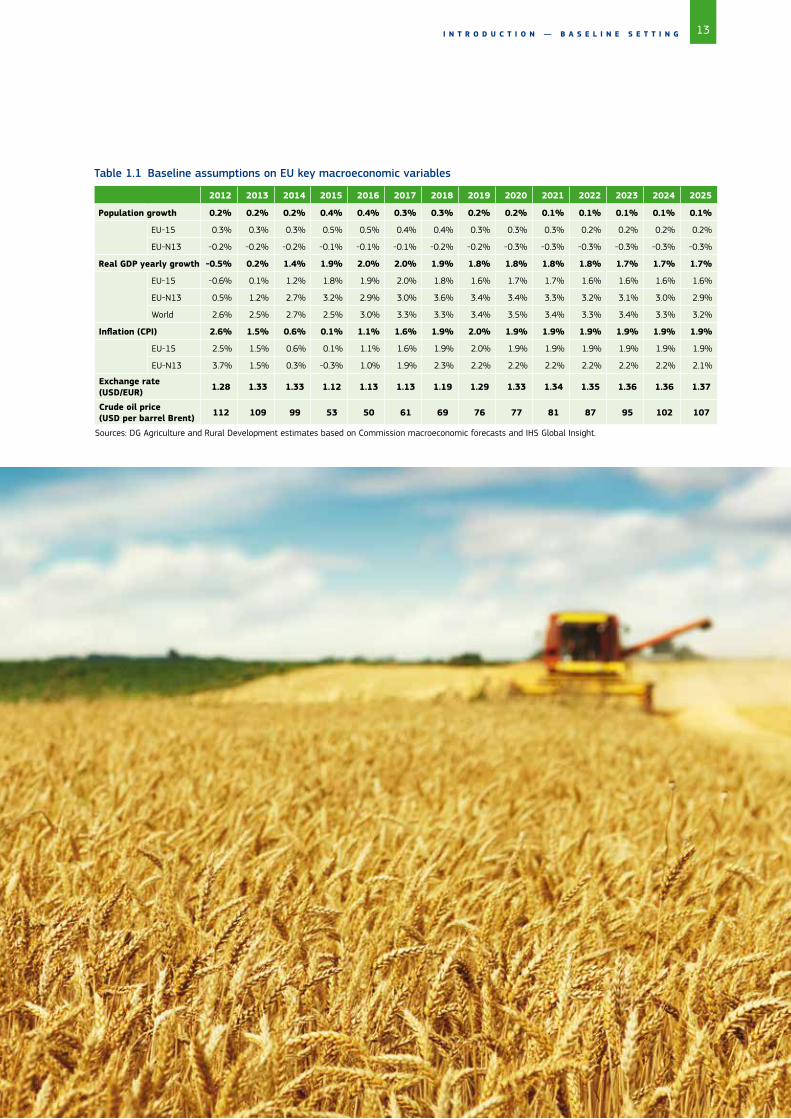
Table 1.1 Baseline assumptions on EU key macroeconomic variables
2012 2013 2014 2015 2016 2017 2018 2019 2020 2021 2022 2023 2024 2025
Population growth 0.2% 0.2% 0.2% 0.4% 0.4% 0.3% 0.3% 0.2% 0.2% 0.1% 0.1% 0.1% 0.1% 0.1%
EU-15 0.3% 0.3% 0.3% 0.5% 0.5% 0.4% 0.4% 0.3% 0.3% 0.3% 0.2% 0.2% 0.2% 0.2%
EU-N13 -0.2% -0.2% -0.2% -0.1% -0.1% -0.1% -0.2% -0.2% -0.3% -0.3% -0.3% -0.3% -0.3% -0.3%
Real GDP yearly growth -0.5% 0.2% 1.4% 1.9% 2.0% 2.0% 1.9% 1.8% 1.8% 1.8% 1.8% 1.7% 1.7% 1.7%
EU-15 -0.6% 0.1% 1.2% 1.8% 1.9% 2.0% 1.8% 1.6% 1.7% 1.7% 1.6% 1.6% 1.6% 1.6%
EU-N13 0.5% 1.2% 2.7% 3.2% 2.9% 3.0% 3.6% 3.4% 3.4% 3.3% 3.2% 3.1% 3.0% 2.9%
World 2.6% 2.5% 2.7% 2.5% 3.0% 3.3% 3.3% 3.4% 3.5% 3.4% 3.3% 3.4% 3.3% 3.2%
Inflation (CPI) 2.6% 1.5% 0.6% 0.1% 1.1% 1.6% 1.9% 2.0% 1.9% 1.9% 1.9% 1.9% 1.9% 1.9%
EU-15 2.5% 1.5% 0.6% 0.1% 1.1% 1.6% 1.9% 2.0% 1.9% 1.9% 1.9% 1.9% 1.9% 1.9%
EU-N13 3.7% 1.5% 0.3% -0.3% 1.0% 1.9% 2.3% 2.2% 2.2% 2.2% 2.2% 2.2% 2.2% 2.1%
Exchange rate (USD/EUR) 1.28 1.33 1.33 1.12 1.13 1.13 1.19 1.29 1.33 1.34 1.35 1.36 1.36 1.37
Crude oil price (USD per barrel Brent) 112 109 99 53 50 61 69 76 77 81 87 95 102 107
Sources: DG Agriculture and Rural Development estimates based on Commission macroeconomic forecasts and IHS Global Insight.
14 E U A G R I C U L T U R A L O U T L O O K
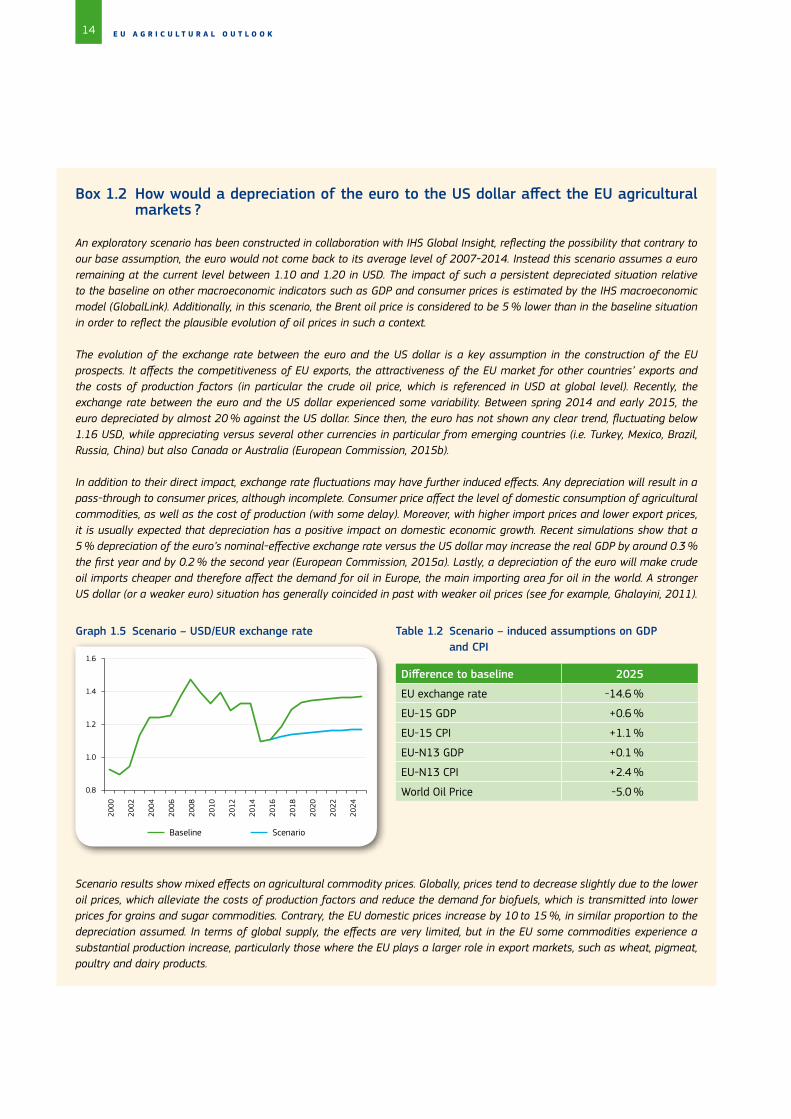
Box 1.2 How would a depreciation of the euro to the US dollar affect the EU agricultural markets ?
An exploratory scenario has been constructed in collaboration with IHS Global Insight, reflecting the possibility that contrary to our base assumption, the euro would not come back to its average level of 2007-2014. Instead this scenario assumes a euro remaining at the current level between 1.10 and 1.20 in USD. The impact of such a persistent depreciated situation relative to the baseline on other macroeconomic indicators such as GDP and consumer prices is estimated by the IHS macroeconomic model (GlobalLink). Additionally, in this scenario, the Brent oil price is considered to be 5 % lower than in the baseline situation in order to reflect the plausible evolution of oil prices in such a context.
The evolution of the exchange rate between the euro and the US dollar is a key assumption in the construction of the EU prospects. It affects the competitiveness of EU exports, the attractiveness of the EU market for other countries’ exports and the costs of production factors (in particular the crude oil price, which is referenced in USD at global level). Recently, the exchange rate between the euro and the US dollar experienced some variability. Between spring 2014 and early 2015, the euro depreciated by almost 20 % against the US dollar. Since then, the euro has not shown any clear trend, fluctuating below 1.16 USD, while appreciating versus several other currencies in particular from emerging countries (i.e. Turkey, Mexico, Brazil, Russia, China) but also Canada or Australia (European Commission, 2015b).
In addition to their direct impact, exchange rate fluctuations may have further induced effects. Any depreciation will result in a pass-through to consumer prices, although incomplete. Consumer price affect the level of domestic consumption of agricultural commodities, as well as the cost of production (with some delay). Moreover, with higher import prices and lower export prices, it is usually expected that depreciation has a positive impact on domestic economic growth. Recent simulations show that a 5 % depreciation of the euro’s nominal-effective exchange rate versus the US dollar may increase the real GDP by around 0.3 % the first year and by 0.2 % the second year (European Commission, 2015a). Lastly, a depreciation of the euro will make crude oil imports cheaper and therefore affect the demand for oil in Europe, the main importing area for oil in the world. A stronger US dollar (or a weaker euro) situation has generally coincided in past with weaker oil prices (see for example, Ghalayini, 2011).
Table 1.2 Scenario – induced assumptions on GDP and CPI
Difference to baseline 2025
EU exchange rate -14.6 %
EU-15 GDP +0.6 %
EU-15 CPI +1.1 %
EU-N13 GDP +0.1 %
EU-N13 CPI +2.4 %
World Oil Price -5.0 %
Baseline Scenario
0.8
1.0
1.2
1.4
1.6
2000
2002
2004
2006
2008
2010
2012
2014
2016
2018
2020
2022
2024
Graph 1.5 Scenario – USD/EUR exchange rate
Scenario results show mixed effects on agricultural commodity prices. Globally, prices tend to decrease slightly due to the lower oil prices, which alleviate the costs of production factors and reduce the demand for biofuels, which is transmitted into lower prices for grains and sugar commodities. Contrary, the EU domestic prices increase by 10 to 15 %, in similar proportion to the depreciation assumed. In terms of global supply, the effects are very limited, but in the EU some commodities experience a substantial production increase, particularly those where the EU plays a larger role in export markets, such as wheat, pigmeat, poultry and dairy products.
15
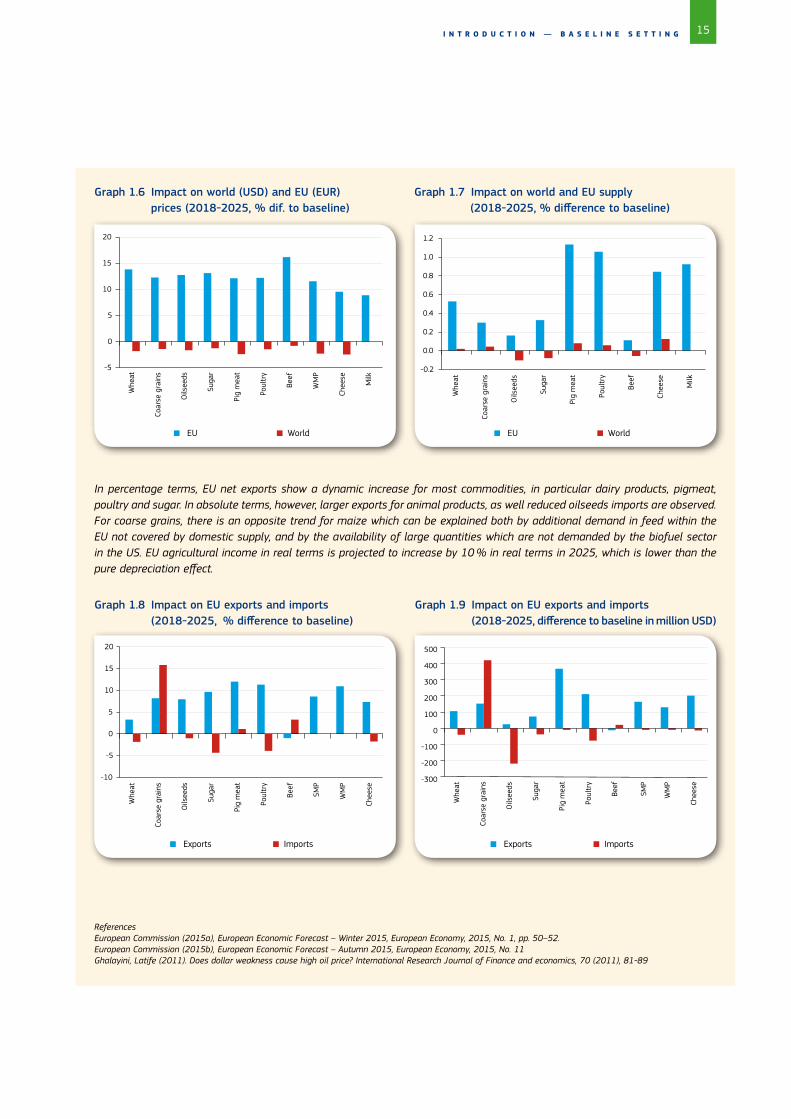
Graph 1.6 Impact on world (USD) and EU (EUR) Graph 1.7 Impact on world and EU supply prices (2018-2025, % dif. to baseline) (2018-2025, % difference to baseline)
In percentage terms, EU net exports show a dynamic increase for most commodities, in particular dairy products, pigmeat, poultry and sugar. In absolute terms, however, larger exports for animal products, as well reduced oilseeds imports are observed. For coarse grains, there is an opposite trend for maize which can be explained both by additional demand in feed within the EU not covered by domestic supply, and by the availability of large quantities which are not demanded by the biofuel sector in the US. EU agricultural income in real terms is projected to increase by 10 % in real terms in 2025, which is lower than the pure depreciation effect.
ReferencesEuropean Commission (2015a), European Economic Forecast – Winter 2015, European Economy, 2015, No. 1, pp. 50–52.European Commission (2015b), European Economic Forecast – Autumn 2015, European Economy, 2015, No. 11Ghalayini, Latife (2011). Does dollar weakness cause high oil price? International Research Journal of Finance and economics, 70 (2011), 81-89
-5
0
5
10
15
20
Whe
at
Coar
se g
rain
s
Oils
eeds
Suga
r
Pig
mea
t
Poul
try
Beef
WM
P
Chee
se
Milk
-0.2
0.0
0.2
0.4
0.6
0.8
1.0
1.2
Whe
at
Coar
se g
rain
s
Oils
eeds
Suga
r
Pig
mea
t
Poul
try
Beef
Chee
se
Milk
Prospects for EU agriculturalmarkets and income2015-2025
Prospects for EU agriculturalmarkets and income2015-2025
Prospects for EU agriculturalmarkets and income2015-2025
Prospects for EU agriculturalmarkets and income2015-2025
Prospects for EU agriculturalmarkets and income2015-2025
Prospects for EU agriculturalmarkets and income2015-2025
EU World EU World
I N T R O D U C T I O N — B A S E L I N E S E T T I N G
-10
-5
0
5
10
15
20
Whe
at
Coar
se g
rain
s
Oils
eeds
Suga
r
Pig
mea
t
Poul
try
Beef
SMP
WM
P
Chee
se -300
-200
-100
0
100
200
300
400
500
Whe
at
Coar
se g
rain
s
Oils
eeds
Suga
r
Pig
mea
t
Poul
try
Beef
SMP
WM
P
Chee
se
Exports Imports Exports Imports
Graph 1.8 Impact on EU exports and imports (2018-2025, % difference to baseline)
Graph 1.9 Impact on EU exports and imports (2018-2025, difference to baseline in million USD)
16 E U A G R I C U L T U R A L O U T L O O K
17A R A B L E C R O P S
2. Arable crops
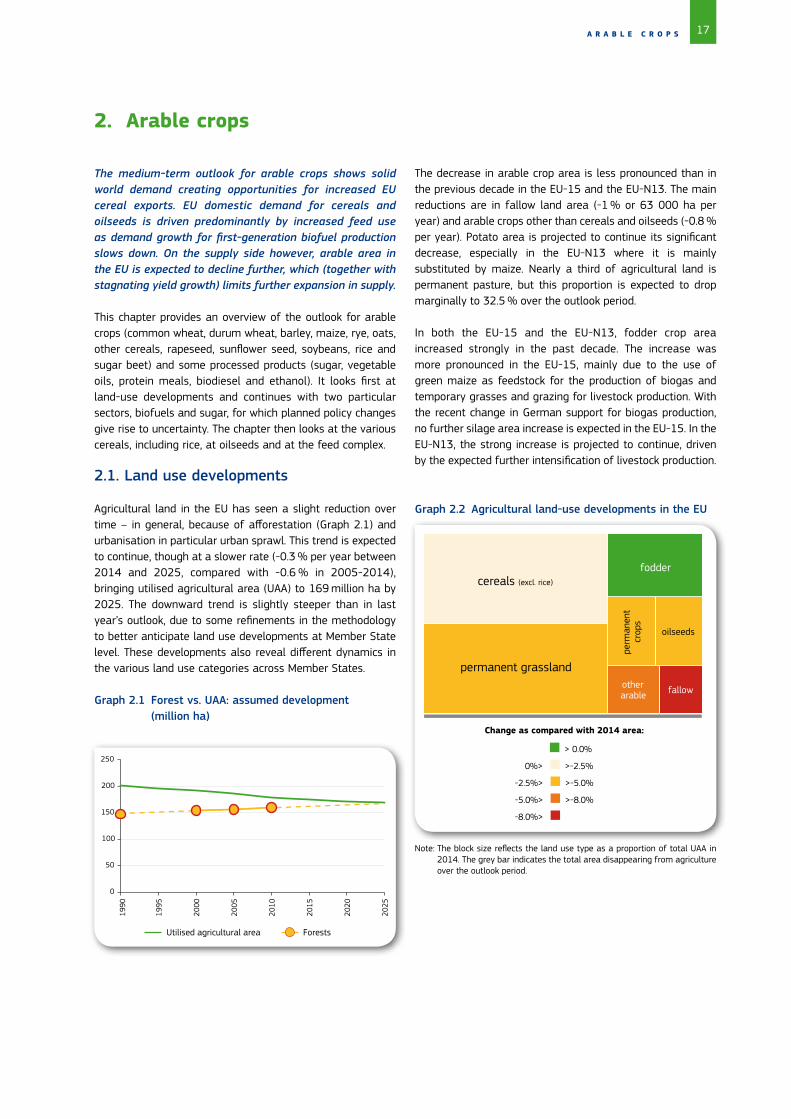
The medium-term outlook for arable crops shows solid world demand creating opportunities for increased EU cereal exports. EU domestic demand for cereals and oilseeds is driven predominantly by increased feed use as demand growth for first-generation biofuel production slows down. On the supply side however, arable area in the EU is expected to decline further, which (together with stagnating yield growth) limits further expansion in supply.
This chapter provides an overview of the outlook for arable crops (common wheat, durum wheat, barley, maize, rye, oats, other cereals, rapeseed, sunflower seed, soybeans, rice and sugar beet) and some processed products (sugar, vegetable oils, protein meals, biodiesel and ethanol). It looks first at land-use developments and continues with two particular sectors, biofuels and sugar, for which planned policy changes give rise to uncertainty. The chapter then looks at the various cereals, including rice, at oilseeds and at the feed complex.
2.1. Land use developments
Agricultural land in the EU has seen a slight reduction over time – in general, because of afforestation (Graph 2.1) and urbanisation in particular urban sprawl. This trend is expected to continue, though at a slower rate (-0.3 % per year between 2014 and 2025, compared with -0.6 % in 2005-2014), bringing utilised agricultural area (UAA) to 169 million ha by 2025. The downward trend is slightly steeper than in last year’s outlook, due to some refinements in the methodology to better anticipate land use developments at Member State level. These developments also reveal different dynamics in the various land use categories across Member States.
Graph 2.1 Forest vs. UAA: assumed development (million ha)
The decrease in arable crop area is less pronounced than in the previous decade in the EU-15 and the EU-N13. The main reductions are in fallow land area (-1 % or 63 000 ha per year) and arable crops other than cereals and oilseeds (-0.8 % per year). Potato area is projected to continue its significant decrease, especially in the EU-N13 where it is mainly substituted by maize. Nearly a third of agricultural land is permanent pasture, but this proportion is expected to drop marginally to 32.5 % over the outlook period.
In both the EU-15 and the EU-N13, fodder crop area increased strongly in the past decade. The increase was more pronounced in the EU-15, mainly due to the use of green maize as feedstock for the production of biogas and temporary grasses and grazing for livestock production. With the recent change in German support for biogas production, no further silage area increase is expected in the EU-15. In the EU-N13, the strong increase is projected to continue, driven by the expected further intensification of livestock production.
0
50
100
150
200
250
1990
1995
2000
2005
2010
2015
2020
2025
Utilised agricultural area Forests
Note: The block size reflects the land use type as a proportion of total UAA in 2014. The grey bar indicates the total area disappearing from agriculture over the outlook period.
Graph 2.2 Agricultural land-use developments in the EU
fallow other arable
oilseedspe
rman
ent
crop
s
fodder
permanent grassland
cereals (excl. rice)
Change as compared with 2014 area:
> 0.0%
0%> >-2.5%
-2.5%> >-5.0%
-5.0%> >-8.0%
-8.0%>

18 E U A G R I C U L T U R A L O U T L O O K
Changes in land-use linked to the CAP reform
The implementation of the CAP reform in the coming years is expected to result in a slight change in agricultural land-use patterns. CAP budget reallocation between Member States and between farmers within Member States could give impetus to some regions while restraining others. Secondly, the targeted use of VCS is aimed at maintaining the production of some speciality crops such as rice, protein crops and durum wheat. Finally, the “greening” provisions are likely to affect various land-use categories. The measure aimed at preserving permanent grassland should help to slow down the disappearance of pasture area. We anticipate a further decline over the outlook period, although at a slower pace. The permanent grassland rule is expected to become restrictive in some Member State only. Over the outlook period, permanent grassland is expected to remain stable as a proportion of total UAA, at around 33 %.
The inclusion of EFAs should slow down the significant decrease in fallow land area since 2008, when compulsory set-aside ended. Currently fallow land area accounts for about 7 % of arable crop area, exceeding the 5 % EFA requirement in the new CAP. Leaving land fallow is only one of the practices qualifying for the EFA measure: in many Member States, farmers can use other options such as planting areas with nitrogen-fixing crops, catch crops or green cover, and landscape features to meet the 5 % EFA requirement on arable land. The outlook assumes a rather small reduction in the total area of fallow land accompanied by a small increase in area dedicated to protein crops.
The greening rule on crop diversification is not expected to lead to major area changes at aggregate level. Individual farms may be impacted, but the anticipated net effect overall is not significant.
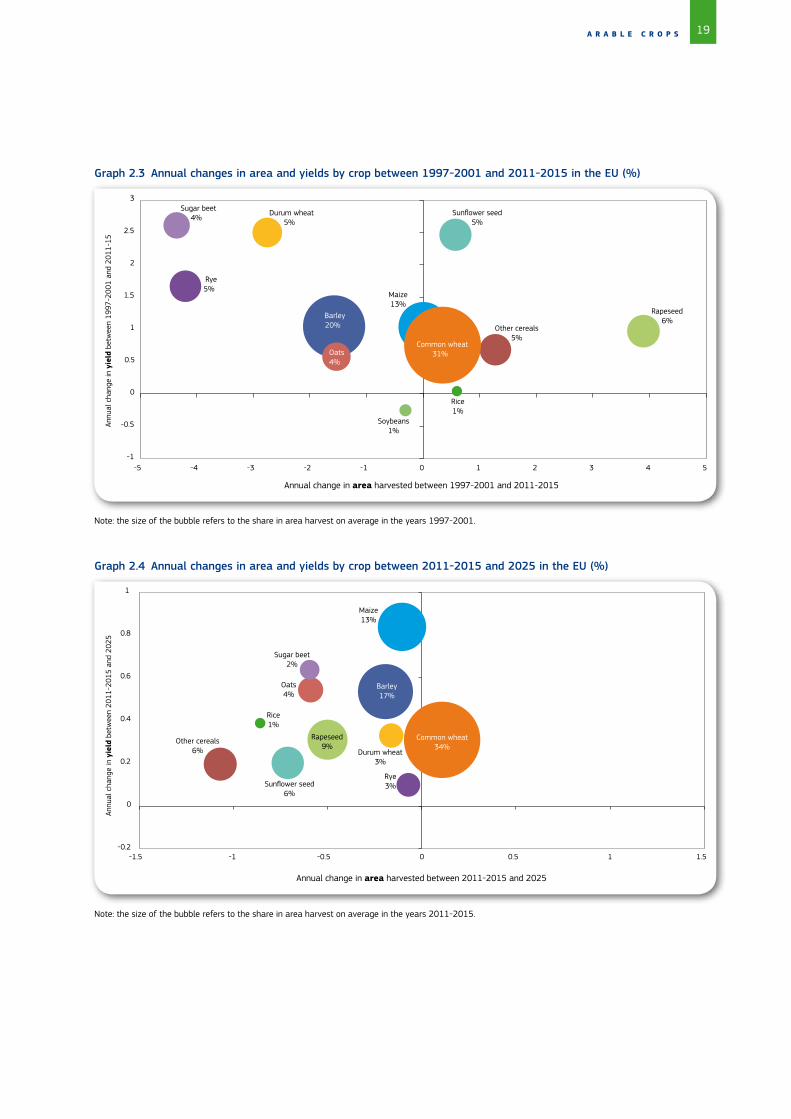
Cereal area has dropped slightly in the past 20 years, but yields and overall production have increased, albeit (in the case of yields) at declining rates. These trends are not expected to change in the coming decade. Graph 2.3 compares historical land-use and yield developments for individual crops on the basis of average annual changes between 1997-2001 and 2011-2015. Rapeseed saw the biggest area expansion (about 4 % on average), driven by biofuels policy and technological breakthroughs.
For cereals, the most notable shift is from rye (with a sharp decrease in area) to triticale (included in the “other cereals” category) and, to a lesser extent, rice. Sugar beet area also fell significantly as a result of the 2006 sugar market reform (smaller quotas) and improved aggregate yields following the concentration of production in productive regions. Average yields for durum wheat and sunflower also increased. For soybeans, on the other hand, yields decreased slightly, which (combined with smaller areas) reduced production significantly. Both phenomena can be explained at least partly by the abandonment of GM soybeans in Romania following the country’s accession the EU, as weed control was much easier under the GM-arrangements.
Area and yield trends in the coming decade are generally expected to converge and grow at a much slower pace (as can be seen from the change in scale in Graph 2.4), so fewer changes in production are foreseen. Driven by a favourable policy and market environment, soybean production (not in Graph 2.4 as the projected annual area change of 3.6 % falls beyond the range) recovers from the contraction of the past decade, with a strong growth in area and modest yield growth (around 0.8 % per year). However, it remains one of the smaller crops in the EU. The area devoted to sunflower and rapeseed is expected to decrease, driven by the stabilisation of demand for vegetable oils and biodiesel.
In the cereals sector, common wheat is the only crop growing in area and yield, due mainly to its competitiveness on the world market, but also to strong animal feed demand. The increase in common wheat area comes at the expense of the other cereals. Maize yield is expected to continue its positive growth driven by feed use, ethanol production and the uptake in isoglucose production. There is scope for a further yield increase especially in the EU-N13. Barley area is relatively stable driven by Chinese demand for coarse grains. The other cereals (rye, oats and triticale) continue an area contraction associated with increased yield following the concentration of production in the most competitive areas.
19A R A B L E C R O P S
Graph 2.3 Annual changes in area and yields by crop between 1997-2001 and 2011-2015 in the EU (%)
Graph 2.4 Annual changes in area and yields by crop between 2011-2015 and 2025 in the EU (%)
Barley20.3 Other cereals
5.2
Rice0.6
Rye5.3
Soybeans0.8
Durum wheat4.7
Maize13.0
Oats4.3
Rapeseed5.6
Sugar beet3.7
Sunflower seed5.5
-1.0
-0.5
0.0
0.5
1.0
1.5
2.0
2.5
3.0
-5 -4 -3 -2 -1 0 1 2 3 4 5
Barley20% Other cereals
5%
Rice1%
Rye5%
Soybeans1%
Durum wheat5%
Maize13%
Oats4%
Rapeseed6%
Sugar beet4%
Sunflower seed5%
Common wheat31%
-1
-0.5
0
0.5
1
1.5
2
2.5
3
-5 -4 -3 -2 -1 0 1 2 3 4 5
Barley17%
Other cereals6%
Rice1%
Rye3%
Durum wheat3%
Maize13%
Oats4%
Rapeseed9%
Sugar beet2%
Sunflower seed6%
Common wheat34%
-0.2
0
0.2
0.4
0.6
0.8
1
-1.5 -1 -0.5 0 0.5 1 1.5
Barley20% Other cereals
5%
Rice1%
Rye5%
Soybeans1%
Durum wheat5%
Maize13%
Oats4%
Rapeseed6%
Sugar beet4%
Sunflower seed5%
Common wheat31%
-1
-0.5
0
0.5
1
1.5
2
2.5
3
-5 -4 -3 -2 -1 0 1 2 3 4 5
Note: the size of the bubble refers to the share in area harvest on average in the years 1997-2001.
Note: the size of the bubble refers to the share in area harvest on average in the years 2011-2015.
Annual change in area harvested between 1997-2001 and 2011-2015
Annual change in area harvested between 2011-2015 and 2025
Annu
al c
hang
e in
yie
ld b
etw
een
1997
-200
1 an
d 20
11-1
5An
nual
cha
nge
in y
ield
bet
wee
n 20
11-2
015
and
2025
20 E U A G R I C U L T U R A L O U T L O O K
7 E10 is a mixture of petrol and ethanol with a 10 % volume share of anhydrous ethanol; it can be used in most traditional petrol engines.8 Directive (EU) 2015/1513 of the European Parliament and of the Council of 9 September 2015 amending Directive 98/70/EC relating to the quality of petrol and
diesel fuels and amending Directive 2009/28/EC on the promotion of the use of energy from renewable sources (OJ L239, 15.9.2015, p. 1).
2.2. Biofuels
Trends in recent years, characterised by policy uncertainty and a general decline in the use of transport fuel, seem to limit the further expansion of biofuels by 2020. Production is set to increase by about 15 % by 2020 compared to today. However, most of the increased production is from non-agricultural feedstock and imports rather than domestic feedstock with the exception of an expansion of maize for ethanol production. The projections assume a 6.5 % proportion of biofuels in total transport energy by 2020 (as counted under the RED).
Brazilian ethanol production and worldwide biodiesel targets determine biofuel dynamics
Thanks to policy backing in many countries worldwide, the biofuel sector has represented an important use for various feedstocks since the early 2000’s. Long before that, Brazil had been the first country to develop a significant biofuels market, using its domestic sugar cane as feedstock. In the past decade, the USA has overtaken Brazil to become the leading consumer and producer of biofuels. Both countries produce mainly ethanol but biodiesel consumption has also taken off in the last few years. These two countries are highlighted as both saw important policy changes over the last year.
In Brazil, domestic petrol prices are regulated by the partly state owned energy supplier Petrobras. Historically, domestic petrol prices have been kept below international prices in order to dampen inflation. As a result, petrol imports have been subsidised and the competitiveness of ethanol vis-à-vis petrol reduced. Driven by budgetary pressure, the Brazilian petrol prices have been adjusted the last couple of months to come more into line with international prices. Combined with new taxation rules and increased blending rates for anhydrous ethanol, this is expected to help the ethanol sector in the domestic market, leading to further expansion of production and consumption. At the same time, biodiesel demand is boosted by an increased domestic mandate although part of this will be met with imports from Argentina.
By contrast, the expansion of ethanol consumption in the USA seems to have slowed down. In May 2015, the Environmental Protection Agency released renewable fuel standards (RFS) for 2014 (retroactively) and 2015-2016. This meant a downward revision of the statutory requirements reflecting US industry’s difficulties in supplying the planned amount of second generation biofuel and the fact that the US blending rate was getting close to the E107 technical blending wall. On the other hand, biodiesel consumption is expected to increase
further in line with RFS targets leading to higher biodiesel output.
The more optimistic dynamic on the biodiesel side is not only noticeable in the USA and Brazil, but seems to be a trend in different regions worldwide. Most countries start from very low levels but some are expected to reach 10 % blending in total diesel by the end of the mandate (OECD-FAO agricultural outlook). Among the strong growers is Indonesia, which foresees a strong increase in biodiesel consumption and production based on domestic palm oil to replace imported diesel.
Given that biofuel production is driven mainly by domestic demand, trade in ethanol and biodiesel does not increase as compared with the last few years. However, the two main drivers of these markets, policy and energy prices, are very uncertain and could change the picture significantly over the outlook period. This is visible in the first years of the period, as low oil prices reduce the competitiveness of crop based biofuels vis-à-vis fossil fuels.
EU policy moving towards GHG-based policies
For the EU, the policy context for biofuels has been determined by two directives setting out sustainability criteria for production and procedures for verifying compliance:
· the RED, which entered into force in 2009, set an overall binding target of sourcing 20 % of EU energy needs from renewables such as biomass, hydro, wind and solar power by 2020. Member States have to cover at least 10 % of their transport energy use from renewable sources (including biofuels); and
· the Fuel Quality Directive, which requires fuel producers to reduce the GHG intensity of transport fuels by 2020.
Both directives have recently been amended by the “ILUC Directive”8 a “next step” in the evolution of EU biofuels policy as it gives a prominent place to indirect land use changes (ILUC) induced by the use of different feedstocks for biofuel production. Although current ILUC values are only preliminary and for reporting purposes, they inspired the policy of introducing a 7 % cap on renewable energy in the transport sector coming from food or feed crops. This has removed some of the uncertainty in the biofuels market as regards the period to 2020.
From 2020 onwards, the RED will be replaced by new energy and climate legislation for which a framework (the 2030 Energy Strategy) was proposed by the Commission in January 2014 and agreed by the European Council in October 2014.
21A R A B L E C R O P S
The framework sets targets of a 40 % cut in GHG emissions (2005-2030) and 27 % renewable energy by 2030. The fact that no specific targets have been set for the transport sector and the focus on GHG reductions including ILUC in current legislation suggests there may be no market guarantee for first generation biofuels after 2020, which will have to compete with fossil fuels on price. The new legislation may provide more ample opportunities beyond 2020 for advanced and waste-based biofuels. It remains to be seen whether the framework is enough to attract the kind of investment for advanced biofuels that will make them viable on a large scale.
The remaining policy uncertainty on the post-2020 legislation could lead to significant changes in feedstock composition in the EU:
· updated default estimates of GHG emissions from biofuels may favour the use of different sources of feedstock; and
· a potential inclusion of ILUC accounting would significantly dampen biofuel demand, in particular for vegetable-oil-based biodiesel.
In order to focus on agricultural markets, the biofuel outlook is highly simplified and distinguishes only two types: ethanol and biodiesel. The land-use implications of biomass-based biofuel production processes (2nd-gen. biofuels) are not considered, as they are still in their infancy. Our specific assumptions for biofuels are:
1. consumption estimates for diesel and petrol-type fuels are taken from the recent baseline developed by JRC-IPTS and the Commission’s Directorate-General for Climate Action using the POLES model;
2. the proportion of total “RED-counted” transport energy consumption in the EU accounted for by biofuels will reach about 6.5 % in 2020 and then remain stable. This translates into a 4.6 % proportion for 1st-gen. or food-based biofuels by 2020 after which it will decrease; and
3. the current lack of long-term investments will hamper the development of 2nd-gen. biofuels (excluding biodiesel based on waste oils) especially in the first years of the outlook period, so that they account for only 0.2 % of all transport energy consumed.
EU biodiesel production from rapeseed reaches ma-turity; some further increase in cereal based ethanol.
In 2014, EU biofuel output exceeded expectations. First and foremost, this was due to ample feedstock supplies at low prices as the 2014 cereal and rapeseed harvests reached
record levels in the EU. In addition, palm oil remained comparably cheap and production capacity for waste based biodiesel increased in a number of Member States. At the same time competition from imports declined as anti-dumping duties brought an end to biodiesel shipments from Argentina and Indonesia. For 2015, a slight decline in EU biofuels output is expected given the lower rapeseed harvest and reduced maize yields in eastern Europe. Imports of ethanol and biodiesel contracted following the imposition of anti-dumping duties on imports from the USA and less ethanol entering from South America, thus increasing the incentive for domestic production.
However, blending profitability has deteriorated due to the impact on demand of low energy prices in 2015. High biofuel premiums do not mean an end to biofuel use, as penalties in some Member States are high enough. However, refiners tend to lower their expenditure on biofuels by drawing on quota surpluses from previous years or using more double counting biofuel. Another factor on the demand side as from 1 January 2015 is the change in biofuel policy in Germany, the first Member State to move towards replacing energy-related biofuel quotas with a GHG reduction target. This change is expected to reduce the use of biofuels, in particular rapeseed-based biodiesel, which is less effective than fuels based on other feedstocks in reducing GHGs. The consequences of this policy change will also be felt elsewhere as German-based biodiesel producers might divert some of their output to Member States with traditional energy-based mandates.
With the current outlook, the EU would on average remain under the “blend wall”, i.e. the proportion of biofuels that can be mixed with fossil fuels for use in the current fleet. Diesel cars are currently certified for blends with up to 7 % biodiesel by volume (fatty acid methyl ester (FAME) or dimethyl ether (DME); around 6.5 % in energy terms) and for petrol cars the limit is 10 % ethanol by volume (around 6.7 % in energy terms). This means there is no need for higher blends (which is possible for current diesel engines using drop-in diesel substitutes, such as hydrotreated vegetable oil (HVO)) or engines adjusted to use higher blends of other biofuels. As some Member States are expected to hit the “blend wall” constraints and given the policy uncertainty, the outlook assumes that the proportion of energy originating from biofuels will remain stable after 2020. However, as 2nd-gen. biofuels gain in importance, demand for 1st-gen. biofuels is expected to decrease after 2020. Moreover, total transport fuel use is seen as decreasing by about 10 % after 2020 due to efficiency gains in line with the EU requirement for new passenger cars to emit less than 95 g CO2/km from 2020 onwards, a reduction of 40 % as compared with the 2007 fleet.
22 E U A G R I C U L T U R A L O U T L O O K
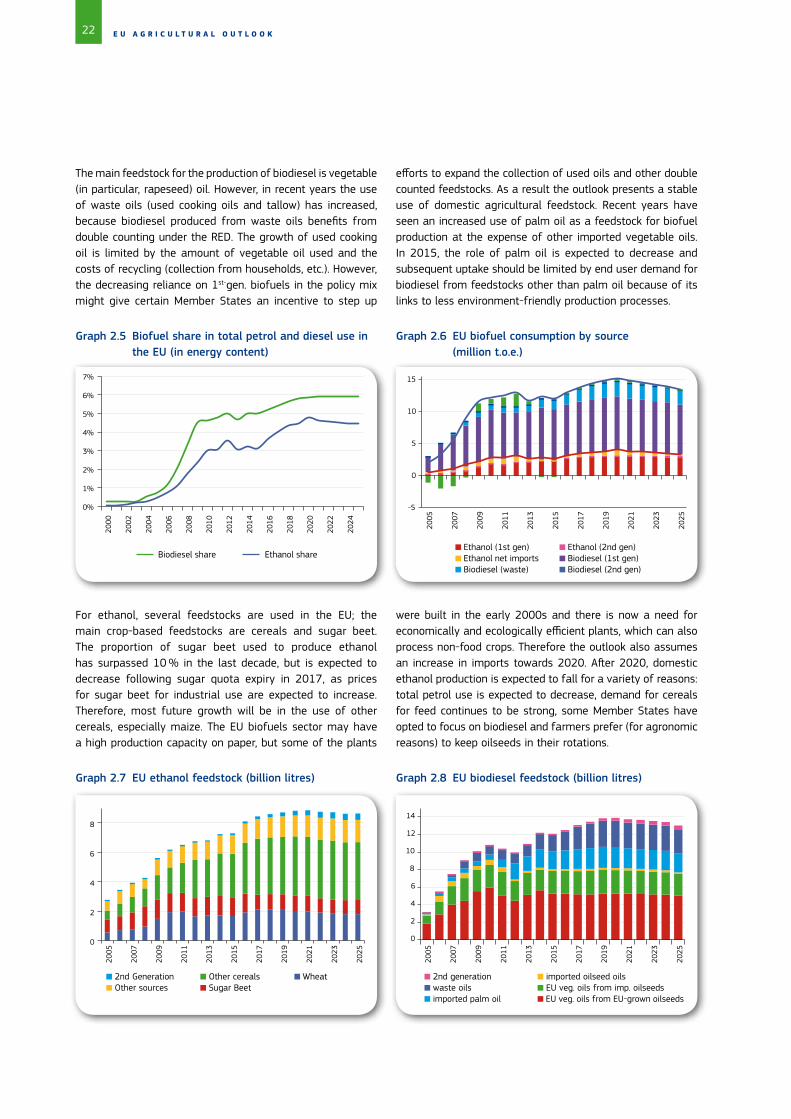
The main feedstock for the production of biodiesel is vegetable (in particular, rapeseed) oil. However, in recent years the use of waste oils (used cooking oils and tallow) has increased, because biodiesel produced from waste oils benefits from double counting under the RED. The growth of used cooking oil is limited by the amount of vegetable oil used and the costs of recycling (collection from households, etc.). However, the decreasing reliance on 1st-gen. biofuels in the policy mix might give certain Member States an incentive to step up
efforts to expand the collection of used oils and other double counted feedstocks. As a result the outlook presents a stable use of domestic agricultural feedstock. Recent years have seen an increased use of palm oil as a feedstock for biofuel production at the expense of other imported vegetable oils. In 2015, the role of palm oil is expected to decrease and subsequent uptake should be limited by end user demand for biodiesel from feedstocks other than palm oil because of its links to less environment-friendly production processes.
Biodiesel share Ethanol share Ethanol (1st gen) Ethanol net imports Biodiesel (waste)
Ethanol (2nd gen) Biodiesel (1st gen) Biodiesel (2nd gen)
Graph 2.5 Biofuel share in total petrol and diesel use in the EU (in energy content)
-5
0
5
10
15
2005
2007
2009
2011
2013
2015
2017
2019
2021
2023
2025
0%
1%
2%
3%
4%
5%
6%
7%
2000
2002
2004
2006
2008
2010
2012
2014
2016
2018
2020
2022
2024
Graph 2.6 EU biofuel consumption by source
(million t.o.e.)
Graph 2.7 EU ethanol feedstock (billion litres) Graph 2.8 EU biodiesel feedstock (billion litres)
2nd Generation Other sources
Other cereals Sugar Beet
Wheat 2nd generation waste oils imported palm oil
0
2
4
6
8
2005
2007
2009
2011
2013
2015
2017
2019
2021
2023
2025
0
2
4
6
8
10
12
14
2005
2007
2009
2011
2013
2015
2017
2019
2021
2023
2025
For ethanol, several feedstocks are used in the EU; the main crop-based feedstocks are cereals and sugar beet. The proportion of sugar beet used to produce ethanol has surpassed 10 % in the last decade, but is expected to decrease following sugar quota expiry in 2017, as prices for sugar beet for industrial use are expected to increase. Therefore, most future growth will be in the use of other cereals, especially maize. The EU biofuels sector may have a high production capacity on paper, but some of the plants
were built in the early 2000s and there is now a need for economically and ecologically efficient plants, which can also process non-food crops. Therefore the outlook also assumes an increase in imports towards 2020. After 2020, domestic ethanol production is expected to fall for a variety of reasons: total petrol use is expected to decrease, demand for cereals for feed continues to be strong, some Member States have opted to focus on biodiesel and farmers prefer (for agronomic reasons) to keep oilseeds in their rotations.
imported oilseed oils EU veg. oils from imp. oilseeds EU veg. oils from EU-grown oilseeds
23A R A B L E C R O P S
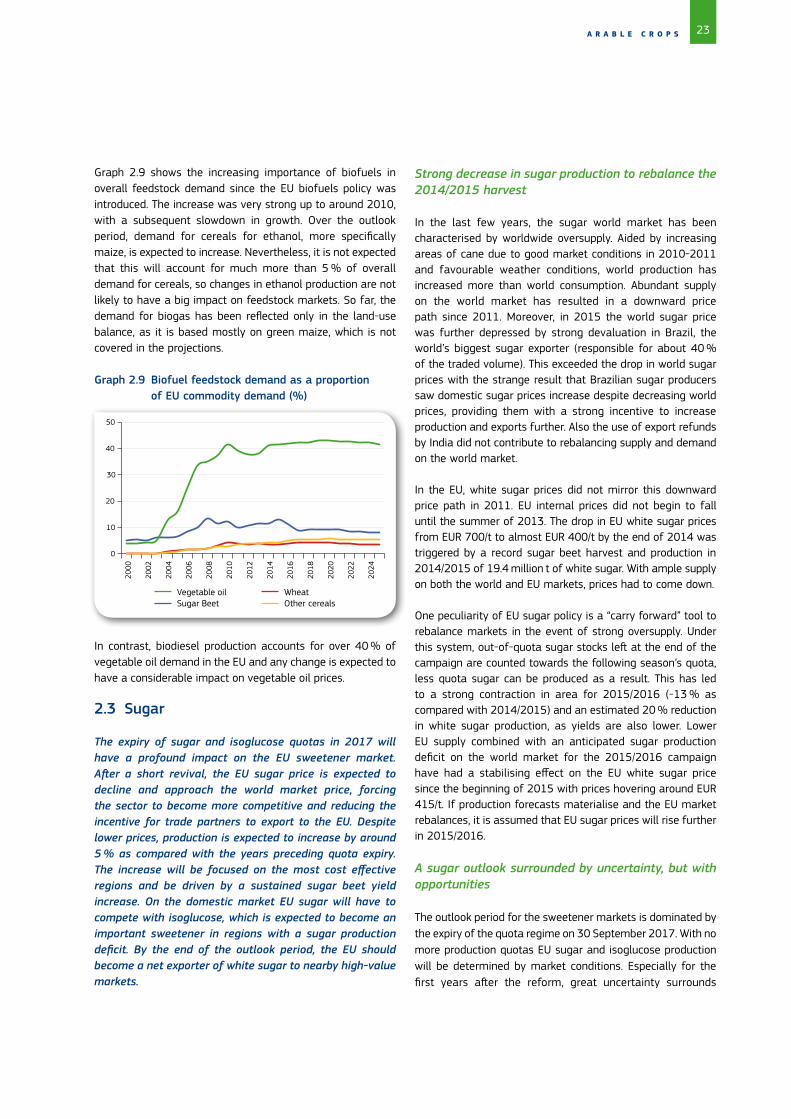
Graph 2.9 shows the increasing importance of biofuels in overall feedstock demand since the EU biofuels policy was introduced. The increase was very strong up to around 2010, with a subsequent slowdown in growth. Over the outlook period, demand for cereals for ethanol, more specifically maize, is expected to increase. Nevertheless, it is not expected that this will account for much more than 5 % of overall demand for cereals, so changes in ethanol production are not likely to have a big impact on feedstock markets. So far, the demand for biogas has been reflected only in the land-use balance, as it is based mostly on green maize, which is not covered in the projections.
Graph 2.9 Biofuel feedstock demand as a proportion of EU commodity demand (%)
Vegetable oil Sugar Beet
Wheat Other cereals
Strong decrease in sugar production to rebalance the 2014/2015 harvest
In the last few years, the sugar world market has been characterised by worldwide oversupply. Aided by increasing areas of cane due to good market conditions in 2010-2011 and favourable weather conditions, world production has increased more than world consumption. Abundant supply on the world market has resulted in a downward price path since 2011. Moreover, in 2015 the world sugar price was further depressed by strong devaluation in Brazil, the world’s biggest sugar exporter (responsible for about 40 % of the traded volume). This exceeded the drop in world sugar prices with the strange result that Brazilian sugar producers saw domestic sugar prices increase despite decreasing world prices, providing them with a strong incentive to increase production and exports further. Also the use of export refunds by India did not contribute to rebalancing supply and demand on the world market.
In the EU, white sugar prices did not mirror this downward price path in 2011. EU internal prices did not begin to fall until the summer of 2013. The drop in EU white sugar prices from EUR 700/t to almost EUR 400/t by the end of 2014 was triggered by a record sugar beet harvest and production in 2014/2015 of 19.4 million t of white sugar. With ample supply on both the world and EU markets, prices had to come down.
One peculiarity of EU sugar policy is a “carry forward” tool to rebalance markets in the event of strong oversupply. Under this system, out-of-quota sugar stocks left at the end of the campaign are counted towards the following season’s quota, less quota sugar can be produced as a result. This has led to a strong contraction in area for 2015/2016 (-13 % as compared with 2014/2015) and an estimated 20 % reduction in white sugar production, as yields are also lower. Lower EU supply combined with an anticipated sugar production deficit on the world market for the 2015/2016 campaign have had a stabilising effect on the EU white sugar price since the beginning of 2015 with prices hovering around EUR 415/t. If production forecasts materialise and the EU market rebalances, it is assumed that EU sugar prices will rise further in 2015/2016.
A sugar outlook surrounded by uncertainty, but with opportunities
The outlook period for the sweetener markets is dominated by the expiry of the quota regime on 30 September 2017. With no more production quotas EU sugar and isoglucose production will be determined by market conditions. Especially for the first years after the reform, great uncertainty surrounds
In contrast, biodiesel production accounts for over 40 % of vegetable oil demand in the EU and any change is expected to have a considerable impact on vegetable oil prices.
2.3 Sugar
The expiry of sugar and isoglucose quotas in 2017 will have a profound impact on the EU sweetener market. After a short revival, the EU sugar price is expected to decline and approach the world market price, forcing the sector to become more competitive and reducing the incentive for trade partners to export to the EU. Despite lower prices, production is expected to increase by around 5 % as compared with the years preceding quota expiry. The increase will be focused on the most cost effective regions and be driven by a sustained sugar beet yield increase. On the domestic market EU sugar will have to compete with isoglucose, which is expected to become an important sweetener in regions with a sugar production deficit. By the end of the outlook period, the EU should become a net exporter of white sugar to nearby high-value markets.
0
10
20
30
40
50
2000
2002
2004
2006
2008
2010
2012
2014
2016
2018
2020
2022
2024
24 E U A G R I C U L T U R A L O U T L O O K
the market situation as drivers that are not represented in our deterministic baseline will determine the final outcome: strategic decisions by sugar processors and isoglucose producers to capture market share, the impact of the weather on production levels, the availability of sugar on the world market and the price of competing crops. Some of these uncertainties are assessed by the stochastic analysis and in Box 2.1 on isoglucose production but the real impact will be more volatile than our analysis seems to suggest.
With the expiry of the quota arrangements, EU sugar prices should approach the world price. On average the EU white sugar price has been EUR 185/t above the world price for the last five years. This gap is expected to narrow to around EUR 70/t on average in the post quota part of the outlook period aided by continuing import tariffs. Given the bearish prospects for world sugar prices this would result in EU white sugar prices hovering around EUR 400/t. Lower sugar prices will be transmitted to the sugar beet price which is expected to dip to EUR 23/t (Graph 2.10).
Graph 2.10 Sugar and sugar beet prices (EUR/t)
EU-N13 area EU-15 area
EU-15 yield (right axis) EU-N13 yield (right axis)
EU white sugar price (left axis) World white sugar price (left axis) EU sugar beet price (right axis) EU industrial sugar beet price (right axis)
0
10
20
30
40
50
60
70
80
0
100
200
300
400
500
600
700
800
2005
2007
2009
2011
2013
2015
2017
2019
2021
2023
2025
0
10
20
30
40
50
60
70
80
90
100
0.0
0.5
1.0
1.5
2.0
2.5
2005
2007
2009
2011
2013
2015
2017
2019
2021
2023
2025
t/ha
mill
ion
ha
Despite the sharp fall in sugar prices, sugar beet and white sugar production are expected to increase slightly after quota expiry. EU white sugar production is expected to increase by about 5 % as compared with the five years before the winding-up of the quota system. This is a combined effect of increased sugar beet yields, increased sugar content and a reduction in harvested areas (Graph 2.11). Among the key factors behind the increase are consistently high yield increases, low transportation costs (through concentration of sugar beet production in the vicinity of the factory and nearby customers) and the reduced costs of longer production and processing campaigns. Accordingly, production increases will take place predominantly in certain Member States such as France and Germany.
Graph 2.11 EU sugar beet area and yield
The drop in area might be smaller than expected. First, the average beet and sugar price hides wide variation between Member States with significantly higher prices in less efficient sugar producing regions. Over the 2014/2015 campaign, the standard deviation around the average EU sugar price among Member States has been as high as EUR 40 (about 10 %). This might lead to continued production despite low average EU prices. Secondly, 10 Member States have chosen to support sugar beet production through VCS. In total almost 500 000 ha of sugar beet could be supported by average VCS support of over above EUR 300/ha, reducing the incentive for farmers to switch to alternative crops such as wheat.
The use of sugar beet for ethanol is assumed to remain stable after quota expiry in absolute terms. Although the market for cheap out-of-quota industrial sugar beet for the biofuel sector disappears (Graph 2.10), sugar beet will remain a low-cost feedstock due to its high energy content. The general growth in sugar beet and ethanol production means that ethanol will become less important as an outlet for sugar beet.
The quota for isoglucose will also expire in 2017 leading to increased competition between sugar and starch-based sweetener. Isoglucose is expected to capture about 11 % of the EU sweetener market by 2025, i.e. about 2.3 million t as compared with just under 700 000 t in 2015 (see Box 2.1 for more information).
The 2017 policy change and the anticipated production reaction have a profound effect on the balance for the EU sugar market. Since the reform of the sector in 2006, which reduced EU production quota significantly, the EU has been a net sugar importer. Imports are expected to decrease significantly over the outlook period and to come predominantly from the most
25A R A B L E C R O P S
competitive trade partners with free access to the EU market, given the EUR 98/t TRQ duty and the anticipated narrowing of the price gap between EU and world prices resulting in prices below income parity. Despite the price movements, imports are expected to remain substantial at just below 2 million t however as EU sugar production is limited to a relatively short period in the autumn and predominantly located in north western Europe creating opportunities for importers and refiners in the southern European and the UK markets.
Over the outlook period the EU is expected to regain self-sufficiency and even export substantial volumes in years where the harvest is successful and world prices are favourable. White sugar exports target neighbouring markets where there is demand for high quality refined sugar or nearby markets with a deficit in white sugar such as some Mediterranean and Gulf countries. In 2025, these exports could account for 2.5 million t and will be sourced from the efficient sugar beet producing regions in the EU.
Box 2.1 Isoglucose: the new kid on the block
Isoglucose, also known as high fructose corn syrup (HFCS), is a sweetener based on starch in which part of the glucose is converted into fructose. This caloric sweetener competes with sugar in food, mainly in soft drinks, fresh dairy products and breakfast cereals. Its liquid form makes it less suitable for other applications where the crystalline structure of granular sugar is needed. While isoglucose production is well established in parts of the world due to starch availability and often stable prices for the raw material, its role is limited in the EU. Under the EU sugar policy, isoglucose production is currently bound by quota at around 700 000 t or less than 4 % of the EU sweetener market. In 2017 however, with the expiry of sugar quota the isoglucose quota will also disappear. The market potential for isoglucose in the European setting is not yet clear.
On the supply side, the market share of isoglucose will depend on a set of variables. As isoglucose competes with sugar on price, supply will depend on relative changes in cereals and sugar prices. Demand will depend mainly on food and drink manufacturers’ willingness to switch and in the end on consumer acceptance. Besides the fact that isoglucose has a slightly different taste, some health related concerns are voiced. Since both consumer preferences and agricultural production differ across Member States, so too will the final market share.
The availability of low cost raw material and the location of current starch and isoglucose production facilities will be crucial to investment decisions as regards future production capacity. Also demand is more likely to turn to isoglucose in countries that are net importers of sugar, where above average white sugar prices are most likely to make it an alternative. On the basis of these parameters eastern EU countries such as Romania, Bulgaria and Hungary, seem best placed for a supply expansion as they are net sugar importers and have excess cereals and existing isoglucose production facilities. Additional demand could also be driven by southern European markets, as they are big net sugar importers that are foreseen to further reduce sugar production further after quota expiry. In north western Europe, expansion is probably more limited and mainly targeted to domestic consumption in the soft drink industry in the UK, which accounts for over 10 % of the EU beverage market.
Soft drinks and fresh dairy products are the main outlet for isoglucose. Currently less than 4 % of domestic sweetener used in the EU is isoglucose, while its share in the USA is around 40 % or almost 25 kg/year per capita. However, the EU average hides wide variation with Bulgaria, Slovakia and especially Hungary above 8.5 kg per capita and 20 Member States below 1 kg. This shows that European taste palettes offer the European food and drink industry scope to increase its use of isoglucose. In the end, market share will depend on industry actors making the switch when they are convinced that a long-term supply of isoglucose at competitive prices can be assured. This will materialise only if starch producers team up with industry to ensure that both sides reap the benefits of a shift to isoglucose.
On the basis of the above factors, this outlook anticipates an 11 % average EU market share for isoglucose hiding wide variation between Member States. This is far below the technical incorporation barrier of around 30 % based on the type of products that use sugar in the European market but still a threefold increase from today. To check the robustness of this outlook the Aglink-Cosimo model is used to assess what would happen to the EU sugar market if isoglucose production were to increase further to 3.4 million t (about 18 % market share). The results seem to suggest that most of the extra production would displace EU white
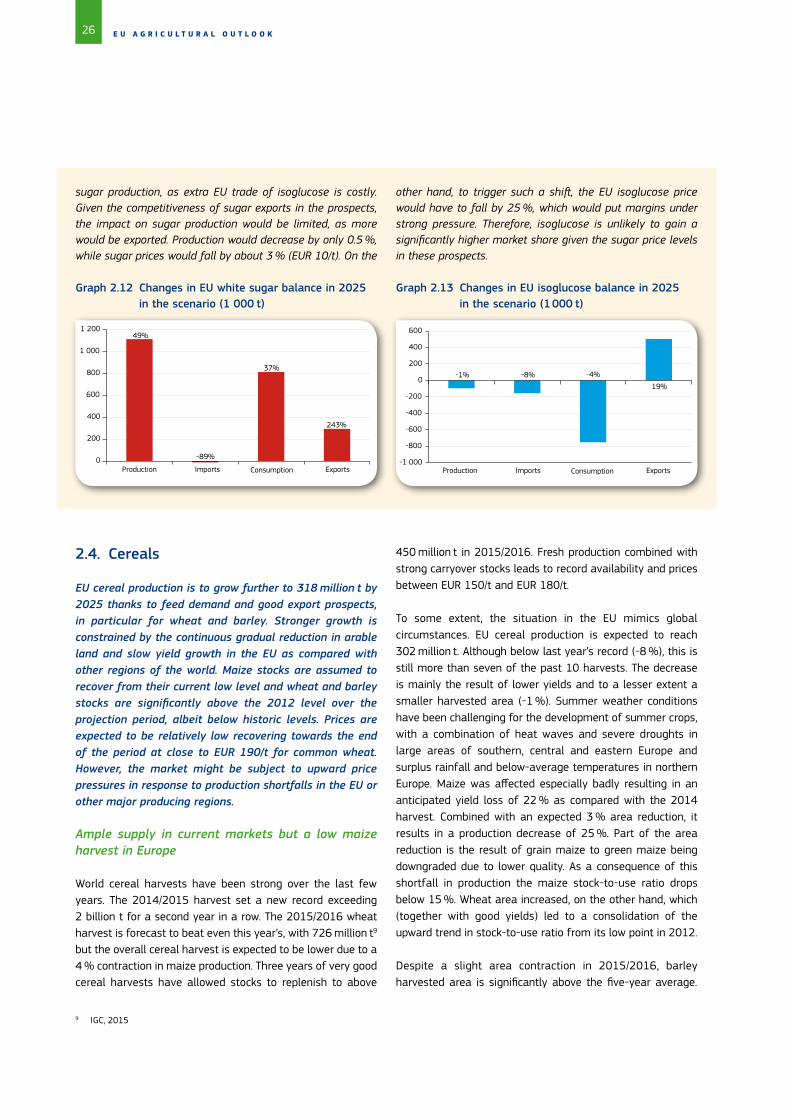
26 E U A G R I C U L T U R A L O U T L O O K
9 IGC, 2015
0
200
400
600
800
1 000
1 200
37%
243%
-89%
49%
Production Imports Consumption Exports -1 000
-800
-600
-400
-200
0
200
400
600
Production Imports Consumption Exports
-1% -8% -4%
19%
Graph 2.12 Changes in EU white sugar balance in 2025 in the scenario (1 000 t)
Graph 2.13 Changes in EU isoglucose balance in 2025 in the scenario (1 000 t)
2.4. Cereals
EU cereal production is to grow further to 318 million t by 2025 thanks to feed demand and good export prospects, in particular for wheat and barley. Stronger growth is constrained by the continuous gradual reduction in arable land and slow yield growth in the EU as compared with other regions of the world. Maize stocks are assumed to recover from their current low level and wheat and barley stocks are significantly above the 2012 level over the projection period, albeit below historic levels. Prices are expected to be relatively low recovering towards the end of the period at close to EUR 190/t for common wheat. However, the market might be subject to upward price pressures in response to production shortfalls in the EU or other major producing regions.
Ample supply in current markets but a low maize harvest in Europe
World cereal harvests have been strong over the last few years. The 2014/2015 harvest set a new record exceeding 2 billion t for a second year in a row. The 2015/2016 wheat harvest is forecast to beat even this year’s, with 726 million t9 but the overall cereal harvest is expected to be lower due to a 4 % contraction in maize production. Three years of very good cereal harvests have allowed stocks to replenish to above
450 million t in 2015/2016. Fresh production combined with strong carryover stocks leads to record availability and prices between EUR 150/t and EUR 180/t.
To some extent, the situation in the EU mimics global circumstances. EU cereal production is expected to reach 302 million t. Although below last year’s record (-8 %), this is still more than seven of the past 10 harvests. The decrease is mainly the result of lower yields and to a lesser extent a smaller harvested area (-1 %). Summer weather conditions have been challenging for the development of summer crops, with a combination of heat waves and severe droughts in large areas of southern, central and eastern Europe and surplus rainfall and below-average temperatures in northern Europe. Maize was affected especially badly resulting in an anticipated yield loss of 22 % as compared with the 2014 harvest. Combined with an expected 3 % area reduction, it results in a production decrease of 25 %. Part of the area reduction is the result of grain maize to green maize being downgraded due to lower quality. As a consequence of this shortfall in production the maize stock-to-use ratio drops below 15 %. Wheat area increased, on the other hand, which (together with good yields) led to a consolidation of the upward trend in stock-to-use ratio from its low point in 2012.
Despite a slight area contraction in 2015/2016, barley harvested area is significantly above the five-year average.
sugar production, as extra EU trade of isoglucose is costly. Given the competitiveness of sugar exports in the prospects, the impact on sugar production would be limited, as more would be exported. Production would decrease by only 0.5 %, while sugar prices would fall by about 3 % (EUR 10/t). On the
other hand, to trigger such a shift, the EU isoglucose price would have to fall by 25 %, which would put margins under strong pressure. Therefore, isoglucose is unlikely to gain a significantly higher market share given the sugar price levels in these prospects.

27A R A B L E C R O P S
Demand for barley and the consequently relatively high EU prices are driven by China’s preference for barley and sorghum over maize imports in the last few years due to concerns about GM maize. For now only France and Denmark are authorised to export barley to China but the UK might soon secure a licence. The good harvests nevertheless allowed barley stock-to-use ratios to recover further.
In summary, world cereal markets at the start of the outlook period are characterised by ample supply and comfortable stock-to-use ratios, with the exception of European maize. This has kept cereal prices between EUR 150/t and EUR 180/t, 87 % above the EU support price. Despite low cereal prices, the cost of production benefited from lower energy prices. The fact that the price did not drop even further despite the abundant supply seems to suggest that demand for cereals remains strong. An upward price spike after a bad harvest in one of the key exporting countries seems possible. So far, the current strong El Niño weather pattern, forecast to peak around the beginning of 2016, has not had a huge impact on production10. However, several regions, such as the Australian wheat production region, are being monitored under the G-20’s Agricultural Market Information System (AMIS) and could influence prices in the near future. Weather effects are not taken into account in this baseline but are dealt with in the general uncertainty analysis. For the likely impact of El Niño on agricultural markets we refer to the dedicated box in last year’s report.
Feed and export use dictate the cereal outlook
The overall increase in EU cereal demand by 5 % in 2025 as compared with 2010-2015 is driven predominantly by dynamics in the feed market (Graph 2.15). Feed demand is expected to grow with the increase in milk and meat
Graph 2.15 Demand for EU cereals (million t)
bioethanol non-feed use feed use
production exports imports
Exports Bioenergy
Feed Food and industrial
0
50
100
150
200
250
300
350
2005
2007
2009
2011
2013
2015
2017
2019
2021
2023
2025
0
50
100
150
2010
-15
2025
2010
-15
2025
2010
-15
2025
2010
-15
2025
Total Wheat Maize Barley Other cereals
Production increases for common wheat (to 145 million t in 2025) and maize (to 73 million t) are driven by better yields, as area expansion is constrained by an overall reduction in arable land. However, yield prospects are not very dynamic in Europe. Graph 2.16 shows the yield trends for different cereals in the EU-15 and the EU-N13. Graph 2.3 illustrates that maize yields have increased substantially since 2000, driven by high prices supported by feed and biofuel demand, especially in the EU-N13. We expect a similar trend for the future, with EU-15 prospects slightly below trend, as yields are close to their agro-economic maximum.
10 So far effects are limited to anticipated local food security problems in Africa and Central America.
production. Demand for cereals is also driven by a further increase in ethanol production, although the overall market impact remains limited, at 5 % of domestic demand. Industrial and food use of maize is also expected to increase with the increased production of isoglucose as an alternative to sugar (Box 2.1).
The prospects for EU cereal exports are positive, with a further 7 % increase over the 2010-2015 average. The shift to producing more maize and wheat at the expense of other cereals is expected to continue in the coming decade, pulled by feed use and export opportunities for wheat in the Mediterranean and the Gulf. Barley manages to retain its position, given positive export expectations and consequently higher prices. However, this export demand is driven mainly by China’s current shift towards barley and sorghum imports. This outlook assumes continuing but limited Chinese demand, as the Chinese are assumed to return to maize as their main imported coarse grain in the near future to ensure adequate supply. With small rises in cereal production and strong exports, imports increase by 7 % over the outlook period to cover EU demand.
Graph 2.14 EU cereal market developments (million t)
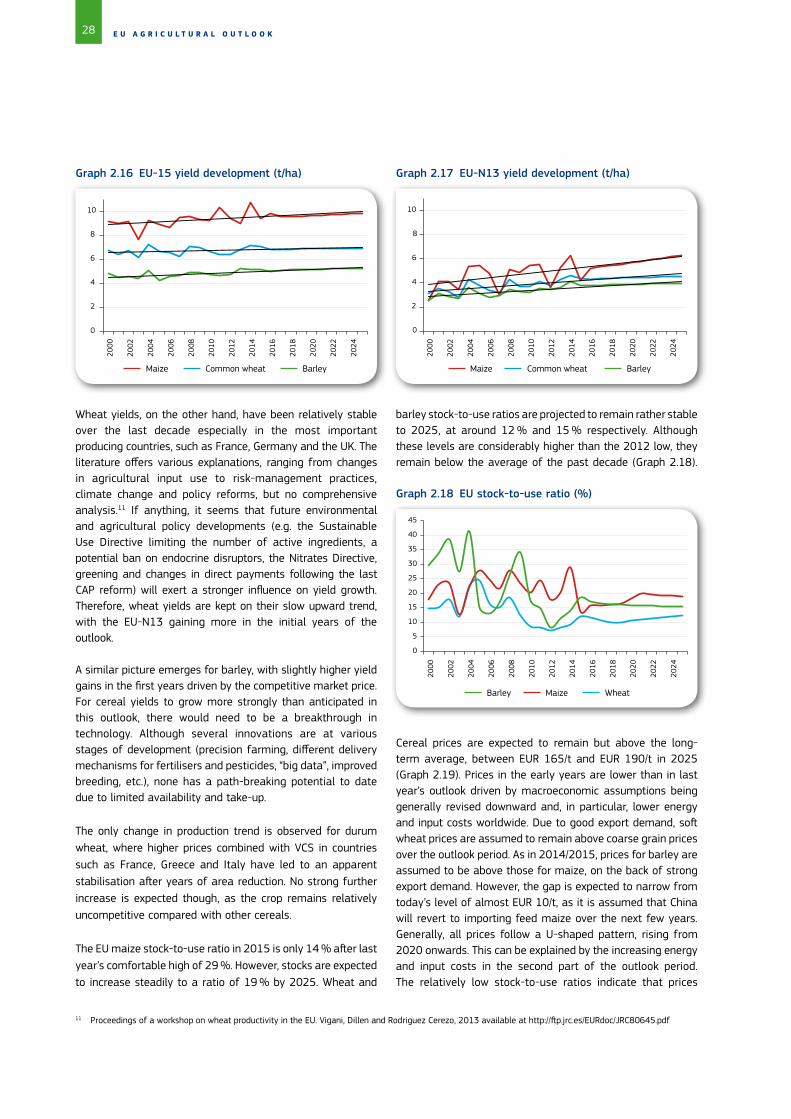
28 E U A G R I C U L T U R A L O U T L O O K
11 Proceedings of a workshop on wheat productivity in the EU. Vigani, Dillen and Rodriguez Cerezo, 2013 available at http://ftp.jrc.es/EURdoc/JRC80645.pdf
Maize Common wheat Barley Maize Common wheat Barley
Graph 2.16 EU-15 yield development (t/ha) Graph 2.17 EU-N13 yield development (t/ha)
0
2
4
6
8
10
2000
2002
2004
2006
2008
2010
2012
2014
2016
2018
2020
2022
2024
0
2
4
6
8
10
2000
2002
2004
2006
2008
2010
2012
2014
2016
2018
2020
2022
2024
Graph 2.18 EU stock-to-use ratio (%)
Barley Maize Wheat
0
5
10
15
20
25
30
35
40
45
2000
2002
2004
2006
2008
2010
2012
2014
2016
2018
2020
2022
2024
Wheat yields, on the other hand, have been relatively stable over the last decade especially in the most important producing countries, such as France, Germany and the UK. The literature offers various explanations, ranging from changes in agricultural input use to risk-management practices, climate change and policy reforms, but no comprehensive analysis.11 If anything, it seems that future environmental and agricultural policy developments (e.g. the Sustainable Use Directive limiting the number of active ingredients, a potential ban on endocrine disruptors, the Nitrates Directive, greening and changes in direct payments following the last CAP reform) will exert a stronger influence on yield growth. Therefore, wheat yields are kept on their slow upward trend, with the EU-N13 gaining more in the initial years of the outlook.
A similar picture emerges for barley, with slightly higher yield gains in the first years driven by the competitive market price. For cereal yields to grow more strongly than anticipated in this outlook, there would need to be a breakthrough in technology. Although several innovations are at various stages of development (precision farming, different delivery mechanisms for fertilisers and pesticides, “big data”, improved breeding, etc.), none has a path-breaking potential to date due to limited availability and take-up.
The only change in production trend is observed for durum wheat, where higher prices combined with VCS in countries such as France, Greece and Italy have led to an apparent stabilisation after years of area reduction. No strong further increase is expected though, as the crop remains relatively uncompetitive compared with other cereals. The EU maize stock-to-use ratio in 2015 is only 14 % after last year’s comfortable high of 29 %. However, stocks are expected to increase steadily to a ratio of 19 % by 2025. Wheat and
Cereal prices are expected to remain but above the long-term average, between EUR 165/t and EUR 190/t in 2025 (Graph 2.19). Prices in the early years are lower than in last year’s outlook driven by macroeconomic assumptions being generally revised downward and, in particular, lower energy and input costs worldwide. Due to good export demand, soft wheat prices are assumed to remain above coarse grain prices over the outlook period. As in 2014/2015, prices for barley are assumed to be above those for maize, on the back of strong export demand. However, the gap is expected to narrow from today’s level of almost EUR 10/t, as it is assumed that China will revert to importing feed maize over the next few years. Generally, all prices follow a U-shaped pattern, rising from 2020 onwards. This can be explained by the increasing energy and input costs in the second part of the outlook period. The relatively low stock-to-use ratios indicate that prices
barley stock-to-use ratios are projected to remain rather stable to 2025, at around 12 % and 15 % respectively. Although these levels are considerably higher than the 2012 low, they remain below the average of the past decade (Graph 2.18).
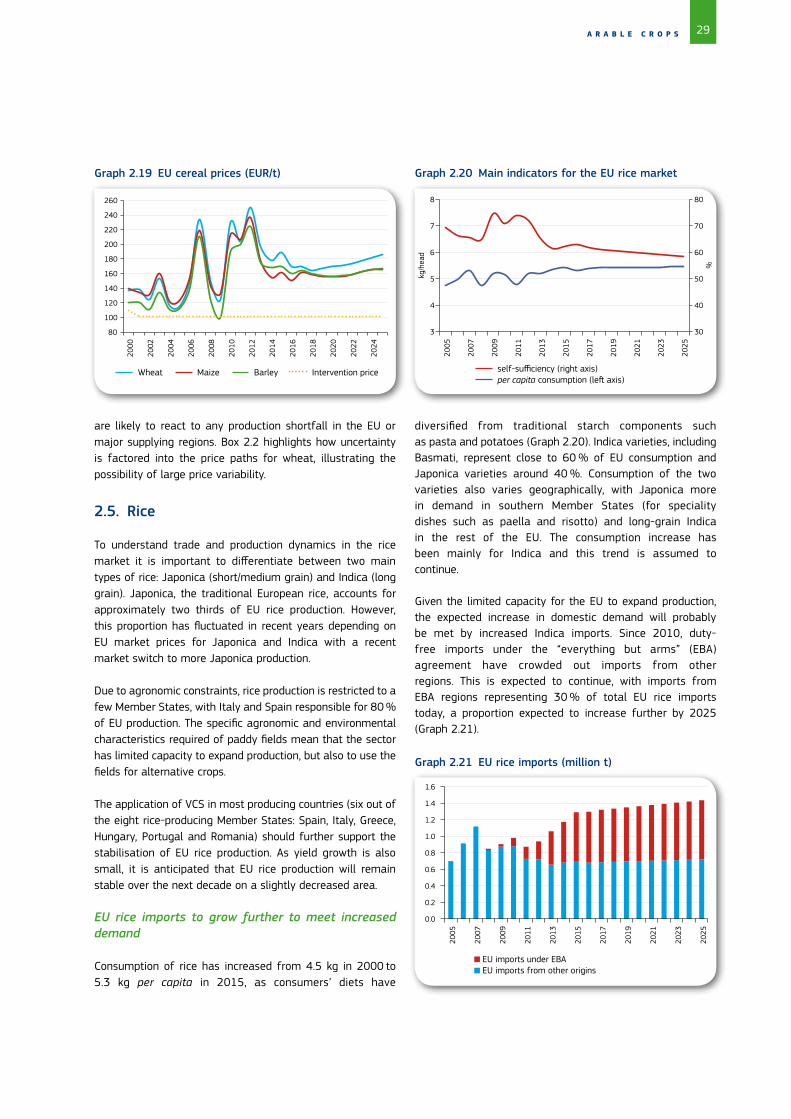
29A R A B L E C R O P S
Graph 2.19 EU cereal prices (EUR/t)
are likely to react to any production shortfall in the EU or major supplying regions. Box 2.2 highlights how uncertainty is factored into the price paths for wheat, illustrating the possibility of large price variability.
2.5. Rice
To understand trade and production dynamics in the rice market it is important to differentiate between two main types of rice: Japonica (short/medium grain) and Indica (long grain). Japonica, the traditional European rice, accounts for approximately two thirds of EU rice production. However, this proportion has fluctuated in recent years depending on EU market prices for Japonica and Indica with a recent market switch to more Japonica production.
Due to agronomic constraints, rice production is restricted to a few Member States, with Italy and Spain responsible for 80 % of EU production. The specific agronomic and environmental characteristics required of paddy fields mean that the sector has limited capacity to expand production, but also to use the fields for alternative crops.
The application of VCS in most producing countries (six out of the eight rice-producing Member States: Spain, Italy, Greece, Hungary, Portugal and Romania) should further support the stabilisation of EU rice production. As yield growth is also small, it is anticipated that EU rice production will remain stable over the next decade on a slightly decreased area.
EU rice imports to grow further to meet increased demand
Consumption of rice has increased from 4.5 kg in 2000 to 5.3 kg per capita in 2015, as consumers’ diets have
Wheat Maize Barley Intervention price
80
100
120
140
160
180
200
220
240
260
2000
2002
2004
2006
2008
2010
2012
2014
2016
2018
2020
2022
2024
diversified from traditional starch components such as pasta and potatoes (Graph 2.20). Indica varieties, including Basmati, represent close to 60 % of EU consumption and Japonica varieties around 40 %. Consumption of the two varieties also varies geographically, with Japonica more in demand in southern Member States (for speciality dishes such as paella and risotto) and long-grain Indica in the rest of the EU. The consumption increase has been mainly for Indica and this trend is assumed to continue.
Given the limited capacity for the EU to expand production, the expected increase in domestic demand will probably be met by increased Indica imports. Since 2010, duty-free imports under the “everything but arms” (EBA) agreement have crowded out imports from other regions. This is expected to continue, with imports from EBA regions representing 30 % of total EU rice imports today, a proportion expected to increase further by 2025 (Graph 2.21).
Graph 2.20 Main indicators for the EU rice market
self-sufficiency (right axis) per capita consumption (left axis)
30
40
50
60
70
80
3
4
5
6
7
8
2005
2007
2009
2011
2013
2015
2017
2019
2021
2023
2025
%
kg/h
ead
Graph 2.21 EU rice imports (million t)
EU imports under EBA EU imports from other origins
0.0
0.2
0.4
0.6
0.8
1.0
1.2
1.4
1.6
2005
2007
2009
2011
2013
2015
2017
2019
2021
2023
2025
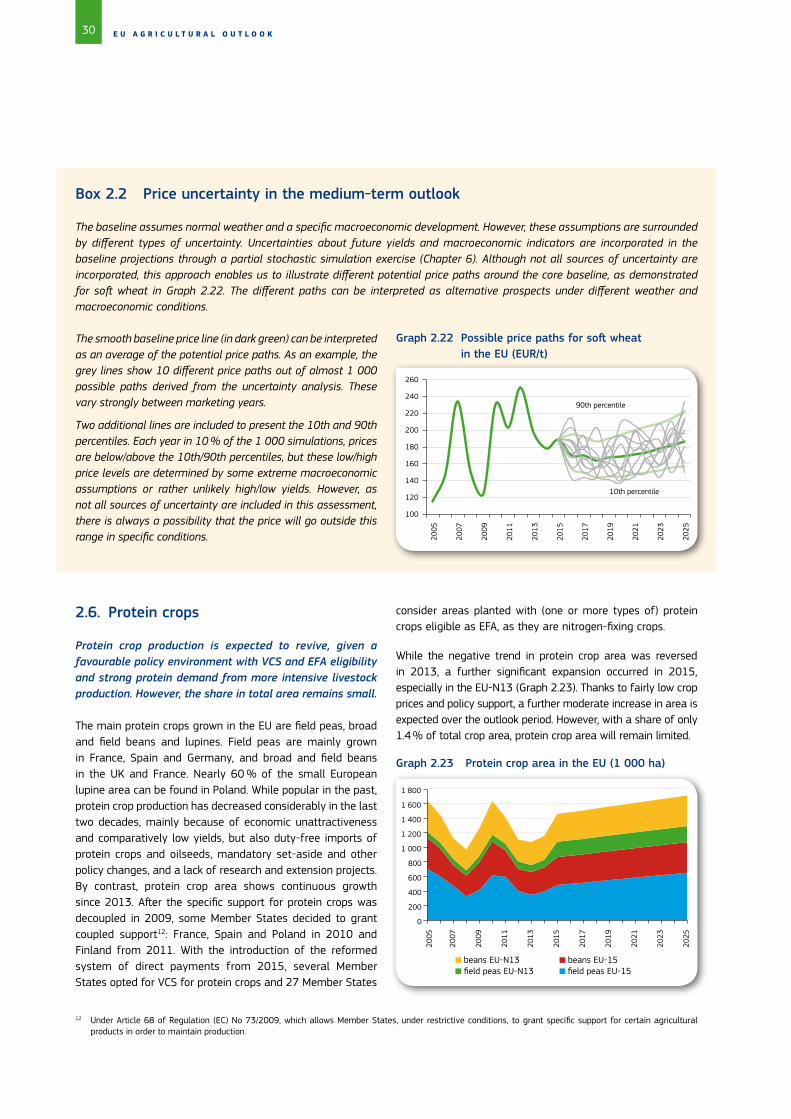
30 E U A G R I C U L T U R A L O U T L O O K
12 Under Article 68 of Regulation (EC) No 73/2009, which allows Member States, under restrictive conditions, to grant specific support for certain agricultural products in order to maintain production.
Box 2.2 Price uncertainty in the medium-term outlook
The baseline assumes normal weather and a specific macroeconomic development. However, these assumptions are surrounded by different types of uncertainty. Uncertainties about future yields and macroeconomic indicators are incorporated in the baseline projections through a partial stochastic simulation exercise (Chapter 6). Although not all sources of uncertainty are incorporated, this approach enables us to illustrate different potential price paths around the core baseline, as demonstrated for soft wheat in Graph 2.22. The different paths can be interpreted as alternative prospects under different weather and macroeconomic conditions.
The smooth baseline price line (in dark green) can be interpreted as an average of the potential price paths. As an example, the grey lines show 10 different price paths out of almost 1 000 possible paths derived from the uncertainty analysis. These vary strongly between marketing years.
Two additional lines are included to present the 10th and 90th percentiles. Each year in 10 % of the 1 000 simulations, prices are below/above the 10th/90th percentiles, but these low/high price levels are determined by some extreme macroeconomic assumptions or rather unlikely high/low yields. However, as not all sources of uncertainty are included in this assessment, there is always a possibility that the price will go outside this range in specific conditions.
100
120
140
160
180
200
220
240
260
2005
2007
2009
2011
2013
2015
2017
2019
2021
2023
2025
90th percentile
10th percentile
Graph 2.22 Possible price paths for soft wheat in the EU (EUR/t)
2.6. Protein crops
Protein crop production is expected to revive, given a favourable policy environment with VCS and EFA eligibility and strong protein demand from more intensive livestock production. However, the share in total area remains small.
The main protein crops grown in the EU are field peas, broad and field beans and lupines. Field peas are mainly grown in France, Spain and Germany, and broad and field beans in the UK and France. Nearly 60 % of the small European lupine area can be found in Poland. While popular in the past, protein crop production has decreased considerably in the last two decades, mainly because of economic unattractiveness and comparatively low yields, but also duty-free imports of protein crops and oilseeds, mandatory set-aside and other policy changes, and a lack of research and extension projects. By contrast, protein crop area shows continuous growth since 2013. After the specific support for protein crops was decoupled in 2009, some Member States decided to grant coupled support12: France, Spain and Poland in 2010 and Finland from 2011. With the introduction of the reformed system of direct payments from 2015, several Member States opted for VCS for protein crops and 27 Member States
consider areas planted with (one or more types of) protein crops eligible as EFA, as they are nitrogen-fixing crops.
While the negative trend in protein crop area was reversed in 2013, a further significant expansion occurred in 2015, especially in the EU-N13 (Graph 2.23). Thanks to fairly low crop prices and policy support, a further moderate increase in area is expected over the outlook period. However, with a share of only 1.4 % of total crop area, protein crop area will remain limited.
Graph 2.23 Protein crop area in the EU (1 000 ha)
beans EU-N13 field peas EU-N13
beans EU-15 field peas EU-15
0
200
400
600
800
1 000
1 200
1 400
1 600
1 800
2005
2007
2009
2011
2013
2015
2017
2019
2021
2023
2025
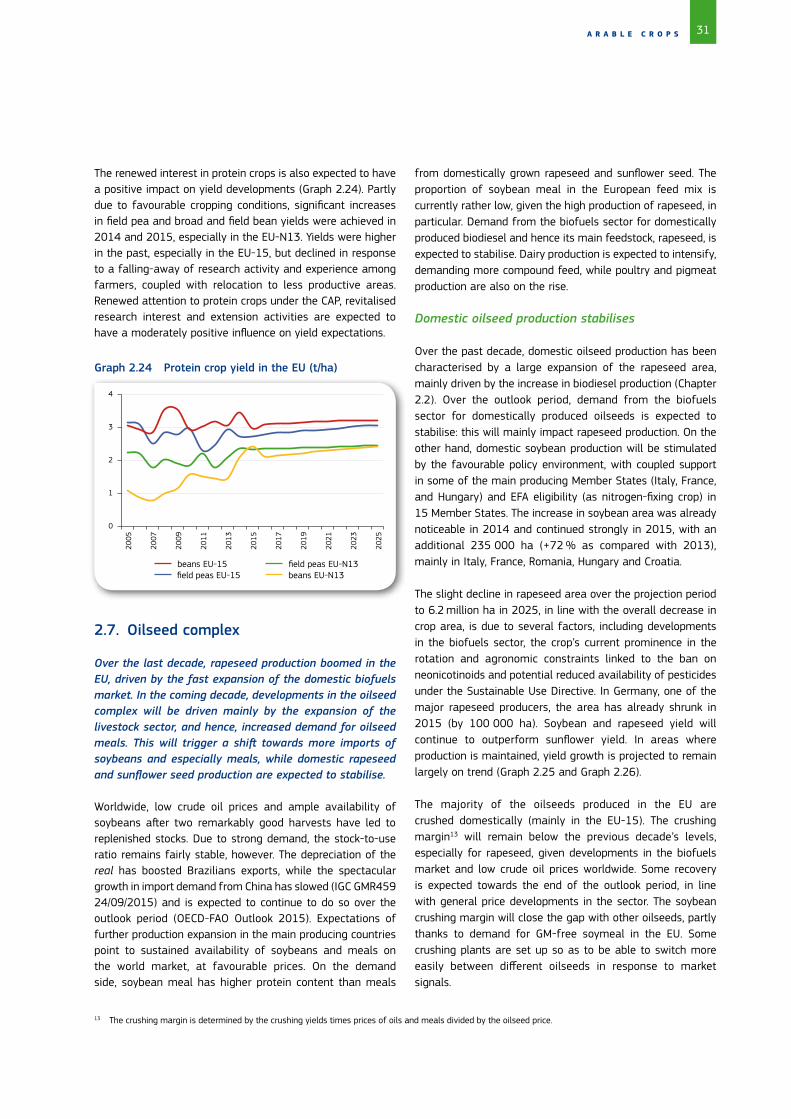
31A R A B L E C R O P S
Graph 2.24 Protein crop yield in the EU (t/ha)
0
1
2
3
4
2005
2007
2009
2011
2013
2015
2017
2019
2021
2023
2025
beans EU-15 field peas EU-15
field peas EU-N13 beans EU-N13
The renewed interest in protein crops is also expected to have a positive impact on yield developments (Graph 2.24). Partly due to favourable cropping conditions, significant increases in field pea and broad and field bean yields were achieved in 2014 and 2015, especially in the EU-N13. Yields were higher in the past, especially in the EU-15, but declined in response to a falling-away of research activity and experience among farmers, coupled with relocation to less productive areas. Renewed attention to protein crops under the CAP, revitalised research interest and extension activities are expected to have a moderately positive influence on yield expectations.
2.7. Oilseed complex
Over the last decade, rapeseed production boomed in the EU, driven by the fast expansion of the domestic biofuels market. In the coming decade, developments in the oilseed complex will be driven mainly by the expansion of the livestock sector, and hence, increased demand for oilseed meals. This will trigger a shift towards more imports of soybeans and especially meals, while domestic rapeseed and sunflower seed production are expected to stabilise.
Worldwide, low crude oil prices and ample availability of soybeans after two remarkably good harvests have led to replenished stocks. Due to strong demand, the stock-to-use ratio remains fairly stable, however. The depreciation of the real has boosted Brazilians exports, while the spectacular growth in import demand from China has slowed (IGC GMR459 24/09/2015) and is expected to continue to do so over the outlook period (OECD-FAO Outlook 2015). Expectations of further production expansion in the main producing countries point to sustained availability of soybeans and meals on the world market, at favourable prices. On the demand side, soybean meal has higher protein content than meals
from domestically grown rapeseed and sunflower seed. The proportion of soybean meal in the European feed mix is currently rather low, given the high production of rapeseed, in particular. Demand from the biofuels sector for domestically produced biodiesel and hence its main feedstock, rapeseed, is expected to stabilise. Dairy production is expected to intensify, demanding more compound feed, while poultry and pigmeat production are also on the rise.
Domestic oilseed production stabilises
Over the past decade, domestic oilseed production has been characterised by a large expansion of the rapeseed area, mainly driven by the increase in biodiesel production (Chapter 2.2). Over the outlook period, demand from the biofuels sector for domestically produced oilseeds is expected to stabilise: this will mainly impact rapeseed production. On the other hand, domestic soybean production will be stimulated by the favourable policy environment, with coupled support in some of the main producing Member States (Italy, France, and Hungary) and EFA eligibility (as nitrogen-fixing crop) in 15 Member States. The increase in soybean area was already noticeable in 2014 and continued strongly in 2015, with an additional 235 000 ha (+72 % as compared with 2013), mainly in Italy, France, Romania, Hungary and Croatia.
The slight decline in rapeseed area over the projection period to 6.2 million ha in 2025, in line with the overall decrease in crop area, is due to several factors, including developments in the biofuels sector, the crop’s current prominence in the rotation and agronomic constraints linked to the ban on neonicotinoids and potential reduced availability of pesticides under the Sustainable Use Directive. In Germany, one of the major rapeseed producers, the area has already shrunk in 2015 (by 100 000 ha). Soybean and rapeseed yield will continue to outperform sunflower yield. In areas where production is maintained, yield growth is projected to remain largely on trend (Graph 2.25 and Graph 2.26).
The majority of the oilseeds produced in the EU are crushed domestically (mainly in the EU-15). The crushing margin13 will remain below the previous decade’s levels, especially for rapeseed, given developments in the biofuels market and low crude oil prices worldwide. Some recovery is expected towards the end of the outlook period, in line with general price developments in the sector. The soybean crushing margin will close the gap with other oilseeds, partly thanks to demand for GM-free soymeal in the EU. Some crushing plants are set up so as to be able to switch more easily between different oilseeds in response to market signals.
13 The crushing margin is determined by the crushing yields times prices of oils and meals divided by the oilseed price.
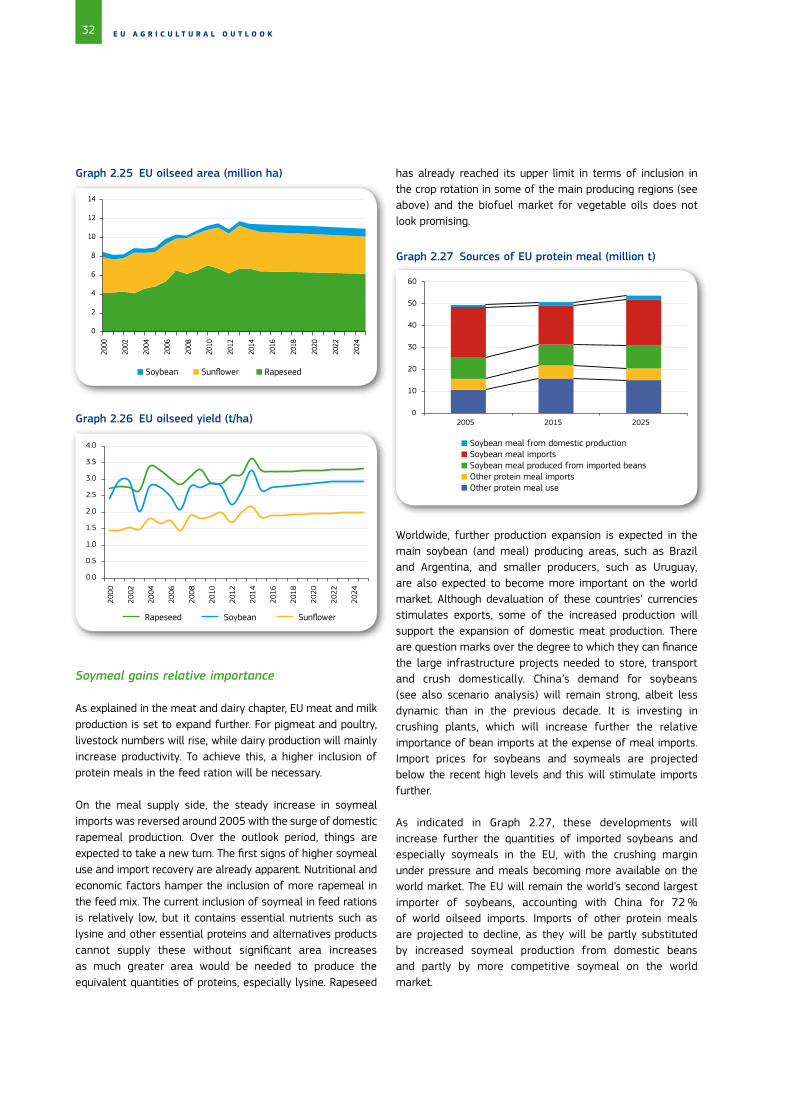
32 E U A G R I C U L T U R A L O U T L O O K
Graph 2.26 EU oilseed yield (t/ha)
Rapeseed Soybean Sunflower
0.0
0.5
1.0
1.5
2.0
2.5
3.0
3.5
4.0
2000
2002
2004
2006
2008
2010
2012
2014
2016
2018
2020
2022
2024
has already reached its upper limit in terms of inclusion in the crop rotation in some of the main producing regions (see above) and the biofuel market for vegetable oils does not look promising.
Graph 2.27 Sources of EU protein meal (million t)
0
10
20
30
40
50
60
2005 2015 2025
Soybean meal from domestic production Soybean meal imports Soybean meal produced from imported beans Other protein meal imports Other protein meal use
Soymeal gains relative importance
As explained in the meat and dairy chapter, EU meat and milk production is set to expand further. For pigmeat and poultry, livestock numbers will rise, while dairy production will mainly increase productivity. To achieve this, a higher inclusion of protein meals in the feed ration will be necessary.
On the meal supply side, the steady increase in soymeal imports was reversed around 2005 with the surge of domestic rapemeal production. Over the outlook period, things are expected to take a new turn. The first signs of higher soymeal use and import recovery are already apparent. Nutritional and economic factors hamper the inclusion of more rapemeal in the feed mix. The current inclusion of soymeal in feed rations is relatively low, but it contains essential nutrients such as lysine and other essential proteins and alternatives products cannot supply these without significant area increases as much greater area would be needed to produce the equivalent quantities of proteins, especially lysine. Rapeseed
Worldwide, further production expansion is expected in the main soybean (and meal) producing areas, such as Brazil and Argentina, and smaller producers, such as Uruguay, are also expected to become more important on the world market. Although devaluation of these countries’ currencies stimulates exports, some of the increased production will support the expansion of domestic meat production. There are question marks over the degree to which they can finance the large infrastructure projects needed to store, transport and crush domestically. China’s demand for soybeans (see also scenario analysis) will remain strong, albeit less dynamic than in the previous decade. It is investing in crushing plants, which will increase further the relative importance of bean imports at the expense of meal imports. Import prices for soybeans and soymeals are projected below the recent high levels and this will stimulate imports further.
As indicated in Graph 2.27, these developments will increase further the quantities of imported soybeans and especially soymeals in the EU, with the crushing margin under pressure and meals becoming more available on the world market. The EU will remain the world’s second largest importer of soybeans, accounting with China for 72 % of world oilseed imports. Imports of other protein meals are projected to decline, as they will be partly substituted by increased soymeal production from domestic beans and partly by more competitive soymeal on the world market.
Graph 2.25 EU oilseed area (million ha)
Soybean Sunflower Rapeseed
0
2
4
6
8
10
12
14
2000
2002
2004
2006
2008
2010
2012
2014
2016
2018
2020
2022
2024
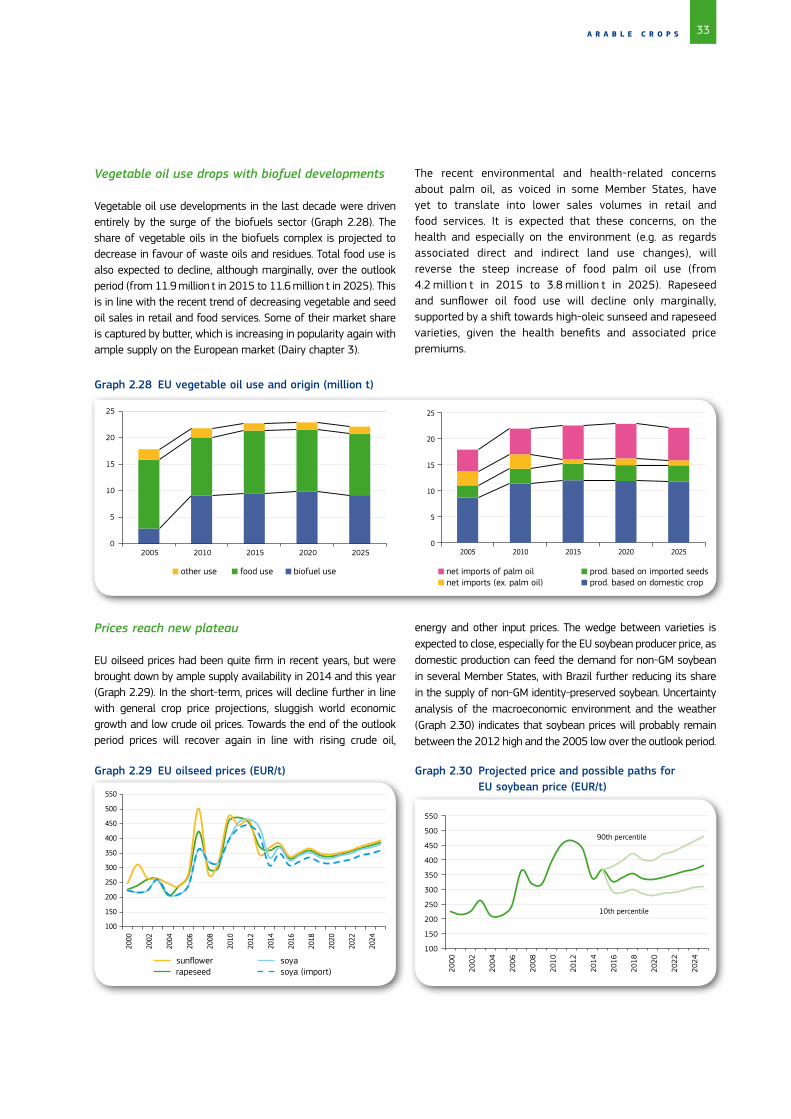
33A R A B L E C R O P S
Vegetable oil use drops with biofuel developments
Vegetable oil use developments in the last decade were driven entirely by the surge of the biofuels sector (Graph 2.28). The share of vegetable oils in the biofuels complex is projected to decrease in favour of waste oils and residues. Total food use is also expected to decline, although marginally, over the outlook period (from 11.9 million t in 2015 to 11.6 million t in 2025). This is in line with the recent trend of decreasing vegetable and seed oil sales in retail and food services. Some of their market share is captured by butter, which is increasing in popularity again with ample supply on the European market (Dairy chapter 3).
The recent environmental and health-related concerns about palm oil, as voiced in some Member States, have yet to translate into lower sales volumes in retail and food services. It is expected that these concerns, on the health and especially on the environment (e.g. as regards associated direct and indirect land use changes), will reverse the steep increase of food palm oil use (from 4.2 million t in 2015 to 3.8 million t in 2025). Rapeseed and sunflower oil food use will decline only marginally, supported by a shift towards high-oleic sunseed and rapeseed varieties, given the health benefits and associated price premiums.
Graph 2.28 EU vegetable oil use and origin (million t)
0
5
10
15
20
25
2005 2010 2015 2020 2025 0
5
10
15
20
25
2005 2010 2015 2020 2025
other use food use biofuel use net imports of palm oil net imports (ex. palm oil)
prod. based on imported seeds prod. based on domestic crop
Prices reach new plateau
EU oilseed prices had been quite firm in recent years, but were brought down by ample supply availability in 2014 and this year (Graph 2.29). In the short-term, prices will decline further in line with general crop price projections, sluggish world economic growth and low crude oil prices. Towards the end of the outlook period prices will recover again in line with rising crude oil,
Graph 2.29 EU oilseed prices (EUR/t)
sunflower rapeseed
soya soya (import)
100
150
200
250
300
350
400
450
500
550
2000
2002
2004
2006
2008
2010
2012
2014
2016
2018
2020
2022
2024
energy and other input prices. The wedge between varieties is expected to close, especially for the EU soybean producer price, as domestic production can feed the demand for non-GM soybean in several Member States, with Brazil further reducing its share in the supply of non-GM identity-preserved soybean. Uncertainty analysis of the macroeconomic environment and the weather (Graph 2.30) indicates that soybean prices will probably remain between the 2012 high and the 2005 low over the outlook period.
Graph 2.30 Projected price and possible paths for EU soybean price (EUR/t)
100
150
200
250
300
350
400
450
500
550
2000
2002
2004
2006
2008
2010
2012
2014
2016
2018
2020
2022
2024
90th percentile
10th percentile
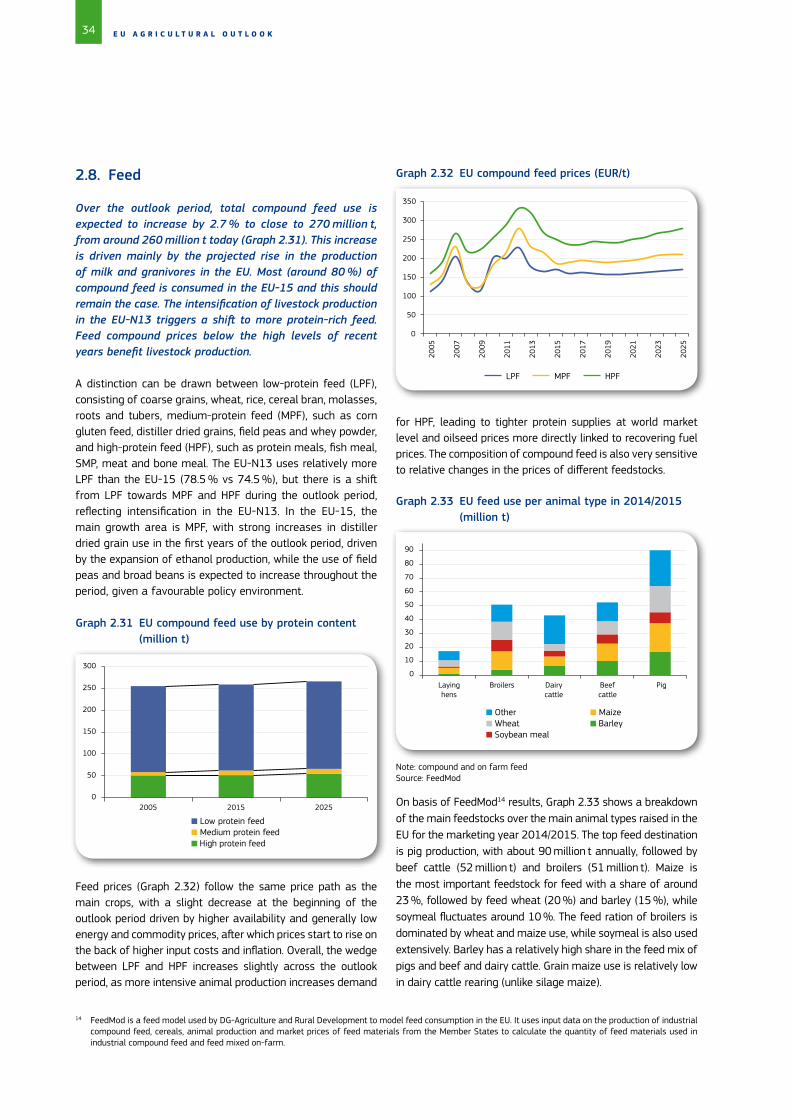
34 E U A G R I C U L T U R A L O U T L O O K
14 FeedMod is a feed model used by DG-Agriculture and Rural Development to model feed consumption in the EU. It uses input data on the production of industrial compound feed, cereals, animal production and market prices of feed materials from the Member States to calculate the quantity of feed materials used in industrial compound feed and feed mixed on-farm.
2.8. Feed
Over the outlook period, total compound feed use is expected to increase by 2.7 % to close to 270 million t, from around 260 million t today (Graph 2.31). This increase is driven mainly by the projected rise in the production of milk and granivores in the EU. Most (around 80 %) of compound feed is consumed in the EU-15 and this should remain the case. The intensification of livestock production in the EU-N13 triggers a shift to more protein-rich feed. Feed compound prices below the high levels of recent years benefit livestock production.
A distinction can be drawn between low-protein feed (LPF), consisting of coarse grains, wheat, rice, cereal bran, molasses, roots and tubers, medium-protein feed (MPF), such as corn gluten feed, distiller dried grains, field peas and whey powder, and high-protein feed (HPF), such as protein meals, fish meal, SMP, meat and bone meal. The EU-N13 uses relatively more LPF than the EU-15 (78.5 % vs 74.5 %), but there is a shift from LPF towards MPF and HPF during the outlook period, reflecting intensification in the EU-N13. In the EU-15, the main growth area is MPF, with strong increases in distiller dried grain use in the first years of the outlook period, driven by the expansion of ethanol production, while the use of field peas and broad beans is expected to increase throughout the period, given a favourable policy environment.
Graph 2.31 EU compound feed use by protein content (million t)
Low protein feed Medium protein feed High protein feed
0
50
100
150
200
250
300
2005 2015 2025
Graph 2.32 EU compound feed prices (EUR/t)
LPF MPF HPF
0
50
100
150
200
250
300
350
2005
2007
2009
2011
2013
2015
2017
2019
2021
2023
2025
Feed prices (Graph 2.32) follow the same price path as the main crops, with a slight decrease at the beginning of the outlook period driven by higher availability and generally low energy and commodity prices, after which prices start to rise on the back of higher input costs and inflation. Overall, the wedge between LPF and HPF increases slightly across the outlook period, as more intensive animal production increases demand
for HPF, leading to tighter protein supplies at world market level and oilseed prices more directly linked to recovering fuel prices. The composition of compound feed is also very sensitive to relative changes in the prices of different feedstocks.
On basis of FeedMod14 results, Graph 2.33 shows a breakdown of the main feedstocks over the main animal types raised in the EU for the marketing year 2014/2015. The top feed destination is pig production, with about 90 million t annually, followed by beef cattle (52 million t) and broilers (51 million t). Maize is the most important feedstock for feed with a share of around 23 %, followed by feed wheat (20 %) and barley (15 %), while soymeal fluctuates around 10 %. The feed ration of broilers is dominated by wheat and maize use, while soymeal is also used extensively. Barley has a relatively high share in the feed mix of pigs and beef and dairy cattle. Grain maize use is relatively low in dairy cattle rearing (unlike silage maize).
Graph 2.33 EU feed use per animal type in 2014/2015 (million t)
Other Wheat Soybean meal
Maize Barley
0
10
20
30
40
50
60
70
80
90
Layinghens
Broilers Dairycattle
Beefcattle
Pig
Note: compound and on farm feedSource: FeedMod
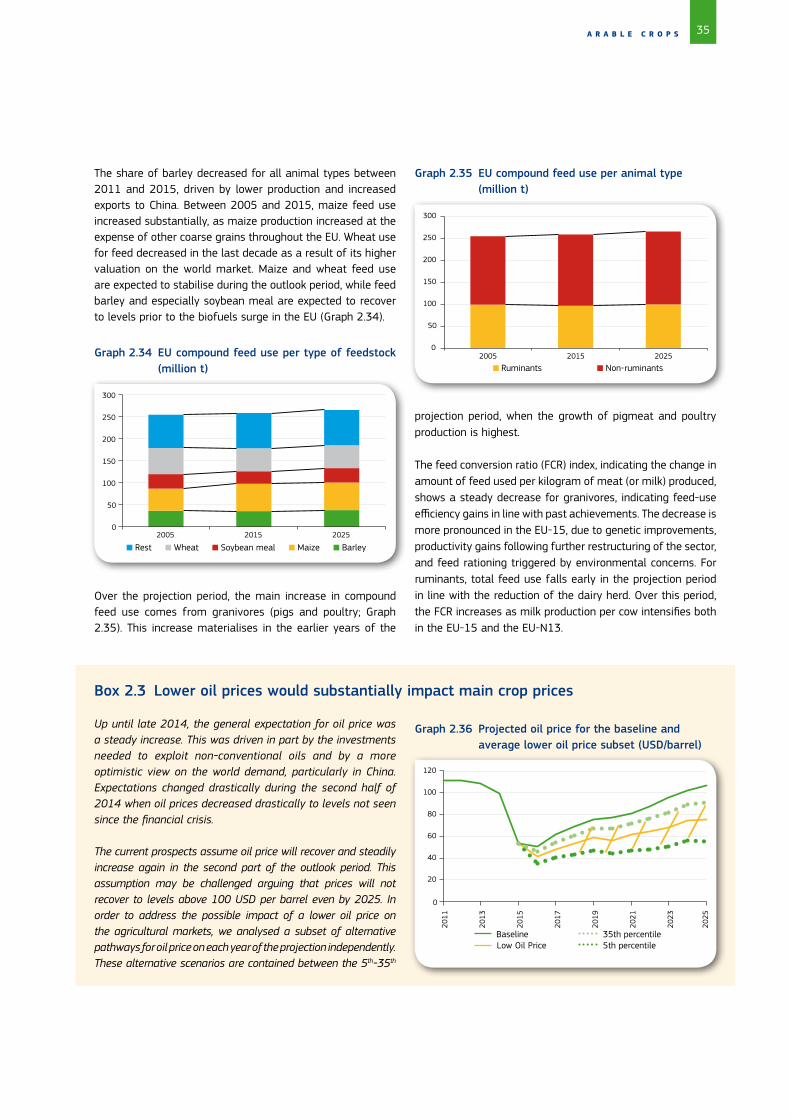
35A R A B L E C R O P S
The share of barley decreased for all animal types between 2011 and 2015, driven by lower production and increased exports to China. Between 2005 and 2015, maize feed use increased substantially, as maize production increased at the expense of other coarse grains throughout the EU. Wheat use for feed decreased in the last decade as a result of its higher valuation on the world market. Maize and wheat feed use are expected to stabilise during the outlook period, while feed barley and especially soybean meal are expected to recover to levels prior to the biofuels surge in the EU (Graph 2.34).
Over the projection period, the main increase in compound feed use comes from granivores (pigs and poultry; Graph 2.35). This increase materialises in the earlier years of the
Rest Wheat Soybean meal Maize Barley
0
50
100
150
200
250
300
2005 2015 2025
Graph 2.34 EU compound feed use per type of feedstock (million t)
projection period, when the growth of pigmeat and poultry production is highest.
The feed conversion ratio (FCR) index, indicating the change in amount of feed used per kilogram of meat (or milk) produced, shows a steady decrease for granivores, indicating feed-use efficiency gains in line with past achievements. The decrease is more pronounced in the EU-15, due to genetic improvements, productivity gains following further restructuring of the sector, and feed rationing triggered by environmental concerns. For ruminants, total feed use falls early in the projection period in line with the reduction of the dairy herd. Over this period, the FCR increases as milk production per cow intensifies both in the EU-15 and the EU-N13.
Graph 2.35 EU compound feed use per animal type (million t)
Ruminants Non-ruminants
0
50
100
150
200
250
300
2005 2015 2025
Box 2.3 Lower oil prices would substantially impact main crop prices
Up until late 2014, the general expectation for oil price was a steady increase. This was driven in part by the investments needed to exploit non-conventional oils and by a more optimistic view on the world demand, particularly in China. Expectations changed drastically during the second half of 2014 when oil prices decreased drastically to levels not seen since the financial crisis.
The current prospects assume oil price will recover and steadily increase again in the second part of the outlook period. This assumption may be challenged arguing that prices will not recover to levels above 100 USD per barrel even by 2025. In order to address the possible impact of a lower oil price on the agricultural markets, we analysed a subset of alternative pathways for oil price on each year of the projection independently. These alternative scenarios are contained between the 5th-35th
Baseline Low Oil Price
35th percentile 5th percentile
Graph 2.36 Projected oil price for the baseline and average lower oil price subset (USD/barrel)
0
20
40
60
80
100
120
2011
2013
2015
2017
2019
2021
2023
2025
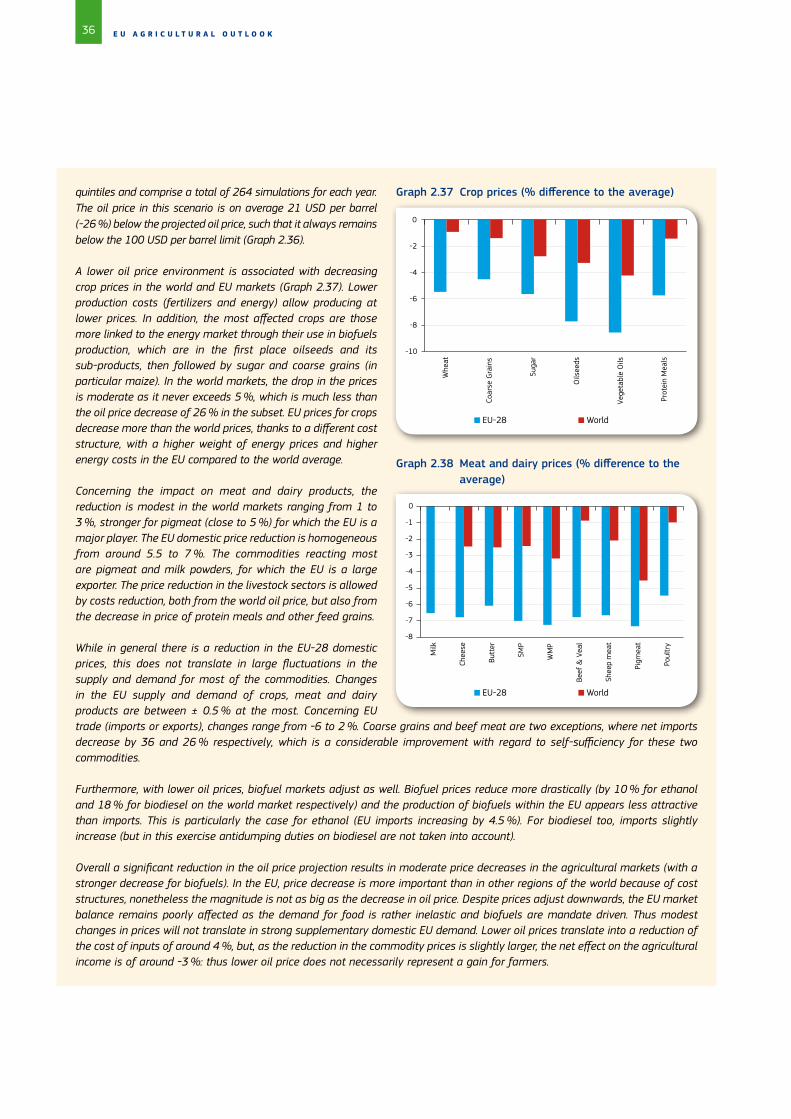
36 E U A G R I C U L T U R A L O U T L O O K
quintiles and comprise a total of 264 simulations for each year. The oil price in this scenario is on average 21 USD per barrel (-26 %) below the projected oil price, such that it always remains below the 100 USD per barrel limit (Graph 2.36).
A lower oil price environment is associated with decreasing crop prices in the world and EU markets (Graph 2.37). Lower production costs (fertilizers and energy) allow producing at lower prices. In addition, the most affected crops are those more linked to the energy market through their use in biofuels production, which are in the first place oilseeds and its sub-products, then followed by sugar and coarse grains (in particular maize). In the world markets, the drop in the prices is moderate as it never exceeds 5 %, which is much less than the oil price decrease of 26 % in the subset. EU prices for crops decrease more than the world prices, thanks to a different cost structure, with a higher weight of energy prices and higher energy costs in the EU compared to the world average.
Concerning the impact on meat and dairy products, the reduction is modest in the world markets ranging from 1 to 3 %, stronger for pigmeat (close to 5 %) for which the EU is a major player. The EU domestic price reduction is homogeneous from around 5.5 to 7 %. The commodities reacting most are pigmeat and milk powders, for which the EU is a large exporter. The price reduction in the livestock sectors is allowed by costs reduction, both from the world oil price, but also from the decrease in price of protein meals and other feed grains.
While in general there is a reduction in the EU-28 domestic prices, this does not translate in large fluctuations in the supply and demand for most of the commodities. Changes in the EU supply and demand of crops, meat and dairy products are between ± 0.5 % at the most. Concerning EU trade (imports or exports), changes range from -6 to 2 %. Coarse grains and beef meat are two exceptions, where net imports decrease by 36 and 26 % respectively, which is a considerable improvement with regard to self-sufficiency for these two commodities.
Furthermore, with lower oil prices, biofuel markets adjust as well. Biofuel prices reduce more drastically (by 10 % for ethanol and 18 % for biodiesel on the world market respectively) and the production of biofuels within the EU appears less attractive than imports. This is particularly the case for ethanol (EU imports increasing by 4.5 %). For biodiesel too, imports slightly increase (but in this exercise antidumping duties on biodiesel are not taken into account).
Overall a significant reduction in the oil price projection results in moderate price decreases in the agricultural markets (with a stronger decrease for biofuels). In the EU, price decrease is more important than in other regions of the world because of cost structures, nonetheless the magnitude is not as big as the decrease in oil price. Despite prices adjust downwards, the EU market balance remains poorly affected as the demand for food is rather inelastic and biofuels are mandate driven. Thus modest changes in prices will not translate in strong supplementary domestic EU demand. Lower oil prices translate into a reduction of the cost of inputs of around 4 %, but, as the reduction in the commodity prices is slightly larger, the net effect on the agricultural income is of around -3 %: thus lower oil price does not necessarily represent a gain for farmers.
EU-28 World
-10
-8
-6
-4
-2
0
Whe
at
Coar
se G
rain
s
Suga
r
Oils
eeds
Vege
tabl
e O
ils
Prot
ein
Mea
ls
-8
-7
-6
-5
-4
-3
-2
-1
0
Milk
Chee
se
Butt
er
SMP
WM
P
Beef
& V
eal
Shee
p m
eat
Pigm
eat
Poul
try
EU-28 World
Graph 2.37 Crop prices (% difference to the average)
Graph 2.38 Meat and dairy prices (% difference to the average)
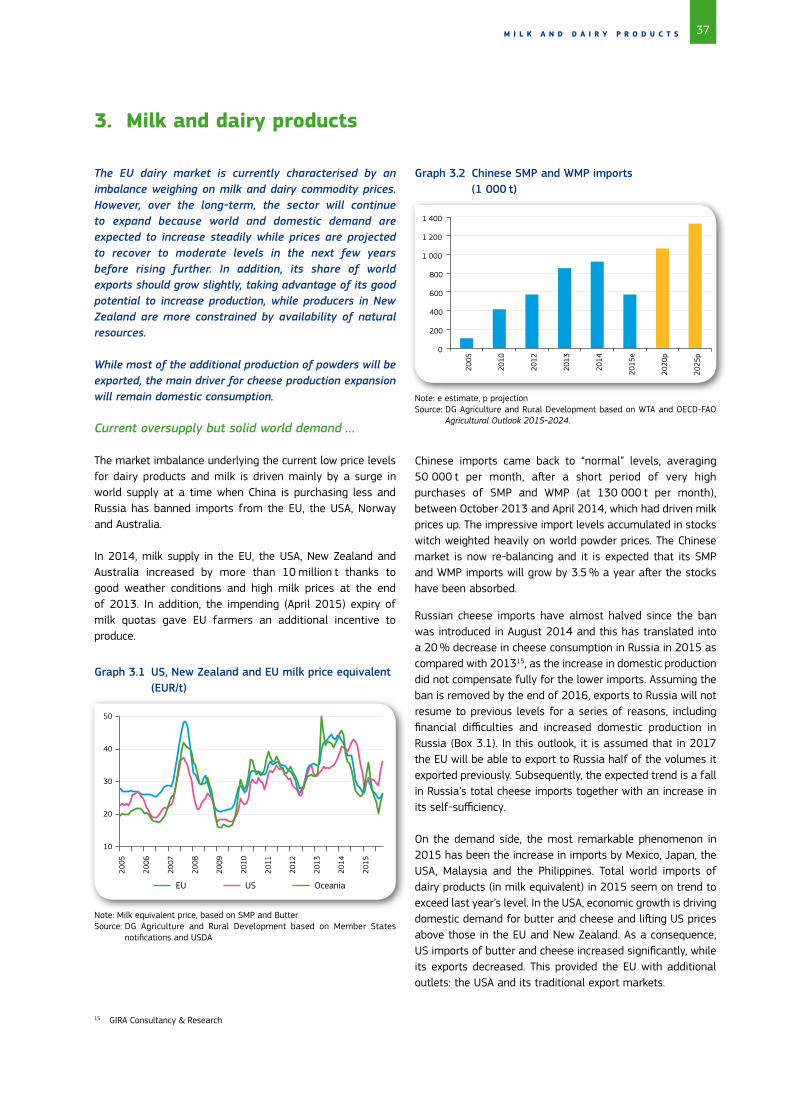
37
15 GIRA Consultancy & Research
M I L K A N D D A I R Y P R O D U C T S
Graph 3.1 US, New Zealand and EU milk price equivalent (EUR/t)
Graph 3.2 Chinese SMP and WMP imports (1 000 t)
EU US Oceania
10
20
30
40
50
2005
2006
2007
2008
2009
2010
2011
2012
2013
2014
2015
0
200
400
600
800
1 000
1 200
1 400
2005
2010
2012
2013
2014
2015
e
2020
p
2025
p
Note: Milk equivalent price, based on SMP and ButterSource: DG Agriculture and Rural Development based on Member States
notifications and USDA
Note: e estimate, p projectionSource: DG Agriculture and Rural Development based on WTA and OECD-FAO
Agricultural Outlook 2015-2024.
The EU dairy market is currently characterised by an imbalance weighing on milk and dairy commodity prices. However, over the long-term, the sector will continue to expand because world and domestic demand are expected to increase steadily while prices are projected to recover to moderate levels in the next few years before rising further. In addition, its share of world exports should grow slightly, taking advantage of its good potential to increase production, while producers in New Zealand are more constrained by availability of natural resources.
While most of the additional production of powders will be exported, the main driver for cheese production expansion will remain domestic consumption.
Current oversupply but solid world demand …
The market imbalance underlying the current low price levels for dairy products and milk is driven mainly by a surge in world supply at a time when China is purchasing less and Russia has banned imports from the EU, the USA, Norway and Australia.
In 2014, milk supply in the EU, the USA, New Zealand and Australia increased by more than 10 million t thanks to good weather conditions and high milk prices at the end of 2013. In addition, the impending (April 2015) expiry of milk quotas gave EU farmers an additional incentive to produce.
Chinese imports came back to “normal” levels, averaging 50 000 t per month, after a short period of very high purchases of SMP and WMP (at 130 000 t per month), between October 2013 and April 2014, which had driven milk prices up. The impressive import levels accumulated in stocks witch weighted heavily on world powder prices. The Chinese market is now re-balancing and it is expected that its SMP and WMP imports will grow by 3.5 % a year after the stocks have been absorbed.
3. Milk and dairy products
Russian cheese imports have almost halved since the ban was introduced in August 2014 and this has translated into a 20 % decrease in cheese consumption in Russia in 2015 as compared with 201315, as the increase in domestic production did not compensate fully for the lower imports. Assuming the ban is removed by the end of 2016, exports to Russia will not resume to previous levels for a series of reasons, including financial difficulties and increased domestic production in Russia (Box 3.1). In this outlook, it is assumed that in 2017 the EU will be able to export to Russia half of the volumes it exported previously. Subsequently, the expected trend is a fall in Russia’s total cheese imports together with an increase in its self-sufficiency.
On the demand side, the most remarkable phenomenon in 2015 has been the increase in imports by Mexico, Japan, the USA, Malaysia and the Philippines. Total world imports of dairy products (in milk equivalent) in 2015 seem on trend to exceed last year’s level. In the USA, economic growth is driving domestic demand for butter and cheese and lifting US prices above those in the EU and New Zealand. As a consequence, US imports of butter and cheese increased significantly, while its exports decreased. This provided the EU with additional outlets: the USA and its traditional export markets.
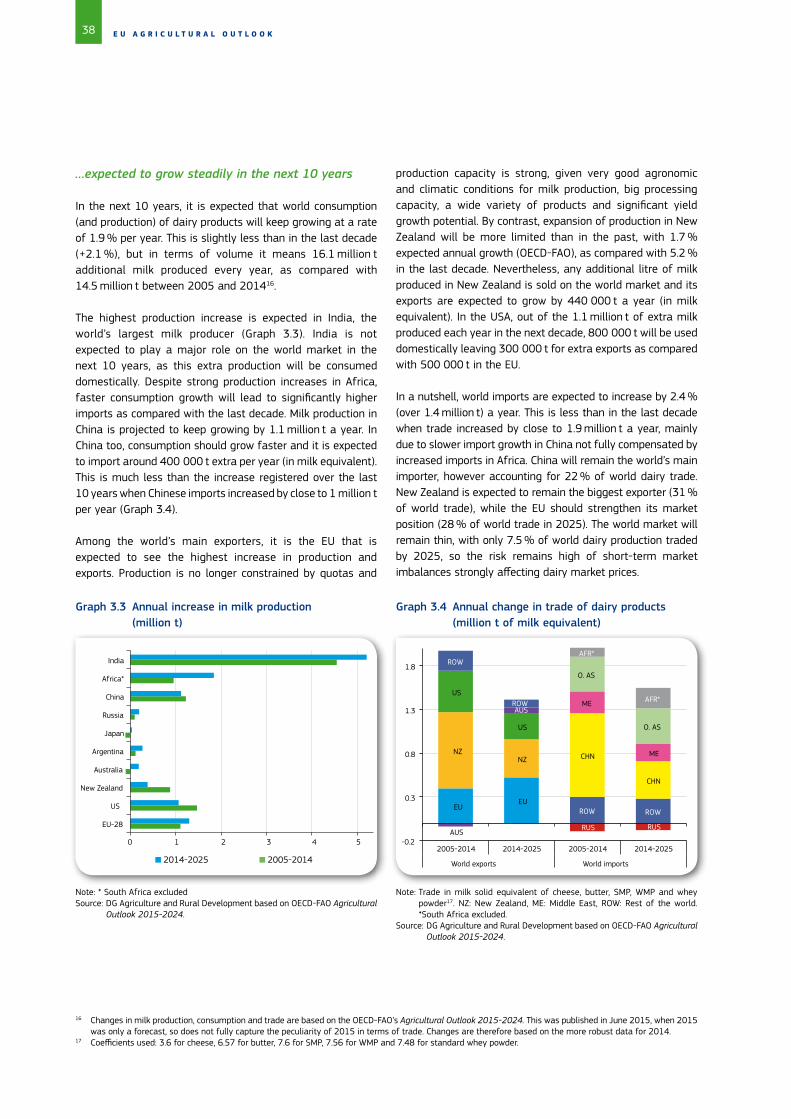
38 E U A G R I C U L T U R A L O U T L O O K
16 Changes in milk production, consumption and trade are based on the OECD-FAO’s Agricultural Outlook 2015-2024. This was published in June 2015, when 2015 was only a forecast, so does not fully capture the peculiarity of 2015 in terms of trade. Changes are therefore based on the more robust data for 2014.
17 Coefficients used: 3.6 for cheese, 6.57 for butter, 7.6 for SMP, 7.56 for WMP and 7.48 for standard whey powder.
…expected to grow steadily in the next 10 years
In the next 10 years, it is expected that world consumption (and production) of dairy products will keep growing at a rate of 1.9 % per year. This is slightly less than in the last decade (+2.1 %), but in terms of volume it means 16.1 million t additional milk produced every year, as compared with 14.5 million t between 2005 and 201416.
The highest production increase is expected in India, the world’s largest milk producer (Graph 3.3). India is not expected to play a major role on the world market in the next 10 years, as this extra production will be consumed domestically. Despite strong production increases in Africa, faster consumption growth will lead to significantly higher imports as compared with the last decade. Milk production in China is projected to keep growing by 1.1 million t a year. In China too, consumption should grow faster and it is expected to import around 400 000 t extra per year (in milk equivalent). This is much less than the increase registered over the last 10 years when Chinese imports increased by close to 1 million t per year (Graph 3.4).
Among the world’s main exporters, it is the EU that is expected to see the highest increase in production and exports. Production is no longer constrained by quotas and
2014-2025 2005-2014
0 1 2 3 4 5
EU-28
US
New Zealand
Australia
Argentina
Japan
Russia
China
Africa*
India
EU EU
NZ NZ
US
US
AUS
AUS
ROW
ROW
ROW ROW
RUS RUS
CHN
CHN
ME
ME
O. AS
O. AS
AFR*
AFR*
-0.2
0.3
0.8
1.3
1.8
2005-2014 2014-2025 2005-2014 2014-2025
World exports World imports
Note: * South Africa excludedSource: DG Agriculture and Rural Development based on OECD-FAO Agricultural
Outlook 2015-2024.
Note: Trade in milk solid equivalent of cheese, butter, SMP, WMP and whey powder17. NZ: New Zealand, ME: Middle East, ROW: Rest of the world. *South Africa excluded.
Source: DG Agriculture and Rural Development based on OECD-FAO Agricultural Outlook 2015-2024.
Graph 3.4 Annual change in trade of dairy products (million t of milk equivalent)
Graph 3.3 Annual increase in milk production (million t)
production capacity is strong, given very good agronomic and climatic conditions for milk production, big processing capacity, a wide variety of products and significant yield growth potential. By contrast, expansion of production in New Zealand will be more limited than in the past, with 1.7 % expected annual growth (OECD-FAO), as compared with 5.2 % in the last decade. Nevertheless, any additional litre of milk produced in New Zealand is sold on the world market and its exports are expected to grow by 440 000 t a year (in milk equivalent). In the USA, out of the 1.1 million t of extra milk produced each year in the next decade, 800 000 t will be used domestically leaving 300 000 t for extra exports as compared with 500 000 t in the EU.
In a nutshell, world imports are expected to increase by 2.4 % (over 1.4 million t) a year. This is less than in the last decade when trade increased by close to 1.9 million t a year, mainly due to slower import growth in China not fully compensated by increased imports in Africa. China will remain the world’s main importer, however accounting for 22 % of world dairy trade. New Zealand is expected to remain the biggest exporter (31 % of world trade), while the EU should strengthen its market position (28 % of world trade in 2025). The world market will remain thin, with only 7.5 % of world dairy production traded by 2025, so the risk remains high of short-term market imbalances strongly affecting dairy market prices.
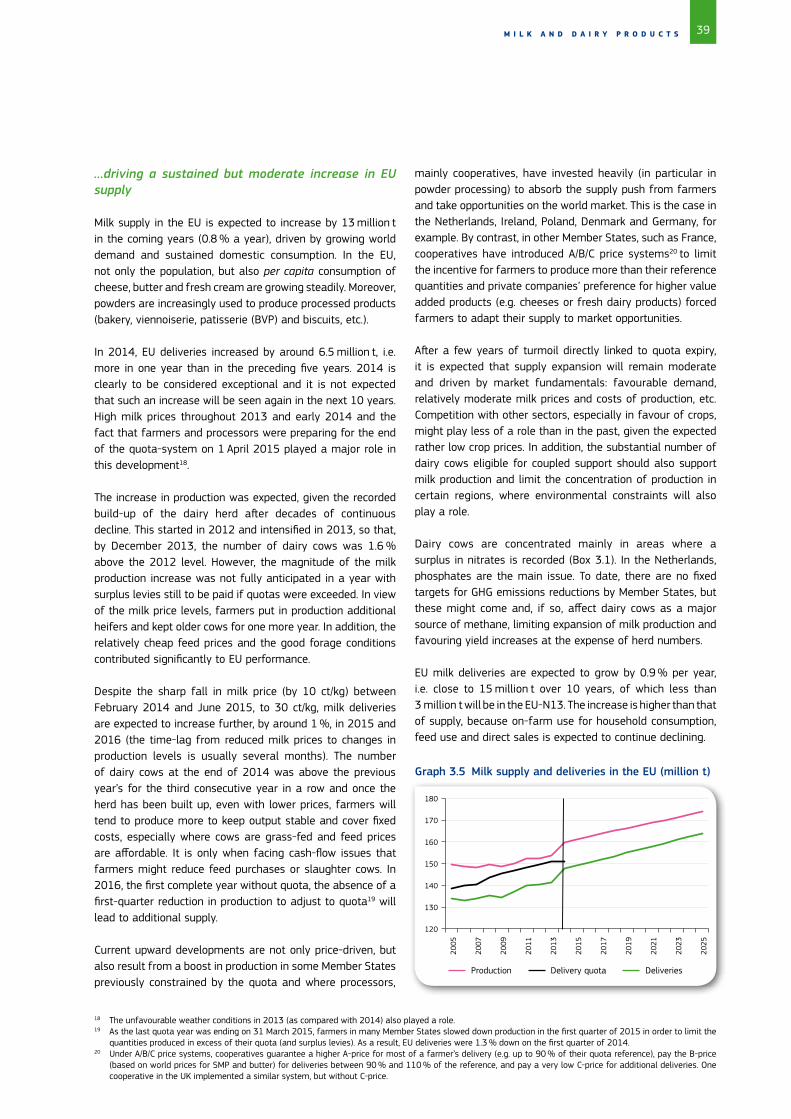
39
18 The unfavourable weather conditions in 2013 (as compared with 2014) also played a role.19 As the last quota year was ending on 31 March 2015, farmers in many Member States slowed down production in the first quarter of 2015 in order to limit the
quantities produced in excess of their quota (and surplus levies). As a result, EU deliveries were 1.3 % down on the first quarter of 2014.20 Under A/B/C price systems, cooperatives guarantee a higher A-price for most of a farmer’s delivery (e.g. up to 90 % of their quota reference), pay the B-price
(based on world prices for SMP and butter) for deliveries between 90 % and 110 % of the reference, and pay a very low C-price for additional deliveries. One cooperative in the UK implemented a similar system, but without C-price.
M I L K A N D D A I R Y P R O D U C T S
…driving a sustained but moderate increase in EU supply
Milk supply in the EU is expected to increase by 13 million t in the coming years (0.8 % a year), driven by growing world demand and sustained domestic consumption. In the EU, not only the population, but also per capita consumption of cheese, butter and fresh cream are growing steadily. Moreover, powders are increasingly used to produce processed products (bakery, viennoiserie, patisserie (BVP) and biscuits, etc.).
In 2014, EU deliveries increased by around 6.5 million t, i.e. more in one year than in the preceding five years. 2014 is clearly to be considered exceptional and it is not expected that such an increase will be seen again in the next 10 years. High milk prices throughout 2013 and early 2014 and the fact that farmers and processors were preparing for the end of the quota-system on 1 April 2015 played a major role in this development18.
The increase in production was expected, given the recorded build-up of the dairy herd after decades of continuous decline. This started in 2012 and intensified in 2013, so that, by December 2013, the number of dairy cows was 1.6 % above the 2012 level. However, the magnitude of the milk production increase was not fully anticipated in a year with surplus levies still to be paid if quotas were exceeded. In view of the milk price levels, farmers put in production additional heifers and kept older cows for one more year. In addition, the relatively cheap feed prices and the good forage conditions contributed significantly to EU performance.
Despite the sharp fall in milk price (by 10 ct/kg) between February 2014 and June 2015, to 30 ct/kg, milk deliveries are expected to increase further, by around 1 %, in 2015 and 2016 (the time-lag from reduced milk prices to changes in production levels is usually several months). The number of dairy cows at the end of 2014 was above the previous year’s for the third consecutive year in a row and once the herd has been built up, even with lower prices, farmers will tend to produce more to keep output stable and cover fixed costs, especially where cows are grass-fed and feed prices are affordable. It is only when facing cash-flow issues that farmers might reduce feed purchases or slaughter cows. In 2016, the first complete year without quota, the absence of a first-quarter reduction in production to adjust to quota19 will lead to additional supply.
Current upward developments are not only price-driven, but also result from a boost in production in some Member States previously constrained by the quota and where processors,
mainly cooperatives, have invested heavily (in particular in powder processing) to absorb the supply push from farmers and take opportunities on the world market. This is the case in the Netherlands, Ireland, Poland, Denmark and Germany, for example. By contrast, in other Member States, such as France, cooperatives have introduced A/B/C price systems20 to limit the incentive for farmers to produce more than their reference quantities and private companies’ preference for higher value added products (e.g. cheeses or fresh dairy products) forced farmers to adapt their supply to market opportunities.
After a few years of turmoil directly linked to quota expiry, it is expected that supply expansion will remain moderate and driven by market fundamentals: favourable demand, relatively moderate milk prices and costs of production, etc. Competition with other sectors, especially in favour of crops, might play less of a role than in the past, given the expected rather low crop prices. In addition, the substantial number of dairy cows eligible for coupled support should also support milk production and limit the concentration of production in certain regions, where environmental constraints will also play a role.
Dairy cows are concentrated mainly in areas where a surplus in nitrates is recorded (Box 3.1). In the Netherlands, phosphates are the main issue. To date, there are no fixed targets for GHG emissions reductions by Member States, but these might come and, if so, affect dairy cows as a major source of methane, limiting expansion of milk production and favouring yield increases at the expense of herd numbers.
EU milk deliveries are expected to grow by 0.9 % per year, i.e. close to 15 million t over 10 years, of which less than 3 million t will be in the EU-N13. The increase is higher than that of supply, because on-farm use for household consumption, feed use and direct sales is expected to continue declining.
120
130
140
150
160
170
180
2005
2007
2009
2011
2013
2015
2017
2019
2021
2023
2025
Production Delivery quota Deliveries
Graph 3.5 Milk supply and deliveries in the EU (million t)

40 E U A G R I C U L T U R A L O U T L O O K
Box 3.1 Greenhouse gases (GHG) emission and environmental impact for the EU dairy sector by 2025
The European dairy outlook is relatively positive, with an increase of the milk production in most of the Member States. The question whether such increases contribute to amplify greenhouse gas (GHG) emissions and environmental pressure are therefore worth being explored.
An assessment of changes in GHG emissions linked to the EU dairy prospects has been carried out with the CAPRI model21. The version used is calibrated to the trends of last year’s EU Outlook. Graph 3.7 shows that by 2025, European cattle will account for around 50 % of total agriculture GHG emissions22 in the EU-28, while the emissions from the dairy sector alone (including dairy cows, heifers and calves) will be responsible for around 30 %. The large share of cattle in the total emissions from agriculture is due to the different warming potential of individual gases23.
21 Britz and Witzke (2014). CAPRI Model Documentation 2014. http://www.capri-model.org/docs/capri_documentation.pdf . 22 Total GHG emissions for agriculture in CAPRI can divert from official inventories. This is due to differences in input data (e.g. different animal numbers) and
calculation method. CAPRI emissions include the main GHG emissions produced by agriculture (N2O and methane CH4) in t of CO2 equivalent, taking into account their respective global warming potential, but do not include agriculture related carbon dioxide (CO2) emissions and removals.
23 CO2 is used as reference (i.e. value of 1), methane has a value of 34 and nitrous oxide a value of 298 at a hundred years’ time horizon.24 Emissions from manure are assigned to cattle, not to pasture, nor to arable land. Emissions from arable land and pasture come mainly from crop residues and
mineral fertilizers, as well as from histosols, runoff and leaching, ammonia volatilisation.
The steepest increases in deliveries are expected in Ireland, Poland, Denmark, Estonia and Latvia. In Germany, France, the UK and the Netherlands, deliveries should follow the EU average. These nine countries are projected to account for 74 % of EU production in 2025, as compared with 72 % in 2015. As a result, the concentration of milk production is expected to be rather limited.
In 2015, 18 Member States implemented VCS for dairy farmers, for a total of EUR 825 million in 2015. Those that chose not to do so for the dairy sector include major dairy producers accounting for 45 % of the EU dairy herd: Germany, the UK,
Denmark, Ireland, the Netherlands, Austria, Belgium (Flanders), Luxembourg, Sweden, Greece and Cyprus. Nevertheless, around 50 % of the EU dairy cows should be eligible for VCS in the other Member States, which is expected to help keep farmers in business in less profitable areas. Investments in processing capacity and on farms are also key and could help reverse production trends from negative to positive, e.g. in the UK, the Czech Republic, Slovakia and Hungary. By contrast, deliveries are expected to decrease in Finland, Sweden and Greece. In these countries, milk production increased in 2014 on the back of the high prices, but it is expected to return to a downward path in a lower price environment.
In the EU-N13, a greater proportion of the milk produced is expected to be delivered to dairies (80 % in 2025 as against 73 % in 2015). In addition, substantial productivity gains are expected: the milk yield is set to increase by 2.5 % a year to 6 460 kg/cow in 2025. The number of dairy cows is therefore expected to fall by 1.9 % a year, slightly less than in the last 10 years.
In the EU-15, yield is expected to grow slightly faster than in the last decade, to 8 400 kg/cow in 2025 (+1.4 % a year). Several factors will play a role, including genetics, more wide spread use of robots, better management of pastures and a higher proportion of concentrates in cows’ diets. The number of dairy cows could therefore decrease by 0.5 % a year (accounting also for the fact that, in a post-quota environment, herds might not be fully taken over when farmers leave the sector).
-3
-2
-1
0
1
2
3
Prod. Del. Cows Yield Prod. Del. Cows Yield
EU-15 EU-N13
2005-2015 2015-2025
Graph 3.7 Share of GHG emissions (CO2 equivalents) per agricultural activity in 202524
Graph 3.6 Comparison of the projections in the EU-15 and EU-N13 (%)
Cattle,50%
Sheep and goats,
5%
Pigs,10%
Poultry,3%
Arable land,22%
Pasture,10%
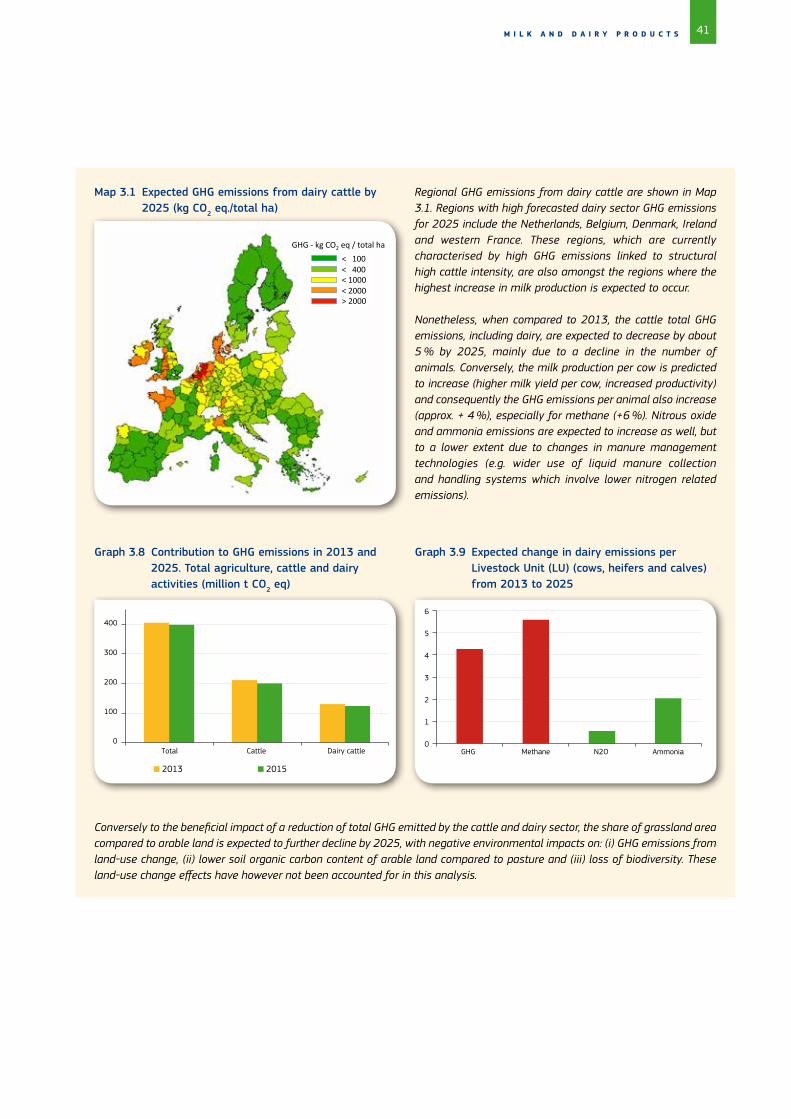
41
Regional GHG emissions from dairy cattle are shown in Map 3.1. Regions with high forecasted dairy sector GHG emissions for 2025 include the Netherlands, Belgium, Denmark, Ireland and western France. These regions, which are currently characterised by high GHG emissions linked to structural high cattle intensity, are also amongst the regions where the highest increase in milk production is expected to occur.
Nonetheless, when compared to 2013, the cattle total GHG emissions, including dairy, are expected to decrease by about 5 % by 2025, mainly due to a decline in the number of animals. Conversely, the milk production per cow is predicted to increase (higher milk yield per cow, increased productivity) and consequently the GHG emissions per animal also increase (approx. + 4 %), especially for methane (+6 %). Nitrous oxide and ammonia emissions are expected to increase as well, but to a lower extent due to changes in manure management technologies (e.g. wider use of liquid manure collection and handling systems which involve lower nitrogen related emissions).
M I L K A N D D A I R Y P R O D U C T S
Map 3.1 Expected GHG emissions from dairy cattle by 2025 (kg CO2 eq./total ha)
< 100 < 400 < 1000 < 2000 > 2000
GHG -‐ kg CO2 eq / total ha
2013 2015
Graph 3.8 Contribution to GHG emissions in 2013 and 2025. Total agriculture, cattle and dairy activities (million t CO2 eq)
Graph 3.9 Expected change in dairy emissions per Livestock Unit (LU) (cows, heifers and calves) from 2013 to 2025
0
100
200
300
400
Total Cattle Dairy cattle 0
1
2
3
4
5
6
GHG Methane N2O Ammonia
Conversely to the beneficial impact of a reduction of total GHG emitted by the cattle and dairy sector, the share of grassland area compared to arable land is expected to further decline by 2025, with negative environmental impacts on: (i) GHG emissions from land-use change, (ii) lower soil organic carbon content of arable land compared to pasture and (iii) loss of biodiversity. These land-use change effects have however not been accounted for in this analysis.

42 E U A G R I C U L T U R A L O U T L O O K
25 Nitrogen balance includes all input source (mineral fertilisers, organic N (manure), crop residues, N fixation and N deposition from the air), minus N outputs. It is not directly comparable to the nitrate directive, which sets a maximum of 170 kg/ha for N input from manure (i.e. organic) with some derogations in particular cases. However, the nitrogen surplus gives an indication of environmental pressures linked to N.
Environmental legislation (e.g. the Nitrate directive) aims to limit the release of nitrogen to air and water by agricultural activities. The nutrient balances calculation covers all agricultural activities (crop and animal husbandry) and the result for nitrogen in 2025 is presented in Figure 5. It shows high surplus in regions commonly with intensive milk and/or pig production (N surplus greater than 160kg/ha in the Netherlands, Belgium, Lombardy, Catalonia) and to a lower extent in Denmark, southern Ireland and Britany. The balance between the efficiency gains in milk production (feed and yield) and the expected growth of milk production in these regions may further increase or decrease the nitrogen pressure on the environment.
Map 3.2 Expected total nitrogen (N) surplus in 202525 (kg/ha)
Prices lower than anticipated in the short-term …
The average EU SMP price reached intervention level in August 2015 while EU butter prices remained 30 % above. This highlights the sustained dynamic demand for dairy fat domestically but also in world markets (especially in the USA). By contrast, the need to channel additional milk into SMP and butter to compensate for the loss of the Russian outlet, combined with lower SMP import demand in Algeria and China, translated into a sharper fall in SMP price levels. The decrease in commodity prices led to an average EU milk price slightly above 30 ct/kg in 2015, i.e. around 20 % below that in 2014, with noticeable differences between Member States (prices were down by around 30 % in the Baltic countries, but only 15 % in Italy, France or Poland).
Against this difficult situation on the market, and in particular farmers’ financial difficulties in the dairy and pigmeat sectors, a EUR 500 million solidarity package for farmers was adopted in October 2015. Member States are given large flexibility to use national envelopes totalling EUR 420 million for the direct benefit of milk and pig producers and may complement this aid with national funds.
In 2016, commodity prices are expected to recover only slowly from the current lows, because world supply is
expected to continue growing and stocks have accumulated. The expected decrease in production in New Zealand, driven by unfavourable weather conditions and very low prices paid to farmers, might help prices to pick up faster. Given that it takes two to three months between changes in commodity prices feed into changes in the price for raw milk, the EU milk price is not expected to increase significantly in 2016.
…but set to increase by the end of the projection period
Over the medium term, dairy fat is expected to remain well valorised and butter and cheese prices are expected to rise to around EUR 3 800/t in 2025. SMP prices can only increase from 2015’s bottom (intervention) price and could average EUR 2 500/t by the end of the projection period.
Until 2020, the average EU milk price is expected to oscillate between 32 ct/kg and 33 ct/kg. This projection is lower than last year’s but energy and feed costs are also expected to be lower. After 2021, the milk price is expected to increase, along with dairy commodity prices, the oil price and feed costs.
Since 2007, EU milk and dairy commodity prices have fluctuated significantly within and between years. Such
N surplus total kg/ha (2025)
N surplus per UAA ha -‐ 2025
< 40 < 80 < 120 < 160 > 160
N surplus – kg/ha

43M I L K A N D D A I R Y P R O D U C T S
Projected level and possible paths for:
Graph 3.10 EU farm-gate milk price, real fat content (EUR ct/kg)
Graph 3.11 EU SMP price (EUR/t)
15
20
25
30
35
40
45
2005
2007
2009
2011
2013
2015
2017
2019
2021
2023
2025
EU raw milk price
10th percentile
90th percentile
Support price equivalent
1 500
2 000
2 500
3 000
3 500
2005
2007
2009
2011
2013
2015
2017
2019
2021
2023
2025
EU 10th percentile
90th percentile
Intervention
World
variations will continue over the next 10 years, in response to impacts of weather on production, changes in energy prices and exchange rates, animal health issues, etc. Graph 3.10
and Graph 3.11 present the potential development of EU milk and SMP prices, accounting for weather uncertainty and alternative macroeconomic scenarios.
A cheese market supported primarily by domestic demand
When looking at future developments, we should bear in mind the recent exceptional events. In 2014 and 2015, the introduction of the Russian import ban led EU processors to channel additional milk into SMP and butter, instead of cheese. Combined with the increase in milk supply, this led to very large availabilities of butter and SMP, bigger stocks and strong exports supported by low prices and a competitive euro against the US dollar.
0.0
0.5
1.0
1.5
2.0
2.5
3.0
3.5
4.0
4.5
Prod. Exp. Prod. Exp. Prod. Exp. Prod. Exp. Prod. Exp. Prod. Exp. Cheese Butter SMP WMP Whey FDP
Cheese production is expected to increase by 1.15 million t in the next decade, to 11.2 million t by 2025. Although a slightly higher proportion is expected to be exported over the outlook period, this will still account for less than 10 % of production in 2025, highlighting the importance of the domestic market. Per capita consumption is increasing driven, by an improved economic situation but also by clear consumer preferences.
Industrial use, the most dynamic sector, is absorbing 35 % of the cheese produced in the EU. More and more cheese is used to prepare sandwiches, but also pizzas and various preparations. In the last 10 years, per capita consumption increased by 1 kg in the EU-15, to reach 19.8 kg in 2015 (Graph 3.13). In the next decade, it could increase by a further 0.8 kg. In the EU-N13, consumption levels are much lower, at 13.2 kg per capita in 2015 but they increased by close to 3 kg in the last 10 years. By 2025, cheese consumption is projected to increase further to 16 kg per capita in the EU-N13.
Note: Milk equivalent total solids coefficients used: 1 for FDP, 3.6 for cheese, 6.57 for butter, 7.6 for SMP, 7.56 for WMP and 7.48 for whey.
Cheese exports have been clearly affected by the introduction of the Russian ban, as Russia was the EU’s main customer for cheese, accounting for over 30 % of its exports. Nevertheless, EU traders have been very successful in directing a significant proportion of exports to other destinations (mainly the USA, Japan and South Korea) and 2015 cheese exports are expected to be close to 700 000 t, only 13 % below the 2013 level.
Graph 3.12 Increases in production and exports of dairy commodities in the next 10 years (2025 vs. 2015, in million t of milk equivalent)
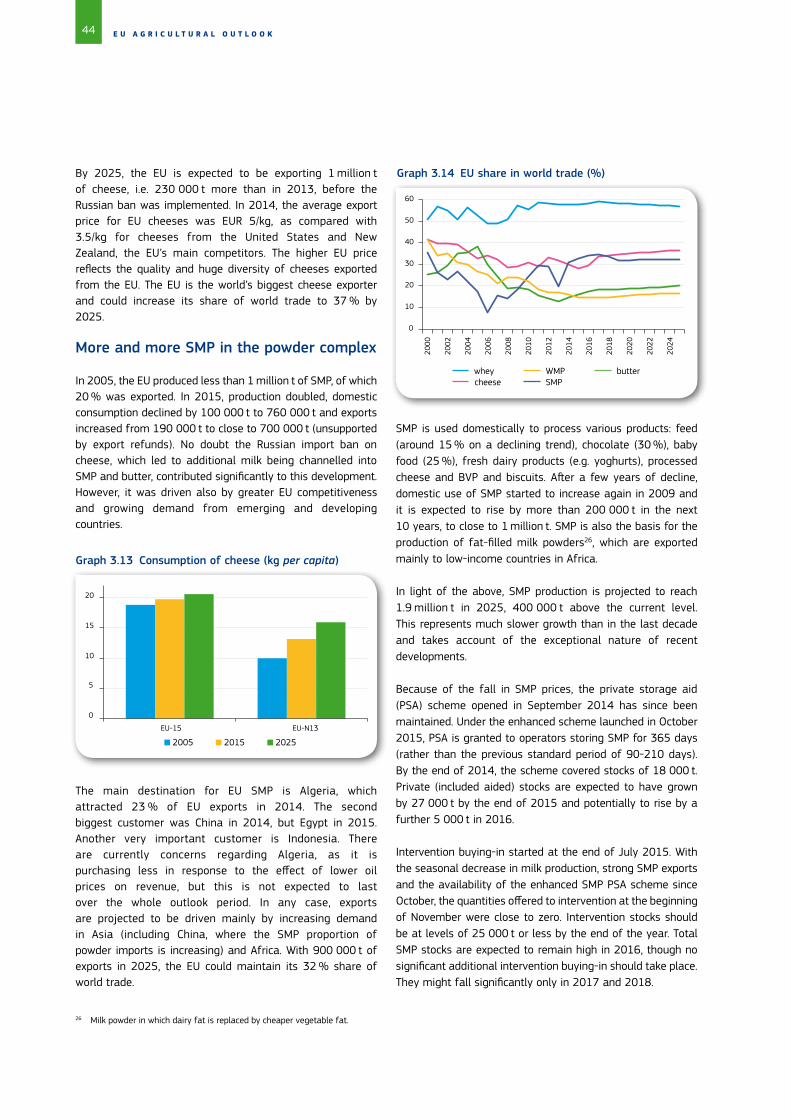
44 E U A G R I C U L T U R A L O U T L O O K
26 Milk powder in which dairy fat is replaced by cheaper vegetable fat.
By 2025, the EU is expected to be exporting 1 million t of cheese, i.e. 230 000 t more than in 2013, before the Russian ban was implemented. In 2014, the average export price for EU cheeses was EUR 5/kg, as compared with 3.5/kg for cheeses from the United States and New Zealand, the EU’s main competitors. The higher EU price reflects the quality and huge diversity of cheeses exported from the EU. The EU is the world’s biggest cheese exporter and could increase its share of world trade to 37 % by 2025.
More and more SMP in the powder complex
In 2005, the EU produced less than 1 million t of SMP, of which 20 % was exported. In 2015, production doubled, domestic consumption declined by 100 000 t to 760 000 t and exports increased from 190 000 t to close to 700 000 t (unsupported by export refunds). No doubt the Russian import ban on cheese, which led to additional milk being channelled into SMP and butter, contributed significantly to this development. However, it was driven also by greater EU competitiveness and growing demand from emerging and developing countries.
2005 2015 2025
Graph 3.13 Consumption of cheese (kg per capita)
0
5
10
15
20
EU-15 EU-N13
SMP is used domestically to process various products: feed (around 15 % on a declining trend), chocolate (30 %), baby food (25 %), fresh dairy products (e.g. yoghurts), processed cheese and BVP and biscuits. After a few years of decline, domestic use of SMP started to increase again in 2009 and it is expected to rise by more than 200 000 t in the next 10 years, to close to 1 million t. SMP is also the basis for the production of fat-filled milk powders26, which are exported mainly to low-income countries in Africa.
In light of the above, SMP production is projected to reach 1.9 million t in 2025, 400 000 t above the current level. This represents much slower growth than in the last decade and takes account of the exceptional nature of recent developments.
Because of the fall in SMP prices, the private storage aid (PSA) scheme opened in September 2014 has since been maintained. Under the enhanced scheme launched in October 2015, PSA is granted to operators storing SMP for 365 days (rather than the previous standard period of 90-210 days). By the end of 2014, the scheme covered stocks of 18 000 t. Private (included aided) stocks are expected to have grown by 27 000 t by the end of 2015 and potentially to rise by a further 5 000 t in 2016.
Intervention buying-in started at the end of July 2015. With the seasonal decrease in milk production, strong SMP exports and the availability of the enhanced SMP PSA scheme since October, the quantities offered to intervention at the beginning of November were close to zero. Intervention stocks should be at levels of 25 000 t or less by the end of the year. Total SMP stocks are expected to remain high in 2016, though no significant additional intervention buying-in should take place. They might fall significantly only in 2017 and 2018.
0
10
20
30
40
50
60
2000
2002
2004
2006
2008
2010
2012
2014
2016
2018
2020
2022
2024
whey cheese
WMP SMP
butter
Graph 3.14 EU share in world trade (%)
The main destination for EU SMP is Algeria, which attracted 23 % of EU exports in 2014. The second biggest customer was China in 2014, but Egypt in 2015. Another very important customer is Indonesia. There are currently concerns regarding Algeria, as it is purchasing less in response to the effect of lower oil prices on revenue, but this is not expected to last over the whole outlook period. In any case, exports are projected to be driven mainly by increasing demand in Asia (including China, where the SMP proportion of powder imports is increasing) and Africa. With 900 000 t of exports in 2025, the EU could maintain its 32 % share of world trade.
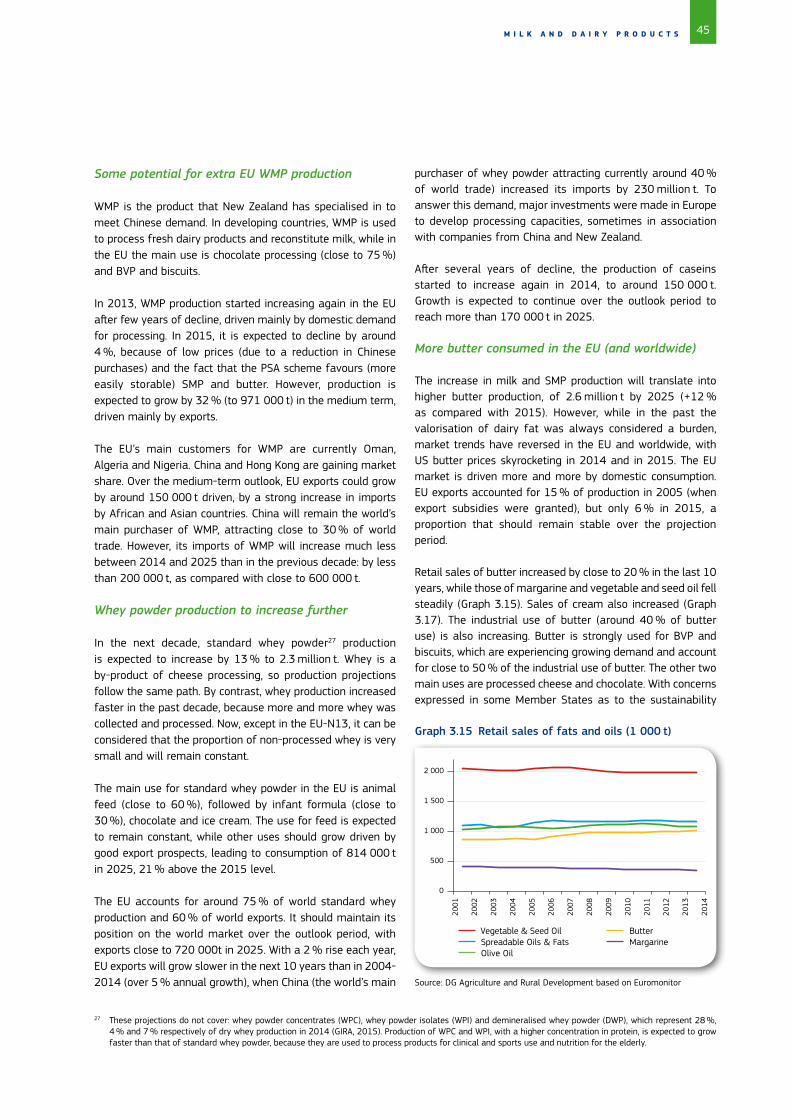
45M I L K A N D D A I R Y P R O D U C T S
purchaser of whey powder attracting currently around 40 % of world trade) increased its imports by 230 million t. To answer this demand, major investments were made in Europe to develop processing capacities, sometimes in association with companies from China and New Zealand.
After several years of decline, the production of caseins started to increase again in 2014, to around 150 000 t. Growth is expected to continue over the outlook period to reach more than 170 000 t in 2025.
More butter consumed in the EU (and worldwide)
The increase in milk and SMP production will translate into higher butter production, of 2.6 million t by 2025 (+12 % as compared with 2015). However, while in the past the valorisation of dairy fat was always considered a burden, market trends have reversed in the EU and worldwide, with US butter prices skyrocketing in 2014 and in 2015. The EU market is driven more and more by domestic consumption. EU exports accounted for 15 % of production in 2005 (when export subsidies were granted), but only 6 % in 2015, a proportion that should remain stable over the projection period.
Retail sales of butter increased by close to 20 % in the last 10 years, while those of margarine and vegetable and seed oil fell steadily (Graph 3.15). Sales of cream also increased (Graph 3.17). The industrial use of butter (around 40 % of butter use) is also increasing. Butter is strongly used for BVP and biscuits, which are experiencing growing demand and account for close to 50 % of the industrial use of butter. The other two main uses are processed cheese and chocolate. With concerns expressed in some Member States as to the sustainability
Some potential for extra EU WMP production
WMP is the product that New Zealand has specialised in to meet Chinese demand. In developing countries, WMP is used to process fresh dairy products and reconstitute milk, while in the EU the main use is chocolate processing (close to 75 %) and BVP and biscuits.
In 2013, WMP production started increasing again in the EU after few years of decline, driven mainly by domestic demand for processing. In 2015, it is expected to decline by around 4 %, because of low prices (due to a reduction in Chinese purchases) and the fact that the PSA scheme favours (more easily storable) SMP and butter. However, production is expected to grow by 32 % (to 971 000 t) in the medium term, driven mainly by exports.
The EU’s main customers for WMP are currently Oman, Algeria and Nigeria. China and Hong Kong are gaining market share. Over the medium-term outlook, EU exports could grow by around 150 000 t driven, by a strong increase in imports by African and Asian countries. China will remain the world’s main purchaser of WMP, attracting close to 30 % of world trade. However, its imports of WMP will increase much less between 2014 and 2025 than in the previous decade: by less than 200 000 t, as compared with close to 600 000 t.
Whey powder production to increase further
In the next decade, standard whey powder27 production is expected to increase by 13 % to 2.3 million t. Whey is a by-product of cheese processing, so production projections follow the same path. By contrast, whey production increased faster in the past decade, because more and more whey was collected and processed. Now, except in the EU-N13, it can be considered that the proportion of non-processed whey is very small and will remain constant.
The main use for standard whey powder in the EU is animal feed (close to 60 %), followed by infant formula (close to 30 %), chocolate and ice cream. The use for feed is expected to remain constant, while other uses should grow driven by good export prospects, leading to consumption of 814 000 t in 2025, 21 % above the 2015 level.
The EU accounts for around 75 % of world standard whey production and 60 % of world exports. It should maintain its position on the world market over the outlook period, with exports close to 720 000t in 2025. With a 2 % rise each year, EU exports will grow slower in the next 10 years than in 2004-2014 (over 5 % annual growth), when China (the world’s main
27 These projections do not cover: whey powder concentrates (WPC), whey powder isolates (WPI) and demineralised whey powder (DWP), which represent 28 %, 4 % and 7 % respectively of dry whey production in 2014 (GIRA, 2015). Production of WPC and WPI, with a higher concentration in protein, is expected to grow faster than that of standard whey powder, because they are used to process products for clinical and sports use and nutrition for the elderly.
0
500
1 000
1 500
2 000
2001
2002
2003
2004
2005
2006
2007
2008
2009
2010
2011
2012
2013
2014
Vegetable & Seed Oil Spreadable Oils & Fats Olive Oil
Butter Margarine
Graph 3.15 Retail sales of fats and oils (1 000 t)
Source: DG Agriculture and Rural Development based on Euromonitor
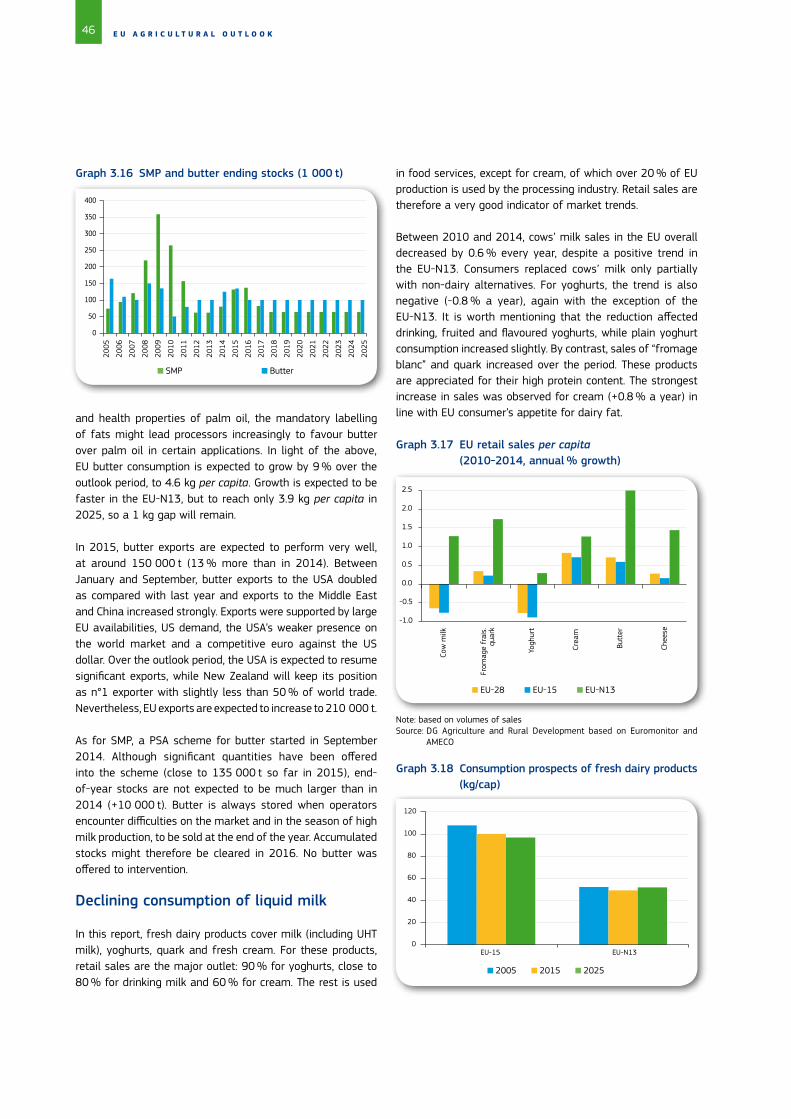
46 E U A G R I C U L T U R A L O U T L O O K
and health properties of palm oil, the mandatory labelling of fats might lead processors increasingly to favour butter over palm oil in certain applications. In light of the above, EU butter consumption is expected to grow by 9 % over the outlook period, to 4.6 kg per capita. Growth is expected to be faster in the EU-N13, but to reach only 3.9 kg per capita in 2025, so a 1 kg gap will remain.
In 2015, butter exports are expected to perform very well, at around 150 000 t (13 % more than in 2014). Between January and September, butter exports to the USA doubled as compared with last year and exports to the Middle East and China increased strongly. Exports were supported by large EU availabilities, US demand, the USA’s weaker presence on the world market and a competitive euro against the US dollar. Over the outlook period, the USA is expected to resume significant exports, while New Zealand will keep its position as n°1 exporter with slightly less than 50 % of world trade. Nevertheless, EU exports are expected to increase to 210 000 t.
As for SMP, a PSA scheme for butter started in September 2014. Although significant quantities have been offered into the scheme (close to 135 000 t so far in 2015), end-of-year stocks are not expected to be much larger than in 2014 (+10 000 t). Butter is always stored when operators encounter difficulties on the market and in the season of high milk production, to be sold at the end of the year. Accumulated stocks might therefore be cleared in 2016. No butter was offered to intervention.
Declining consumption of liquid milk
In this report, fresh dairy products cover milk (including UHT milk), yoghurts, quark and fresh cream. For these products, retail sales are the major outlet: 90 % for yoghurts, close to 80 % for drinking milk and 60 % for cream. The rest is used
in food services, except for cream, of which over 20 % of EU production is used by the processing industry. Retail sales are therefore a very good indicator of market trends.
Between 2010 and 2014, cows’ milk sales in the EU overall decreased by 0.6 % every year, despite a positive trend in the EU-N13. Consumers replaced cows’ milk only partially with non-dairy alternatives. For yoghurts, the trend is also negative (-0.8 % a year), again with the exception of the EU-N13. It is worth mentioning that the reduction affected drinking, fruited and flavoured yoghurts, while plain yoghurt consumption increased slightly. By contrast, sales of “fromage blanc” and quark increased over the period. These products are appreciated for their high protein content. The strongest increase in sales was observed for cream (+0.8 % a year) in line with EU consumer’s appetite for dairy fat.
SMP Butter
0
50
100
150
200
250
300
350
400
2005
2006
2007
2008
2009
2010
2011
2012
2013
2014
2015
2016
2017
2018
2019
2020
2021
2022
2023
2024
2025
EU-28 EU-15 EU-N13
-1.0
-0.5
0.0
0.5
1.0
1.5
2.0
2.5
Cow
milk
From
age
frai
s.
quar
k
Yogh
urt
Crea
m
Butt
er
Chee
se
Note: based on volumes of salesSource: DG Agriculture and Rural Development based on Euromonitor and
AMECO
2005 2015 2025
0
20
40
60
80
100
120
EU-15 EU-N13
Graph 3.16 SMP and butter ending stocks (1 000 t)
Graph 3.17 EU retail sales per capita (2010-2014, annual % growth)
Graph 3.18 Consumption prospects of fresh dairy products (kg/cap)
47M I L K A N D D A I R Y P R O D U C T S
However, in terms of volumes in milk equivalent, drinking milk represents the majority of fresh dairy products. This is why a 2 kg reduction in per capita consumption of fresh dairy products is projected in the next 10 years. Taking account of population growth, this will translate into a stabilisation of the total volume consumed due. Exports of fresh dairy products (mostly UHT milk) increased by close to 15 % every year in the last 10 years, from very small
volumes of around 200 000 t in 2005 to 800 000 t in 2015. Exporting liquid milk does not seem very profitable, because of the high water content and the low added value, but the market developed thanks to the availability of cheap freight to China. EU exports could develop further over the outlook period to 1.3 million t, but will remain a minor outlet (accounting for less than 3 % of EU production).
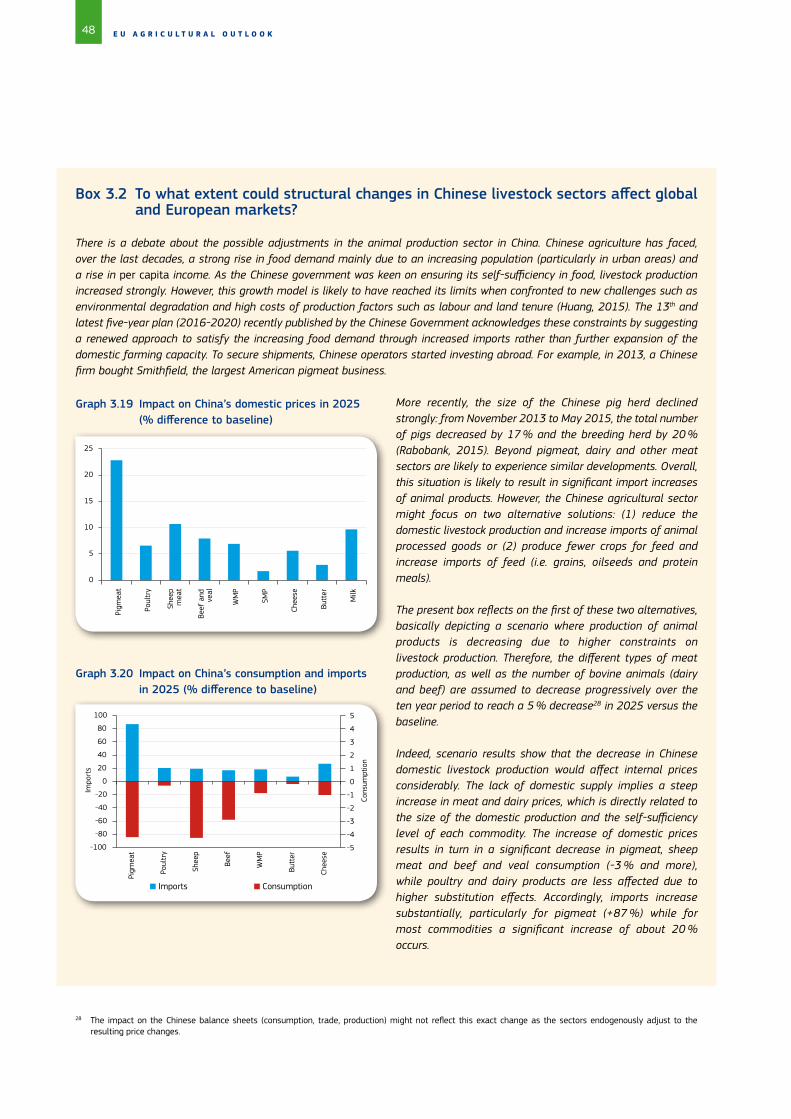
48 E U A G R I C U L T U R A L O U T L O O K
28 The impact on the Chinese balance sheets (consumption, trade, production) might not reflect this exact change as the sectors endogenously adjust to the resulting price changes.
Box 3.2 To what extent could structural changes in Chinese livestock sectors affect global and European markets?
There is a debate about the possible adjustments in the animal production sector in China. Chinese agriculture has faced, over the last decades, a strong rise in food demand mainly due to an increasing population (particularly in urban areas) and a rise in per capita income. As the Chinese government was keen on ensuring its self-sufficiency in food, livestock production increased strongly. However, this growth model is likely to have reached its limits when confronted to new challenges such as environmental degradation and high costs of production factors such as labour and land tenure (Huang, 2015). The 13th and latest five-year plan (2016-2020) recently published by the Chinese Government acknowledges these constraints by suggesting a renewed approach to satisfy the increasing food demand through increased imports rather than further expansion of the domestic farming capacity. To secure shipments, Chinese operators started investing abroad. For example, in 2013, a Chinese firm bought Smithfield, the largest American pigmeat business.
More recently, the size of the Chinese pig herd declined strongly: from November 2013 to May 2015, the total number of pigs decreased by 17 % and the breeding herd by 20 % (Rabobank, 2015). Beyond pigmeat, dairy and other meat sectors are likely to experience similar developments. Overall, this situation is likely to result in significant import increases of animal products. However, the Chinese agricultural sector might focus on two alternative solutions: (1) reduce the domestic livestock production and increase imports of animal processed goods or (2) produce fewer crops for feed and increase imports of feed (i.e. grains, oilseeds and protein meals).
The present box reflects on the first of these two alternatives, basically depicting a scenario where production of animal products is decreasing due to higher constraints on livestock production. Therefore, the different types of meat production, as well as the number of bovine animals (dairy and beef) are assumed to decrease progressively over the ten year period to reach a 5 % decrease28 in 2025 versus the baseline.
Indeed, scenario results show that the decrease in Chinese domestic livestock production would affect internal prices considerably. The lack of domestic supply implies a steep increase in meat and dairy prices, which is directly related to the size of the domestic production and the self-sufficiency level of each commodity. The increase of domestic prices results in turn in a significant decrease in pigmeat, sheep meat and beef and veal consumption (-3 % and more), while poultry and dairy products are less affected due to higher substitution effects. Accordingly, imports increase substantially, particularly for pigmeat (+87 %) while for most commodities a significant increase of about 20 % occurs.
Imports Consumption
-5
-4
-3
-2
-1
0
1
2
3
4
5
-100
-80
-60
-40
-20
0
20
40
60
80
100
Pigm
eat
Poul
try
Shee
p
Beef
WM
P
Butt
er
Chee
se
Cons
umpt
ion
Impo
rts
Graph 3.20 Impact on China’s consumption and imports in 2025 (% difference to baseline)
0
5
10
15
20
25
Pigm
eat
Poul
try
Shee
p m
eat
Beef
and
ve
al
WM
P
SMP
Chee
se
Butt
er
Milk
Graph 3.19 Impact on China’s domestic prices in 2025 (% difference to baseline)
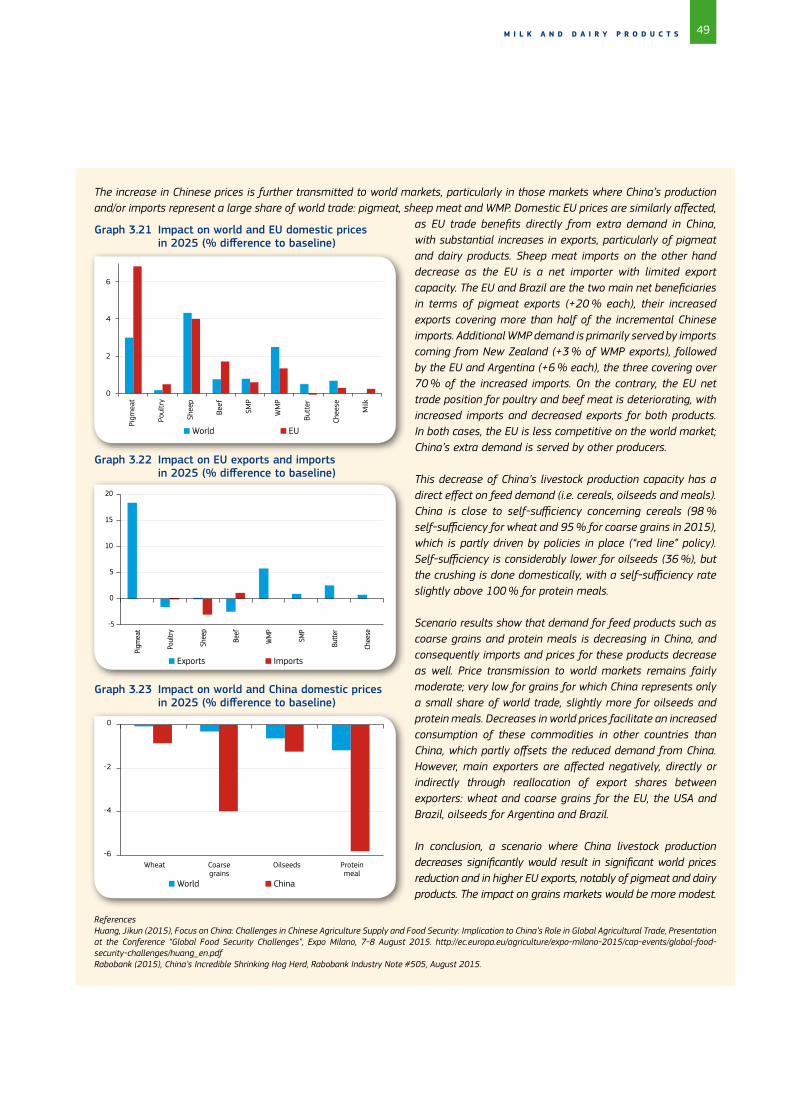
49M I L K A N D D A I R Y P R O D U C T S
The increase in Chinese prices is further transmitted to world markets, particularly in those markets where China’s production and/or imports represent a large share of world trade: pigmeat, sheep meat and WMP. Domestic EU prices are similarly affected,
as EU trade benefits directly from extra demand in China, with substantial increases in exports, particularly of pigmeat and dairy products. Sheep meat imports on the other hand decrease as the EU is a net importer with limited export capacity. The EU and Brazil are the two main net beneficiaries in terms of pigmeat exports (+20 % each), their increased exports covering more than half of the incremental Chinese imports. Additional WMP demand is primarily served by imports coming from New Zealand (+3 % of WMP exports), followed by the EU and Argentina (+6 % each), the three covering over 70 % of the increased imports. On the contrary, the EU net trade position for poultry and beef meat is deteriorating, with increased imports and decreased exports for both products. In both cases, the EU is less competitive on the world market; China’s extra demand is served by other producers.
This decrease of China’s livestock production capacity has a direct effect on feed demand (i.e. cereals, oilseeds and meals). China is close to self-sufficiency concerning cereals (98 % self-sufficiency for wheat and 95 % for coarse grains in 2015), which is partly driven by policies in place (“red line” policy). Self-sufficiency is considerably lower for oilseeds (36 %), but the crushing is done domestically, with a self-sufficiency rate slightly above 100 % for protein meals.
Scenario results show that demand for feed products such as coarse grains and protein meals is decreasing in China, and consequently imports and prices for these products decrease as well. Price transmission to world markets remains fairly moderate; very low for grains for which China represents only a small share of world trade, slightly more for oilseeds and protein meals. Decreases in world prices facilitate an increased consumption of these commodities in other countries than China, which partly offsets the reduced demand from China. However, main exporters are affected negatively, directly or indirectly through reallocation of export shares between exporters: wheat and coarse grains for the EU, the USA and Brazil, oilseeds for Argentina and Brazil.
In conclusion, a scenario where China livestock production decreases significantly would result in significant world prices reduction and in higher EU exports, notably of pigmeat and dairy products. The impact on grains markets would be more modest.
ReferencesHuang, Jikun (2015), Focus on China: Challenges in Chinese Agriculture Supply and Food Security: Implication to China’s Role in Global Agricultural Trade, Presentation at the Conference “Global Food Security Challenges”, Expo Milano, 7-8 August 2015. http://ec.europa.eu/agriculture/expo-milano-2015/cap-events/global-food-security-challenges/huang_en.pdf Rabobank (2015), China’s Incredible Shrinking Hog Herd, Rabobank Industry Note #505, August 2015.
World EU
0
2
4
6
Pigm
eat
Poul
try
Shee
p
Beef
SMP
WM
P
Butt
er
Chee
se
Milk
Graph 3.21 Impact on world and EU domestic prices in 2025 (% difference to baseline)
Exports Imports
-5
0
5
10
15
20
Pigm
eat
Poul
try
Shee
p
Beef
WM
P
SMP
Butte
r
Chee
se
Graph 3.22 Impact on EU exports and imports in 2025 (% difference to baseline)
World China
-6
-4
-2
0
Wheat Coarsegrains
Oilseeds Proteinmeal
Graph 3.23 Impact on world and China domestic prices in 2025 (% difference to baseline)
50 E U A G R I C U L T U R A L O U T L O O K

51
29 Consumption per capita is measured in retail weight. Coefficients to convert carcass weight into retail weight are 0.7 for beef and veal, 0.78 for pigmeat and 0.88 for poultry and sheep meat.
M E A T P R O D U C T S
Increasing world import demand for meat drives higher EU trade
Population and economic growth in developing countries, albeit slower than in the previous decade, are expected to support higher meat demand and contribute to growth of EU meat exports. World meat consumption is expected to increase by 1.4 % a year between 2015 and 2025, slower than in the previous decade (+2.1 %), to 358 million t. This rise is equivalent to a whole year’s total meat production in the EU.
World import demand for poultry meat is expected to increase by 4.6 million t as compared with 2015, reaching 17 million t by 2025. This represents more than the increases for beef, pigmeat and sheep and goat meat put together (2.2, 1.6 and 0.2 million t respectively). Important growing markets are located in Asia, Sub-Saharan Africa and the Middle East (mainly for poultry). In other countries, such as Russia
4. Meat products
Growth in world meat consumption is driving changes in EU meat production, which is expected to increase only slightly in the next 10 years, to 46.5 million t. Production of poultry and pigmeat is expanding slightly, notwithstanding the environmental concerns. After a few years of increase, beef production is expected to return to its declining trend in the coming years. Production of sheep and goat meat will remain relatively stable after years of decline. As EU consumption is not following production increase, the EU will export more to a challenging international market. Meat prices might face a drop in the coming years due to increased competition and relatively low feed prices in the first part of the outlook period, followed by a recovery in the second part, thanks to sustained growing demand.
Graph 4.1 EU meat production (million t) and change (%)
Source: DG Agriculture and Rural Development based on OECD-FAO Agricultural Outlook 2015-2024.
and South Korea, import demand will decrease over time, especially for poultry and pigmeat (Graph 4.2).
Graph 4.2 Changes in world imports of meat and live animals, 2025 vs. 2015 (1 000 t)
2005 2015 vs 2005
2015 2025 vs 2015
2025
-10%
-5%
0%
5%
10%
15%
20%
25%
-10
-5
0
5
10
15
20
25
Poultry Beef &veal
Pig Sheep &goat
ME
SSA
SSA
CHN
CHN
VNM
VNM
O. AS
O. AS
ROW
ROW ROW
RUS RUS
-1 000
0
1 000
2 000
3 000
4 000
5 000
Poultry Pig Beef Sheep
Note: ME: Middle East, SSA: Sub-Saharan Africa, VNM: Vietnam, CHN: China, O.AS: Other Asia, RUS: Russia, ROW: rest of the world.
Total meat consumption in the EU-N13 slowly catching up with the EU-15
In 2008-2013, consumption patterns were significantly influenced by the economic crisis, especially in the EU-N13, and meat availabilities in the EU-15. Therefore, simple trend estimates of future consumption developments based (in part) on this period may be biased in direction or magnitude. The surge in consumption in 2014 gives a first indication of the new level, but uncertainty reigns as to the timing of the next “turning” point for total meat consumption in the EU-15 or slowdown in the EU-N13.
In 2012 and 2013, lower availability, higher meat prices, the ongoing economic downturn and the resulting high unemployment rates (especially in southern European countries) caused overall meat consumption to contract by 1.5 % over the two years. Total meat consumption reached its lowest level for 11 years (64.5 kg per capita)29 in 2013. In addition, consumers turned to cheaper meats and cuts.
In 2014, by contrast, EU meat consumption recovered by a staggering 1.8 kg per capita and this trend is expected to continue in 2015, although at a slower pace. As more meat comes onto the market and the improved economic situation leaves consumers with more disposable income, lower price levels might encourage a further stabilisation of meat consumption for another year (2016), but this trend may be shortlived, with levels very soon starting to fall again.

52 E U A G R I C U L T U R A L O U T L O O K
30 The full report can be found here or at http://www.iarc.fr/en/media-centre/pr/2015/pdfs/pr240_E.pdf.
Graph 4.3 Total meat consumption in the EU in kg per capita (retail weight)
Many Member States opted for VCS in the beef sector, mainly in the form of suckler cow payments, in order to maintain the beef herd. The ceiling on the number of heads and management of the payments in the Member States will have a significant impact on the development of the herd size. Specialist cattle fatteners may not take full advantage of the coupling allowed, as the premium is linked mainly to cows and heifers; in addition, the beef sector could be affected by the internal convergence of decoupled direct payments, which could entail a change of their direct payment references. Competition with other agricultural activities, such as dairy production, is likely to reduce suckler cow herds further in certain regions.
Graph 4.4 EU dairy herd (million heads)
50
52
54
56
58
60
62
64
66
68
70
72
2000
2002
2004
2006
2008
2010
2012
2014
2016
2018
2020
2022
2024
EU-15
EU-N13
EU-28
The consumption of meat products is not expected to rise over the coming years, due to growing social concerns (animal welfare and carbon footprints), health concerns and an ageing European population (eating less meat per capita). Some of these factors serve to favour poultry over other meats. A recent (October 2015) World Health Organisation report30 raised further concerns and could have an effect on certain consumers’ behaviour. Therefore, by the end of the outlook period, per capita consumption is expected to fall to 66.7 kg (in retail weight), a similar level to that in 2008 but with a composition shifting in favour of poultry meat.
4.1. Beef and veal
After a sharp decline in 2012-2013, beef production recovered in 2014 and is expected to continue on this path in 2015-2016, benefiting from growth in the dairy and suckler cow herds, before returning to its historical downward trend, albeit declining at a slightly slower rate than in the previous decade.
The recent growth of the cattle herd brings more meat onto the market
Given that around two thirds of EU beef comes from the dairy herd, changes in the dairy sector have a major impact on beef supply. EU dairy numbers had been falling steadily for many years, mainly as a result of efficiency gains in a context of limited production under the milk quota system, but herds grew slightly between 2012 and 2014. As milk prices were high, farmers began to recapitalise the herd in anticipation of the milk quota expiry, leading to a sharp decline in beef production in 2012-2013. The growth of the dairy herd is not expected to continue, with numbers likely to fall again from 2015-2016 onwards as milk yields benefit from productivity gains.
EU-N13 EU-15
5
10
15
20
25 20
05
2006
2007
2008
2009
2010
2011
2012
2013
2014
2015
2016
2017
2018
2019
2020
2021
2022
2023
2024
2025
Graph 4.5 EU suckler cow herd (million heads)
EU-N13 EU-15
5
6
7
8
9
10
11
12
13
2005
2006
2007
2008
2009
2010
2011
2012
2013
2014
2015
2016
2017
2018
2019
2020
2021
2022
2023
2024
2025
The suckler cow herd is mainly concentrated in the EU-15 (94 % in 2014), with Ireland, Spain, France and the UK representing 71 % of the total. In these countries, the suckler cow herd is expected to fall to around 8.3 million heads by 2025 (-3 % as compared with 2014). On the other hand, the EU-N13 suckler cow herd in is likely to record a slight increase, especially in Poland and Hungary, in line with trends in the last five year (Graph 4.5).
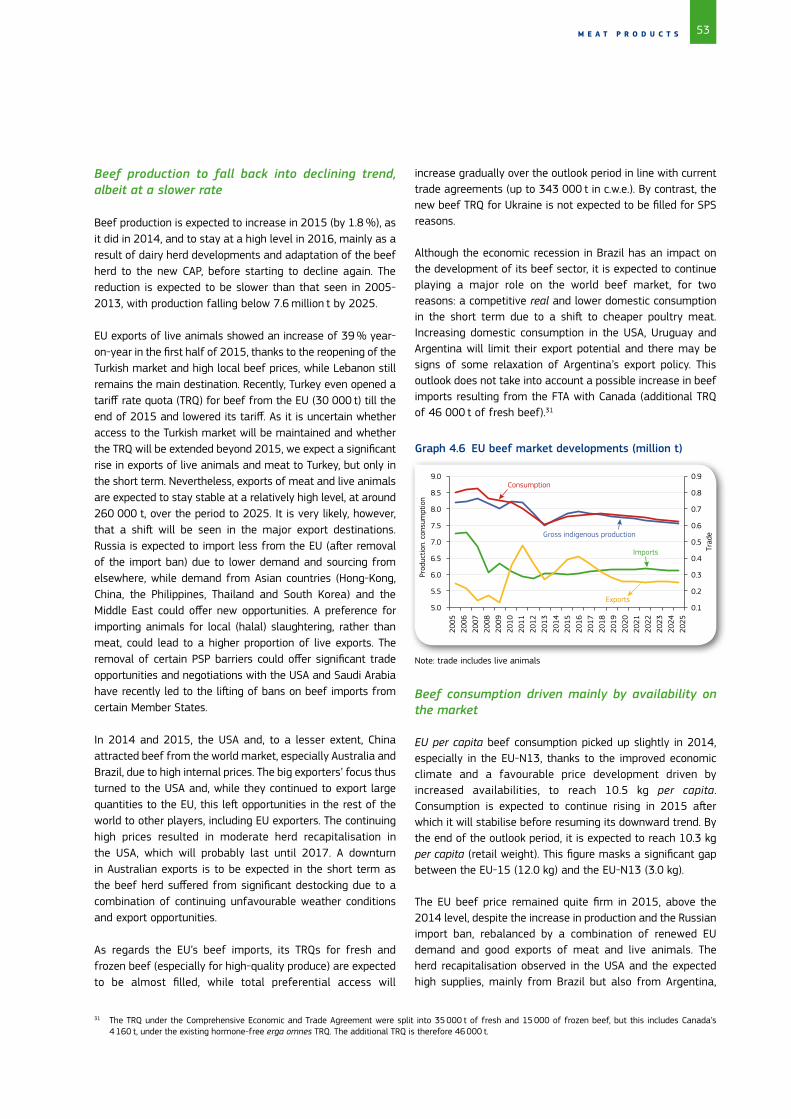
53
31 The TRQ under the Comprehensive Economic and Trade Agreement were split into 35 000 t of fresh and 15 000 of frozen beef, but this includes Canada’s 4 160 t, under the existing hormone-free erga omnes TRQ. The additional TRQ is therefore 46 000 t.
M E A T P R O D U C T S
Beef production to fall back into declining trend, albeit at a slower rate
Beef production is expected to increase in 2015 (by 1.8 %), as it did in 2014, and to stay at a high level in 2016, mainly as a result of dairy herd developments and adaptation of the beef herd to the new CAP, before starting to decline again. The reduction is expected to be slower than that seen in 2005-2013, with production falling below 7.6 million t by 2025.
EU exports of live animals showed an increase of 39 % year-on-year in the first half of 2015, thanks to the reopening of the Turkish market and high local beef prices, while Lebanon still remains the main destination. Recently, Turkey even opened a tariff rate quota (TRQ) for beef from the EU (30 000 t) till the end of 2015 and lowered its tariff. As it is uncertain whether access to the Turkish market will be maintained and whether the TRQ will be extended beyond 2015, we expect a significant rise in exports of live animals and meat to Turkey, but only in the short term. Nevertheless, exports of meat and live animals are expected to stay stable at a relatively high level, at around 260 000 t, over the period to 2025. It is very likely, however, that a shift will be seen in the major export destinations. Russia is expected to import less from the EU (after removal of the import ban) due to lower demand and sourcing from elsewhere, while demand from Asian countries (Hong-Kong, China, the Philippines, Thailand and South Korea) and the Middle East could offer new opportunities. A preference for importing animals for local (halal) slaughtering, rather than meat, could lead to a higher proportion of live exports. The removal of certain PSP barriers could offer significant trade opportunities and negotiations with the USA and Saudi Arabia have recently led to the lifting of bans on beef imports from certain Member States.
In 2014 and 2015, the USA and, to a lesser extent, China attracted beef from the world market, especially Australia and Brazil, due to high internal prices. The big exporters’ focus thus turned to the USA and, while they continued to export large quantities to the EU, this left opportunities in the rest of the world to other players, including EU exporters. The continuing high prices resulted in moderate herd recapitalisation in the USA, which will probably last until 2017. A downturn in Australian exports is to be expected in the short term as the beef herd suffered from significant destocking due to a combination of continuing unfavourable weather conditions and export opportunities.
As regards the EU’s beef imports, its TRQs for fresh and frozen beef (especially for high-quality produce) are expected to be almost filled, while total preferential access will
increase gradually over the outlook period in line with current trade agreements (up to 343 000 t in c.w.e.). By contrast, the new beef TRQ for Ukraine is not expected to be filled for SPS reasons.
Although the economic recession in Brazil has an impact on the development of its beef sector, it is expected to continue playing a major role on the world beef market, for two reasons: a competitive real and lower domestic consumption in the short term due to a shift to cheaper poultry meat. Increasing domestic consumption in the USA, Uruguay and Argentina will limit their export potential and there may be signs of some relaxation of Argentina’s export policy. This outlook does not take into account a possible increase in beef imports resulting from the FTA with Canada (additional TRQ of 46 000 t of fresh beef).31
0.1
0.2
0.3
0.4
0.5
0.6
0.7
0.8
0.9
5.0
5.5
6.0
6.5
7.0
7.5
8.0
8.5
9.0
Prod
uctio
n. c
onsu
mpt
ion
Gross indigenous production
Consumption
Imports
Exports
Trad
e
2005
20
06
2007
20
08
2009
20
10
2011
20
12
2013
20
14
2015
20
16
2017
20
18
2019
20
20
2021
20
22
2023
20
24
2025
Note: trade includes live animals
Graph 4.6 EU beef market developments (million t)
Beef consumption driven mainly by availability on the market
EU per capita beef consumption picked up slightly in 2014, especially in the EU-N13, thanks to the improved economic climate and a favourable price development driven by increased availabilities, to reach 10.5 kg per capita. Consumption is expected to continue rising in 2015 after which it will stabilise before resuming its downward trend. By the end of the outlook period, it is expected to reach 10.3 kg per capita (retail weight). This figure masks a significant gap between the EU-15 (12.0 kg) and the EU-N13 (3.0 kg).
The EU beef price remained quite firm in 2015, above the 2014 level, despite the increase in production and the Russian import ban, rebalanced by a combination of renewed EU demand and good exports of meat and live animals. The herd recapitalisation observed in the USA and the expected high supplies, mainly from Brazil but also from Argentina,
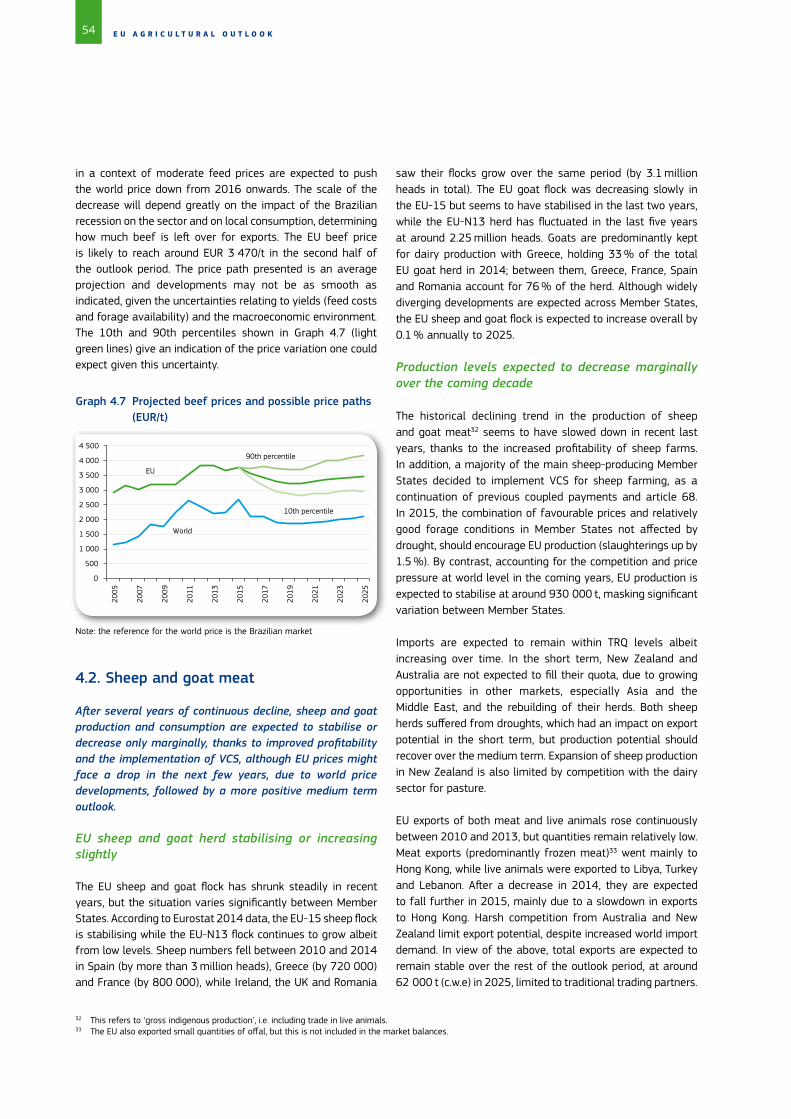
54 E U A G R I C U L T U R A L O U T L O O K
32 This refers to ‘gross indigenous production’, i.e. including trade in live animals.33 The EU also exported small quantities of offal, but this is not included in the market balances.
in a context of moderate feed prices are expected to push the world price down from 2016 onwards. The scale of the decrease will depend greatly on the impact of the Brazilian recession on the sector and on local consumption, determining how much beef is left over for exports. The EU beef price is likely to reach around EUR 3 470/t in the second half of the outlook period. The price path presented is an average projection and developments may not be as smooth as indicated, given the uncertainties relating to yields (feed costs and forage availability) and the macroeconomic environment. The 10th and 90th percentiles shown in Graph 4.7 (light green lines) give an indication of the price variation one could expect given this uncertainty.
saw their flocks grow over the same period (by 3.1 million heads in total). The EU goat flock was decreasing slowly in the EU-15 but seems to have stabilised in the last two years, while the EU-N13 herd has fluctuated in the last five years at around 2.25 million heads. Goats are predominantly kept for dairy production with Greece, holding 33 % of the total EU goat herd in 2014; between them, Greece, France, Spain and Romania account for 76 % of the herd. Although widely diverging developments are expected across Member States, the EU sheep and goat flock is expected to increase overall by 0.1 % annually to 2025.
Production levels expected to decrease marginally over the coming decade
The historical declining trend in the production of sheep and goat meat32 seems to have slowed down in recent last years, thanks to the increased profitability of sheep farms. In addition, a majority of the main sheep-producing Member States decided to implement VCS for sheep farming, as a continuation of previous coupled payments and article 68. In 2015, the combination of favourable prices and relatively good forage conditions in Member States not affected by drought, should encourage EU production (slaughterings up by 1.5 %). By contrast, accounting for the competition and price pressure at world level in the coming years, EU production is expected to stabilise at around 930 000 t, masking significant variation between Member States.
Imports are expected to remain within TRQ levels albeit increasing over time. In the short term, New Zealand and Australia are not expected to fill their quota, due to growing opportunities in other markets, especially Asia and the Middle East, and the rebuilding of their herds. Both sheep herds suffered from droughts, which had an impact on export potential in the short term, but production potential should recover over the medium term. Expansion of sheep production in New Zealand is also limited by competition with the dairy sector for pasture.
EU exports of both meat and live animals rose continuously between 2010 and 2013, but quantities remain relatively low. Meat exports (predominantly frozen meat)33 went mainly to Hong Kong, while live animals were exported to Libya, Turkey and Lebanon. After a decrease in 2014, they are expected to fall further in 2015, mainly due to a slowdown in exports to Hong Kong. Harsh competition from Australia and New Zealand limit export potential, despite increased world import demand. In view of the above, total exports are expected to remain stable over the rest of the outlook period, at around 62 000 t (c.w.e) in 2025, limited to traditional trading partners.
0
500
1 000
1 500
2 000
2 500
3 000
3 500
4 000
4 500
2005
2007
2009
2011
2013
2015
2017
2019
2021
2023
2025
90th percentile
10th percentile
EU
World
Note: the reference for the world price is the Brazilian market
Graph 4.7 Projected beef prices and possible price paths (EUR/t)
4.2. Sheep and goat meat
After several years of continuous decline, sheep and goat production and consumption are expected to stabilise or decrease only marginally, thanks to improved profitability and the implementation of VCS, although EU prices might face a drop in the next few years, due to world price developments, followed by a more positive medium term outlook.
EU sheep and goat herd stabilising or increasing slightly
The EU sheep and goat flock has shrunk steadily in recent years, but the situation varies significantly between Member States. According to Eurostat 2014 data, the EU-15 sheep flock is stabilising while the EU-N13 flock continues to grow albeit from low levels. Sheep numbers fell between 2010 and 2014 in Spain (by more than 3 million heads), Greece (by 720 000) and France (by 800 000), while Ireland, the UK and Romania
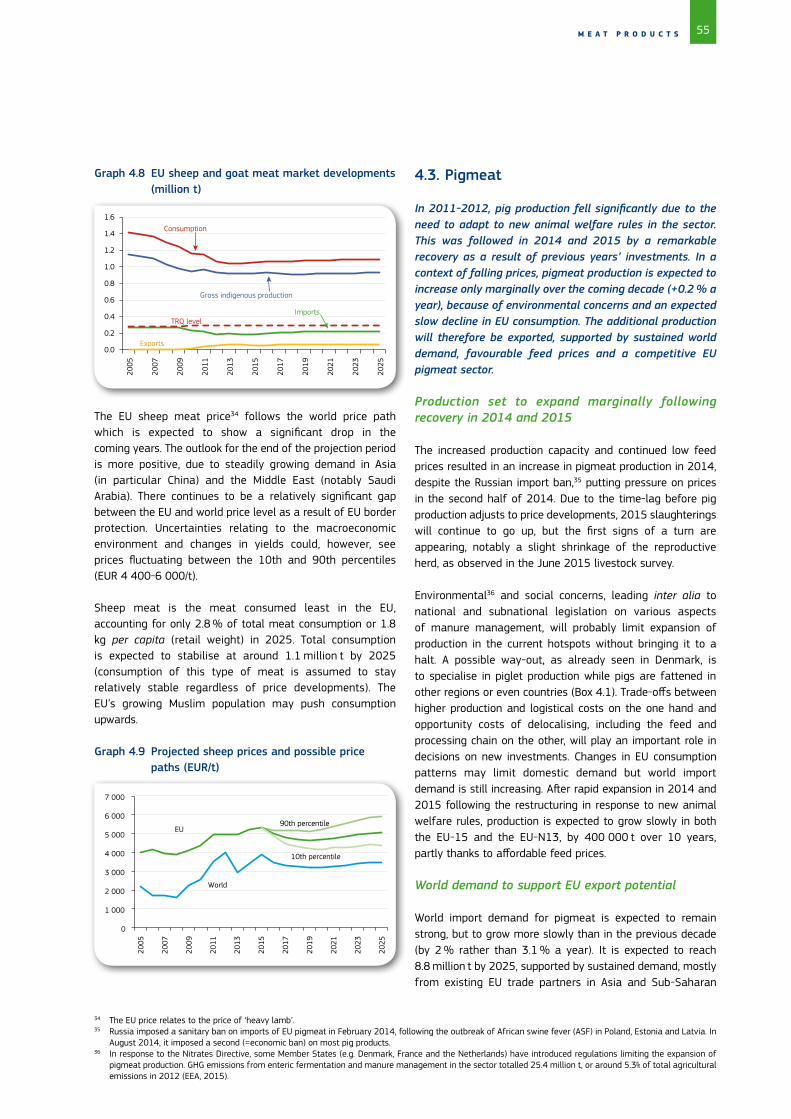
55
34 The EU price relates to the price of ‘heavy lamb’.35 Russia imposed a sanitary ban on imports of EU pigmeat in February 2014, following the outbreak of African swine fever (ASF) in Poland, Estonia and Latvia. In
August 2014, it imposed a second (=economic ban) on most pig products.36 In response to the Nitrates Directive, some Member States (e.g. Denmark, France and the Netherlands) have introduced regulations limiting the expansion of
pigmeat production. GHG emissions from enteric fermentation and manure management in the sector totalled 25.4 million t, or around 5.3% of total agricultural emissions in 2012 (EEA, 2015).
M E A T P R O D U C T S
Graph 4.8 EU sheep and goat meat market developments (million t)
The EU sheep meat price34 follows the world price path which is expected to show a significant drop in the coming years. The outlook for the end of the projection period is more positive, due to steadily growing demand in Asia (in particular China) and the Middle East (notably Saudi Arabia). There continues to be a relatively significant gap between the EU and world price level as a result of EU border protection. Uncertainties relating to the macroeconomic environment and changes in yields could, however, see prices fluctuating between the 10th and 90th percentiles (EUR 4 400-6 000/t).
Sheep meat is the meat consumed least in the EU, accounting for only 2.8 % of total meat consumption or 1.8 kg per capita (retail weight) in 2025. Total consumption is expected to stabilise at around 1.1 million t by 2025 (consumption of this type of meat is assumed to stay relatively stable regardless of price developments). The EU’s growing Muslim population may push consumption upwards.
Graph 4.9 Projected sheep prices and possible price paths (EUR/t)
4.3. Pigmeat
In 2011-2012, pig production fell significantly due to the need to adapt to new animal welfare rules in the sector. This was followed in 2014 and 2015 by a remarkable recovery as a result of previous years’ investments. In a context of falling prices, pigmeat production is expected to increase only marginally over the coming decade (+0.2 % a year), because of environmental concerns and an expected slow decline in EU consumption. The additional production will therefore be exported, supported by sustained world demand, favourable feed prices and a competitive EU pigmeat sector.
Production set to expand marginally following recovery in 2014 and 2015
The increased production capacity and continued low feed prices resulted in an increase in pigmeat production in 2014, despite the Russian import ban,35 putting pressure on prices in the second half of 2014. Due to the time-lag before pig production adjusts to price developments, 2015 slaughterings will continue to go up, but the first signs of a turn are appearing, notably a slight shrinkage of the reproductive herd, as observed in the June 2015 livestock survey.
Environmental36 and social concerns, leading inter alia to national and subnational legislation on various aspects of manure management, will probably limit expansion of production in the current hotspots without bringing it to a halt. A possible way-out, as already seen in Denmark, is to specialise in piglet production while pigs are fattened in other regions or even countries (Box 4.1). Trade-offs between higher production and logistical costs on the one hand and opportunity costs of delocalising, including the feed and processing chain on the other, will play an important role in decisions on new investments. Changes in EU consumption patterns may limit domestic demand but world import demand is still increasing. After rapid expansion in 2014 and 2015 following the restructuring in response to new animal welfare rules, production is expected to grow slowly in both the EU-15 and the EU-N13, by 400 000 t over 10 years, partly thanks to affordable feed prices.
World demand to support EU export potential
World import demand for pigmeat is expected to remain strong, but to grow more slowly than in the previous decade (by 2 % rather than 3.1 % a year). It is expected to reach 8.8 million t by 2025, supported by sustained demand, mostly from existing EU trade partners in Asia and Sub-Saharan
0.0
0.2
0.4
0.6
0.8
1.0
1.2
1.4
1.6
2005
2007
2009
2011
2013
2015
2017
2019
2021
2023
2025
Gross indigenous production
Consumption
Imports
Exports
TRQ level
0
1 000
2 000
3 000
4 000
5 000
6 000
7 000
2005
2007
2009
2011
2013
2015
2017
2019
2021
2023
2025
90th percentile
10th percentile
EU
World
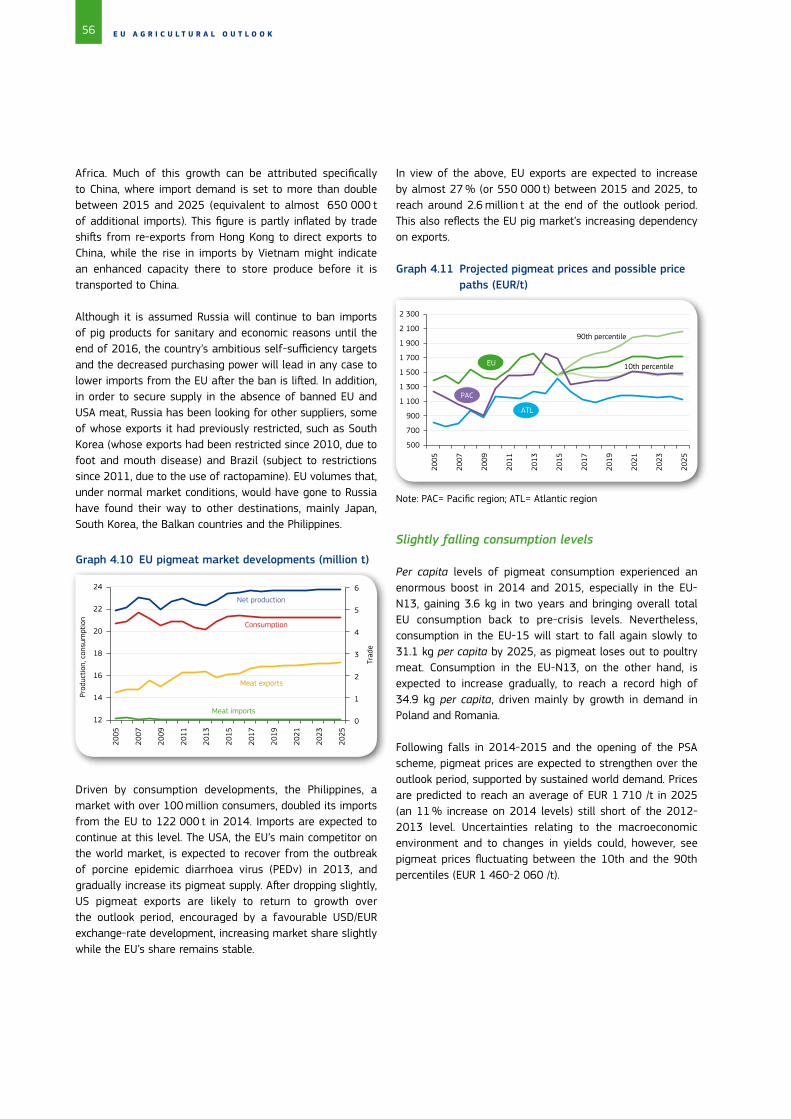
56 E U A G R I C U L T U R A L O U T L O O K
Africa. Much of this growth can be attributed specifically to China, where import demand is set to more than double between 2015 and 2025 (equivalent to almost 650 000 t of additional imports). This figure is partly inflated by trade shifts from re-exports from Hong Kong to direct exports to China, while the rise in imports by Vietnam might indicate an enhanced capacity there to store produce before it is transported to China.
Although it is assumed Russia will continue to ban imports of pig products for sanitary and economic reasons until the end of 2016, the country’s ambitious self-sufficiency targets and the decreased purchasing power will lead in any case to lower imports from the EU after the ban is lifted. In addition, in order to secure supply in the absence of banned EU and USA meat, Russia has been looking for other suppliers, some of whose exports it had previously restricted, such as South Korea (whose exports had been restricted since 2010, due to foot and mouth disease) and Brazil (subject to restrictions since 2011, due to the use of ractopamine). EU volumes that, under normal market conditions, would have gone to Russia have found their way to other destinations, mainly Japan, South Korea, the Balkan countries and the Philippines.
In view of the above, EU exports are expected to increase by almost 27 % (or 550 000 t) between 2015 and 2025, to reach around 2.6 million t at the end of the outlook period. This also reflects the EU pig market’s increasing dependency on exports.
Graph 4.11 Projected pigmeat prices and possible price paths (EUR/t)
0
1
2
3
4
5
6
12
14
16
18
20
22
24
2005
2007
2009
2011
2013
2015
2017
2019
2021
2023
2025
Trad
e
Prod
uctio
n, c
onsu
mpt
ion
Net production
Consumption
Meat imports
Meat exports
500
700
900
1 100
1 300
1 500
1 700
1 900
2 100
2 300
2005
2007
2009
2011
2013
2015
2017
2019
2021
2023
2025
90th percentile
10th percentile EU
ATL
PAC
Slightly falling consumption levels
Per capita levels of pigmeat consumption experienced an enormous boost in 2014 and 2015, especially in the EU-N13, gaining 3.6 kg in two years and bringing overall total EU consumption back to pre-crisis levels. Nevertheless, consumption in the EU-15 will start to fall again slowly to 31.1 kg per capita by 2025, as pigmeat loses out to poultry meat. Consumption in the EU-N13, on the other hand, is expected to increase gradually, to reach a record high of 34.9 kg per capita, driven mainly by growth in demand in Poland and Romania.
Following falls in 2014-2015 and the opening of the PSA scheme, pigmeat prices are expected to strengthen over the outlook period, supported by sustained world demand. Prices are predicted to reach an average of EUR 1 710 /t in 2025 (an 11 % increase on 2014 levels) still short of the 2012-2013 level. Uncertainties relating to the macroeconomic environment and to changes in yields could, however, see pigmeat prices fluctuating between the 10th and the 90th percentiles (EUR 1 460-2 060 /t).
Note: PAC= Pacific region; ATL= Atlantic region
Graph 4.10 EU pigmeat market developments (million t)
Driven by consumption developments, the Philippines, a market with over 100 million consumers, doubled its imports from the EU to 122 000 t in 2014. Imports are expected to continue at this level. The USA, the EU’s main competitor on the world market, is expected to recover from the outbreak of porcine epidemic diarrhoea virus (PEDv) in 2013, and gradually increase its pigmeat supply. After dropping slightly, US pigmeat exports are likely to return to growth over the outlook period, encouraged by a favourable USD/EUR exchange-rate development, increasing market share slightly while the EU’s share remains stable.

57M E A T P R O D U C T S
Box 4.1 Concentration of pigmeat production in some Member States and more piglets traded
EU pigmeat production is estimated to grow only slightly over the period 2015-2025, however, the EU aggregation hides different developments at Member State level. The limited growth can be related to a certain pressure on prices, precluding investments in many Member States. Seven Member States, namely Germany, Spain, France, Poland, Denmark, Italy and the Netherlands, account for more than 75 % of total EU pigmeat supply. Pigmeat production is expected to increase in most of these countries, namely Germany, Spain, Poland and the Netherlands, whereas in Denmark and Italy a slight decline is expected (Graph 4.12). In total, the seven countries will increase production by about 300 000 t (+1.6 %) over the period 2015-2025, while the production in the rest of the EU will increase only slightly. The projected production growth is sensitive to the base year (here 2015), as e.g. pigmeat production in Spain and Poland already rose by morethan 10 % in the period 2013-2015, whereas in the same period the increase was less than 2 % in the other EU Member States. Given that domestic demand is declining, additional production growth in the EU implies that the EU pig sector becomes more dependent on third countries markets.
Changes in pigmeat supply described above explain only partly upcoming shifts in EU production patterns. A further division of production processes (production of piglets and pig fattening) across Member States is expected, mainly driven by local regulations, costs associated with surplus manure management, shortage of land and neighbourhood concerns. This is reflected in trade of live animals (piglets and pigs), a phenomenon that is mainly concentrated in some Northern EU countries, comprising especially Poland, Germany, Denmark and the Netherlands (Graph 4.13). Germany and Poland are the main importers of live animals (representing, respectively, 55 % and 23 % of the total of 17.7 million heads of EU-28 young pigs imports in 2013), with imports of piglets by Polish farmers expected to keep on increasing by about 1.6 million heads in 2025 compared to 2015 (+24 %). Denmark and the Netherlands are the two main exporters of live animals and especially Denmark is projected to further increase exports of live animals, while the productivity gains in the Netherlands would lead also to increased meat production (although the degree of environmental constraints, especially for the management of nitrogen, is a limiting production factor). These two Member States will further specialise in piglet production and increasingly get an “incubator” role for the region.
Graph 4.13 also includes live animal trade in fattened pigs, which is however less important, and primarily driven by the current spatial allocation and capacity of slaughterhouses within the Northern region (e.g. Dutch fattened pigs slaughtered in Germany). A similar pattern in trade of live animals occurs in the South-eastern EU countries (Spain, France and Portugal), but at a much smaller scale.
Note: This work was prepared by the AGMEMOD consortium (Petra Salamon and Martin Banse, from Thünen Institute, Roel Jongeneel and Myrna van Leeuwen from LEI-Wageningen UR), with the assistance of JRC-IPTS.
Graph 4.12 Estimated changes in pigmeat production for selected Member States (2015-2025)
-5%
0%
5%
10%
-80
-40
0
40
80
120
160
DE ES FR PL DK IT NL
in 1000 tonnes in percent
Source: AGMEMOD simulation
0
5
10
15
20
2010
2015
2020
2025
2010
2015
2020
2025
Imports Exports
Poland Germany Denmark Netherlands
Graph 4.13 Net-exports and net-imports of live pigs for selected Member States (million heads)
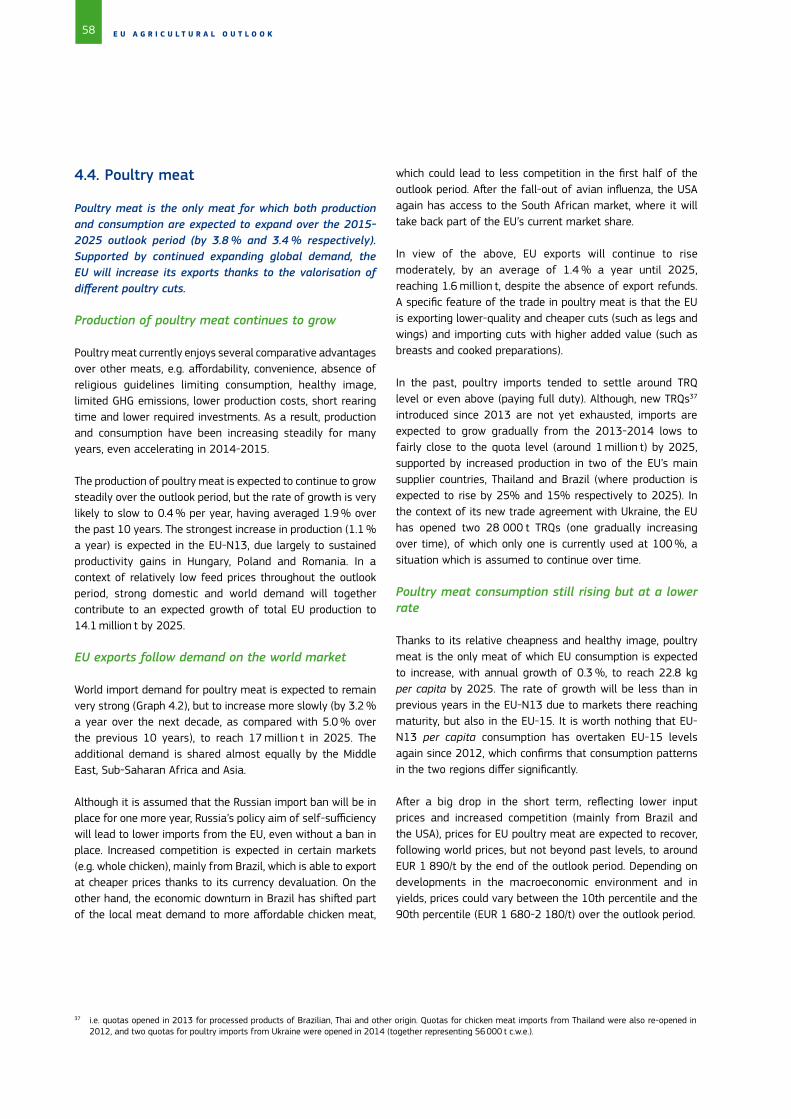
58 E U A G R I C U L T U R A L O U T L O O K
37 i.e. quotas opened in 2013 for processed products of Brazilian, Thai and other origin. Quotas for chicken meat imports from Thailand were also re-opened in 2012, and two quotas for poultry imports from Ukraine were opened in 2014 (together representing 56 000 t c.w.e.).
4.4. Poultry meat
Poultry meat is the only meat for which both production and consumption are expected to expand over the 2015-2025 outlook period (by 3.8 % and 3.4 % respectively). Supported by continued expanding global demand, the EU will increase its exports thanks to the valorisation of different poultry cuts.
Production of poultry meat continues to grow
Poultry meat currently enjoys several comparative advantages over other meats, e.g. affordability, convenience, absence of religious guidelines limiting consumption, healthy image, limited GHG emissions, lower production costs, short rearing time and lower required investments. As a result, production and consumption have been increasing steadily for many years, even accelerating in 2014-2015.
The production of poultry meat is expected to continue to grow steadily over the outlook period, but the rate of growth is very likely to slow to 0.4 % per year, having averaged 1.9 % over the past 10 years. The strongest increase in production (1.1 % a year) is expected in the EU-N13, due largely to sustained productivity gains in Hungary, Poland and Romania. In a context of relatively low feed prices throughout the outlook period, strong domestic and world demand will together contribute to an expected growth of total EU production to 14.1 million t by 2025.
EU exports follow demand on the world market
World import demand for poultry meat is expected to remain very strong (Graph 4.2), but to increase more slowly (by 3.2 % a year over the next decade, as compared with 5.0 % over the previous 10 years), to reach 17 million t in 2025. The additional demand is shared almost equally by the Middle East, Sub-Saharan Africa and Asia.
Although it is assumed that the Russian import ban will be in place for one more year, Russia’s policy aim of self-sufficiency will lead to lower imports from the EU, even without a ban in place. Increased competition is expected in certain markets (e.g. whole chicken), mainly from Brazil, which is able to export at cheaper prices thanks to its currency devaluation. On the other hand, the economic downturn in Brazil has shifted part of the local meat demand to more affordable chicken meat,
which could lead to less competition in the first half of the outlook period. After the fall-out of avian influenza, the USA again has access to the South African market, where it will take back part of the EU’s current market share.
In view of the above, EU exports will continue to rise moderately, by an average of 1.4 % a year until 2025, reaching 1.6 million t, despite the absence of export refunds. A specific feature of the trade in poultry meat is that the EU is exporting lower-quality and cheaper cuts (such as legs and wings) and importing cuts with higher added value (such as breasts and cooked preparations).
In the past, poultry imports tended to settle around TRQ level or even above (paying full duty). Although, new TRQs37 introduced since 2013 are not yet exhausted, imports are expected to grow gradually from the 2013-2014 lows to fairly close to the quota level (around 1 million t) by 2025, supported by increased production in two of the EU’s main supplier countries, Thailand and Brazil (where production is expected to rise by 25% and 15% respectively to 2025). In the context of its new trade agreement with Ukraine, the EU has opened two 28 000 t TRQs (one gradually increasing over time), of which only one is currently used at 100 %, a situation which is assumed to continue over time.
Poultry meat consumption still rising but at a lower rate
Thanks to its relative cheapness and healthy image, poultry meat is the only meat of which EU consumption is expected to increase, with annual growth of 0.3 %, to reach 22.8 kg per capita by 2025. The rate of growth will be less than in previous years in the EU-N13 due to markets there reaching maturity, but also in the EU-15. It is worth nothing that EU-N13 per capita consumption has overtaken EU-15 levels again since 2012, which confirms that consumption patterns in the two regions differ significantly.
After a big drop in the short term, reflecting lower input prices and increased competition (mainly from Brazil and the USA), prices for EU poultry meat are expected to recover, following world prices, but not beyond past levels, to around EUR 1 890/t by the end of the outlook period. Depending on developments in the macroeconomic environment and in yields, prices could vary between the 10th percentile and the 90th percentile (EUR 1 680-2 180/t) over the outlook period.

59M E A T P R O D U C T S
0.5
1.0
1.5
2.0
2.5
3.0
6
8
10
12
14
16
Trad
e
Prod
uctio
n. c
onsu
mpt
ion
Net production
Consumption
Meat imports
Meat exports
TRQ level
2005
2007
2009
2011
2013
2015
2017
2019
2021
2023
2025
Graph 4.14 EU poultry meat market developments (million t)
0
500
1 000
1 500
2 000
2 500
2005
2007
2009
2011
2013
2015
2017
2019
2021
2023
2025
90th percentile
10th percentile
EU
World
Graph 4.15 Projected price and possible paths for poultry meat (EUR/t)
Note: The reference for the world price is Brazil.

60 E U A G R I C U L T U R A L O U T L O O K
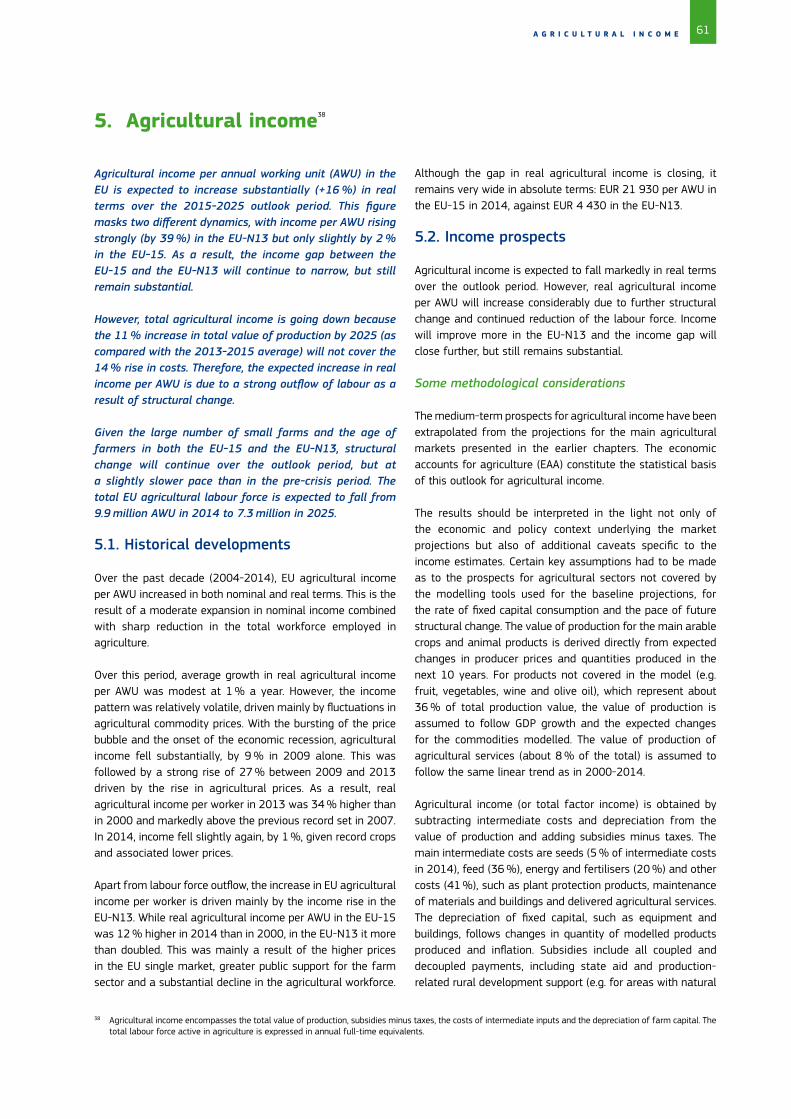
61
38 Agricultural income encompasses the total value of production, subsidies minus taxes, the costs of intermediate inputs and the depreciation of farm capital. The total labour force active in agriculture is expressed in annual full-time equivalents.
A G R I C U L T U R A L I N C O M E
5. Agricultural income38
Agricultural income per annual working unit (AWU) in the EU is expected to increase substantially (+16 %) in real terms over the 2015-2025 outlook period. This figure masks two different dynamics, with income per AWU rising strongly (by 39 %) in the EU-N13 but only slightly by 2 % in the EU-15. As a result, the income gap between the EU-15 and the EU-N13 will continue to narrow, but still remain substantial.
However, total agricultural income is going down because the 11 % increase in total value of production by 2025 (as compared with the 2013-2015 average) will not cover the 14 % rise in costs. Therefore, the expected increase in real income per AWU is due to a strong outflow of labour as a result of structural change.
Given the large number of small farms and the age of farmers in both the EU-15 and the EU-N13, structural change will continue over the outlook period, but at a slightly slower pace than in the pre-crisis period. The total EU agricultural labour force is expected to fall from 9.9 million AWU in 2014 to 7.3 million in 2025.
5.1. Historical developments
Over the past decade (2004-2014), EU agricultural income per AWU increased in both nominal and real terms. This is the result of a moderate expansion in nominal income combined with sharp reduction in the total workforce employed in agriculture.
Over this period, average growth in real agricultural income per AWU was modest at 1 % a year. However, the income pattern was relatively volatile, driven mainly by fluctuations in agricultural commodity prices. With the bursting of the price bubble and the onset of the economic recession, agricultural income fell substantially, by 9 % in 2009 alone. This was followed by a strong rise of 27 % between 2009 and 2013 driven by the rise in agricultural prices. As a result, real agricultural income per worker in 2013 was 34 % higher than in 2000 and markedly above the previous record set in 2007. In 2014, income fell slightly again, by 1 %, given record crops and associated lower prices.
Apart from labour force outflow, the increase in EU agricultural income per worker is driven mainly by the income rise in the EU-N13. While real agricultural income per AWU in the EU-15 was 12 % higher in 2014 than in 2000, in the EU-N13 it more than doubled. This was mainly a result of the higher prices in the EU single market, greater public support for the farm sector and a substantial decline in the agricultural workforce.
Although the gap in real agricultural income is closing, it remains very wide in absolute terms: EUR 21 930 per AWU in the EU-15 in 2014, against EUR 4 430 in the EU-N13.
5.2. Income prospects
Agricultural income is expected to fall markedly in real terms over the outlook period. However, real agricultural income per AWU will increase considerably due to further structural change and continued reduction of the labour force. Income will improve more in the EU-N13 and the income gap will close further, but still remains substantial.
Some methodological considerations
The medium-term prospects for agricultural income have been extrapolated from the projections for the main agricultural markets presented in the earlier chapters. The economic accounts for agriculture (EAA) constitute the statistical basis of this outlook for agricultural income.
The results should be interpreted in the light not only of the economic and policy context underlying the market projections but also of additional caveats specific to the income estimates. Certain key assumptions had to be made as to the prospects for agricultural sectors not covered by the modelling tools used for the baseline projections, for the rate of fixed capital consumption and the pace of future structural change. The value of production for the main arable crops and animal products is derived directly from expected changes in producer prices and quantities produced in the next 10 years. For products not covered in the model (e.g. fruit, vegetables, wine and olive oil), which represent about 36 % of total production value, the value of production is assumed to follow GDP growth and the expected changes for the commodities modelled. The value of production of agricultural services (about 8 % of the total) is assumed to follow the same linear trend as in 2000-2014.
Agricultural income (or total factor income) is obtained by subtracting intermediate costs and depreciation from the value of production and adding subsidies minus taxes. The main intermediate costs are seeds (5 % of intermediate costs in 2014), feed (36 %), energy and fertilisers (20 %) and other costs (41 %), such as plant protection products, maintenance of materials and buildings and delivered agricultural services. The depreciation of fixed capital, such as equipment and buildings, follows changes in quantity of modelled products produced and inflation. Subsidies include all coupled and decoupled payments, including state aid and production-related rural development support (e.g. for areas with natural

62 E U A G R I C U L T U R A L O U T L O O K
39 In nominal terms
constraints) but not investment subsidies. Over the outlook period, the subsidy component of agricultural income changes in line with direct payment ceilings following the CAP reform. The distribution between coupled and decoupled payments takes into account the choices of which the Member States notified the Commission in August 2014.
Agricultural workforce developments (a key factor for estimating agricultural income per AWU) are assumed to follow the same declining trend as in 2005-2014, in both the EU-15 and the EU-N13. In contrast to this longer-term trend, the decrease in the labour force has recently slowed down in some Member States, including Romania and Poland, while in Ireland and the UK the labour force in agriculture has even increased, mainly as a result of the economic crisis.
A real income per AWU increase because of erosion of the labour force…
Given the large number of small farms and the age of farmers in both the EU-15 and the EU-N13 structural change will continue over the outlook period, but at a slightly slower pace than in the pre-crisis period. Major agricultural countries such as Poland (1.9 million AWU in 2014) and Romania (1.4 million), but also Hungary (0.4 million), Lithuania (0.15 million), Slovenia (0.08 million), the UK (0.3 million), Denmark (0.5 million), Greece (0.45 million) and Ireland (0.17 million) saw the labour decline come to a temporary halt in the wake of the economic crisis.
The total EU agricultural labour force is expected to fall from 9.9 million AWU in 2014 to 7.3 million in 2025. It would be 6.3 million AWU in 2025 if the pre-crisis (2005-2010) rate of decline were to be maintained or 8.5 million if the post-crisis (2010-2014) growth rate continued.
The overall medium-term trend for agricultural income in real terms per capita is expected to be positive (Graph 5.1). In 2025, real agricultural income per AWU is expected to be 16 % above the 2013-2015 average, an increase of 1.5 % a year. This positive trend is the result of a steady fall in the workforce employed in agriculture (-26 %), which more than offsets the expected deterioration in total factor income in real terms (-15 %).
…but falling total real and nominal agricultural income
This, however, should not hide the fact that total agricultural income is going down in both nominal and real terms because the increase in the value of production is not enough to cover cost increases.
On the revenue side, the total value of production39 increases by 11 % as compared with the 2013-2015 average, due mainly to increases in non-modelled crops (+13 %) and agricultural services (+31 %), while growth in modelled commodities lags behind (+7 %). The main contributors to the latter are dairy (+21 %), pigmeat (+13 %) and eggs (+32 %), while the main losers are beef (-9 %) and rapeseed (-8 %).
On the cost side, total costs increase slightly, from 67 % to 71 % of the level of total revenue. Over the outlook period, depreciation increases by 24 %. After a drop at the beginning of the outlook period, driven by low commodity prices, seed and feed costs recover at the end of the outlook period. Costs for energy and fertilisers, heavily influenced by the crude oil price and exchange rate, remain low at the beginning of the outlook period, to recover steadily after 2016, and surpass the high level of 2013 again in 2025. Other intermediate costs, closely following the consumer price index, continue to increase (by 26 % in 2025). Consequently, the net value added, i.e. value of production minus intermediate costs and depreciation, drops. In nominal terms, net value added shrinks by 2 % from the 2013-2015 average.
Real agricultural income per AWU in the EU is not expected to follow a steady pattern (Graph 5.1). In 2016, the value of production drops slightly given low prices for all crop and animal products, especially dairy and poultry. The effect of low worldwide prices is tempered somewhat by the depreciation of the euro against the US dollar. In 2017, sugar prices decline with expiry of the quota arrangements, and soft wheat, poultry and beef prices also continue their decline. Some other commodities, such as dairy, recover slightly, however, to maintain the overall status-quo. The main dip in income occurs in 2018 and 2019, when the euro
70
75
80
85
90
95
100
105
110
115
120
2013
-201
5
2016
2017
2018
2019
2020
2021
2022
2023
2024
2025
Agricultural income in real terms per labour unit
Factor income in nominal terms
Factor income in real terms
Graph 5.1 Change in agricultural income in the EU (2013-2015 average = 100)
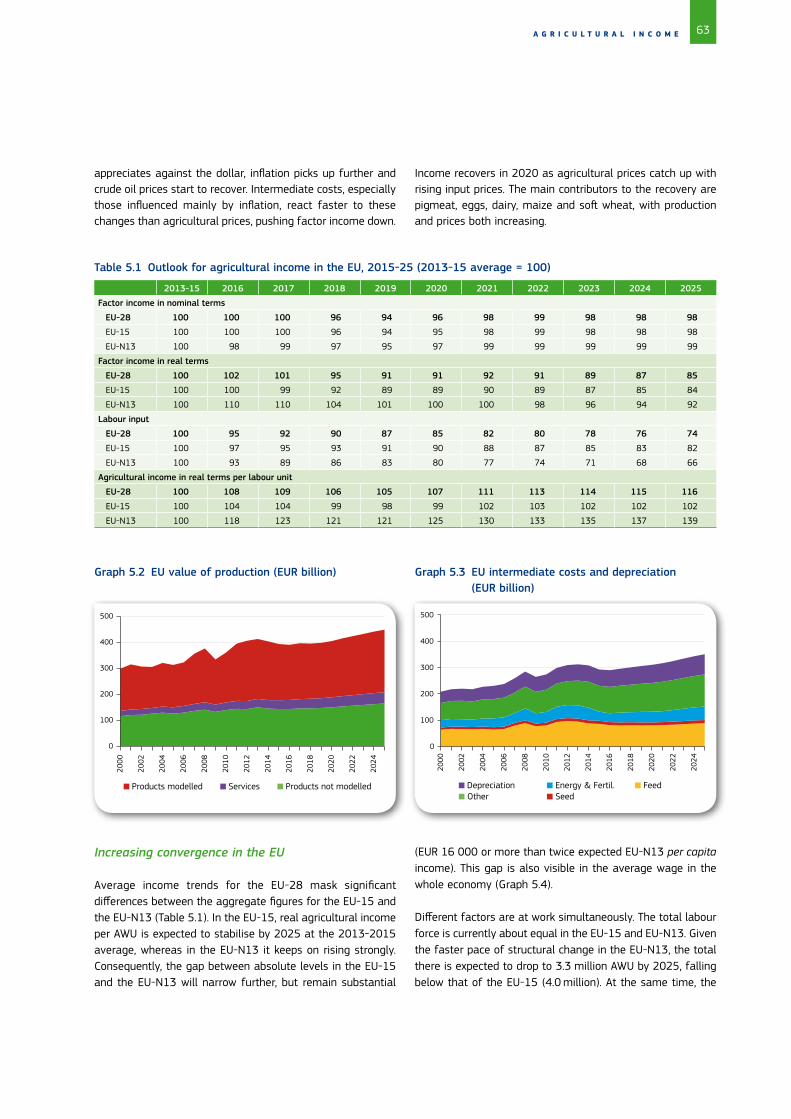
63 A G R I C U L T U R A L I N C O M E
Graph 5.2 EU value of production (EUR billion)
Products modelled Services Products not modelled
0
100
200
300
400
500
2000
2002
2004
2006
2008
2010
2012
2014
2016
2018
2020
2022
2024
appreciates against the dollar, inflation picks up further and crude oil prices start to recover. Intermediate costs, especially those influenced mainly by inflation, react faster to these changes than agricultural prices, pushing factor income down.
Income recovers in 2020 as agricultural prices catch up with rising input prices. The main contributors to the recovery are pigmeat, eggs, dairy, maize and soft wheat, with production and prices both increasing.
Table 5.1 Outlook for agricultural income in the EU, 2015-25 (2013-15 average = 100)
2013-15 2016 2017 2018 2019 2020 2021 2022 2023 2024 2025
Factor income in nominal terms
EU-28 100 100 100 96 94 96 98 99 98 98 98
EU-15 100 100 100 96 94 95 98 99 98 98 98
EU-N13 100 98 99 97 95 97 99 99 99 99 99
Factor income in real terms
EU-28 100 102 101 95 91 91 92 91 89 87 85
EU-15 100 100 99 92 89 89 90 89 87 85 84
EU-N13 100 110 110 104 101 100 100 98 96 94 92
Labour input
EU-28 100 95 92 90 87 85 82 80 78 76 74
EU-15 100 97 95 93 91 90 88 87 85 83 82
EU-N13 100 93 89 86 83 80 77 74 71 68 66
Agricultural income in real terms per labour unit
EU-28 100 108 109 106 105 107 111 113 114 115 116
EU-15 100 104 104 99 98 99 102 103 102 102 102
EU-N13 100 118 123 121 121 125 130 133 135 137 139
Graph 5.3 EU intermediate costs and depreciation (EUR billion)
Depreciation Other
Energy & Fertil. Seed
Feed
0
100
200
300
400
500
2000
2002
2004
2006
2008
2010
2012
2014
2016
2018
2020
2022
2024
Increasing convergence in the EU
Average income trends for the EU-28 mask significant differences between the aggregate figures for the EU-15 and the EU-N13 (Table 5.1). In the EU-15, real agricultural income per AWU is expected to stabilise by 2025 at the 2013-2015 average, whereas in the EU-N13 it keeps on rising strongly. Consequently, the gap between absolute levels in the EU-15 and the EU-N13 will narrow further, but remain substantial
(EUR 16 000 or more than twice expected EU-N13 per capita income). This gap is also visible in the average wage in the whole economy (Graph 5.4).
Different factors are at work simultaneously. The total labour force is currently about equal in the EU-15 and EU-N13. Given the faster pace of structural change in the EU-N13, the total there is expected to drop to 3.3 million AWU by 2025, falling below that of the EU-15 (4.0 million). At the same time, the
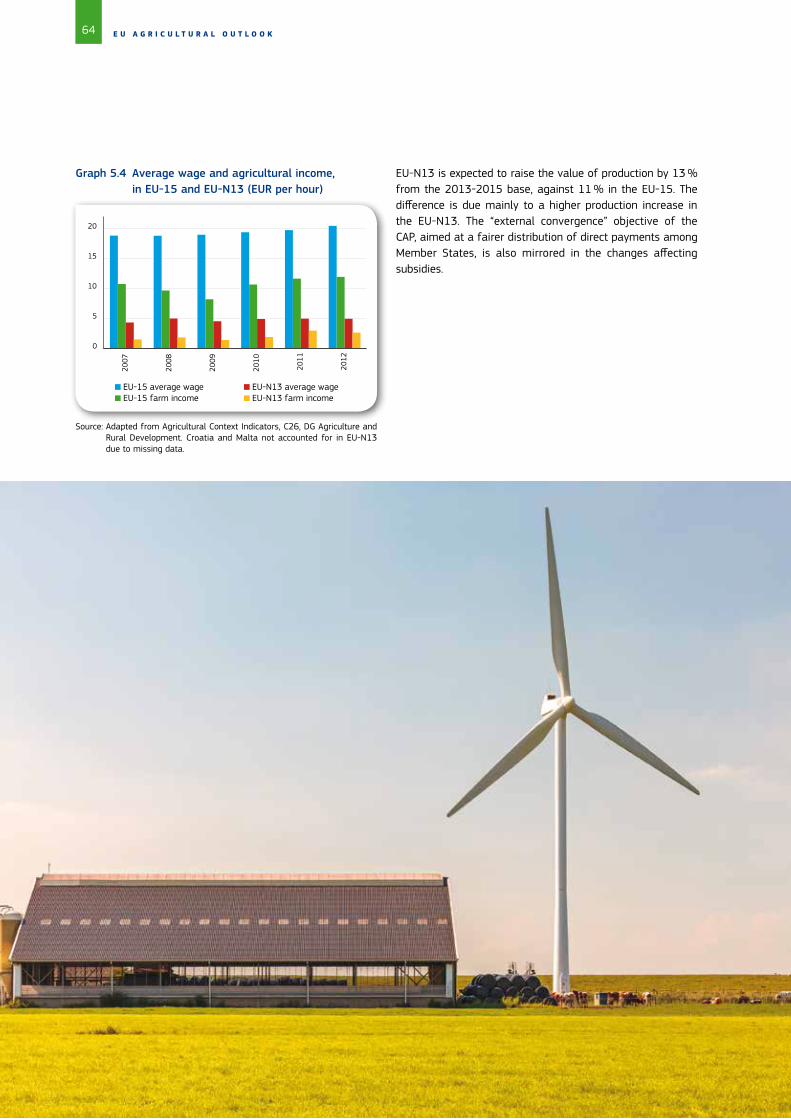
64 E U A G R I C U L T U R A L O U T L O O K
EU-N13 is expected to raise the value of production by 13 % from the 2013-2015 base, against 11 % in the EU-15. The difference is due mainly to a higher production increase in the EU-N13. The “external convergence” objective of the CAP, aimed at a fairer distribution of direct payments among Member States, is also mirrored in the changes affecting subsidies.
EU-15 average wage EU-15 farm income
EU-N13 average wage EU-N13 farm income
0
5
10
15
20
2007
2008
2009
2010
2011
2012
Source: Adapted from Agricultural Context Indicators, C26, DG Agriculture and Rural Development. Croatia and Malta not accounted for in EU-N13 due to missing data.
Graph 5.4 Average wage and agricultural income, in EU-15 and EU-N13 (EUR per hour)
65
40 EU-15 for the GDP Index
G E N E R A L C O N S E Q U E N C E S O F M A C R O E C O N O M I C A N D Y I E L D U N C E R T A I N T I E S
The baseline is a projection of agricultural market developments based on a set of assumptions which are considered likely to occur, based on a broad consultation of different market experts. Those assumptions are however only one of the possible futures as there is uncertainty surrounding key drivers of these markets. The partial stochastic analysis described in this section addresses part of these uncertainties and its potential impact on the projection. Such stochastic analysis quantifies the range of possible outcomes around the central baseline value, by reproducing the past uncertainty observed for key factors.
In particular the uncertainty surrounding selected macroeconomic variables (GDP, GDP deflator, CPI, exchange rate and oil price) and crop yields is introduced in the model. It has to be kept in mind that the analysis is only partial as it does not capture variability possibly stemming from other factors than the selected ones.
6.1. Exogenous sources of uncertainty
The selection of stochastic variables is driven by two considerations, namely the need to cover the major sources of uncertainty for EU agricultural markets whilst keeping the analysis simple enough to allow the identification of the main sources of uncertainty in each market. In total, 37 country-specific macroeconomic variables and 77 country- and crop-specific yields, shown in Tables 1 and 2, are treated as uncertain in the partial stochastic runs.
The procedure followed consists of three steps: (i) the quantification of the past uncertainty for each variable
concerned; (ii) the generation of 1 000 sets of possible values for these stochastic variables; and (iii) the execution of the AGLINK-COSIMO model for each of these 1 000 alternative scenarios. These 3 steps are explained in more detail below.
Step (i): Past variability around the trend is quantified for each macroeconomic and yield variable separately.
For macroeconomic variables, the estimation is based on forecast errors for the period 2003-2014. In addition, the correlation between the forecast errors in each year for the different variables is considered; forecast errors correlation is used as a proxy to replicate the correlation between macroeconomic variables.
Table 6.1 summarises the simulated variability for macroeconomic variables in 2025. The variability of each outcome is measured through the coefficient of variation in 2025 (CV2025), defined as the ratio of the standard deviation of the variable relative to its mean, and calculated using the 2025 values. By selecting the last year of the outlook period (2025), the CV accounts for the accumulated uncertainty over time. The accumulation of the uncertainty is implemented by means of an adapted Exponential Weighted Moving Average (EWMA) model, which assumes a time-dependant relationship (covariance and correlation) among the deviations of the macroeconomic indicators. Then using the time-dependant covariance, for each year, it is assumed that stochastic variables follow a multivariate normal distribution. Because a few extreme values are likely to appear in the draws, the values below the 10th percentile and over the 90th percentile are excluded from the analysis.
6. General consequences of macroeconomic and yield uncertainties
Table 6.1 Coefficients of variation for macroeconomic variables in 2025 (%)
CPI (Consumer Price Index) GDP Deflator GDP Index Exchange Rate
(national currency/USD) Oil Price
Australia 2 3 1 11
Brazil 7 7 3 18
Canada 1 2 2 7
China 4 9 6 4
EU-2840 2 4 2 8
Japan 2 2 3 11
New Zealand 2 2 2 11
Russia 5 16 6 10
USA 1 2 2
World 39
The coefficients of variation given in Table 6.1 show the variability relative to the mean and do not provide information about the actual level of the variable itself. It is therefore
also useful to look at the 10th and 90th percentiles of the stochastic simulations (Graph 6.1).

66 E U A G R I C U L T U R A L O U T L O O K
Graph 6.1 Exchange rate USD/EUR (left) and Oil Price in USD/barrel (right)
For yields, the approximated uncertainty is based on the deviation between the yield predicted (ordinary least squares) by the trend, input and output prices and the actual yield. The time period used for this analysis is 1996 to 2014. Correlation between yield errors, for a given crop, is calculated for pairs
of countries in the same regional block, but is assumed to be zero between countries in different regional blocks. The errors correlation is assumed to follow a multivariate truncated normal distribution. Regional blocks are shown in Table 6.2, as well as the coefficient of variation for the yields in year 2025.
Table 6.2 Coefficients of variation for crop yields in 2024 (%)
CV2024 (%)
Europe Black Sea area South America North America South East Asia
Aust
ralia
Chin
a
Indi
a
EU-1
5
EU-N
13
Kaza
khst
an
Ukr
aine
Russ
ia
Arge
ntin
a
Braz
il
Para
guay
Uru
guay
Cana
da
Mex
ico
US
Indo
nesi
a
Mal
aysi
a
Thai
land
Viet
nam
Common wheat 8 20 43 48 23 19 25 43 45 11 9 11 35 6 7
Durum wheat 17 30
Coarse grains 26 25 19
Barley 7 14 24 10 32
Maize 11 41 18 13 7 10 14 6
Oats 9 17 8
Rye 24 19
Other cereals 10 16
Rice 7 6 6 3 3 9
Oilseeds 51 22 31
Rapeseed 11 33 10 36
Soybean 18 50 21 13 17 12
Sunflower seed 9 28 30 15
Palm oil 13 14
Sugar beet 9 12 35 12 17
Sugar cane 14 4 11 21 12 8 10
1
1,1
1,2
1,3
1,4
1,5
1,6
2011
2013
2015
2017
2019
2021
2023
2025
Baseline
90th percentile
10th percentile
20
40
60
80
100
120
140
160
180
2011
2013
2015
2017
2019
2021
2023
2025
Baseline
90th percentile
10th percentile
Step (ii): 1 000 sets of possible values are generated for the stochastic variables.
The second step involves generating 1 000 sets / scenarios of possible values for the stochastic variables, reproducing the variability determined in step (i) for each of the years of the period 2016-2025. During this period, macroeconomic
forecast errors are accumulating over the time. By contrast, yield variations in a given year are independent of what occurred in the previous year.
Step (iii): the AGLINK-COSIMO model is run for each of the 1 000 alternative “uncertainty” scenarios.

67G E N E R A L C O N S E Q U E N C E S O F M A C R O E C O N O M I C A N D Y I E L D U N C E R T A I N T I E S
The third step involves running the AGLINK-COSIMO model for each of the 1 000 alternative “uncertainty” scenarios generated in step (ii). In order to better discern the effect of each source of uncertainty, this is first done only with macroeconomic indicators uncertainties, then only with the yield uncertainties and finally combining both macroeconomic and yield uncertainties. This procedure yielded respectively 926, 917 and 890 successful simulations. In some cases the model does not solve; this occurs as the model is a complex system of equations and policies which, when exposed to extreme shocks for one or several of the stochastic variables, may not find a solution.
6.2. Main impacts of macroeconomic and yield uncertainties
This section presents briefly the global results of the uncertainty (partial stochastic) analysis. Note that some of the results were already presented in the previous sections (for example, the price fans shown in the description of baseline results for each sector and some boxes related to specific subsets).
Yield uncertainty overall affects the crop market balances. It directly alters production; hence demand, imports and exports will adjust accordingly to form a new equilibrium. This effect is
transferred to other commodities such as animal productions (dairy and meat), mainly through feed, but the effect is diluted because of substitution effects.
Livestock production is affected similarly by both, macroeconomic and yield uncertainty; important factors in these markets include the world oil price and protein meals. Biofuels production main driver is the oil price, which has a direct impact on the consumption of biofuels as both are linked through policies such as the blending mandate. Imports and exports are mainly affected by macroeconomic uncertainty, in specific exchange rates, which affect the competitiveness of the EU-28 on world markets through relative prices. This affects mainly those sectors that are well integrated in world trade such as dairy.
For crops prices in the EU28, the reaction is slightly stronger for macroeconomic uncertainties than to yield variation, the effect of both sources of uncertainties simultaneously is the largest although is not additive. In the world markets, yield plays a major role in the price variation, this is because the EU-28 has lower yield variation than other regions of the world (i.e Argentina and the black sea region countries) The effect of the uncertainties comes together at the level of the EU farm income. The CV2025 income per AWU (Annual Working Unit) due to macroeconomic uncertainty is 7.2 %, for yield uncertainty the figure is 6.8 %, combined uncertainties equals to 10.5 %.
Table 6.3 Impact in 2024 of macroeconomic and yield uncertainties on consumption by type of use of agricultural commodities, CV2024 (%)
CV2024 (%)
Consumption Food use Feed use Biofuel use
Mac
ro
Yiel
d
Com
bine
d
Mac
ro
Yiel
d
Com
bine
d
Mac
ro
Yiel
d
Com
bine
d
Mac
ro
Yiel
d
Com
bine
d
Cereals 0.8 1.7 1.9 0.3 0.6 0.7 1.2 3.1 3.4 4.0 7.0 7.7
Wheat 0.8 1.7 1.8 0.3 0.5 0.5 1.2 3.9 4.1 3.7 7.9 8.4
Coarse grains 0.8 1.8 2.0 0.3 0.8 0.9 1.2 2.4 2.7 4.3 6.1 7.0
Oilseeds 0.6 2.1 2.2 0.5 0.5 0.8
Protein meal 0.6 1.7 1.8 0.6 1.7 1.8
Vegetable oils 0.7 2.1 2.3 1.7 2.1 2.8 2.1 3.8 4.6
SugarSugar beet
1.4 0.6 1.2 1.4 0.7 1.2 2.1 0.8 1.8
Meat 0.5 0.2 0.6 0.5 0.2 0.6
Beef and veal 0.5 0.3 0.6 0.5 0.3 0.6
Sheep meat 0.5 0.2 0.5 0.5 0.2 0.5
Pigmeat 0.6 0.1 0.7 0.6 0.1 0.7
Poultry meat 0.4 0.4 0.6 0.4 0.4 0.6
Butter 0.2 0.4 0.4 0.2 0.4 0.4
Cheese 0.5 0.1 0.5 0.5 0.1 0.5
SMP 0.5 0.5 0.7 0.3 0.2 0.3 4.9 8.2 9.5
WMP 0.6 0.2 0.7 0.6 0.2 0.7

68 E U A G R I C U L T U R A L O U T L O O K
Table 6.4 Impact in 2024 of macroeconomic and yield uncertainties on production, consumption and trade of agricultural commodities, CV2024 (%)
CV2024 (%)
Production Consumption Exports Imports
Mac
ro
Yiel
d
Com
bine
d
Mac
ro
Yiel
d
Com
bine
d
Mac
ro
Yiel
d
Com
bine
d
Mac
ro
Yiel
d
Com
bine
d
Cereals 0.6 6.1 6.1 1.4 2.4 2.8 10.1 20.7 22.9 10.9 26.2 27.2
Wheat 1.4 4.2 4.5 0.8 1.7 1.8 6.6 20.2 21.4 1.8 11.9 12.2
Coarse grains 0.3 5.7 5.7 0.8 1.8 2.0 11.1 21.3 23.6 20.1 44.3 45.9
Barley 0.4 3.4 3.5 1.7 2.8 3.1 10.8 24.8 26.9 0.6 2.5 2.7
Maize 0.3 11.0 10.7 2.4 3.5 4.2 12.0 16.7 19.5 20.9 46.1 47.9
Oilseeds 1.1 5.5 5.6 0.6 2.1 2.2 6.8 35.0 35.3 1.1 5.0 5.1
Sunflower 0.8 9.9 9.8 1.0 5.9 5.9 9.6 50.6 51.0 9.7 58.2 58.1
Rapeseed 1.2 7.0 7.1 0.5 3.1 3.2 6.4 50.9 51.7 2.6 19.4 19.8
Soybean 0.9 11.9 11.7 0.9 2.5 2.7 1.1 3.5 3.6
Protein meal 0.3 1.7 1.8 0.6 1.7 1.8 0.5 3.6 3.7 1.1 2.2 2.4
Veg. oils 0.4 2.1 2.2 0.7 2.1 2.3 2.3 9.4 10.0 1.4 5.1 5.4
Sugar 4.6 4.5 1.2 1.4 0.6 1.2 22.3 20.5 8.7 9.4 8.6 4.1
Ethanol 2.7 3.8 4.3 4.1 8.0 8.6 14.5 15.5 21.6 28.6 59.3 60.6
Biodiesel 2.0 3.7 4.5 2.0 3.8 4.5 43.3 18.8 45.0 18.5 8.8 19.7
Meat 0.4 0.5 0.6 0.5 0.2 0.6 3.0 3.6 4.7 2.8 1.6 3.3
Beef 0.4 0.6 0.7 0.5 0.3 0.6 6.2 7.0 9.4 3.9 3.4 5.5
Sheep meat 0.3 0.1 0.3 0.5 0.2 0.5 0.1 0.1 0.2 2.7 1.4 3.1
Pigmeat 0.5 0.5 0.7 0.6 0.1 0.7 3.3 3.9 5.0 4.2 1.3 4.4
Poultry meat 0.4 0.6 0.8 0.4 0.4 0.6 2.5 3.4 4.1 0.2 0.3 0.4
Milk 0.4 0.4 0.6
Butter 0.6 0.7 0.9 0.2 0.4 0.4 7.9 6.3 10.1 4.0 7.6 8.8
Cheese 0.5 0.2 0.6 0.5 0.1 0.5 1.6 2.5 3.0 4.1 3.1 5.2
SMP 0.7 1.5 1.7 0.5 0.5 0.7 1.5 3.4 3.8
WMP 2.7 2.4 3.6 0.6 0.2 0.7 5.4 4.2 6.9
Table 6.5 Impact in 2024 of macroeconomic and yield uncertainties on EU domestic and world prices of agricultural commodities, CV2024 (%)
CV2024 (%)EU-28 domestic price World price
Macro Yield Combined Macro Yield Combined
Cereals 9.5 8.8 13.1 4.6 9.2 10.0
Wheat 10.1 9.0 13.7 4.0 8.7 9.5
Coarse grains 8.8 8.6 12.6 5.2 9.7 10.6
Barley 10.3 8.7 13.4 5.1 9.3 10.3
Maize 8.0 8.7 12.3
Oilseeds 12.6 12.9 19.2 5.4 12.4 13.7
Sunflower 11.6 14.3 18.9
Rapeseed 13.1 14.7 21.1
Soybean 12.4 11.5 17.3
Protein meal 10.3 7.8 13.0 3.7 8.2 8.9
Vegetable oils 14.0 10.2 18.2 6.5 12.1 14.2
Sugar (White) 9.6 4.6 10.8 3.2 3.1 4.5
Ethanol 16.0 8.6 17.8 14.4 3.9 15.2
Biodiesel 14.1 9.2 17.8 26.0 5.1 25.8
Meats 11.5 3.8 12.4 3.0 2.8 4.3
Beef and veal 12.0 6.4 13.9
Sheep meat 11.6 1.9 11.9 3.6 1.8 4.1
Pigmeat 12.9 3.2 13.5
Poultry meat 9.6 3.8 10.4 2.4 3.9 4.5
Milk 11.7 3.5 12.2
Butter 10.9 4.1 11.7 4.3 3.7 5.7
Cheese 12.1 3.4 12.6 4.3 2.6 5.0
SMP 12.4 3.2 12.8 4.3 2.7 5.1
WMP 12.8 2.9 13.1 5.6 2.5 6.1
69G E N E R A L C O N S E Q U E N C E S O F M A C R O E C O N O M I C A N D Y I E L D U N C E R T A I N T I E S
70 E U A G R I C U L T U R A L O U T L O O K
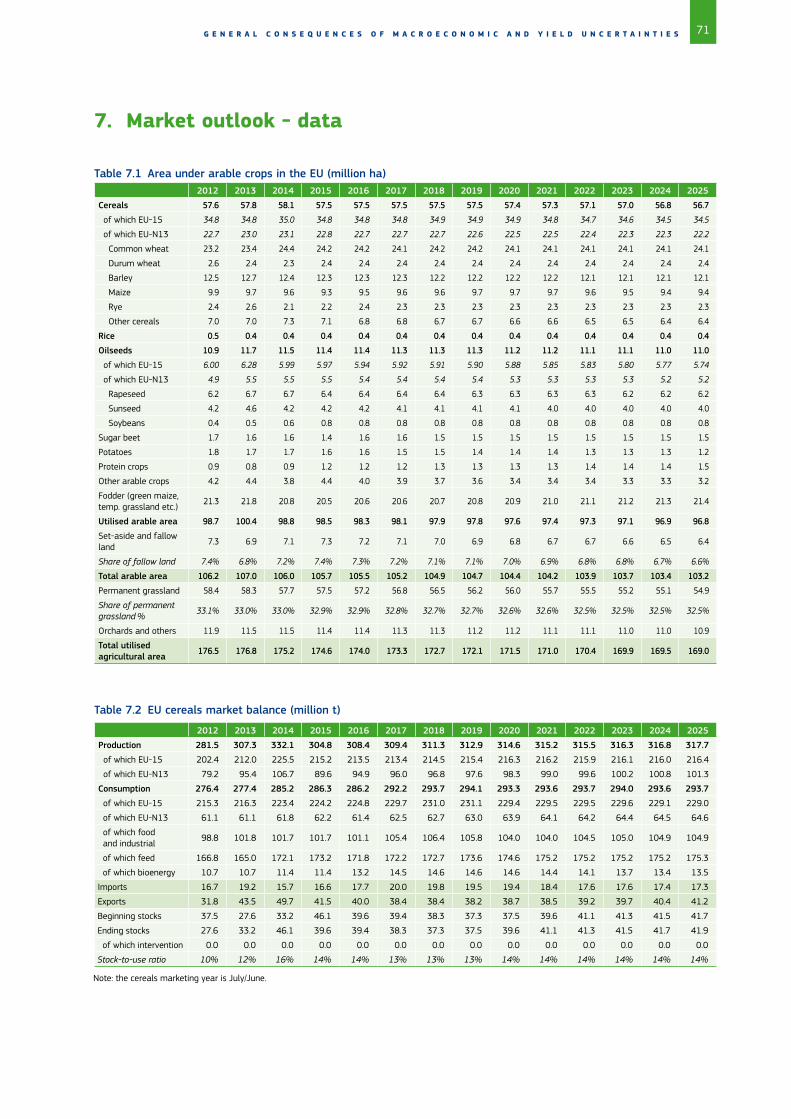
71G E N E R A L C O N S E Q U E N C E S O F M A C R O E C O N O M I C A N D Y I E L D U N C E R T A I N T I E S
7. Market outlook - data
Table 7.1 Area under arable crops in the EU (million ha)2012 2013 2014 2015 2016 2017 2018 2019 2020 2021 2022 2023 2024 2025
Cereals 57.6 57.8 58.1 57.5 57.5 57.5 57.5 57.5 57.4 57.3 57.1 57.0 56.8 56.7
of which EU-15 34.8 34.8 35.0 34.8 34.8 34.8 34.9 34.9 34.9 34.8 34.7 34.6 34.5 34.5
of which EU-N13 22.7 23.0 23.1 22.8 22.7 22.7 22.7 22.6 22.5 22.5 22.4 22.3 22.3 22.2
Common wheat 23.2 23.4 24.4 24.2 24.2 24.1 24.2 24.2 24.1 24.1 24.1 24.1 24.1 24.1
Durum wheat 2.6 2.4 2.3 2.4 2.4 2.4 2.4 2.4 2.4 2.4 2.4 2.4 2.4 2.4
Barley 12.5 12.7 12.4 12.3 12.3 12.3 12.2 12.2 12.2 12.2 12.1 12.1 12.1 12.1
Maize 9.9 9.7 9.6 9.3 9.5 9.6 9.6 9.7 9.7 9.7 9.6 9.5 9.4 9.4
Rye 2.4 2.6 2.1 2.2 2.4 2.3 2.3 2.3 2.3 2.3 2.3 2.3 2.3 2.3
Other cereals 7.0 7.0 7.3 7.1 6.8 6.8 6.7 6.7 6.6 6.6 6.5 6.5 6.4 6.4
Rice 0.5 0.4 0.4 0.4 0.4 0.4 0.4 0.4 0.4 0.4 0.4 0.4 0.4 0.4
Oilseeds 10.9 11.7 11.5 11.4 11.4 11.3 11.3 11.3 11.2 11.2 11.1 11.1 11.0 11.0
of which EU-15 6.00 6.28 5.99 5.97 5.94 5.92 5.91 5.90 5.88 5.85 5.83 5.80 5.77 5.74
of which EU-N13 4.9 5.5 5.5 5.5 5.4 5.4 5.4 5.4 5.3 5.3 5.3 5.3 5.2 5.2
Rapeseed 6.2 6.7 6.7 6.4 6.4 6.4 6.4 6.3 6.3 6.3 6.3 6.2 6.2 6.2
Sunseed 4.2 4.6 4.2 4.2 4.2 4.1 4.1 4.1 4.1 4.0 4.0 4.0 4.0 4.0
Soybeans 0.4 0.5 0.6 0.8 0.8 0.8 0.8 0.8 0.8 0.8 0.8 0.8 0.8 0.8
Sugar beet 1.7 1.6 1.6 1.4 1.6 1.6 1.5 1.5 1.5 1.5 1.5 1.5 1.5 1.5
Potatoes 1.8 1.7 1.7 1.6 1.6 1.5 1.5 1.4 1.4 1.4 1.3 1.3 1.3 1.2
Protein crops 0.9 0.8 0.9 1.2 1.2 1.2 1.3 1.3 1.3 1.3 1.4 1.4 1.4 1.5
Other arable crops 4.2 4.4 3.8 4.4 4.0 3.9 3.7 3.6 3.4 3.4 3.4 3.3 3.3 3.2
Fodder (green maize, temp. grassland etc.)
21.3 21.8 20.8 20.5 20.6 20.6 20.7 20.8 20.9 21.0 21.1 21.2 21.3 21.4
Utilised arable area 98.7 100.4 98.8 98.5 98.3 98.1 97.9 97.8 97.6 97.4 97.3 97.1 96.9 96.8
Set-aside and fallow land
7.3 6.9 7.1 7.3 7.2 7.1 7.0 6.9 6.8 6.7 6.7 6.6 6.5 6.4
Share of fallow land 7.4% 6.8% 7.2% 7.4% 7.3% 7.2% 7.1% 7.1% 7.0% 6.9% 6.8% 6.8% 6.7% 6.6%
Total arable area 106.2 107.0 106.0 105.7 105.5 105.2 104.9 104.7 104.4 104.2 103.9 103.7 103.4 103.2
Permanent grassland 58.4 58.3 57.7 57.5 57.2 56.8 56.5 56.2 56.0 55.7 55.5 55.2 55.1 54.9
Share of permanent grassland %
33.1% 33.0% 33.0% 32.9% 32.9% 32.8% 32.7% 32.7% 32.6% 32.6% 32.5% 32.5% 32.5% 32.5%
Orchards and others 11.9 11.5 11.5 11.4 11.4 11.3 11.3 11.2 11.2 11.1 11.1 11.0 11.0 10.9
Total utilised agricultural area 176.5 176.8 175.2 174.6 174.0 173.3 172.7 172.1 171.5 171.0 170.4 169.9 169.5 169.0
Table 7.2 EU cereals market balance (million t)
2012 2013 2014 2015 2016 2017 2018 2019 2020 2021 2022 2023 2024 2025
Production 281.5 307.3 332.1 304.8 308.4 309.4 311.3 312.9 314.6 315.2 315.5 316.3 316.8 317.7
of which EU-15 202.4 212.0 225.5 215.2 213.5 213.4 214.5 215.4 216.3 216.2 215.9 216.1 216.0 216.4
of which EU-N13 79.2 95.4 106.7 89.6 94.9 96.0 96.8 97.6 98.3 99.0 99.6 100.2 100.8 101.3
Consumption 276.4 277.4 285.2 286.3 286.2 292.2 293.7 294.1 293.3 293.6 293.7 294.0 293.6 293.7
of which EU-15 215.3 216.3 223.4 224.2 224.8 229.7 231.0 231.1 229.4 229.5 229.5 229.6 229.1 229.0
of which EU-N13 61.1 61.1 61.8 62.2 61.4 62.5 62.7 63.0 63.9 64.1 64.2 64.4 64.5 64.6
of which food and industrial
98.8 101.8 101.7 101.7 101.1 105.4 106.4 105.8 104.0 104.0 104.5 105.0 104.9 104.9
of which feed 166.8 165.0 172.1 173.2 171.8 172.2 172.7 173.6 174.6 175.2 175.2 175.2 175.2 175.3
of which bioenergy 10.7 10.7 11.4 11.4 13.2 14.5 14.6 14.6 14.6 14.4 14.1 13.7 13.4 13.5
Imports 16.7 19.2 15.7 16.6 17.7 20.0 19.8 19.5 19.4 18.4 17.6 17.6 17.4 17.3
Exports 31.8 43.5 49.7 41.5 40.0 38.4 38.4 38.2 38.7 38.5 39.2 39.7 40.4 41.2
Beginning stocks 37.5 27.6 33.2 46.1 39.6 39.4 38.3 37.3 37.5 39.6 41.1 41.3 41.5 41.7
Ending stocks 27.6 33.2 46.1 39.6 39.4 38.3 37.3 37.5 39.6 41.1 41.3 41.5 41.7 41.9
of which intervention 0.0 0.0 0.0 0.0 0.0 0.0 0.0 0.0 0.0 0.0 0.0 0.0 0.0 0.0
Stock-to-use ratio 10% 12% 16% 14% 14% 13% 13% 13% 14% 14% 14% 14% 14% 14%
Note: the cereals marketing year is July/June.
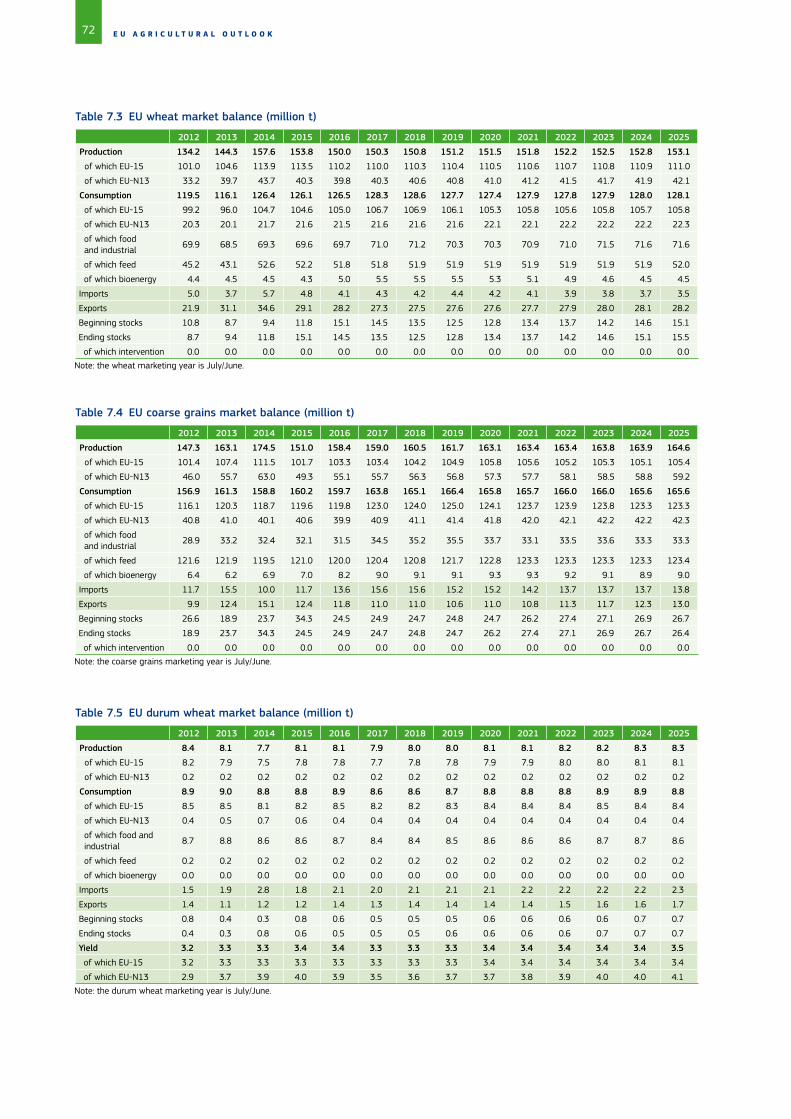
72 E U A G R I C U L T U R A L O U T L O O K
Table 7.3 EU wheat market balance (million t)
2012 2013 2014 2015 2016 2017 2018 2019 2020 2021 2022 2023 2024 2025
Production 134.2 144.3 157.6 153.8 150.0 150.3 150.8 151.2 151.5 151.8 152.2 152.5 152.8 153.1
of which EU-15 101.0 104.6 113.9 113.5 110.2 110.0 110.3 110.4 110.5 110.6 110.7 110.8 110.9 111.0
of which EU-N13 33.2 39.7 43.7 40.3 39.8 40.3 40.6 40.8 41.0 41.2 41.5 41.7 41.9 42.1
Consumption 119.5 116.1 126.4 126.1 126.5 128.3 128.6 127.7 127.4 127.9 127.8 127.9 128.0 128.1
of which EU-15 99.2 96.0 104.7 104.6 105.0 106.7 106.9 106.1 105.3 105.8 105.6 105.8 105.7 105.8
of which EU-N13 20.3 20.1 21.7 21.6 21.5 21.6 21.6 21.6 22.1 22.1 22.2 22.2 22.2 22.3
of which food and industrial
69.9 68.5 69.3 69.6 69.7 71.0 71.2 70.3 70.3 70.9 71.0 71.5 71.6 71.6
of which feed 45.2 43.1 52.6 52.2 51.8 51.8 51.9 51.9 51.9 51.9 51.9 51.9 51.9 52.0
of which bioenergy 4.4 4.5 4.5 4.3 5.0 5.5 5.5 5.5 5.3 5.1 4.9 4.6 4.5 4.5
Imports 5.0 3.7 5.7 4.8 4.1 4.3 4.2 4.4 4.2 4.1 3.9 3.8 3.7 3.5
Exports 21.9 31.1 34.6 29.1 28.2 27.3 27.5 27.6 27.6 27.7 27.9 28.0 28.1 28.2
Beginning stocks 10.8 8.7 9.4 11.8 15.1 14.5 13.5 12.5 12.8 13.4 13.7 14.2 14.6 15.1
Ending stocks 8.7 9.4 11.8 15.1 14.5 13.5 12.5 12.8 13.4 13.7 14.2 14.6 15.1 15.5
of which intervention 0.0 0.0 0.0 0.0 0.0 0.0 0.0 0.0 0.0 0.0 0.0 0.0 0.0 0.0
Note: the wheat marketing year is July/June.
Table 7.4 EU coarse grains market balance (million t)
2012 2013 2014 2015 2016 2017 2018 2019 2020 2021 2022 2023 2024 2025
Production 147.3 163.1 174.5 151.0 158.4 159.0 160.5 161.7 163.1 163.4 163.4 163.8 163.9 164.6
of which EU-15 101.4 107.4 111.5 101.7 103.3 103.4 104.2 104.9 105.8 105.6 105.2 105.3 105.1 105.4
of which EU-N13 46.0 55.7 63.0 49.3 55.1 55.7 56.3 56.8 57.3 57.7 58.1 58.5 58.8 59.2
Consumption 156.9 161.3 158.8 160.2 159.7 163.8 165.1 166.4 165.8 165.7 166.0 166.0 165.6 165.6
of which EU-15 116.1 120.3 118.7 119.6 119.8 123.0 124.0 125.0 124.1 123.7 123.9 123.8 123.3 123.3
of which EU-N13 40.8 41.0 40.1 40.6 39.9 40.9 41.1 41.4 41.8 42.0 42.1 42.2 42.2 42.3
of which food and industrial
28.9 33.2 32.4 32.1 31.5 34.5 35.2 35.5 33.7 33.1 33.5 33.6 33.3 33.3
of which feed 121.6 121.9 119.5 121.0 120.0 120.4 120.8 121.7 122.8 123.3 123.3 123.3 123.3 123.4
of which bioenergy 6.4 6.2 6.9 7.0 8.2 9.0 9.1 9.1 9.3 9.3 9.2 9.1 8.9 9.0
Imports 11.7 15.5 10.0 11.7 13.6 15.6 15.6 15.2 15.2 14.2 13.7 13.7 13.7 13.8
Exports 9.9 12.4 15.1 12.4 11.8 11.0 11.0 10.6 11.0 10.8 11.3 11.7 12.3 13.0
Beginning stocks 26.6 18.9 23.7 34.3 24.5 24.9 24.7 24.8 24.7 26.2 27.4 27.1 26.9 26.7
Ending stocks 18.9 23.7 34.3 24.5 24.9 24.7 24.8 24.7 26.2 27.4 27.1 26.9 26.7 26.4
of which intervention 0.0 0.0 0.0 0.0 0.0 0.0 0.0 0.0 0.0 0.0 0.0 0.0 0.0 0.0
Note: the coarse grains marketing year is July/June.
Table 7.5 EU durum wheat market balance (million t)
2012 2013 2014 2015 2016 2017 2018 2019 2020 2021 2022 2023 2024 2025
Production 8.4 8.1 7.7 8.1 8.1 7.9 8.0 8.0 8.1 8.1 8.2 8.2 8.3 8.3
of which EU-15 8.2 7.9 7.5 7.8 7.8 7.7 7.8 7.8 7.9 7.9 8.0 8.0 8.1 8.1
of which EU-N13 0.2 0.2 0.2 0.2 0.2 0.2 0.2 0.2 0.2 0.2 0.2 0.2 0.2 0.2
Consumption 8.9 9.0 8.8 8.8 8.9 8.6 8.6 8.7 8.8 8.8 8.8 8.9 8.9 8.8
of which EU-15 8.5 8.5 8.1 8.2 8.5 8.2 8.2 8.3 8.4 8.4 8.4 8.5 8.4 8.4
of which EU-N13 0.4 0.5 0.7 0.6 0.4 0.4 0.4 0.4 0.4 0.4 0.4 0.4 0.4 0.4
of which food and industrial
8.7 8.8 8.6 8.6 8.7 8.4 8.4 8.5 8.6 8.6 8.6 8.7 8.7 8.6
of which feed 0.2 0.2 0.2 0.2 0.2 0.2 0.2 0.2 0.2 0.2 0.2 0.2 0.2 0.2
of which bioenergy 0.0 0.0 0.0 0.0 0.0 0.0 0.0 0.0 0.0 0.0 0.0 0.0 0.0 0.0
Imports 1.5 1.9 2.8 1.8 2.1 2.0 2.1 2.1 2.1 2.2 2.2 2.2 2.2 2.3
Exports 1.4 1.1 1.2 1.2 1.4 1.3 1.4 1.4 1.4 1.4 1.5 1.6 1.6 1.7
Beginning stocks 0.8 0.4 0.3 0.8 0.6 0.5 0.5 0.5 0.6 0.6 0.6 0.6 0.7 0.7
Ending stocks 0.4 0.3 0.8 0.6 0.5 0.5 0.5 0.6 0.6 0.6 0.6 0.7 0.7 0.7
Yield 3.2 3.3 3.3 3.4 3.4 3.3 3.3 3.3 3.4 3.4 3.4 3.4 3.4 3.5
of which EU-15 3.2 3.3 3.3 3.3 3.3 3.3 3.3 3.3 3.4 3.4 3.4 3.4 3.4 3.4
of which EU-N13 2.9 3.7 3.9 4.0 3.9 3.5 3.6 3.7 3.7 3.8 3.9 4.0 4.0 4.1
Note: the durum wheat marketing year is July/June.
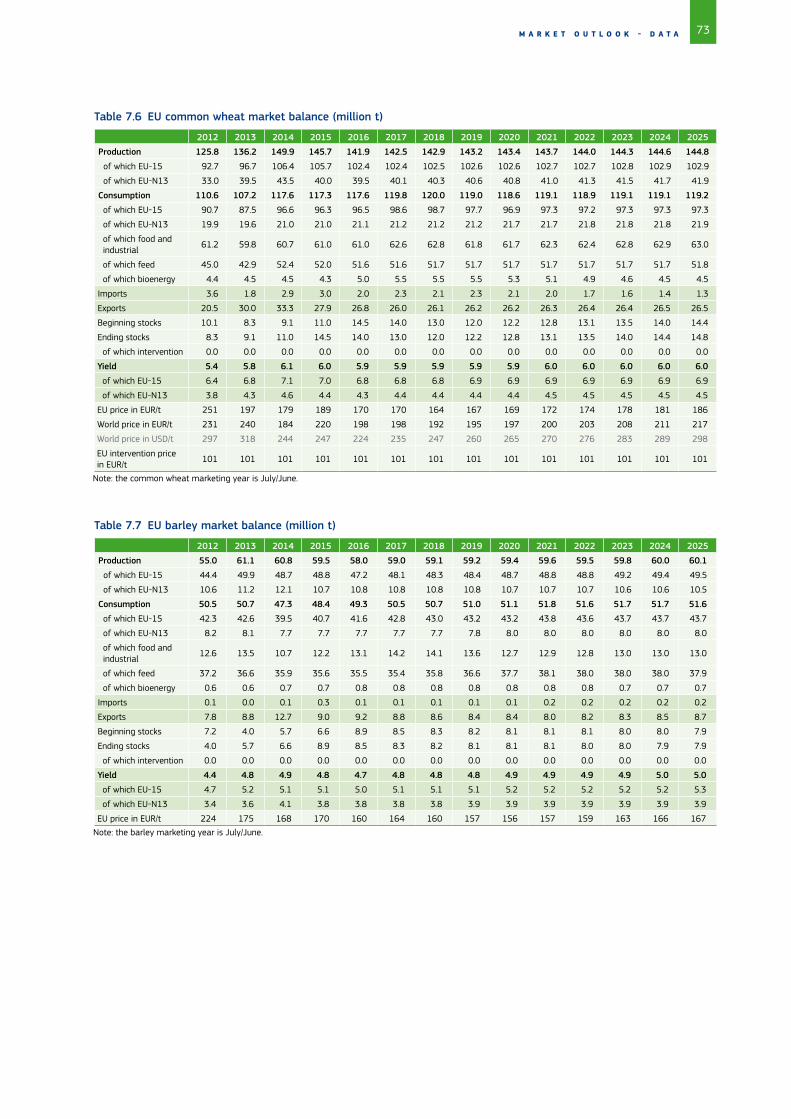
73M A R K E T O U T L O O K - D A T A
Table 7.6 EU common wheat market balance (million t)
2012 2013 2014 2015 2016 2017 2018 2019 2020 2021 2022 2023 2024 2025
Production 125.8 136.2 149.9 145.7 141.9 142.5 142.9 143.2 143.4 143.7 144.0 144.3 144.6 144.8
of which EU-15 92.7 96.7 106.4 105.7 102.4 102.4 102.5 102.6 102.6 102.7 102.7 102.8 102.9 102.9
of which EU-N13 33.0 39.5 43.5 40.0 39.5 40.1 40.3 40.6 40.8 41.0 41.3 41.5 41.7 41.9
Consumption 110.6 107.2 117.6 117.3 117.6 119.8 120.0 119.0 118.6 119.1 118.9 119.1 119.1 119.2
of which EU-15 90.7 87.5 96.6 96.3 96.5 98.6 98.7 97.7 96.9 97.3 97.2 97.3 97.3 97.3
of which EU-N13 19.9 19.6 21.0 21.0 21.1 21.2 21.2 21.2 21.7 21.7 21.8 21.8 21.8 21.9
of which food and industrial
61.2 59.8 60.7 61.0 61.0 62.6 62.8 61.8 61.7 62.3 62.4 62.8 62.9 63.0
of which feed 45.0 42.9 52.4 52.0 51.6 51.6 51.7 51.7 51.7 51.7 51.7 51.7 51.7 51.8
of which bioenergy 4.4 4.5 4.5 4.3 5.0 5.5 5.5 5.5 5.3 5.1 4.9 4.6 4.5 4.5
Imports 3.6 1.8 2.9 3.0 2.0 2.3 2.1 2.3 2.1 2.0 1.7 1.6 1.4 1.3
Exports 20.5 30.0 33.3 27.9 26.8 26.0 26.1 26.2 26.2 26.3 26.4 26.4 26.5 26.5
Beginning stocks 10.1 8.3 9.1 11.0 14.5 14.0 13.0 12.0 12.2 12.8 13.1 13.5 14.0 14.4
Ending stocks 8.3 9.1 11.0 14.5 14.0 13.0 12.0 12.2 12.8 13.1 13.5 14.0 14.4 14.8
of which intervention 0.0 0.0 0.0 0.0 0.0 0.0 0.0 0.0 0.0 0.0 0.0 0.0 0.0 0.0
Yield 5.4 5.8 6.1 6.0 5.9 5.9 5.9 5.9 5.9 6.0 6.0 6.0 6.0 6.0
of which EU-15 6.4 6.8 7.1 7.0 6.8 6.8 6.8 6.9 6.9 6.9 6.9 6.9 6.9 6.9
of which EU-N13 3.8 4.3 4.6 4.4 4.3 4.4 4.4 4.4 4.4 4.5 4.5 4.5 4.5 4.5
EU price in EUR/t 251 197 179 189 170 170 164 167 169 172 174 178 181 186
World price in EUR/t 231 240 184 220 198 198 192 195 197 200 203 208 211 217
World price in USD/t 297 318 244 247 224 235 247 260 265 270 276 283 289 298
EU intervention price in EUR/t
101 101 101 101 101 101 101 101 101 101 101 101 101 101
Note: the common wheat marketing year is July/June.
Table 7.7 EU barley market balance (million t)
2012 2013 2014 2015 2016 2017 2018 2019 2020 2021 2022 2023 2024 2025
Production 55.0 61.1 60.8 59.5 58.0 59.0 59.1 59.2 59.4 59.6 59.5 59.8 60.0 60.1
of which EU-15 44.4 49.9 48.7 48.8 47.2 48.1 48.3 48.4 48.7 48.8 48.8 49.2 49.4 49.5
of which EU-N13 10.6 11.2 12.1 10.7 10.8 10.8 10.8 10.8 10.7 10.7 10.7 10.6 10.6 10.5
Consumption 50.5 50.7 47.3 48.4 49.3 50.5 50.7 51.0 51.1 51.8 51.6 51.7 51.7 51.6
of which EU-15 42.3 42.6 39.5 40.7 41.6 42.8 43.0 43.2 43.2 43.8 43.6 43.7 43.7 43.7
of which EU-N13 8.2 8.1 7.7 7.7 7.7 7.7 7.7 7.8 8.0 8.0 8.0 8.0 8.0 8.0
of which food and industrial
12.6 13.5 10.7 12.2 13.1 14.2 14.1 13.6 12.7 12.9 12.8 13.0 13.0 13.0
of which feed 37.2 36.6 35.9 35.6 35.5 35.4 35.8 36.6 37.7 38.1 38.0 38.0 38.0 37.9
of which bioenergy 0.6 0.6 0.7 0.7 0.8 0.8 0.8 0.8 0.8 0.8 0.8 0.7 0.7 0.7
Imports 0.1 0.0 0.1 0.3 0.1 0.1 0.1 0.1 0.1 0.2 0.2 0.2 0.2 0.2
Exports 7.8 8.8 12.7 9.0 9.2 8.8 8.6 8.4 8.4 8.0 8.2 8.3 8.5 8.7
Beginning stocks 7.2 4.0 5.7 6.6 8.9 8.5 8.3 8.2 8.1 8.1 8.1 8.0 8.0 7.9
Ending stocks 4.0 5.7 6.6 8.9 8.5 8.3 8.2 8.1 8.1 8.1 8.0 8.0 7.9 7.9
of which intervention 0.0 0.0 0.0 0.0 0.0 0.0 0.0 0.0 0.0 0.0 0.0 0.0 0.0 0.0
Yield 4.4 4.8 4.9 4.8 4.7 4.8 4.8 4.8 4.9 4.9 4.9 4.9 5.0 5.0
of which EU-15 4.7 5.2 5.1 5.1 5.0 5.1 5.1 5.1 5.2 5.2 5.2 5.2 5.2 5.3
of which EU-N13 3.4 3.6 4.1 3.8 3.8 3.8 3.8 3.9 3.9 3.9 3.9 3.9 3.9 3.9
EU price in EUR/t 224 175 168 170 160 164 160 157 156 157 159 163 166 167
Note: the barley marketing year is July/June.
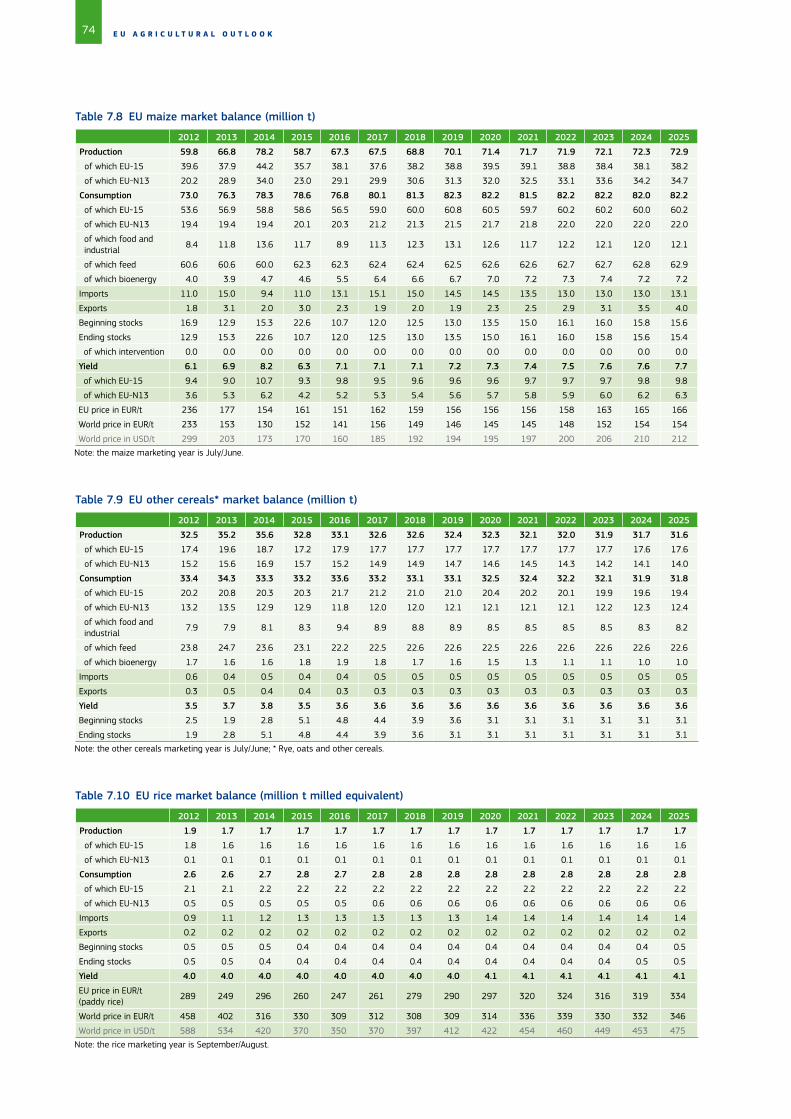
74 E U A G R I C U L T U R A L O U T L O O K
Table 7.8 EU maize market balance (million t)
2012 2013 2014 2015 2016 2017 2018 2019 2020 2021 2022 2023 2024 2025
Production 59.8 66.8 78.2 58.7 67.3 67.5 68.8 70.1 71.4 71.7 71.9 72.1 72.3 72.9
of which EU-15 39.6 37.9 44.2 35.7 38.1 37.6 38.2 38.8 39.5 39.1 38.8 38.4 38.1 38.2
of which EU-N13 20.2 28.9 34.0 23.0 29.1 29.9 30.6 31.3 32.0 32.5 33.1 33.6 34.2 34.7
Consumption 73.0 76.3 78.3 78.6 76.8 80.1 81.3 82.3 82.2 81.5 82.2 82.2 82.0 82.2
of which EU-15 53.6 56.9 58.8 58.6 56.5 59.0 60.0 60.8 60.5 59.7 60.2 60.2 60.0 60.2
of which EU-N13 19.4 19.4 19.4 20.1 20.3 21.2 21.3 21.5 21.7 21.8 22.0 22.0 22.0 22.0
of which food and industrial
8.4 11.8 13.6 11.7 8.9 11.3 12.3 13.1 12.6 11.7 12.2 12.1 12.0 12.1
of which feed 60.6 60.6 60.0 62.3 62.3 62.4 62.4 62.5 62.6 62.6 62.7 62.7 62.8 62.9
of which bioenergy 4.0 3.9 4.7 4.6 5.5 6.4 6.6 6.7 7.0 7.2 7.3 7.4 7.2 7.2
Imports 11.0 15.0 9.4 11.0 13.1 15.1 15.0 14.5 14.5 13.5 13.0 13.0 13.0 13.1
Exports 1.8 3.1 2.0 3.0 2.3 1.9 2.0 1.9 2.3 2.5 2.9 3.1 3.5 4.0
Beginning stocks 16.9 12.9 15.3 22.6 10.7 12.0 12.5 13.0 13.5 15.0 16.1 16.0 15.8 15.6
Ending stocks 12.9 15.3 22.6 10.7 12.0 12.5 13.0 13.5 15.0 16.1 16.0 15.8 15.6 15.4
of which intervention 0.0 0.0 0.0 0.0 0.0 0.0 0.0 0.0 0.0 0.0 0.0 0.0 0.0 0.0
Yield 6.1 6.9 8.2 6.3 7.1 7.1 7.1 7.2 7.3 7.4 7.5 7.6 7.6 7.7
of which EU-15 9.4 9.0 10.7 9.3 9.8 9.5 9.6 9.6 9.6 9.7 9.7 9.7 9.8 9.8
of which EU-N13 3.6 5.3 6.2 4.2 5.2 5.3 5.4 5.6 5.7 5.8 5.9 6.0 6.2 6.3
EU price in EUR/t 236 177 154 161 151 162 159 156 156 156 158 163 165 166
World price in EUR/t 233 153 130 152 141 156 149 146 145 145 148 152 154 154
World price in USD/t 299 203 173 170 160 185 192 194 195 197 200 206 210 212
Note: the maize marketing year is July/June.
Table 7.9 EU other cereals* market balance (million t)
2012 2013 2014 2015 2016 2017 2018 2019 2020 2021 2022 2023 2024 2025
Production 32.5 35.2 35.6 32.8 33.1 32.6 32.6 32.4 32.3 32.1 32.0 31.9 31.7 31.6
of which EU-15 17.4 19.6 18.7 17.2 17.9 17.7 17.7 17.7 17.7 17.7 17.7 17.7 17.6 17.6
of which EU-N13 15.2 15.6 16.9 15.7 15.2 14.9 14.9 14.7 14.6 14.5 14.3 14.2 14.1 14.0
Consumption 33.4 34.3 33.3 33.2 33.6 33.2 33.1 33.1 32.5 32.4 32.2 32.1 31.9 31.8
of which EU-15 20.2 20.8 20.3 20.3 21.7 21.2 21.0 21.0 20.4 20.2 20.1 19.9 19.6 19.4
of which EU-N13 13.2 13.5 12.9 12.9 11.8 12.0 12.0 12.1 12.1 12.1 12.1 12.2 12.3 12.4
of which food and industrial
7.9 7.9 8.1 8.3 9.4 8.9 8.8 8.9 8.5 8.5 8.5 8.5 8.3 8.2
of which feed 23.8 24.7 23.6 23.1 22.2 22.5 22.6 22.6 22.5 22.6 22.6 22.6 22.6 22.6
of which bioenergy 1.7 1.6 1.6 1.8 1.9 1.8 1.7 1.6 1.5 1.3 1.1 1.1 1.0 1.0
Imports 0.6 0.4 0.5 0.4 0.4 0.5 0.5 0.5 0.5 0.5 0.5 0.5 0.5 0.5
Exports 0.3 0.5 0.4 0.4 0.3 0.3 0.3 0.3 0.3 0.3 0.3 0.3 0.3 0.3
Yield 3.5 3.7 3.8 3.5 3.6 3.6 3.6 3.6 3.6 3.6 3.6 3.6 3.6 3.6
Beginning stocks 2.5 1.9 2.8 5.1 4.8 4.4 3.9 3.6 3.1 3.1 3.1 3.1 3.1 3.1
Ending stocks 1.9 2.8 5.1 4.8 4.4 3.9 3.6 3.1 3.1 3.1 3.1 3.1 3.1 3.1
Note: the other cereals marketing year is July/June; * Rye, oats and other cereals.
Table 7.10 EU rice market balance (million t milled equivalent)
2012 2013 2014 2015 2016 2017 2018 2019 2020 2021 2022 2023 2024 2025
Production 1.9 1.7 1.7 1.7 1.7 1.7 1.7 1.7 1.7 1.7 1.7 1.7 1.7 1.7
of which EU-15 1.8 1.6 1.6 1.6 1.6 1.6 1.6 1.6 1.6 1.6 1.6 1.6 1.6 1.6
of which EU-N13 0.1 0.1 0.1 0.1 0.1 0.1 0.1 0.1 0.1 0.1 0.1 0.1 0.1 0.1
Consumption 2.6 2.6 2.7 2.8 2.7 2.8 2.8 2.8 2.8 2.8 2.8 2.8 2.8 2.8
of which EU-15 2.1 2.1 2.2 2.2 2.2 2.2 2.2 2.2 2.2 2.2 2.2 2.2 2.2 2.2
of which EU-N13 0.5 0.5 0.5 0.5 0.5 0.6 0.6 0.6 0.6 0.6 0.6 0.6 0.6 0.6
Imports 0.9 1.1 1.2 1.3 1.3 1.3 1.3 1.3 1.4 1.4 1.4 1.4 1.4 1.4
Exports 0.2 0.2 0.2 0.2 0.2 0.2 0.2 0.2 0.2 0.2 0.2 0.2 0.2 0.2
Beginning stocks 0.5 0.5 0.5 0.4 0.4 0.4 0.4 0.4 0.4 0.4 0.4 0.4 0.4 0.5
Ending stocks 0.5 0.5 0.4 0.4 0.4 0.4 0.4 0.4 0.4 0.4 0.4 0.4 0.5 0.5
Yield 4.0 4.0 4.0 4.0 4.0 4.0 4.0 4.0 4.1 4.1 4.1 4.1 4.1 4.1
EU price in EUR/t (paddy rice)
289 249 296 260 247 261 279 290 297 320 324 316 319 334
World price in EUR/t 458 402 316 330 309 312 308 309 314 336 339 330 332 346
World price in USD/t 588 534 420 370 350 370 397 412 422 454 460 449 453 475
Note: the rice marketing year is September/August.

75M A R K E T O U T L O O K - D A T A
Table 7.11 EU oilseed* (grains and beans) market balance (million t)
2012 2013 2014 2015 2016 2017 2018 2019 2020 2021 2022 2023 2024 2025
Production 27.3 31.4 35.2 30.9 30.7 30.8 30.8 30.9 30.9 30.9 30.9 30.9 30.8 30.8
of which EU-15 17.4 17.9 20.1 18.0 18.3 18.3 18.3 18.4 18.3 18.3 18.2 18.2 18.1 18.1
of which EU-N13 9.9 13.5 15.1 12.9 12.4 12.4 12.5 12.5 12.6 12.6 12.7 12.7 12.7 12.7
Rapeseed 19.2 21.0 24.3 21.1 20.6 20.6 20.6 20.6 20.6 20.6 20.6 20.5 20.5 20.5
Sunseed 7.1 9.2 9.1 7.7 7.9 7.9 7.9 7.9 7.9 7.9 7.9 7.9 7.9 7.8
Soybeans 1.0 1.2 1.9 2.1 2.2 2.3 2.3 2.4 2.4 2.4 2.4 2.4 2.4 2.4
Consumption 44.7 47.4 49.1 48.1 47.6 47.5 47.6 47.8 47.9 48.0 48.0 48.0 48.0 48.0
of which EU-15 37.9 40.1 40.1 40.5 40.1 40.1 40.2 40.3 40.4 40.4 40.5 40.5 40.5 40.5
of which EU-N13 6.8 7.3 9.0 7.6 7.4 7.4 7.4 7.5 7.5 7.5 7.5 7.5 7.5 7.5
of which crushing 40.9 43.7 45.2 44.0 43.6 43.5 43.6 43.7 43.7 43.8 43.9 43.9 44.0 44.0
Imports 16.7 18.0 16.1 17.2 17.6 17.6 17.7 17.7 17.8 17.9 17.9 18.0 18.0 18.1
Exports 0.6 1.1 1.3 1.0 0.9 0.9 0.9 0.9 0.9 0.9 0.9 0.9 0.9 0.9
Beginning stocks 4.5 3.1 3.4 3.2 3.2 3.2 3.2 3.2 3.2 3.2 3.1 3.1 3.1 3.0
Ending stocks 3.1 3.4 3.2 3.2 3.2 3.2 3.2 3.2 3.2 3.1 3.1 3.1 3.0 3.0
EU price in EUR/t (rapeseed)
452 374 360 375 332 347 359 343 339 347 355 368 375 386
World price in EUR/t 455 385 329 360 319 333 345 329 325 333 341 354 360 371
World price in USD/t 585 512 437 403 361 396 444 438 437 451 462 481 492 508
Note: the oilseed marketing year is July/June; * Rapeseed, soybean, sunflower seed and groundnuts.
Table 7.12 EU oilseed yields (million t)
2012 2013 2014 2015 2016 2017 2018 2019 2020 2021 2022 2023 2024 2025
Rapeseed 3.1 3.1 3.6 3.3 3.2 3.2 3.2 3.3 3.3 3.3 3.3 3.3 3.3 3.3
of which EU-15 3.4 3.4 3.9 3.6 3.6 3.6 3.6 3.6 3.6 3.6 3.6 3.6 3.6 3.6
of which EU-N13 2.5 2.8 3.1 2.8 2.6 2.6 2.7 2.7 2.7 2.7 2.7 2.8 2.8 2.8
Sunflower seed 1.7 2.0 2.2 1.9 1.9 1.9 1.9 1.9 1.9 2.0 2.0 2.0 2.0 2.0
of which EU-15 1.6 1.7 1.9 1.6 1.8 1.8 1.8 1.8 1.8 1.8 1.8 1.8 1.8 1.8
of which EU-N13 1.7 2.2 2.4 2.0 2.0 2.0 2.0 2.0 2.0 2.1 2.1 2.1 2.1 2.1
Soybeans 2.2 2.6 3.3 2.6 2.8 2.8 2.8 2.8 2.9 2.9 2.9 2.9 2.9 2.9
of which EU-15 2.8 3.0 3.7 3.1 3.3 3.3 3.3 3.3 3.4 3.4 3.4 3.4 3.4 3.4
of which EU-N13 1.6 2.0 2.6 2.2 2.2 2.2 2.2 2.2 2.3 2.3 2.3 2.3 2.3 2.3
Table 7.13 EU oilseed meal* market balance (million t)
2012 2013 2014 2015 2016 2017 2018 2019 2020 2021 2022 2023 2024 2025
Production 25.8 27.5 28.0 27.6 27.4 27.4 27.5 27.6 27.6 27.7 27.8 27.8 27.9 27.9
of which EU-15 22.2 23.8 23.3 23.6 23.5 23.5 23.6 23.7 23.7 23.8 23.9 23.9 24.0 24.0
of which EU-N13 3.6 3.7 4.7 4.0 3.9 3.9 3.9 3.9 3.9 3.9 3.9 3.9 3.9 3.9
Consumption 45.8 48.7 49.0 48.3 48.6 48.9 49.1 49.5 49.8 50.1 50.5 50.8 51.1 51.2
of which EU-15 37.2 40.1 40.4 39.6 39.8 39.9 40.1 40.3 40.5 40.8 41.0 41.2 41.5 41.5
of which EU-N13 8.6 8.6 8.6 8.8 8.9 8.9 9.0 9.1 9.2 9.3 9.4 9.5 9.6 9.7
Imports 21.1 22.1 22.0 21.7 22.1 22.4 22.7 22.9 23.1 23.4 23.7 23.9 24.2 24.3
Exports 1.1 0.9 1.0 1.0 1.0 1.0 1.0 1.0 1.0 1.0 1.0 1.0 0.9 0.9
Beginning stocks 0.5 0.5 0.6 0.5 0.5 0.4 0.5 0.4 0.4 0.4 0.4 0.4 0.4 0.5
Ending stocks 0.5 0.6 0.5 0.5 0.4 0.5 0.4 0.4 0.4 0.4 0.4 0.4 0.5 0.5
EU price in EUR/t (soybean meal)
411 405 300 301 294 300 307 303 303 315 320 335 341 350
World price in EUR/t 386 365 285 316 280 285 292 288 289 300 305 319 325 333
World price in USD/t 496 484 379 354 318 339 376 384 388 405 414 435 444 456
Note: the oilseed meal marketing year is July/June; * Rapeseed- soybean-, sunflower seed- and groundnut-based protein meals.

76 E U A G R I C U L T U R A L O U T L O O K
Table 7.14 EU oilseed oil* market balance (million t)
2012 2013 2014 2015 2016 2017 2018 2019 2020 2021 2022 2023 2024 2025
Production 14.3 15.3 16.0 15.2 15.0 14.9 14.9 14.9 14.9 14.9 14.9 14.9 14.9 14.9
of which EU-15 11.7 12.5 12.6 12.3 12.2 12.1 12.1 12.1 12.1 12.1 12.1 12.1 12.1 12.1
of which EU-N13 2.5 2.7 3.4 2.9 2.8 2.8 2.8 2.8 2.8 2.8 2.8 2.8 2.8 2.8
Consumption 14.1 15.3 15.7 15.2 15.3 15.2 15.3 15.2 15.2 15.2 15.2 15.1 15.0 14.8
of which EU-15 11.8 12.6 13.0 12.5 12.6 12.5 12.6 12.5 12.5 12.5 12.5 12.4 12.3 12.2
of which EU-N13 2.3 2.7 2.7 2.7 2.7 2.7 2.7 2.7 2.7 2.7 2.7 2.7 2.7 2.6
Imports 1.6 1.6 1.6 1.6 1.5 1.6 1.6 1.6 1.6 1.6 1.6 1.5 1.5 1.4
Exports 1.7 1.5 1.7 1.6 1.4 1.3 1.2 1.2 1.2 1.2 1.3 1.3 1.3 1.4
Beginning stocks 0.8 0.8 0.9 1.0 1.0 0.8 0.8 0.7 0.7 0.7 0.8 0.8 0.8 0.8
Ending stocks 0.8 0.9 1.0 1.0 0.8 0.8 0.7 0.7 0.7 0.8 0.8 0.8 0.8 0.8
EU price in EUR/t (rapeseed oil)
859 717 678 649 600 605 609 612 619 632 653 672 693 709
World price in EUR/t 782 689 593 624 577 577 582 586 593 606 625 644 664 680
World price in USD/t 1 005 915 788 698 654 686 750 780 796 819 849 877 907 932
Note: the oilseed oil marketing year is July/June; * Rapeseed-, soybean-, sunflower seed- and groundnut-based oils.
Table 7.15 EU vegetable oil* market balance (million t)
2012 2013 2014 2015 2016 2017 2018 2019 2020 2021 2022 2023 2024 2025
Production 14.4 15.4 16.1 15.3 15.0 15.0 15.0 15.0 15.0 15.0 15.0 15.0 15.0 14.9
of which EU-15 11.9 12.6 12.6 12.4 12.2 12.2 12.2 12.2 12.2 12.2 12.2 12.2 12.2 12.2
of which EU-N13 2.5 2.7 3.4 2.9 2.8 2.8 2.8 2.8 2.8 2.8 2.8 2.8 2.8 2.8
Consumption 21.5 23.2 23.3 22.7 22.8 22.8 22.9 22.9 22.9 22.8 22.7 22.5 22.4 22.1
of which EU-15 18.8 20.2 20.2 19.7 19.7 19.8 19.9 19.8 19.8 19.7 19.6 19.4 19.3 19.1
of which EU-N13 2.7 3.1 3.1 3.0 3.0 3.0 3.1 3.1 3.1 3.1 3.1 3.0 3.0 3.0
of which food and other use
13.4 14.4 13.7 13.3 13.2 13.2 13.2 13.0 13.0 13.0 13.0 12.9 12.9 12.9
of which bioenergy 8.1 8.9 9.6 9.4 9.5 9.6 9.7 9.9 9.9 9.7 9.6 9.5 9.5 9.2
Imports 8.9 9.6 9.4 9.1 9.0 9.3 9.3 9.3 9.3 9.2 9.1 9.0 8.9 8.8
Exports 1.9 1.7 1.9 1.8 1.5 1.5 1.4 1.4 1.4 1.4 1.4 1.5 1.5 1.5
Beginning stocks 1.2 1.1 1.2 1.5 1.3 1.0 1.0 1.0 1.0 1.0 1.0 1.0 1.0 1.0
Ending stocks 1.1 1.2 1.5 1.3 1.0 1.0 1.0 1.0 1.0 1.0 1.0 1.0 1.0 1.0
Note: the vegetable oil marketing year is July/June; * Rapeseed- soybean-, sunflower seed- and groundnut-based oils plus cottonseed oil, palm oil, palmkernel oil and coconut oil.
Table 7.16 EU sugar market balance (million t white sugar equivalent)
2012 2013 2014 2015 2016 2017 2018 2019 2020 2021 2022 2023 2024 2025
Sugar beet production (million t) 114.8 109.1 115.6 97.6 112.2 113.1 112.2 111.8 111.9 112.1 112.3 112.5 112.8 112.9
of which EU-15 94.2 88.9 95.6 81.2 92.4 93.3 92.4 92.0 92.2 92.4 92.6 92.8 93.0 93.1
of which EU-N13 20.7 20.2 20.1 16.4 19.8 19.7 19.7 19.7 19.7 19.8 19.8 19.8 19.8 19.8
of which for ethanol 12.3 12.6 13.2 12.7 12.6 10.0 10.5 10.5 10.4 10.4 9.5 9.5 9.3 9.3
of which processed for sugar
102.5 96.5 102.5 84.9 99.5 103.1 101.7 101.3 101.5 101.7 102.8 103.1 103.5 103.6
Sugar production* 17.3 16.6 19.4 13.8 16.8 17.4 17.2 17.2 17.2 17.3 17.5 17.6 17.7 17.7
Sugar quota 13.5 13.5 13.5 13.5 13.5 0.0 0.0 0.0 0.0 0.0 0.0 0.0 0.0 0.0
of which EU-15 14.3 13.5 16.5 11.5 13.9 14.5 14.3 14.2 14.3 14.4 14.6 14.6 14.7 14.7
of which EU-N13 3.0 3.0 2.9 2.3 2.8 2.9 2.9 2.9 2.9 2.9 3.0 3.0 3.0 3.0
Consumption 19.0 19.1 19.2 18.7 17.8 17.2 17.6 17.4 17.5 17.1 17.1 17.2 17.1 17.1
Imports 4.0 3.5 2.7 3.5 3.7 1.93 1.89 1.95 1.88 1.85 1.84 1.84 1.84 1.83
Exports 1.5 1.5 1.5 1.6 1.5 2.0 2.0 2.0 1.9 2.1 2.2 2.2 2.4 2.5
Beginning stocks** 2.4 3.2 2.6 4.0 1.0 2.1 2.2 1.7 1.4 1.1 1.0 1.1 1.0 1.0
Ending stocks** 3.2 2.6 4.0 1.0 2.1 2.2 1.7 1.4 1.1 1.0 1.1 1.0 1.0 1.0
EU price in EUR/t 723 600 425 485 495 397 395 390 390 401 410 410 401 399
World price in EUR/t 392 355 351 371 362 341 314 310 314 323 337 340 330 319
World price in USD/t 504 457 402 415 410 405 405 413 422 438 457 463 451 437
Note: the sugar marketing year is October/September; * Sugar production is adjusted for carry-forward quantities and does not include ethanol feedstock quantities; ** Stocks include carry-forward quantities.
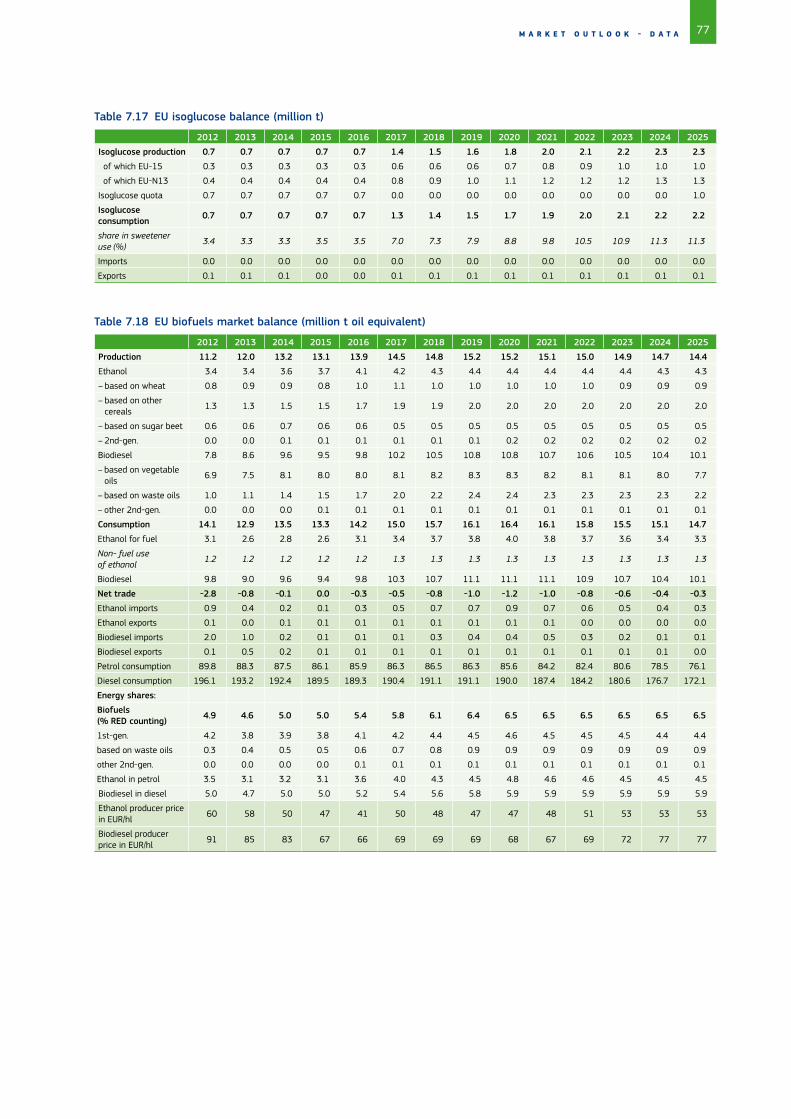
77M A R K E T O U T L O O K - D A T A
Table 7.17 EU isoglucose balance (million t)
2012 2013 2014 2015 2016 2017 2018 2019 2020 2021 2022 2023 2024 2025
Isoglucose production 0.7 0.7 0.7 0.7 0.7 1.4 1.5 1.6 1.8 2.0 2.1 2.2 2.3 2.3
of which EU-15 0.3 0.3 0.3 0.3 0.3 0.6 0.6 0.6 0.7 0.8 0.9 1.0 1.0 1.0
of which EU-N13 0.4 0.4 0.4 0.4 0.4 0.8 0.9 1.0 1.1 1.2 1.2 1.2 1.3 1.3
Isoglucose quota 0.7 0.7 0.7 0.7 0.7 0.0 0.0 0.0 0.0 0.0 0.0 0.0 0.0 1.0
Isoglucose consumption 0.7 0.7 0.7 0.7 0.7 1.3 1.4 1.5 1.7 1.9 2.0 2.1 2.2 2.2
share in sweetener use (%)
3.4 3.3 3.3 3.5 3.5 7.0 7.3 7.9 8.8 9.8 10.5 10.9 11.3 11.3
Imports 0.0 0.0 0.0 0.0 0.0 0.0 0.0 0.0 0.0 0.0 0.0 0.0 0.0 0.0
Exports 0.1 0.1 0.1 0.0 0.0 0.1 0.1 0.1 0.1 0.1 0.1 0.1 0.1 0.1
Table 7.18 EU biofuels market balance (million t oil equivalent)
2012 2013 2014 2015 2016 2017 2018 2019 2020 2021 2022 2023 2024 2025
Production 11.2 12.0 13.2 13.1 13.9 14.5 14.8 15.2 15.2 15.1 15.0 14.9 14.7 14.4
Ethanol 3.4 3.4 3.6 3.7 4.1 4.2 4.3 4.4 4.4 4.4 4.4 4.4 4.3 4.3
– based on wheat 0.8 0.9 0.9 0.8 1.0 1.1 1.0 1.0 1.0 1.0 1.0 0.9 0.9 0.9
– based on other cereals
1.3 1.3 1.5 1.5 1.7 1.9 1.9 2.0 2.0 2.0 2.0 2.0 2.0 2.0
– based on sugar beet 0.6 0.6 0.7 0.6 0.6 0.5 0.5 0.5 0.5 0.5 0.5 0.5 0.5 0.5
– 2nd-gen. 0.0 0.0 0.1 0.1 0.1 0.1 0.1 0.1 0.2 0.2 0.2 0.2 0.2 0.2
Biodiesel 7.8 8.6 9.6 9.5 9.8 10.2 10.5 10.8 10.8 10.7 10.6 10.5 10.4 10.1
– based on vegetable oils
6.9 7.5 8.1 8.0 8.0 8.1 8.2 8.3 8.3 8.2 8.1 8.1 8.0 7.7
– based on waste oils 1.0 1.1 1.4 1.5 1.7 2.0 2.2 2.4 2.4 2.3 2.3 2.3 2.3 2.2
– other 2nd-gen. 0.0 0.0 0.0 0.1 0.1 0.1 0.1 0.1 0.1 0.1 0.1 0.1 0.1 0.1
Consumption 14.1 12.9 13.5 13.3 14.2 15.0 15.7 16.1 16.4 16.1 15.8 15.5 15.1 14.7
Ethanol for fuel 3.1 2.6 2.8 2.6 3.1 3.4 3.7 3.8 4.0 3.8 3.7 3.6 3.4 3.3
Non- fuel use of ethanol
1.2 1.2 1.2 1.2 1.2 1.3 1.3 1.3 1.3 1.3 1.3 1.3 1.3 1.3
Biodiesel 9.8 9.0 9.6 9.4 9.8 10.3 10.7 11.1 11.1 11.1 10.9 10.7 10.4 10.1
Net trade -2.8 -0.8 -0.1 0.0 -0.3 -0.5 -0.8 -1.0 -1.2 -1.0 -0.8 -0.6 -0.4 -0.3
Ethanol imports 0.9 0.4 0.2 0.1 0.3 0.5 0.7 0.7 0.9 0.7 0.6 0.5 0.4 0.3
Ethanol exports 0.1 0.0 0.1 0.1 0.1 0.1 0.1 0.1 0.1 0.1 0.0 0.0 0.0 0.0
Biodiesel imports 2.0 1.0 0.2 0.1 0.1 0.1 0.3 0.4 0.4 0.5 0.3 0.2 0.1 0.1
Biodiesel exports 0.1 0.5 0.2 0.1 0.1 0.1 0.1 0.1 0.1 0.1 0.1 0.1 0.1 0.0
Petrol consumption 89.8 88.3 87.5 86.1 85.9 86.3 86.5 86.3 85.6 84.2 82.4 80.6 78.5 76.1
Diesel consumption 196.1 193.2 192.4 189.5 189.3 190.4 191.1 191.1 190.0 187.4 184.2 180.6 176.7 172.1
Energy shares:
Biofuels (% RED counting) 4.9 4.6 5.0 5.0 5.4 5.8 6.1 6.4 6.5 6.5 6.5 6.5 6.5 6.5
1st-gen. 4.2 3.8 3.9 3.8 4.1 4.2 4.4 4.5 4.6 4.5 4.5 4.5 4.4 4.4
based on waste oils 0.3 0.4 0.5 0.5 0.6 0.7 0.8 0.9 0.9 0.9 0.9 0.9 0.9 0.9
other 2nd-gen. 0.0 0.0 0.0 0.0 0.1 0.1 0.1 0.1 0.1 0.1 0.1 0.1 0.1 0.1
Ethanol in petrol 3.5 3.1 3.2 3.1 3.6 4.0 4.3 4.5 4.8 4.6 4.6 4.5 4.5 4.5
Biodiesel in diesel 5.0 4.7 5.0 5.0 5.2 5.4 5.6 5.8 5.9 5.9 5.9 5.9 5.9 5.9
Ethanol producer pricein EUR/hl
60 58 50 47 41 50 48 47 47 48 51 53 53 53
Biodiesel producerprice in EUR/hl
91 85 83 67 66 69 69 69 68 67 69 72 77 77
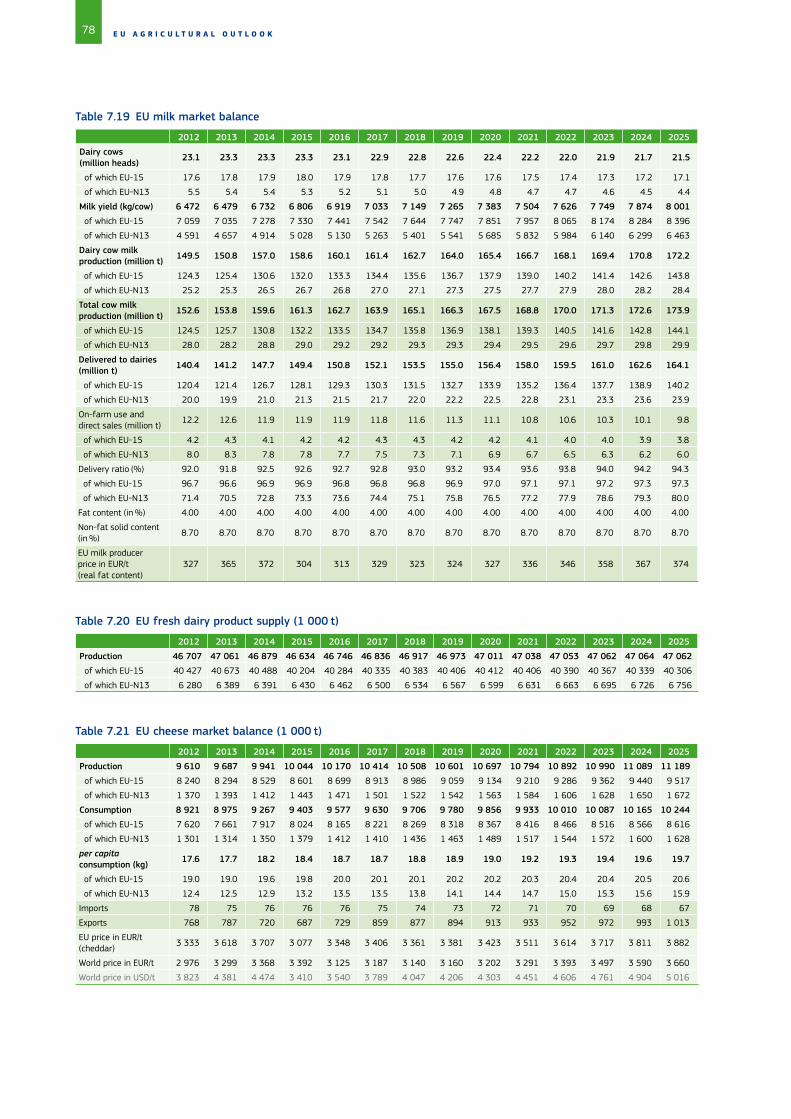
78 E U A G R I C U L T U R A L O U T L O O K
Table 7.19 EU milk market balance
2012 2013 2014 2015 2016 2017 2018 2019 2020 2021 2022 2023 2024 2025
Dairy cows (million heads) 23.1 23.3 23.3 23.3 23.1 22.9 22.8 22.6 22.4 22.2 22.0 21.9 21.7 21.5
of which EU-15 17.6 17.8 17.9 18.0 17.9 17.8 17.7 17.6 17.6 17.5 17.4 17.3 17.2 17.1
of which EU-N13 5.5 5.4 5.4 5.3 5.2 5.1 5.0 4.9 4.8 4.7 4.7 4.6 4.5 4.4
Milk yield (kg/cow) 6 472 6 479 6 732 6 806 6 919 7 033 7 149 7 265 7 383 7 504 7 626 7 749 7 874 8 001
of which EU-15 7 059 7 035 7 278 7 330 7 441 7 542 7 644 7 747 7 851 7 957 8 065 8 174 8 284 8 396
of which EU-N13 4 591 4 657 4 914 5 028 5 130 5 263 5 401 5 541 5 685 5 832 5 984 6 140 6 299 6 463
Dairy cow milkproduction (million t) 149.5 150.8 157.0 158.6 160.1 161.4 162.7 164.0 165.4 166.7 168.1 169.4 170.8 172.2
of which EU-15 124.3 125.4 130.6 132.0 133.3 134.4 135.6 136.7 137.9 139.0 140.2 141.4 142.6 143.8
of which EU-N13 25.2 25.3 26.5 26.7 26.8 27.0 27.1 27.3 27.5 27.7 27.9 28.0 28.2 28.4
Total cow milkproduction (million t) 152.6 153.8 159.6 161.3 162.7 163.9 165.1 166.3 167.5 168.8 170.0 171.3 172.6 173.9
of which EU-15 124.5 125.7 130.8 132.2 133.5 134.7 135.8 136.9 138.1 139.3 140.5 141.6 142.8 144.1
of which EU-N13 28.0 28.2 28.8 29.0 29.2 29.2 29.3 29.3 29.4 29.5 29.6 29.7 29.8 29.9
Delivered to dairies(million t) 140.4 141.2 147.7 149.4 150.8 152.1 153.5 155.0 156.4 158.0 159.5 161.0 162.6 164.1
of which EU-15 120.4 121.4 126.7 128.1 129.3 130.3 131.5 132.7 133.9 135.2 136.4 137.7 138.9 140.2
of which EU-N13 20.0 19.9 21.0 21.3 21.5 21.7 22.0 22.2 22.5 22.8 23.1 23.3 23.6 23.9
On-farm use and direct sales (million t)
12.2 12.6 11.9 11.9 11.9 11.8 11.6 11.3 11.1 10.8 10.6 10.3 10.1 9.8
of which EU-15 4.2 4.3 4.1 4.2 4.2 4.3 4.3 4.2 4.2 4.1 4.0 4.0 3.9 3.8
of which EU-N13 8.0 8.3 7.8 7.8 7.7 7.5 7.3 7.1 6.9 6.7 6.5 6.3 6.2 6.0
Delivery ratio (%) 92.0 91.8 92.5 92.6 92.7 92.8 93.0 93.2 93.4 93.6 93.8 94.0 94.2 94.3
of which EU-15 96.7 96.6 96.9 96.9 96.8 96.8 96.8 96.9 97.0 97.1 97.1 97.2 97.3 97.3
of which EU-N13 71.4 70.5 72.8 73.3 73.6 74.4 75.1 75.8 76.5 77.2 77.9 78.6 79.3 80.0
Fat content (in %) 4.00 4.00 4.00 4.00 4.00 4.00 4.00 4.00 4.00 4.00 4.00 4.00 4.00 4.00
Non-fat solid content(in %)
8.70 8.70 8.70 8.70 8.70 8.70 8.70 8.70 8.70 8.70 8.70 8.70 8.70 8.70
EU milk producer price in EUR/t(real fat content)
327 365 372 304 313 329 323 324 327 336 346 358 367 374
Table 7.20 EU fresh dairy product supply (1 000 t)
2012 2013 2014 2015 2016 2017 2018 2019 2020 2021 2022 2023 2024 2025
Production 46 707 47 061 46 879 46 634 46 746 46 836 46 917 46 973 47 011 47 038 47 053 47 062 47 064 47 062
of which EU-15 40 427 40 673 40 488 40 204 40 284 40 335 40 383 40 406 40 412 40 406 40 390 40 367 40 339 40 306
of which EU-N13 6 280 6 389 6 391 6 430 6 462 6 500 6 534 6 567 6 599 6 631 6 663 6 695 6 726 6 756
Table 7.21 EU cheese market balance (1 000 t)
2012 2013 2014 2015 2016 2017 2018 2019 2020 2021 2022 2023 2024 2025
Production 9 610 9 687 9 941 10 044 10 170 10 414 10 508 10 601 10 697 10 794 10 892 10 990 11 089 11 189
of which EU-15 8 240 8 294 8 529 8 601 8 699 8 913 8 986 9 059 9 134 9 210 9 286 9 362 9 440 9 517
of which EU-N13 1 370 1 393 1 412 1 443 1 471 1 501 1 522 1 542 1 563 1 584 1 606 1 628 1 650 1 672
Consumption 8 921 8 975 9 267 9 403 9 577 9 630 9 706 9 780 9 856 9 933 10 010 10 087 10 165 10 244
of which EU-15 7 620 7 661 7 917 8 024 8 165 8 221 8 269 8 318 8 367 8 416 8 466 8 516 8 566 8 616
of which EU-N13 1 301 1 314 1 350 1 379 1 412 1 410 1 436 1 463 1 489 1 517 1 544 1 572 1 600 1 628
per capita consumption (kg) 17.6 17.7 18.2 18.4 18.7 18.7 18.8 18.9 19.0 19.2 19.3 19.4 19.6 19.7
of which EU-15 19.0 19.0 19.6 19.8 20.0 20.1 20.1 20.2 20.2 20.3 20.4 20.4 20.5 20.6
of which EU-N13 12.4 12.5 12.9 13.2 13.5 13.5 13.8 14.1 14.4 14.7 15.0 15.3 15.6 15.9
Imports 78 75 76 76 76 75 74 73 72 71 70 69 68 67
Exports 768 787 720 687 729 859 877 894 913 933 952 972 993 1 013
EU price in EUR/t (cheddar)
3 333 3 618 3 707 3 077 3 348 3 406 3 361 3 381 3 423 3 511 3 614 3 717 3 811 3 882
World price in EUR/t 2 976 3 299 3 368 3 392 3 125 3 187 3 140 3 160 3 202 3 291 3 393 3 497 3 590 3 660
World price in USD/t 3 823 4 381 4 474 3 410 3 540 3 789 4 047 4 206 4 303 4 451 4 606 4 761 4 904 5 016

79M A R K E T O U T L O O K - D A T A
Table 7.22 EU butter market balance (1 000 t)
2012 2013 2014 2015 2016 2017 2018 2019 2020 2021 2022 2023 2024 2025
Production 2 167 2 120 2 228 2 336 2 362 2 389 2 414 2 441 2 468 2 496 2 524 2 552 2 581 2 609
of which EU-15 1 922 1 875 1 961 2 040 2 061 2 079 2 097 2 116 2 135 2 154 2 174 2 194 2 213 2 233
of which EU-N13 245 245 267 296 302 309 317 325 333 341 350 358 367 376
Consumption 2 051 2 025 2 094 2 177 2 242 2 234 2 255 2 277 2 299 2 322 2 345 2 368 2 392 2 417
of which EU-15 1 802 1 760 1 810 1 863 1 917 1 901 1 914 1 929 1 943 1 958 1 973 1 988 2 004 2 020
of which EU-N13 249 264 284 313 325 333 341 348 356 364 372 380 388 397
per capita consumption (kg) 4.0 4.0 4.1 4.3 4.4 4.3 4.4 4.4 4.4 4.5 4.5 4.6 4.6 4.6
of which EU-15 4.5 4.4 4.5 4.6 4.7 4.6 4.7 4.7 4.7 4.7 4.7 4.8 4.8 4.8
of which EU-N13 2.4 2.5 2.7 3.0 3.1 3.2 3.3 3.4 3.4 3.5 3.6 3.7 3.8 3.9
Imports 29 21 25 3 10 20 20 20 20 20 20 20 20 20
Exports 124 116 134 152 165 175 179 184 189 194 199 204 208 213
Ending stocks 80 80 105 115 80 80 80 80 80 80 80 80 80 80
of which private 80 80 105 115 80 80 80 80 80 80 80 80 80 80
of which intervention 0 0 0 0 0 0 0 0 0 0 0 0 0 0
EU price in EUR/t 2 978 3 840 3 381 3 000 3 248 3 206 3 148 3 104 3 122 3 193 3 291 3 395 3 506 3 587
World price in EUR/t 2 583 3 023 2 825 2 845 2 671 2 807 2 746 2 700 2 718 2 790 2 888 2 997 3 112 3 192
World price in USD/t 3 318 4 015 3 753 3 184 3 027 3 337 3 539 3 595 3 653 3 774 3 920 4 081 4 251 4 374
EU intervention pricein EUR/t
2 218 2 218 2 218 2 218 2 218 2 218 2 218 2 218 2 218 2 218 2 218 2 218 2 218 2 218
Table 7.23 EU SMP market balance (1 000 t)
2012 2013 2014 2015 2016 2017 2018 2019 2020 2021 2022 2023 2024 2025
Production 1 109 1 108 1 400 1 492 1 522 1 502 1 543 1 577 1 622 1 671 1 721 1 773 1 826 1 881
of which EU-15 953 958 1 179 1 260 1 286 1 261 1 295 1 321 1 358 1 400 1 441 1 485 1 529 1 575
of which EU-N13 156 150 220 232 236 241 248 256 264 272 280 288 297 306
Consumption 685 707 738 756 781 790 785 831 850 874 899 925 954 983
of which EU-15 596 595 632 641 669 675 665 706 720 739 759 780 804 828
of which EU-N13 89 112 106 115 112 115 120 125 130 135 140 145 150 155
Imports 2 5 2 5 5 4 4 4 4 4 4 4 4 4
Exports 520 407 646 690 741 771 780 750 776 801 826 852 877 902
Ending stocks 62 62 80 130 135 80 62 62 62 62 62 62 62 62
of which private 62 62 80 105 110 80 62 62 62 62 62 62 62 62
of which intervention 0 0 0 25 25 0 0 0 0 0 0 0 0 0
EU market price in EUR/t (EU-15)
2 358 3 039 2 703 1 900 2 378 2 380 2 342 2 405 2 424 2 484 2 554 2 629 2 676 2 707
World market price in EUR/t
2 461 3 312 2 825 1 931 2 397 2 399 2 360 2 423 2 442 2 504 2 574 2 651 2 698 2 729
World market price in USD/t
3 163 4 399 3 753 2 161 2 716 2 853 3 042 3 226 3 282 3 387 3 494 3 609 3 685 3 740
Table 7.24 EU WMP market balance (1 000 t)
2012 2013 2014 2015 2016 2017 2018 2019 2020 2021 2022 2023 2024 2025
Production 672 757 770 736 752 772 799 824 851 878 905 927 949 971
of which EU-15 608 691 699 671 685 703 727 750 775 800 825 845 865 885
of which EU-N13 64 67 72 65 68 70 72 74 76 78 80 82 84 86
Consumption 289 386 383 364 369 384 393 398 405 414 423 427 434 441
of which EU-15 246 336 333 312 316 330 338 342 348 356 364 367 373 379
of which EU-N13 43 51 50 52 53 54 55 56 57 58 59 60 61 62
Imports 3 3 1 1 1 2 1 1 2 2 1 2 2 2
Exports 386 374 389 373 385 390 408 427 448 466 484 502 517 532
EU price in EUR/t 2 730 3 526 3 058 2 423 2 871 2 734 2 647 2 669 2 698 2 772 2 858 2 957 3 033 3 093
World price in EUR/t 2 517 3 537 2 836 2 174 2 489 2 535 2 447 2 469 2 498 2 573 2 658 2 757 2 833 2 894
World price in USD/t 3 234 4 698 3 768 2 433 2 820 3 014 3 154 3 287 3 357 3 480 3 608 3 754 3 870 3 966

80 E U A G R I C U L T U R A L O U T L O O K
Table 7.25 EU whey market balance (1 000 t)
2012 2013 2014 2015 2016 2017 2018 2019 2020 2021 2022 2023 2024 2025
Production 1 864 1 999 2 012 2 034 2 061 2 085 2 109 2 134 2 159 2 184 2 210 2 236 2 262 2 289
of which EU-15 1 618 1 638 1 649 1 664 1 684 1 701 1 718 1 735 1 752 1 770 1 788 1 806 1 824 1 842
of which EU-N13 246 362 363 370 377 384 392 399 407 414 422 430 438 447
Consumption 1 391 1 495 1 545 1 546 1 550 1 535 1 561 1 576 1 592 1 609 1 625 1 642 1 660 1 677
Imports 71 75 94 95 96 97 98 99 100 101 102 103 104 105
Exports 544 579 561 583 607 647 647 656 666 676 686 696 706 716
EU price in EUR/t 1 118 996 941 775 921 920 904 930 938 960 987 1 017 1 036 1 048
World price in EUR/t 952 969 1 038 1 091 1 057 1 011 935 940 939 946 959 984 979 984
World price in USD/t 1 223 1 286 1 378 1 221 1 197 1 202 1 204 1 251 1 262 1 279 1 301 1 341 1 338 1 349
Table 7.26 EU beef and veal meat market balance (1 000 t c.w.e.)
2012 2013 2014 2015 2016 2017 2018 2019 2020 2021 2022 2023 2024 2025
Total number of cows (million heads) 35.1 35.2 35.4 35.5 35.3 35.1 34.9 34.7 34.5 34.3 34.0 33.8 33.6 33.4
of which dairy cows 23.1 23.3 23.3 23.3 23.1 22.9 22.8 22.6 22.4 22.2 22.0 21.9 21.7 21.5
of which suckler cows 12.2 12.0 11.9 12.0 12.2 12.2 12.2 12.1 12.1 12.1 12.0 12.0 12.0 11.9
Gross indigenous production 7 867 7 502 7 664 7 857 7 913 7 873 7 832 7 782 7 736 7 695 7 649 7 606 7 582 7 554
of which EU-15 6 995 6 683 6 785 6 917 6 935 6 906 6 873 6 831 6 792 6 759 6 722 6 685 6 663 6 639
of which EU-N13 872 818 878 940 978 967 959 951 944 936 927 921 919 915
Imports of live animals 0 0 0 0 0 0 0 0 0 0 0 0 0 0
Exports of live animals 159 109 114 174 183 150 110 90 88 85 83 80 78 75
Net production 7 708 7 393 7 549 7 683 7 730 7 723 7 722 7 692 7 649 7 610 7 567 7 526 7 505 7 479
Consumption 7 773 7 536 7 650 7 765 7 803 7 820 7 847 7 837 7 808 7 767 7 728 7 680 7 650 7 625
of which EU-15 7 289 7 096 7 142 7 232 7 255 7 280 7 319 7 312 7 297 7 268 7 241 7 206 7 189 7 184
of which EU-N13 484 440 508 533 549 540 528 524 511 499 487 474 462 440
per capita consumption (kg r.w.e.)*
10.7 10.4 10.5 10.6 10.7 10.6 10.7 10.6 10.6 10.5 10.4 10.3 10.3 10.3
of which EU-15 12.7 12.3 12.4 12.5 12.4 12.4 12.5 12.4 12.3 12.3 12.2 12.1 12.1 12.0
of which EU-N13 3.2 2.9 3.4 3.6 3.7 3.6 3.6 3.5 3.5 3.4 3.3 3.2 3.2 3.0
Imports (meat) 275 304 307 301 305 320 323 330 331 333 336 331 325 325
Exports (meat) 210 161 207 219 225 219 210 191 172 171 172 178 179 179
Net trade (meat) -65 -143 -100 -82 -79 -102 -113 -138 -159 -162 -164 -154 -146 -146
EU price in EUR/t 3 830 3 822 3 676 3 770 3 548 3 424 3 279 3 219 3 229 3 296 3 359 3 383 3 430 3 468
World price in EUR/t (Brazil)
2 441 2 212 2 234 2 681 2 102 2 088 1 911 1 858 1 851 1 887 1 927 1 985 2 051 2 097
World price in USD/t (Brazil)
3 137 2 937 2 968 3 000 2 382 2 483 2 463 2 474 2 488 2 553 2 615 2 703 2 801 2 874
* r.w.e. = retail weight equivalent; coefficients to transform carcass weight into retail weight are 0.7 for beef and veal.
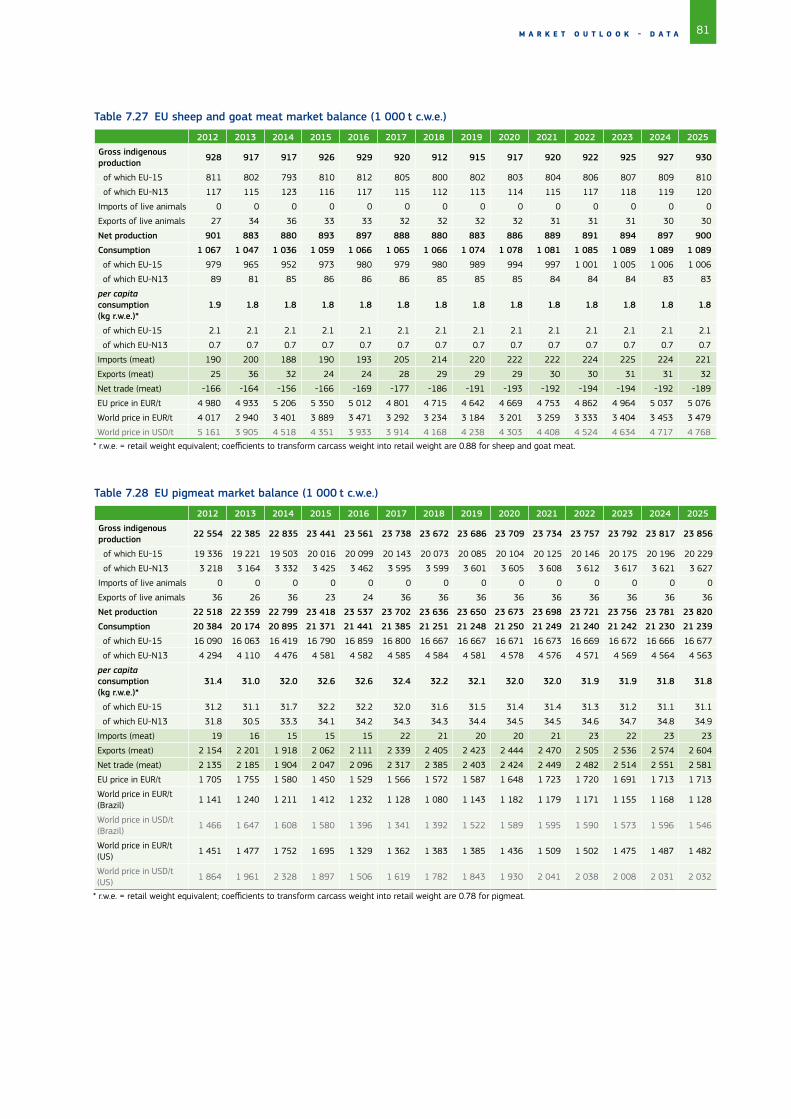
81M A R K E T O U T L O O K - D A T A
Table 7.27 EU sheep and goat meat market balance (1 000 t c.w.e.)
2012 2013 2014 2015 2016 2017 2018 2019 2020 2021 2022 2023 2024 2025
Gross indigenous production 928 917 917 926 929 920 912 915 917 920 922 925 927 930
of which EU-15 811 802 793 810 812 805 800 802 803 804 806 807 809 810
of which EU-N13 117 115 123 116 117 115 112 113 114 115 117 118 119 120
Imports of live animals 0 0 0 0 0 0 0 0 0 0 0 0 0 0
Exports of live animals 27 34 36 33 33 32 32 32 32 31 31 31 30 30
Net production 901 883 880 893 897 888 880 883 886 889 891 894 897 900
Consumption 1 067 1 047 1 036 1 059 1 066 1 065 1 066 1 074 1 078 1 081 1 085 1 089 1 089 1 089
of which EU-15 979 965 952 973 980 979 980 989 994 997 1 001 1 005 1 006 1 006
of which EU-N13 89 81 85 86 86 86 85 85 85 84 84 84 83 83
per capita consumption(kg r.w.e.)*
1.9 1.8 1.8 1.8 1.8 1.8 1.8 1.8 1.8 1.8 1.8 1.8 1.8 1.8
of which EU-15 2.1 2.1 2.1 2.1 2.1 2.1 2.1 2.1 2.1 2.1 2.1 2.1 2.1 2.1
of which EU-N13 0.7 0.7 0.7 0.7 0.7 0.7 0.7 0.7 0.7 0.7 0.7 0.7 0.7 0.7
Imports (meat) 190 200 188 190 193 205 214 220 222 222 224 225 224 221
Exports (meat) 25 36 32 24 24 28 29 29 29 30 30 31 31 32
Net trade (meat) -166 -164 -156 -166 -169 -177 -186 -191 -193 -192 -194 -194 -192 -189
EU price in EUR/t 4 980 4 933 5 206 5 350 5 012 4 801 4 715 4 642 4 669 4 753 4 862 4 964 5 037 5 076
World price in EUR/t 4 017 2 940 3 401 3 889 3 471 3 292 3 234 3 184 3 201 3 259 3 333 3 404 3 453 3 479
World price in USD/t 5 161 3 905 4 518 4 351 3 933 3 914 4 168 4 238 4 303 4 408 4 524 4 634 4 717 4 768
* r.w.e. = retail weight equivalent; coefficients to transform carcass weight into retail weight are 0.88 for sheep and goat meat.
Table 7.28 EU pigmeat market balance (1 000 t c.w.e.)
2012 2013 2014 2015 2016 2017 2018 2019 2020 2021 2022 2023 2024 2025
Gross indigenous production 22 554 22 385 22 835 23 441 23 561 23 738 23 672 23 686 23 709 23 734 23 757 23 792 23 817 23 856
of which EU-15 19 336 19 221 19 503 20 016 20 099 20 143 20 073 20 085 20 104 20 125 20 146 20 175 20 196 20 229
of which EU-N13 3 218 3 164 3 332 3 425 3 462 3 595 3 599 3 601 3 605 3 608 3 612 3 617 3 621 3 627
Imports of live animals 0 0 0 0 0 0 0 0 0 0 0 0 0 0
Exports of live animals 36 26 36 23 24 36 36 36 36 36 36 36 36 36
Net production 22 518 22 359 22 799 23 418 23 537 23 702 23 636 23 650 23 673 23 698 23 721 23 756 23 781 23 820
Consumption 20 384 20 174 20 895 21 371 21 441 21 385 21 251 21 248 21 250 21 249 21 240 21 242 21 230 21 239
of which EU-15 16 090 16 063 16 419 16 790 16 859 16 800 16 667 16 667 16 671 16 673 16 669 16 672 16 666 16 677
of which EU-N13 4 294 4 110 4 476 4 581 4 582 4 585 4 584 4 581 4 578 4 576 4 571 4 569 4 564 4 563
per capita consumption (kg r.w.e.)*
31.4 31.0 32.0 32.6 32.6 32.4 32.2 32.1 32.0 32.0 31.9 31.9 31.8 31.8
of which EU-15 31.2 31.1 31.7 32.2 32.2 32.0 31.6 31.5 31.4 31.4 31.3 31.2 31.1 31.1
of which EU-N13 31.8 30.5 33.3 34.1 34.2 34.3 34.3 34.4 34.5 34.5 34.6 34.7 34.8 34.9
Imports (meat) 19 16 15 15 15 22 21 20 20 21 23 22 23 23
Exports (meat) 2 154 2 201 1 918 2 062 2 111 2 339 2 405 2 423 2 444 2 470 2 505 2 536 2 574 2 604
Net trade (meat) 2 135 2 185 1 904 2 047 2 096 2 317 2 385 2 403 2 424 2 449 2 482 2 514 2 551 2 581
EU price in EUR/t 1 705 1 755 1 580 1 450 1 529 1 566 1 572 1 587 1 648 1 723 1 720 1 691 1 713 1 713
World price in EUR/t (Brazil)
1 141 1 240 1 211 1 412 1 232 1 128 1 080 1 143 1 182 1 179 1 171 1 155 1 168 1 128
World price in USD/t (Brazil)
1 466 1 647 1 608 1 580 1 396 1 341 1 392 1 522 1 589 1 595 1 590 1 573 1 596 1 546
World price in EUR/t (US)
1 451 1 477 1 752 1 695 1 329 1 362 1 383 1 385 1 436 1 509 1 502 1 475 1 487 1 482
World price in USD/t (US)
1 864 1 961 2 328 1 897 1 506 1 619 1 782 1 843 1 930 2 041 2 038 2 008 2 031 2 032
* r.w.e. = retail weight equivalent; coefficients to transform carcass weight into retail weight are 0.78 for pigmeat.
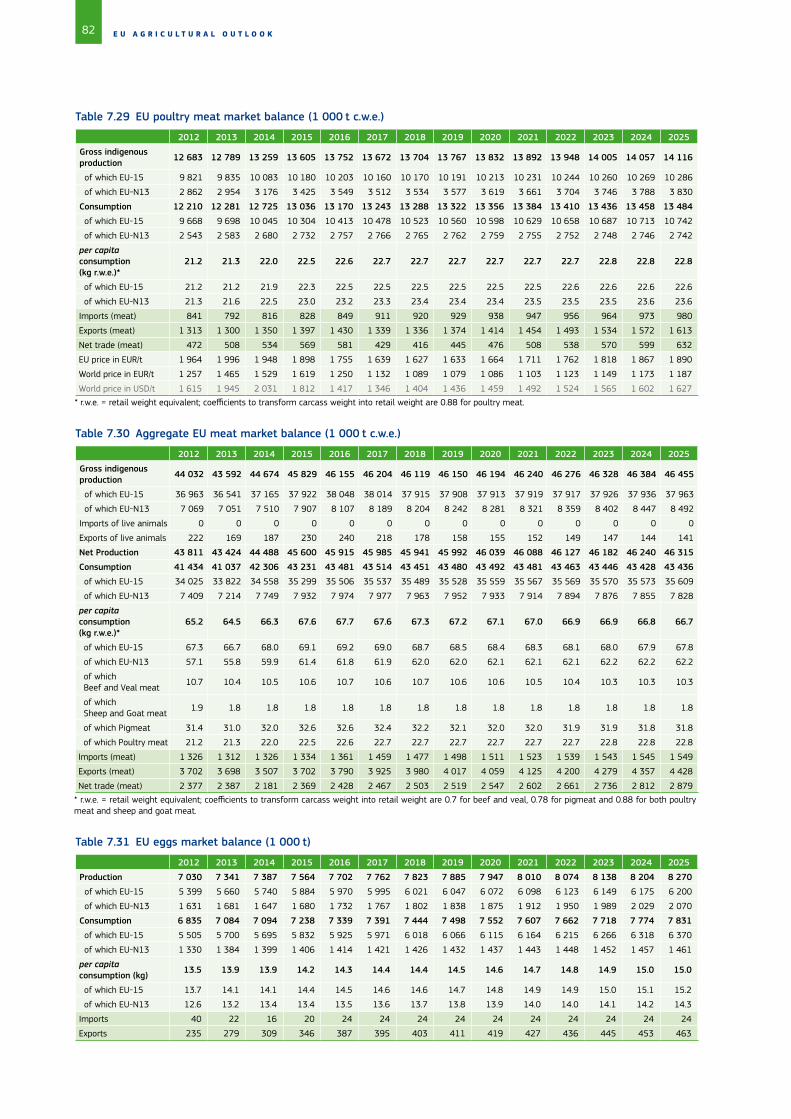
82 E U A G R I C U L T U R A L O U T L O O K
Table 7.29 EU poultry meat market balance (1 000 t c.w.e.)
2012 2013 2014 2015 2016 2017 2018 2019 2020 2021 2022 2023 2024 2025
Gross indigenous production 12 683 12 789 13 259 13 605 13 752 13 672 13 704 13 767 13 832 13 892 13 948 14 005 14 057 14 116
of which EU-15 9 821 9 835 10 083 10 180 10 203 10 160 10 170 10 191 10 213 10 231 10 244 10 260 10 269 10 286
of which EU-N13 2 862 2 954 3 176 3 425 3 549 3 512 3 534 3 577 3 619 3 661 3 704 3 746 3 788 3 830
Consumption 12 210 12 281 12 725 13 036 13 170 13 243 13 288 13 322 13 356 13 384 13 410 13 436 13 458 13 484
of which EU-15 9 668 9 698 10 045 10 304 10 413 10 478 10 523 10 560 10 598 10 629 10 658 10 687 10 713 10 742
of which EU-N13 2 543 2 583 2 680 2 732 2 757 2 766 2 765 2 762 2 759 2 755 2 752 2 748 2 746 2 742
per capita consumption(kg r.w.e.)*
21.2 21.3 22.0 22.5 22.6 22.7 22.7 22.7 22.7 22.7 22.7 22.8 22.8 22.8
of which EU-15 21.2 21.2 21.9 22.3 22.5 22.5 22.5 22.5 22.5 22.5 22.6 22.6 22.6 22.6
of which EU-N13 21.3 21.6 22.5 23.0 23.2 23.3 23.4 23.4 23.4 23.5 23.5 23.5 23.6 23.6
Imports (meat) 841 792 816 828 849 911 920 929 938 947 956 964 973 980
Exports (meat) 1 313 1 300 1 350 1 397 1 430 1 339 1 336 1 374 1 414 1 454 1 493 1 534 1 572 1 613
Net trade (meat) 472 508 534 569 581 429 416 445 476 508 538 570 599 632
EU price in EUR/t 1 964 1 996 1 948 1 898 1 755 1 639 1 627 1 633 1 664 1 711 1 762 1 818 1 867 1 890
World price in EUR/t 1 257 1 465 1 529 1 619 1 250 1 132 1 089 1 079 1 086 1 103 1 123 1 149 1 173 1 187
World price in USD/t 1 615 1 945 2 031 1 812 1 417 1 346 1 404 1 436 1 459 1 492 1 524 1 565 1 602 1 627
* r.w.e. = retail weight equivalent; coefficients to transform carcass weight into retail weight are 0.88 for poultry meat.
Table 7.30 Aggregate EU meat market balance (1 000 t c.w.e.)
2012 2013 2014 2015 2016 2017 2018 2019 2020 2021 2022 2023 2024 2025
Gross indigenous production 44 032 43 592 44 674 45 829 46 155 46 204 46 119 46 150 46 194 46 240 46 276 46 328 46 384 46 455
of which EU-15 36 963 36 541 37 165 37 922 38 048 38 014 37 915 37 908 37 913 37 919 37 917 37 926 37 936 37 963
of which EU-N13 7 069 7 051 7 510 7 907 8 107 8 189 8 204 8 242 8 281 8 321 8 359 8 402 8 447 8 492
Imports of live animals 0 0 0 0 0 0 0 0 0 0 0 0 0 0
Exports of live animals 222 169 187 230 240 218 178 158 155 152 149 147 144 141
Net Production 43 811 43 424 44 488 45 600 45 915 45 985 45 941 45 992 46 039 46 088 46 127 46 182 46 240 46 315
Consumption 41 434 41 037 42 306 43 231 43 481 43 514 43 451 43 480 43 492 43 481 43 463 43 446 43 428 43 436
of which EU-15 34 025 33 822 34 558 35 299 35 506 35 537 35 489 35 528 35 559 35 567 35 569 35 570 35 573 35 609
of which EU-N13 7 409 7 214 7 749 7 932 7 974 7 977 7 963 7 952 7 933 7 914 7 894 7 876 7 855 7 828
per capita consumption (kg r.w.e.)*
65.2 64.5 66.3 67.6 67.7 67.6 67.3 67.2 67.1 67.0 66.9 66.9 66.8 66.7
of which EU-15 67.3 66.7 68.0 69.1 69.2 69.0 68.7 68.5 68.4 68.3 68.1 68.0 67.9 67.8
of which EU-N13 57.1 55.8 59.9 61.4 61.8 61.9 62.0 62.0 62.1 62.1 62.1 62.2 62.2 62.2
of which Beef and Veal meat
10.7 10.4 10.5 10.6 10.7 10.6 10.7 10.6 10.6 10.5 10.4 10.3 10.3 10.3
of which Sheep and Goat meat
1.9 1.8 1.8 1.8 1.8 1.8 1.8 1.8 1.8 1.8 1.8 1.8 1.8 1.8
of which Pigmeat 31.4 31.0 32.0 32.6 32.6 32.4 32.2 32.1 32.0 32.0 31.9 31.9 31.8 31.8
of which Poultry meat 21.2 21.3 22.0 22.5 22.6 22.7 22.7 22.7 22.7 22.7 22.7 22.8 22.8 22.8
Imports (meat) 1 326 1 312 1 326 1 334 1 361 1 459 1 477 1 498 1 511 1 523 1 539 1 543 1 545 1 549
Exports (meat) 3 702 3 698 3 507 3 702 3 790 3 925 3 980 4 017 4 059 4 125 4 200 4 279 4 357 4 428
Net trade (meat) 2 377 2 387 2 181 2 369 2 428 2 467 2 503 2 519 2 547 2 602 2 661 2 736 2 812 2 879
* r.w.e. = retail weight equivalent; coefficients to transform carcass weight into retail weight are 0.7 for beef and veal, 0.78 for pigmeat and 0.88 for both poultry meat and sheep and goat meat.
Table 7.31 EU eggs market balance (1 000 t)
2012 2013 2014 2015 2016 2017 2018 2019 2020 2021 2022 2023 2024 2025
Production 7 030 7 341 7 387 7 564 7 702 7 762 7 823 7 885 7 947 8 010 8 074 8 138 8 204 8 270
of which EU-15 5 399 5 660 5 740 5 884 5 970 5 995 6 021 6 047 6 072 6 098 6 123 6 149 6 175 6 200
of which EU-N13 1 631 1 681 1 647 1 680 1 732 1 767 1 802 1 838 1 875 1 912 1 950 1 989 2 029 2 070
Consumption 6 835 7 084 7 094 7 238 7 339 7 391 7 444 7 498 7 552 7 607 7 662 7 718 7 774 7 831
of which EU-15 5 505 5 700 5 695 5 832 5 925 5 971 6 018 6 066 6 115 6 164 6 215 6 266 6 318 6 370
of which EU-N13 1 330 1 384 1 399 1 406 1 414 1 421 1 426 1 432 1 437 1 443 1 448 1 452 1 457 1 461
per capita consumption (kg) 13.5 13.9 13.9 14.2 14.3 14.4 14.4 14.5 14.6 14.7 14.8 14.9 15.0 15.0
of which EU-15 13.7 14.1 14.1 14.4 14.5 14.6 14.6 14.7 14.8 14.9 14.9 15.0 15.1 15.2
of which EU-N13 12.6 13.2 13.4 13.4 13.5 13.6 13.7 13.8 13.9 14.0 14.0 14.1 14.2 14.3
Imports 40 22 16 20 24 24 24 24 24 24 24 24 24 24
Exports 235 279 309 346 387 395 403 411 419 427 436 445 453 463
http://ec.europa.eu/agriculture/events/2015-outlook-conference_en.htm

http://ec.europa.eu/agriculture/events/2015-outlook-conference_en.htm
DISCLAIMER: While all efforts are made to reach sound market and income prospects, uncertainties remain. This publication does not necessarily reflect the official opinion of the European Commission.
© European Union, 2015 - Reproduction authorized provided the source is acknowledged
http://ec.europa.eu/agriculture/events/2015-outlook-conference_en.htm