2.8 – Graphing Inequalities. Steps for graphing inequalities:

�
Graphing CalculatorScientific Calculator
Version 2.0
© 2006-2017 Infinity Softworks, Inc.
www.infinitysw.com/ets
March 14, 2017

� Table of Contents1
Table of Contents
1 Overview 3
2 Navigation 4
3 Using the Calculator 5
Display 5
Performing Calculations 6
Memory 7
History 9
4 My Data 11
Accessing 11
Display 11
Creating a New Variable 12
Editing a Variable 12
Using a Variable 12
Deleting a Variable 12
5 Solver 13
Accessing 13
Display 13
Methodology 14
6 Graphing 15
Overview 15
My Graphs 16
New/Edit Graph 17
© 2006-2017 Infinity Softworks, Inc.

� Table of Contents2
Graph View 19
Analysis Modes 20
Graph Table 22
Zooming/Graph Window 23
7 Functions 27
Symbol Chart 27
Categories 29
A,B,C 30
D,E,F,G,H 32
I,J,K,L,M,N 34
O,P,Q 36
R,S,T 38
8 Appendix 41
Calculator Error Messages 41
Number Ranges 41
Implicit Multiplication 42
Legal and Disclaimers 42
© 2006-2017 Infinity Softworks, Inc.

� Overview3
1 Overview
This manual is intended as a reference for both the Graphing and Scientific calculator software developed by Infinity Softworks and included in ETS' online and computer-based testing environments.
While this document covers the entire functionality of Graphing calculator, only portions are applicable for Scientific calculator. The following sections cover Scientific calculator functionality:
• Using the Calculator• Functions• Appendix
Other areas are available only in Graphing calculator.
Additional support resources can be found at http://www.infinitysw.com/ets.
Good luck on your exam!
© 2006-2017 Infinity Softworks, Inc.

� Navigation4
2 Navigation
Applicable to Graphing calculator only, use the Navigation Bar and Menu to access other areas of the application:
A. Navigation BarHistory: list of previous calculations.• Solver: find numerical solutions to equations.• My Data: list of assigned variables.• My Graphs: create and view graphs.
B. Navigation Menu (left to right)• Solver: find numerical solutions to equations.• My Data: list of assigned variables.• My Graphs: create and view graphs.
In History, Solver, My Data and My Graphs, select the "Done" button in the lower, left-hand corner of the screen to return to the calculator.
© 2006-2017 Infinity Softworks, Inc.
GRAPH ONLY

� Using the Calculator5
3 Using the Calculator
Display
A. View Window: To calculate, enter an expression in the input area [2]. Use either the keypad [C] or computer keyboard and select "ENT" to evaluate. The expression is evaluated and displayed in the history area [1].• The last calculation is displayed and highlighted in the input area [2]. • In the history area [1], the top line shows the last expression and the bottom line
shows the last result of that expression. • If the last expression is too long to display, ellipses (...) will appear. Select the
appropriate ellipse to scroll left or right. • Select the last expression or result to use it in a new expression. Select the History
Location [H0 as pictured above] to return its full precision instead of the displayed result.
• For additional information, see the History section.
B. Options: additional options and settings, from left to right.
© 2006-2017 Infinity Softworks, Inc.
GRAPH, SCIENTIFIC

� Using the Calculator6
• Function List: changes the function keys in the first two rows in the keypad. Select the list once to see the options - math, trig, number, boolean - then select again to choose. Note that boolean is only available in Graphing calculator.
• Trig Mode: choose between radians or degrees mode. Select the list once to see the options - radians, degrees - then select again to choose.
• Number Format: display numbers in either standard floating point notation or scientific notation.
C. Keypad: calculator keypad consists of numbers, functions, backspace, clear, negate and memory buttons. Most keypad buttons include a tip. Hover the mouse over a button until it appears (not available during the test period). • 0-9: numbers 0 through 9. • decimal separator: separates the whole and decimal portions of a number. Displayed
as a period.• (–): select to insert a negative sign. • EE: select to enter a value in exponential notation. • +, –, x, ÷ ̧(addition, subtraction, multiplication, division): basic mathematics functions. • ENT: enter key. Select to evaluate an expression. • CLR: clears the input area [2]. If there is nothing in the input area, clears the last
expression/result [1]. • STO: select to store a value. In Scientific calculator, it stores to a single location. In
Graphing calculator, choose one of ten memory locations. See the Memory section for additional information.
• RCL: select to recall a value. In Scientific calculator, it stores to a single location. In Graphing calculator, choose one of ten memory locations. See the Memory section for additional information.
• ← (backspace): deletes the highlighted area or space before the cursor. • ; (semi-colon): used as a separator between function arguments. • Additional Functions: the remaining functions (first two rows of the Keypad) change
based on the Function List [B] selection. See the Functions : Categories section for additional information.
Menus: In the Scientific calculator, the Data menu (not pictured above) offers access to the calculator History, the ability to Clear Memory and Clear History.
Graphing calculator adds the ability to clear My Data, My Graphs and reset the calculator to its defaults. See Section 2 Navigation for Graphing calculator menus.
Performing Calculations This graphing calculator uses Algebraic Input Mode. In algebraic mode, the entire equation is entered then the [ENT] button is selected to evaluate the equation.
The following chart outlines function precedence. Functions with a lower order are executed before functions with a higher order:
© 2006-2017 Infinity Softworks, Inc.

� Using the Calculator7
For example, 27 + 3 x 8.5 is evaluated as (3 x 8.5) + 27:
Implicit multiplication is supported. See the Appendix : Implicit Multiplication section for information.
MemoryIn Scientific calculator, there is a single memory location. Select STO to store to memory; select RCL to recall from memory. When something is stored in memory a small “M” will be visible in the view window.
In Graphing calculator, there are 10 memory locations available. Memory locations can be accessed by selecting either the "RCL" (recall) or "STO" (store) buttons in the keypad.
Order Functions
1 Parentheses ( )
2 Powers and Roots
3 Multiplication, Division and Percentages
4 Addition and Subtraction
5 Relationship Operations (>, <=, ==)
6 Logic or Boolean Operations (and, or)
Key Display Comments
CLR
27 27
+ 27+
3 27+3
x 27+3*
8.5 27+3*8.5
ENT 52.5 Enter evaluates the entire equation at once
© 2006-2017 Infinity Softworks, Inc.

� Using the Calculator8
Storing
In Scientific calculator, select “STO” to store the evaluated expression to memory. If an expression is in the input area, the software will evaluate and store that result. If there is no expression in the input area, the last result will be stored. Note that when something in stored in memory a small “M” will appear in the view window.
In Graphing calculator, select "STO" and a location to store the evaluated expression to memory. If an expression is in the input area, the software will evaluate and store that result. If there is no expression in the input area, the last result will be stored.
In Graphing calculator, memory arithmetic is also available. Memory arithmetic uses the existing memory location's value and the evaluated expression as per the chart below. Operations performed on memory locations do not affect the contents of the entry line.
The following table describes the operations that can be performed on memory locations, where 'value' refers to the evaluated expression and memory location refers to the contents of a selected memory location:
For example, to add the last calculated result to memory location 2:• select "STO"• tap "+"• tap memory location 2
Recalling
In Scientific calculator, select "RCL" to recall the stored result to the input area. The value will be placed at the current cursor location.
In Graphing calculator, select "RCL" and a location to recall that location to the input area. The value will be placed at the current cursor location.
Operand Functionality
= Overwrite the selected memory location with value
+ Memory location plus value
− Memory location minus value
x Memory location multiplied by value
÷ Memory location divided by value
© 2006-2017 Infinity Softworks, Inc.

� Using the Calculator9
Clearing
Clear memory by choosing that option from the Data menu.
History
History stores the past 100 expression/result combinations (only the last expression and result is available in the View Window):
A. Expression: expressions are always displayed left justified. If the expression is too long to see all of it, an ellipse (...) will appear. Hover the mouse over the expression to see the entire expression as a tip. Select an expression to recall it to the input area.
B. Result: results are always displayed right justified below its expression. Select a result to recall it to the input area.C. History Location: history locations are designated by "H" and a number representing
© 2006-2017 Infinity Softworks, Inc.

� Using the Calculator10
that location. Select the History Location to return the value's full precision to the input area.
Buttons:• Done: select to return to the calculator.• Clear: select to clear the History. Exiting the software also clears the History.
© 2006-2017 Infinity Softworks, Inc.

� My Data11
4 My Data
Available in Graphing calculator only, My Data displays all assigned variables. This data can be used anywhere in the software.
AccessingSee the Navigation section for information.
DisplayThe display is a table with two columns:
© 2006-2017 Infinity Softworks, Inc.
GRAPH ONLY

� My Data12
• Name: the name of the variable. The name consists of letters (capital or lower case) and optionally numbers 0-9. A name cannot start with a number. The name is case sensitive, meaning that variable "abc" is different from variable "ABC". Note that variable names "pi" and "e" are not available. Variable names "x", "y" and "t" are discouraged (used by Graph analysis modes).
• Value: the variable's value. The value can be any real number in the supported range. See the Appendix : Number Ranges section. All expressions will be evaluated first before assigning it to the variable name.
Creating a New Variable To create a new variable, either: • Select New, enter a Name, enter a Value, and select the Enter on the keyboard. • Use the equals operator in the form <Name> = <Value> [ENT] on any input area (e.g.,
calculator). For instance, type b = 5 [ENT] in the calculator's input area. b will be defined to 5. Note that this will overwrite variables with the same name.
Editing a Variable Double-click either the Name or Value, modify and select Enter on the keyboard.
Using a VariableUse a variable by typing its name into any input area (e.g., calculator) or right-click and choose Use from the list to recall to the calculator. For instance, using c from above, type 2b in the calculator's input area and select [ENT]. The result will be 10.
Deleting a VariableDelete a single variable by right-clicking on a variable and choosing Delete from the list.
© 2006-2017 Infinity Softworks, Inc.

� Solver13
5 Solver
Available in Graphing Calculator only, Solver is used to find numerical solutions to an equation with one or more variables.
AccessingSee the Navigation section for information.
DisplayA. Equation: enter the equation here.• Use your keyboard or select functions from the "f(x)" button. • Variable names consist of letters (capital or lower case) and optionally numbers 0-9. A
name cannot start with a number. Note that the name is case sensitive, meaning that variable "abc" is different from variable "ABC". Variable names "pi" and "e" are not
© 2006-2017 Infinity Softworks, Inc.
GRAPH ONLY

� Solver14
available. Once created, all variables are stored for access anywhere within the application.
• As the equation is entered, the template is populated automatically.
B. Template: form that includes known and unknown variables. • Enter values for all known variables. The value can be any real number in the
supported range. See the Appendix : Number Ranges section. All expressions will be evaluated to a real number.
• To calculate the unknown variable, select the "?" button in the Solve column. Using the keyboard, navigate to the cell and select the space key.
• A value entered for an unknown variable acts as a guess.
C. Limits: the low and high limits used when solving. Enter a low or high limit by selecting the current setting and changing the value or by choosing an option from the attached pop-up list. Use the Enter key to accept the change.
MethodologySee the Solve function for information regarding solver methodology.
© 2006-2017 Infinity Softworks, Inc.

� Graphing15
6 Graphing
Overview
Graphing consists of three main areas:• My Graphs: view expressions to be graphed. This is the home page for graphing. See
Navigation for access information. • New/Edit Graph: create and edit expressions to be graphed. Select the "New" button in
My Graphs to create a new graph. Double-click an already created expression to edit it.
• Graph View: displays the graph expressions and offers options for analyzing the expressions visually. Select the "Graph" button in My Graphs to access.
Accessing
See the Navigation section for information.
© 2006-2017 Infinity Softworks, Inc.
GRAPH ONLY
� Graphing16
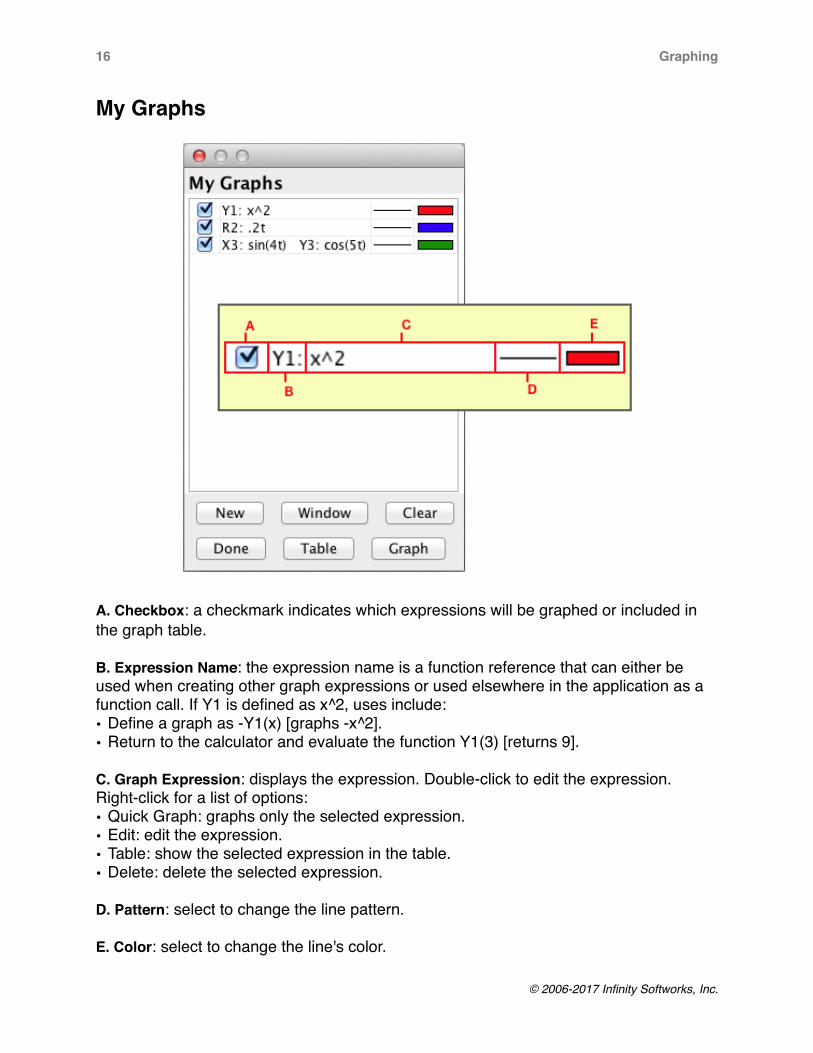
My Graphs
A. Checkbox: a checkmark indicates which expressions will be graphed or included in the graph table.
B. Expression Name: the expression name is a function reference that can either be used when creating other graph expressions or used elsewhere in the application as a function call. If Y1 is defined as x^2, uses include:• Define a graph as -Y1(x) [graphs -x^2].• Return to the calculator and evaluate the function Y1(3) [returns 9].
C. Graph Expression: displays the expression. Double-click to edit the expression. Right-click for a list of options:• Quick Graph: graphs only the selected expression. • Edit: edit the expression. • Table: show the selected expression in the table.• Delete: delete the selected expression.
D. Pattern: select to change the line pattern. E. Color: select to change the line's color.
© 2006-2017 Infinity Softworks, Inc.

� Graphing17
Buttons: • New: select to create a new graph expression. See the New/Edit Graph section. • Window: select to edit the Window settings. See the Zooming/Graph Window section. • Table: select to display the graph table of all checked expressions. See the Graph
Table section. • Graph: select to graph and analyze the checked expressions. See the Graph View
section. • Clear: select to clear all graphs. • Done: select to return to the calculator.
New/Edit GraphNew/Edit Graph is used to create and edit expressions. Select the "New" button in My Graphs to create a new graph. Double-click an already created expression to edit it.
Select the Graph Type from the list in the top, right-hand corner. That selection changes both the Data and Preferences tabs. Each tab is discussed below.
Data
• Expression Name: the expression name is a function reference that can either be used when creating other graph expressions or used elsewhere in the application as a function call. It is defined by the software and displayed in the top, left-hand corner of New/Edit Graph.
© 2006-2017 Infinity Softworks, Inc.

� Graphing18
• Expression Area: enter the expression here. Use the computer keyboard or select functions from the "f(x)" button. The area is denoted as follows:
• Function: y(x) [y is the dependent variable, x is the independent variable used in the expression]
• Polar: r(t) [r is the dependent variable, t is the independent variable used in the expression]
• Parametric: x(t) and y(t) [x and y are the dependent variables, t is the independent variable used in the expression]
• Line: select a line pattern [single thick, double thick, triple thick, dotted]. • Color: select a line color. • Buttons:
• OK: saves changes and returns to My Graphs.• Cancel: throws out changes and returns to My Graphs.
Preferences
•Trig Mode: trigonometric mode to use when analyzing trigonometric functions. • Minimum: starting plot value for the independent variable. Can either be a value or
expression. • Maximum: ending plot value for the independent variable. Can either be a value or
expression. • Step: distance between plotted points. Can either be a value or expression. • Buttons:
• Default: returns the preferences to its default settings (as pictured above). New Graph uses the same preferences for the previous expression of the same graph type.
• OK: saves changes and returns to My Graphs. • Cancel: throws out changes and returns to My Graphs.
© 2006-2017 Infinity Softworks, Inc.
� Graphing19
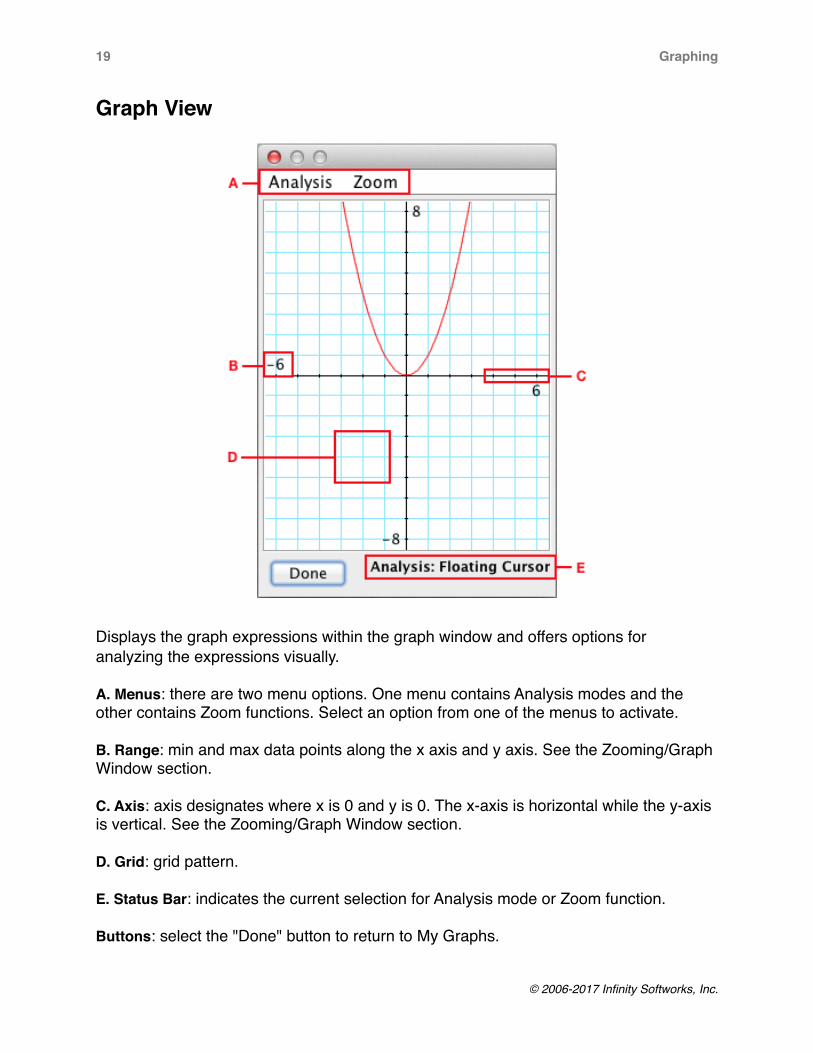
Graph View
Displays the graph expressions within the graph window and offers options for analyzing the expressions visually.
A. Menus: there are two menu options. One menu contains Analysis modes and the other contains Zoom functions. Select an option from one of the menus to activate.
B. Range: min and max data points along the x axis and y axis. See the Zooming/Graph Window section.
C. Axis: axis designates where x is 0 and y is 0. The x-axis is horizontal while the y-axis is vertical. See the Zooming/Graph Window section.
D. Grid: grid pattern.
E. Status Bar: indicates the current selection for Analysis mode or Zoom function.
Buttons: select the "Done" button to return to My Graphs.
© 2006-2017 Infinity Softworks, Inc.

� Graphing20
Analysis ModesThere are seven analysis modes for analyzing graphs. This chart provides a brief overview:
* available when two or more expressions are graphed.
General Functionality
• Select an analysis mode by selecting the Analysis menu and choosing an option. Only the available analysis modes are shown.
• When an analysis mode is selected, the status bar displays the mode. • Analysis modes include tips. After selecting a mode, hover the mouse over the graph
window until it appears. (The tips are not available when the calculator is used during the exam.)
• The results of the last analysis mode are stored for reference elsewhere in the application. These variables are accessed similar to other variables. See the My Data section for more information.
Floating Cursor Mode
• Graph Types: Function, Polar, Parametric• Functionality: display the current mouse coordinates.• Display: no change to graph window; shows cursor position in a pop-up window. ·• Process: click and hold the mouse anywhere in the view window.
Trace/Evaluate Mode
• Graph Types: Function, Polar, Parametric• Functionality: trace or evaluate the selected expression.
Type Interaction Function Polar Parametric
Floating Cursor Drag Cursor x x x
Trace/Evaluate Drag Cursor x x x
Intersection * Select Range x
Zero Select Range x
Minimum Select Range x
Maximum Select Range x
Table x x x
© 2006-2017 Infinity Softworks, Inc.

� Graphing21
• Display: graph window shrinks to accommodate analysis mode; shows cursor position both visually and numerically.
• Process: 1. Select an expression from the list. 2. Drag the mouse along the curve. Note: the cursor indicates current position. 3. Enter an "X" value to calculate a "Y" value. Note: the cursor indicates current
position.
Intersection Mode
• Graph Types: Function• Functionality: find the intersection between two expressions.• Display: graph window shrinks to accommodate analysis mode; shows cursor position
both visually and numerically.• Process:
1. Select an expression from the first list and a different expression from the second list.
2. Draw bounds around the intersection point:• Click on the left side of the range.• Drag to the right side of the range.• Release.
Zero Mode
• Graph Types: Function• Functionality: find the point where the selected expression intersects the x-axis. Also
known as Root analysis.• Display: graph window shrinks to accommodate analysis mode; shows cursor position
both visually and numerically.• Process:
1. Select an expression from the list.2. Draw bounds around the zero point:
• Click on the left side of the range. • Drag to the right side of the range.• Release.
Minimum Mode
• Graph Types: Function• Functionality: find the selected equation's minimum point.• Display: graph window shrinks to accommodate analysis mode; shows cursor position
both visually and numerically.• Process:
1. Select an expression from the list.2. Draw bounds around the minimum point:
• Click on the left side of the range.
© 2006-2017 Infinity Softworks, Inc.
� Graphing22
• Drag to the right side of the range.• Release.
Maximum Mode
• Graph Types: Function• Functionality: find the selected equation's maximum point.• Display: graph window shrinks to accommodate analysis mode; shows cursor position
both visually and numerically.• Process:
1. Select an expression from the list. 2. Draw bounds around the maximum point:
• Click on the left side of the range.• Drag to the right side of the range.• Release.
Graph Table
• Graph Types: Function, Polar, Parametric• Functionality: displays a table of data pertaining to the displayed graph expressions.• See the Graph Table section for additional information.
Graph Table
AccessingAccess the graph table via:• My Graphs: check the desired expressions then choose the "Table" button.• My Graphs: right-mouse select an expression and choose Table from the list.• Graph View: choose Table from the Analysis menu.
A. Graph Type: expressions of the same type are displayed at the same time. Select the desired Graph Type from the list.
B. Table: the table displays numerical data pertaining to the selected expressions.• The first column is reserved for the independent variable (Function: X, Polar: T,
Parametric: T). Start is the top of the table and Step is the difference between points for the independent variable.
• Each additional column is for the expressions. Each graph type uses a different number of additional columns:
• Function: one column (Y)• Polar: three columns (R, X, Y)• Parametric: two columns (X, Y)
• Scroll horizontally to see additional expressions. • Scroll vertically to see 100 independent data points.
© 2006-2017 Infinity Softworks, Inc.

� Graphing23
C. Scroll Buttons: use the scroll buttons to adjust the Start value up or down.
D. Start: start value for the independent variable (top of the table). Adjust the Start value by selecting, changing the value and selecting Enter on the keyboard or use the scroll buttons [C].
E. Step: distance between evaluated points for the independent variable.
Zooming/Graph Window
There are eight zoom modes for adjusting the graph window:
Type Interaction
Box Draw Box
In Select Point
© 2006-2017 Infinity Softworks, Inc.

� Graphing24
General Functionality
• Each Zoom mode has the effect of modifying the Window Settings. These Settings are defined under Window below.
• Select a zoom mode by selecting the Zoom menu and choosing an option. • Some modes require interaction and some are automatic. Modes that require
interaction are denoted in the status bar. • Zoom modes that require interaction include tips. After selecting a mode, hover the
mouse over the graph window until it appears. (The tips are not available when the calculator is used during the exam.)
Box
• Functionality: zoom to the specified area in the graph window.• Display: draw a box in the graph window, window settings adjust to the selected area.• Process: draw a box in the graph window:
• Click and hold at the top, left-hand corner of the box.• Drag to the bottom, right-hand corner of the box.• Release.
In
• Functionality: zoom in and center at the specified point in the graph window.• Display: select a point in the graph window, divides X/Y range values by Zoom Scale,
re-centers at the selected point.• Process: select a desired point within the graph window.
• Click down within the graph window.• Release.
Out
• Functionality: zoom out and center at the specified point in the graph window.
Out Select Point
Previous None Required
Default None Required
Trig None Required
Square None Required
Window
Type Interaction
© 2006-2017 Infinity Softworks, Inc.

� Graphing25
• Display: select a point in the graph window, multiplies X/Y range values by Zoom Scale, re-centers at the selected point.
• Process: select a desired point within the graph window. • Click down within the graph window.• Release.
Previous
• Functionality: returns to the previous graph window settings.• Display: returns to the previous graph window settings.• Process: no interaction required.
Default
• Functionality: returns to the default graph window settings. See Window below for additional information.
• Display: returns to the default window settings.• Process: no interaction required.
Trig
• Functionality: adjusts the graph window for improved viewing of trigonometric expressions.
• Display: x-axis range is set to -2pi and 2pi and x-scale is set to pi/2. The y-axis range and y-scale is not adjusted.
• Process: no interaction required.
Square
• Functionality: attempts to adjust the x and y ranges so the change of x is the same as the change of y.
• Display: attempts to make the grid square (so circles look circular).• Process: no interaction required.
Window
• X Minimum: minimum on the x-axis (horizontal, far left edge of the graph window). [default = -6.5]
• X Maximum: maximum on the x-axis (horizontal, far right edge of the graph window). [default = 6.5]
• Y Minimum: minimum on the y-axis (vertical, bottom edge of the graph window). When in an analysis mode, the bottom 12.5% is clipped, however Y Min setting remains the same. [default = -8.5]
• Y Maximum: maximum on the y-axis (vertical, top edge of the graph window). When in an analysis mode, the top 12.5% is clipped, however Y Max setting remains the same. [default = 8.5]
• X Scale: determines the tick intervals on the x-axis. [default = 1.0]
© 2006-2017 Infinity Softworks, Inc.

� Graphing26
• Y Scale: determines the tick intervals on the y-axis. [default = 1.0] • Zoom Scale: ratio to jump when zooming in or out. A setting of 2 means 2 times.
[default = 2.0] • Show Axis: check this box to show the axis. [default = checked] • Show Grid: check this box to show the grid. [default = checked]• Show Range: check this box to show the range values. [default = checked] • Buttons:
• OK: saves changes and exits Window Settings.• Cancel: throws out changes and exits Window Settings.• Default: restores the default graph window settings.
© 2006-2017 Infinity Softworks, Inc.

� Functions27
7 Functions
Symbol ChartThis section outlines common symbols and their equivalents within this software. Select a Function Name to go to that function reference.
Symbol Function Name
− Subtraction
. Decimal Separator
!= Not Equal *
" " Quote Marks *
x% Percent
&& And *
( ) Parentheses
* Multiplication
/ Division
÷ Division
; Semi-Colon
|| Or *
+ Addition
(−) Negate
< Less Than *
<= Less Than or Equal To *
<> Not Equal *
= Equals *
== Equals *
> Greater Than *
© 2006-2017 Infinity Softworks, Inc.
GRAPH, SCIENTIFIC

� Functions28
>= Greater Than or Equal To *
^ Power
← Backspace
√x Square Root
x√y Root
∏ pi (constant)
1/x Reciprocal
10x Power of 10
abs Absolute Value
acos Arc-Cosine
asin Arc-Sine
atan Arc-Tangent
CLR Clear
cos Cosine
e e (constant)
ex Exponential
EE Exponent
ENT Enter
fact Factorial
int Integer
last Last
ln Natural Logarithm
nCr Combinations
nPr Permutations
Symbol Function Name
© 2006-2017 Infinity Softworks, Inc.

� Functions29
* The starred functions are not available in Scientific calculator.
CategoriesChange the calculator's Function List to display different functions in the first two rows of the keypad. These functions are listed here.
RCL Memory
root Root
sin Sine
solve Solve *
sqrt Square Root
STO Memory
tan Tangent
x Multiplication
x! Factorial
x-1 Reciprocal
x2 Square
xth root Root
xy Power
Symbol Function Name
math
x2 √x xy x√y 1/x
log 10x ln ex x%
© 2006-2017 Infinity Softworks, Inc.

� Functions30
* The Boolean category and ‘=’ under Number category are not available in Scientific calculator.
A,B,C
Absolute Value
abs(value)Returns absolute value of value. Category: numberExamples:• abs(-15.6) : returns 15.6
Addition
valueA + valueBReturns valueA plus valueB.Category: not applicableExamples:• 3.2 + 4.6 : returns 7.8
And
valueA && valueBAvailable in Graphing calculator only. Returns true if both valueA and valueB are true.Category: boolean
trig
asin acos atan
sin cos tan ∏
number
abs int last = *
nPr nCr fact
boolean *
== > < && “
!= >= <= || solve
© 2006-2017 Infinity Softworks, Inc.

� Functions31
Examples:• 0 && 5 : returns false• 1 && 5 : returns true• (5 > 3) && (5 < 3) : returns false • (5 != 3) && (6 != 4) : returns true
Arc-Cosine
acos(value) Returns arc-cosine of value. Category: trig Examples: • acos(-.5) : returns 2.0944 when Trig Mode set to Radians• acos(-.5) : returns 120 when Trig Mode set to Degrees
Arc-Sine
asin(value) Returns arc-sine of value. Category: trig Examples:• asin(.5) : returns 0.5236 when Trig Mode set to Radians• asin(.5) : returns 30 when Trig Mode set to Degrees
Arc-Tangent
atan(value) Returns arc-tangent of value.Category: trig Examples:• atan(1) : returns 0.7854 when Trig Mode set to Radians• atan(1) : returns 45 when Trig Mode set to Degrees
Backspace
←Moves backwards one space, deleting the item before the cursor.Category: not applicableExamples:• 345.67 ← : shows 345.6
Clear
CLR
© 2006-2017 Infinity Softworks, Inc.

� Functions32
If there is an expression in the input area, selecting clear deletes the expression. If there is no expression in the input area, clear clears the view window. The previous calculation is still available in history.Category: not applicable
Combinations
nCr(n; r)Returns the number of combinations of n taken r at a time. n, r must be integer values where r <= n, 0 <= n, r <= 170. Returned value correspond to n!/(r!(n-r)!)Category: numberExamples:• nCr(8; 3) : returns 56
Cosine
cos(value)Returns cosine of value.Category: trigExamples:• cos(30) : returns 0.1543 when Trig Mode set to Radians• cos(30) : returns 0.866 when Trig Mode set to Degrees
D,E,F,G,H
Decimal Separator
. (decimal point) Separates the integer and fractional portion of the number. Category: not applicable
Division
valueA / valueBReturns valueA divided by valueB.Category: not applicableExamples:• 88 / 44 : returns 2• 18.6 / 4.5 : returns 4.1333
e
eConstant e is equal to 2.71828182846. Cannot be used with implicit multiplication (e.g., 2e is not an acceptable entry).Category: not applicable
© 2006-2017 Infinity Softworks, Inc.

� Functions33
Examples:• 2*e : 5.4365
Enter
ENTSelect to evaluate an expression or accept a value in an input area.
Equals
valueA == valueBAvailable in Graphing calculator only. Returns true if valueA is equal to value valueB. Note that this operator is entered using two consecutive "=" characters, not a single "=" character. The single "=" is used for variable assignment and solver equation definitions.Category: booleanExamples:• 5 == 5 : returns true• 5 == 1 - 5 : returns false
<variable name> = valueAvailable in Graphing calculator only. Assigns a value to a variable. See the My Data section for more information.Category: numberExamples:• a = 3 : assigns 3 to variable 'a'
equation = equationUsed for creating solver equations. See the Solver section for more information.
Exponent
value E exponentUsed to make value times 10 raised to exponent where exponent is an integer (whole number). value*10^exponent must lie between 1E-308 and 1E308 inclusive.Category: not applicableExamples:• 5E3 : equivalent to 5000• 5E-3: equivalent to 0.005• 314 E (-) 2: equivalent to 3.14
Exponential
e^valueReturns e raised to the value power.Category: mathExamples:• e ^ 4 : returns 54.5982
© 2006-2017 Infinity Softworks, Inc.

� Functions34
• e ^ 6.85 : returns 943.8809
Factorial
fact(value)Returns factorial of value, where -169 < value <= 170.Category: numberExamples:• fact(6) : returns 720
Greater Than
valueA > valueBAvailable in Graphing calculator only. Returns true if valueA greater than valueB.Category: booleanExamples:• 1 > 0.55 : returns true• 1 > 5 : returns false• 1 > 1 : returns false
Greater Than or Equal To
valueA >= valueBAvailable in Graphing calculator only. Returns true if valueA greater than or equal to valueB.Category: booleanExamples:• 1 >= 0.55 : returns true• 1 >= 5 : returns false• 1 >= 1 : returns true
I,J,K,L,M,N
Integer
int(value)Returns the greatest integer less than or equal to value.Category: numberExamples:• int(4.5) : returns 4• int(-4.5) : returns -5
Last
lastReturns the last calculated value.
© 2006-2017 Infinity Softworks, Inc.

� Functions35
Category: number
Less Than
valueA < valueBAvailable in Graphing calculator only. Returns true if valueA less than valueB.Category: booleanExamples:• 1 < 0.55 : returns false • 1 < 5 : returns true • 1 < 1 : returns false
Less Than or Equal To
valueA <= valueB Available in Graphing calculator only. Returns true if valueA less than or equal to valueB. Category: boolean Examples:• 1 <= 0.55 : returns false• 1 <= 5 : returns true• 1 <= 1 : returns true
Logarithm
log(value) Returns the base 10 logarithm of value.Category: math Examples:• log(4) : returns 0.6021• log(78.36) : returns 1.8941
Multiplication
valueA * valueBReturns valueA times valueB.Category: not applicableExamples:• 5 * 63 : returns 315• 8.2 * 32.65 : returns 267.73
Natural Logarithm
ln(value)Returns the natural logarithm of value.Category: mathExamples:
© 2006-2017 Infinity Softworks, Inc.

� Functions36
• ln(4) : returns 1.3863• ln(52.43) : returns 3.9595
Negate
−Inserts a negative sign. This software does not differentiate between negate and subtract.Category: not applicable
Not Equal
valueA != valueB valueA <> valueBAvailable in Graphing calculator only. Returns true if valueA does not equal valueB.Category: booleanExamples:• 5 != 6 : returns true• (5*3) != 15 : returns false
O,P,Q
Or
valueA || valueBAvailable in Graphing calculator only. Returns true if valueA is true or valueB is true. Category: booleanExamples:• (5 == 5) || (4 > 5) : returns true • (5 != 5) || (4 > 5) : returns false
Parentheses
( ) Available in Graphing calculator only. Use parentheses to establish precedence when performing calculations. Items within parentheses are evaluated first. Category: not applicable Examples:• 3 + (4 * 5) : returns 23• (3 + 4) * 5 : returns 35
Percent
value% In general, valueA% returns the equivalent of valueA / 100. When it is preceded by a value and a math operand, the following occurs in each case:
© 2006-2017 Infinity Softworks, Inc.

� Functions37
• value% : value / 100• valueA + valueB% : valueA + (valueA * (valueB / 100))• valueA – valueB% : valueA – (valueA * (valueB / 100))• valueA * valueB% : value A * (valueB / 100)• valueA / valueB% : valueA / (valueB / 100)Category: math Examples: • 42 % : returns 0.42• 80 + 10 % : returns 88 (80 + 10% of 80) • 80 - 10 % : returns 72 (80 - 10% of 80) • 522 * 63 % : returns 328.86 • 24 / 33 % : returns 72.7273
Permutations
nPr(n; r) Returns the number of permutations of n taken r at a time. n, r must be integer values where r <= n, 0 <= n, r <= 170. Returned value correspond to n!/(n-r)! Category: number Examples:• nPr(8;3) : returns 336
pi
pi (∏)Constant pi is equal to 3.14159265359.Category: trig Examples: • pi/2 : 1.5708
Power
valueA ^ valueBReturns valueA raised to valueB.Category: mathExamples:• 3 ^ 3 : returns 27• 3 ^ -2.2 : returns .0892
Power of 10
10 ^ valueReturns 10 raised to the power of value.Category: mathExamples:• 10 ^ -1.23 : returns 0.0589
© 2006-2017 Infinity Softworks, Inc.
� Functions38
Quotation Marks
""Quotation marks are used to define an equation and variable using the function solve. See Solve for additional information.Category: boolean
R,S,T
Reciprocal
1 / valueReturns 1 divided by value.Category: mathExamples:• 1/15 : returns 0.0667• 1/89.56 : returns 0.0112
Root
root(y; x)Returns xth root of y.Category: mathExamples:• root(27; 3) : returns 3• root(84.5; 5) : returns 2.4287
Semi-Colon
semi-colon (;)Separates arguments in function calls.Category: not applicableExamples:• root(y; x) : separate the y and x variables in the root function call
Sine
sin(value)Returns sine of value.Category: trigExamples:• sin(30) : returns -0.9880 when Trig Mode set to Radians• sin(30) : returns 0.5 when Trig Mode set to Degrees
© 2006-2017 Infinity Softworks, Inc.
� Functions39
Solve
solve()Available in Graphing calculator only. The solver uses a non-symbolic iterative approach to solve expressions for a particular variable. Because the method is iterative it can take a significant amount of time to complete and may fail to return a result or return a result that is inexact but within the tolerance permitted when using floating point math. This function is applied automatically in the Solver.
The function returns a floating point number containing the value for variable that causes expression to be equal to zero. Expression and variable are both strings. The algorithm will use default minimum and maximum bracket values of –1E300 and 1E300 respectively.
The iteration methodology is as follows: It will take the mid-point between the minimum and maximum and step toward the maximum bracket until a sign change is detected. It will then search for a root around the sign change using Brent's method. If the search does not yield a sign change then it steps negatively towards the minimum bracket from the mid-point between the bracket values until a sign change is found. It will then search for a root around the sign change using Brent's method. If a sign change is not found, it gives up.
The following forms are available:
solve("expression"; "variable")• expression: the expression to solve. Must be in quotations.• variable: the variable within the expression. Must be in quotations.Category: booleanExamples:• solve("x*5=32"; "x") : returns 6.4
solve("expression"; "variable"; guess)• expression: the expression to solve. Must be in quotations.• variable: the variable within the expression. Must be in quotations.• guess: starting point.Category: booleanExamples:• solve("5=x^2-3"; "x"; 2.5) : returns 2.8284
solve("expression"; "variable"; lower; upper)• expression: the expression to solve. Must be in quotations.• variable: the variable within the expression. Must be in quotations.• lower: lower boundary to begin bracketing.• upper: upper boundary to begin bracketing.Category: booleanExamples:
© 2006-2017 Infinity Softworks, Inc.

� Functions40
• solve("8=x^2-3"; "x"; -6.6; 2.5) : returns -3.3166• solve("y=x^2-3"; "x"; -6.6; 2.5) : returns -3.3166 when y = 8 (i.e., assigned variables
are permitted within solver equations.)
Square
value ^ 2Returns value multiplied by value.Category: mathExamples:• 5 ^ 2 : returns 25 • -3 ^ 2 : returns -9
Square Root
sqrt(value) Returns the square root of value. Category: math Examples: • sqrt(9.9) : returns 3.1464
Subtraction
valueA – valueB returns valueA minus valueB. Category: not applicable Examples:2 - 4.89 : returns -2.89
Tangent
tan(value) Returns tangent of value.Category: trig Examples:• tan(0.7854) : returns 1 when Trig Mode set to Radians• tan(45) : returns 1 when Trig Mode set to Degrees
© 2006-2017 Infinity Softworks, Inc.

� Appendix41
8 Appendix
Calculator Error MessagesThe following error messages may appear. Common causes are also listed.• -Infinity: a value is calculated that is smaller than -1e308• +Infinity: a value is calculated that is greater than 1e308 • Can't bracket solution: returned when solving and the solver cannot find an answer • Division by 0: a value is divided by zero • Iteration limit exceeded: the solver has a cap on how long it will try to find an answer.
This error is returned if that limit is exceeded • Missing ": quotation marks are required but missing• Missing left delimiter: missing ( • Missing or invalid operand: expression not completed or missing/invalid operator• Missing right delimiter: missing )• Not a real number: result is a complex number• Not enough arguments: function call missing all or some of its arguments (e.g., sin()
without sending a value)• Operand out of range: a value is entered that is outside the value limits of the function
called• Too many arguments: function call with too many arguments (e.g., sin(2;3) when sin
requires one argument)• Too many nested operations: more than 64 nested parentheses ( )• Unknown function: calling a function that does not exist• Unknown variable: using a variable that does not exist• Missing exponent value: scientific notation constant "E" entered without the exponent
part (e.g., "3.13e")• Invalid variable name: see the My Data section for information regarding variable
naming.• Guess outside of limits: solver guess is outside of the set upper and lower limits• Invalid data type: data type not recognized by the software• 0^0 is undefined: product does not allow 0 raised to the 0th power.
Number Ranges This product supports real numbers in the range -1E308 to 1E308. In general, numbers are displayed with up to 12 decimal places. For better accuracy, numbers are stored internally with 15 decimal places.
© 2006-2017 Infinity Softworks, Inc.
GRAPH, SCIENTIFIC

� Appendix42
Implicit MultiplicationIn certain cases, implicit multiplication is available. Implicit multiplication is where 2 times x is entered as 2x. Multiplication is assumed if the math symbol is missing.
The following examples will support implicit multiplication: • 2x : assumed to be 2 * x• 2 x : (note: the space between 2 and x), assumed to be 2 * x• a b : (note: the space between a and b), assumed to be a * b• 3(x+2) : assumed to be 3 * (x + 2)• 4sin(25) : assumes 4 * sin(25)• 2pi : assumes 2 * the constant pi
The following examples will not support implicit multiplication• ab : this is not a * b, but instead the variable 'ab'. (Enter a multiplication symbol or
space between a and b to handle correctly.)• a2 : this is not a * 2, but instead the variable 'a2'. (Enter a multiplication symbol or
space between a and b to handle correctly.)• a(2+3) : this is not a * (2+3), but instead the function call a(5). (A number before a
parentheses is allowed but a variable before a parentheses is not. Also, a space between a and (2+3) would be considered a function call.)
• 2e : it is unknown whether exponential notation was expected or the calculation is 2 times the constant e.
Legal and DisclaimersInfinity Softworks, Inc., makes no warranty, either expressed or implied, including but not limited to any implied warranties of merchantability and fitness for a particular purpose, regarding any programs or book materials and makes such materials available solely on an "as-is" basis.
In no event shall Infinity Softworks, Inc., be liable to anyone for special, collateral, incidental, or consequential damages in connection with or arising out of the purchase or use of these materials, and the sole and exclusive liability of Infinity Softworks, Inc., regardless of the form of action, shall not exceed the purchase price of this application. Moreover, Infinity Softworks, Inc., shall not be liable for any claim of any kind whatsoever against the use of these materials by any other party.
powerOne is copyright 1997-2012. Infinity Softworks is trademark and powerOne is registered trademark Infinity Softworks, Inc. All rights reserved. All other trademarks and registered trademarks are property of their respective owners.
© 2006-2017 Infinity Softworks, Inc.