Estudio del refrigerante R134a en estado bifásico ...
69
Escuela Técnica Superior de Ingenieros Industriales de Madrid & Norwegian University of Science and Technology Estudio del refrigerante R134a en estado bifásico circulando en un tubo horizontal Trabajo Fin de Grado Oscar Blanco Fernandez Julio de 2016
Transcript of Estudio del refrigerante R134a en estado bifásico ...

Escuela Técnica Superior de Ingenieros Industriales de Madrid &
Norwegian University of Science and Technology
Estudio del refrigerante R134a en estado bifásico circulando en un tubo horizontal
Trabajo Fin de Grado
Oscar Blanco Fernandez Julio de 2016


i
Abstract
High heat transfer rates at reasonably low temperature differences can beobtained by utilizing a boiling fluid. However, the behaviour of the heattransfer coefficient becomes much more intricate, revealing the modellingof this behaviour quite complex. Nevertheless, a good model of this two-phase flow allows for an optimal design and, thus, a safer system with ahigher efficiency regarding heat transfer.
An extensive research has been conducted in the past decades on this topic,however, many aspects remain unexplored. The literature survey presentedin this work condenses previous results in a chronological order, graduallyshowing new discoveries and corrections on previous models. Yielding, inthe end, a wide review of the state of the art on boiling R134a inside anhorizontal, small diameter tube.
The purpose of this study is to perform an experimental investigation on anunexplored region, obtaining new results that may contribute for the elabo-ration of a more accurate model. For this end, a deep study was performedon the different aspects exhibited on the experimental results together witha comparison with the literature survey, allowing for the extrapolation ofnew conclusions on the topic.
Experiments were conducted inside a 5mm internal diameter tube with apressure of 5.5 bar, mass fluxes ranging from 200kg/m2s to 400kg/m2s andheat fluxes ranging from 15.8kW/m2 to 47.8kW/m2. Under these condi-tions, due to the high heat flux and pressure selected, the nucleate boilingcontribution on the heat transfer was found significantly stronger than theconvective contribution. As a result, the heat transfer coefficient presenteda strong dependence on the heat flux, while the effect of mass flux was onlyimportant for higher vapour qualities, were the convective heat transfermechanism gains strength.
Deep focus was also made on the dryout region, revealing interesting be-haviours regarding both the vapour quality at which dryout occurred andthe HTC achieved at dryout inception. Moreover, a sharp increase of theheat transfer coefficient was found before dryout inception, this feature hadbeen reported only once prior to this project and the experimental resultspresented in this work have revealed resourceful for the investigation ofthis new characteristic.


iii
AcknowledgementsThanks to the erasmus program that has allowed me to elaborate this projectat NTNU, my family that has helped to make it possible, the new friend-ships acquired that have become my best support along the year, and mycoordinator, Carlos A. Dorao, that has been always helpful.


v
Contents
Abstract i
Acknowledgements iii
1 Introduction 1
2 Literature Survey 32.1 Initial approach to heat transfer in tubes . . . . . . . . . . . . 32.2 State of the art on HTC for boiling R134a over high quality
values . . . . . . . . . . . . . . . . . . . . . . . . . . . . . . . . 4
3 Experimental facility 153.1 Description of apparatus . . . . . . . . . . . . . . . . . . . . . 15
3.1.1 Thermo-hydraulic system . . . . . . . . . . . . . . . . 153.1.2 Working fluid . . . . . . . . . . . . . . . . . . . . . . . 153.1.3 Pump . . . . . . . . . . . . . . . . . . . . . . . . . . . . 163.1.4 Pre-conditioner . . . . . . . . . . . . . . . . . . . . . . 163.1.5 Heated test section . . . . . . . . . . . . . . . . . . . . 173.1.6 Flow restrictions . . . . . . . . . . . . . . . . . . . . . 173.1.7 Condenser . . . . . . . . . . . . . . . . . . . . . . . . . 18
3.2 Associated instrumentation . . . . . . . . . . . . . . . . . . . 183.2.1 Mass flow rate . . . . . . . . . . . . . . . . . . . . . . . 183.2.2 Pressure . . . . . . . . . . . . . . . . . . . . . . . . . . 193.2.3 Temperature . . . . . . . . . . . . . . . . . . . . . . . . 193.2.4 Heat Flux . . . . . . . . . . . . . . . . . . . . . . . . . 203.2.5 Uncertainties and accuracy of measurements . . . . . 203.2.6 Software interface . . . . . . . . . . . . . . . . . . . . . 20
3.3 Main specification overview . . . . . . . . . . . . . . . . . . . 213.4 Risk assessment and safety . . . . . . . . . . . . . . . . . . . . 21
4 Methods 234.1 Execution of experiments . . . . . . . . . . . . . . . . . . . . 23
4.1.1 General steps in operating the facility . . . . . . . . . 234.1.2 Stable system configuration . . . . . . . . . . . . . . . 24
4.2 Data acquisition and logging . . . . . . . . . . . . . . . . . . 254.3 Data reduction . . . . . . . . . . . . . . . . . . . . . . . . . . . 254.4 Measuring of the HTC . . . . . . . . . . . . . . . . . . . . . . 254.5 Global HTC . . . . . . . . . . . . . . . . . . . . . . . . . . . . 26
4.5.1 Test section wall temperature . . . . . . . . . . . . . . 264.5.2 Calculating the fluid temperature . . . . . . . . . . . 27
4.6 Local HTC . . . . . . . . . . . . . . . . . . . . . . . . . . . . . 29
5 Background experimental work 315.1 Learning process . . . . . . . . . . . . . . . . . . . . . . . . . 31

vi
5.2 Pre-work . . . . . . . . . . . . . . . . . . . . . . . . . . . . . . 325.3 Limitations . . . . . . . . . . . . . . . . . . . . . . . . . . . . . 325.4 Errors and malfunctions . . . . . . . . . . . . . . . . . . . . . 33
6 Experimental Results 356.1 Study of the effect of mass flux . . . . . . . . . . . . . . . . . 356.2 Study of the effect of heat flux . . . . . . . . . . . . . . . . . . 37
7 Discussion 417.1 General aspects . . . . . . . . . . . . . . . . . . . . . . . . . . 417.2 Dryout . . . . . . . . . . . . . . . . . . . . . . . . . . . . . . . 437.3 Sharp increase before dryout . . . . . . . . . . . . . . . . . . 45
8 Conclusion 47
Bibliography 51

vii
List of Figures
2.1 HTC vs vapour quality results obtained by Kattan, Thome,and Favrat, 1998a for R-134a . . . . . . . . . . . . . . . . . . . 5
2.2 Dryout zone during evaporation in a horizontal tube accord-ing to Wotjan2005 . . . . . . . . . . . . . . . . . . . . . . . . . 6
2.3 Experimental results on heat transfer coefficient for R134aobtained in da Silva Lima, Quibén, and Thome, 2009 . . . . . 8
2.4 Schematics of flow regimes for (a) nucleate boiling dominantand (b) convective boiling dominant. Taken from Kim andMudawar, 2013 . . . . . . . . . . . . . . . . . . . . . . . . . . 9
2.5 Experimental results acquired in Grauso et al., 2013 . . . . . 102.6 HTC agains vapor quality at average mass flux of 300kg/m2s
(Deng, Fernandino, and Dorao, 2016) . . . . . . . . . . . . . . 112.7 Heating up and heating down procedures comparison by
Deng, Fernandino, and Dorao, 2016 . . . . . . . . . . . . . . 112.8 Difference between the inner wall and saturation tempera-
tures as plotted in Deng, Fernandino, and Dorao, 2016 . . . . 12
3.1 Simplified schematic flow diagram of the experimental con-figuration used in this work. Adopted from Sorrum, 2014 . . 16
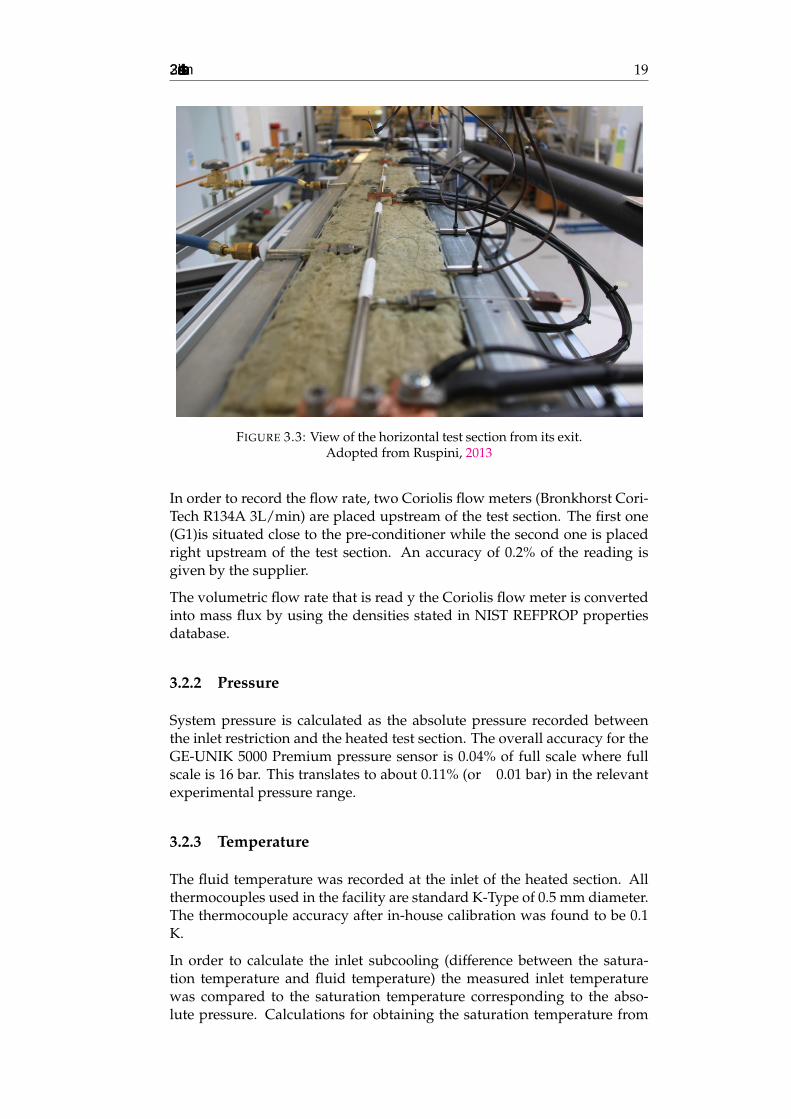
3.2 Sketch of the test section. Adopted from Ugueto, 2013 . . . . 183.3 View of the horizontal test section from its exit. Adopted
from Ruspini, 2013 . . . . . . . . . . . . . . . . . . . . . . . . 193.4 Software interface - main system overview in LabVIEW. Adopted
from Sorrum, 2014 . . . . . . . . . . . . . . . . . . . . . . . . 22
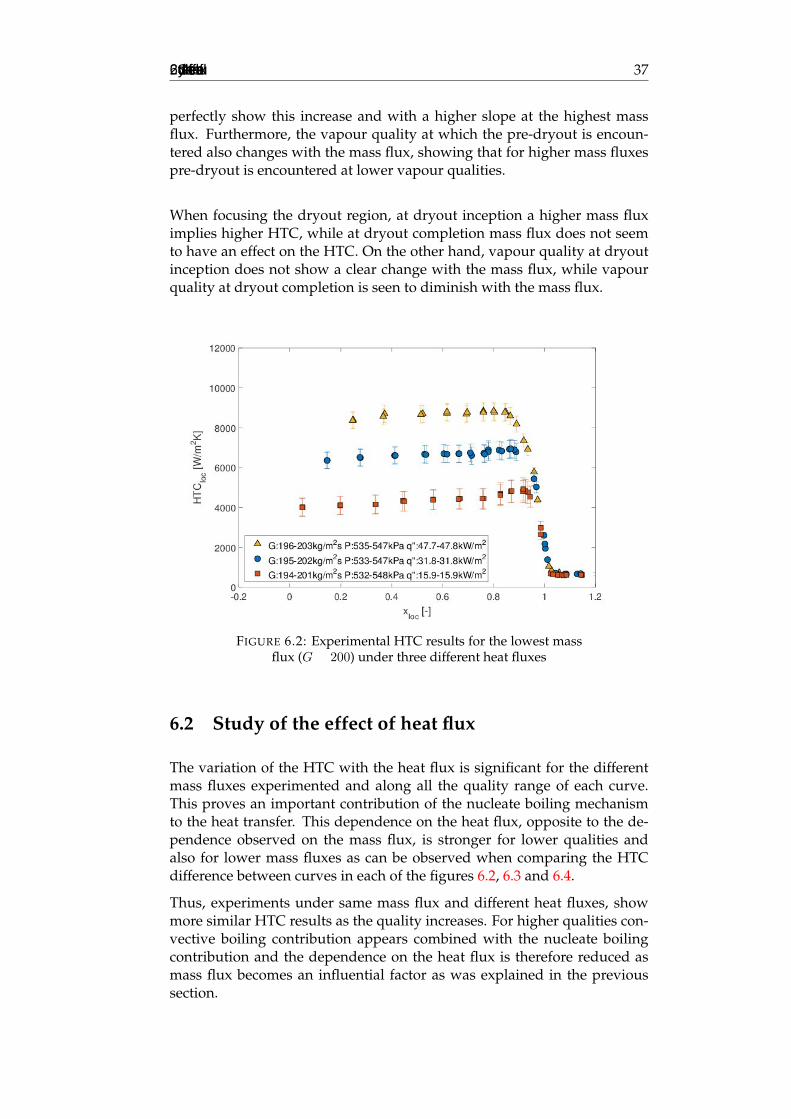
6.1 Main set of experimental data on HTC obtained in this project 366.2 Experimental HTC results for the lowest mass flux (G 200)
under three different heat fluxes . . . . . . . . . . . . . . . . 376.3 Experimental HTC results for the intermediate mass flux (G
300) under three different heat fluxes . . . . . . . . . . . . . . 386.4 Experimental HTC results for the highest mass flux (G
400) under two different heat fluxes . . . . . . . . . . . . . . 39
7.1 Experimental results from Chiapero, Fernandino, and Do-rao, 2014. Blue crosses show the experiment under G =297.7kg/m2s; Tsat = 34.3oC; q00= 20kW/m2 . . . . . . . . . . 42
7.2 Experimental results from Deng, Fernandino, and Dorao, 2016under different mass fluxes . . . . . . . . . . . . . . . . . . . 43
7.3 Difference between the inner wall and saturation tempera-tures, and HTC plotted against vapour quality . . . . . . . . 46


ix
List of Tables
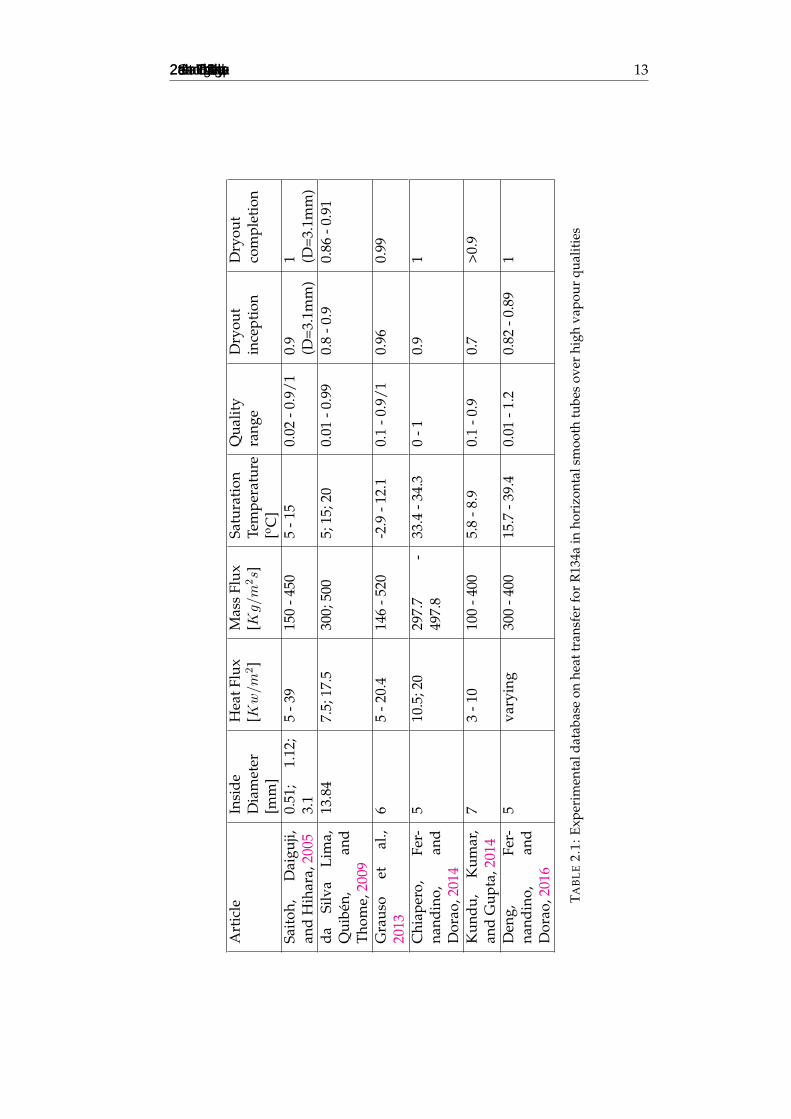
2.1 Experimental database on heat transfer for R134a in horizon-tal smooth tubes over high vapour qualities . . . . . . . . . . 13
3.1 Accuracy of the facility instrumentation. Adopted from Rus-pini, 2013 . . . . . . . . . . . . . . . . . . . . . . . . . . . . . . 21
3.2 Uncertainties of the main operational parameters. Adoptedfrom Ugueto, 2013 . . . . . . . . . . . . . . . . . . . . . . . . . 21
3.3 Key specification of the two-phase flow instability facility.Adopted from Sorrum, 2014 . . . . . . . . . . . . . . . . . . . 22
6.1 Range of conditions presented in the main set of experimen-tal data . . . . . . . . . . . . . . . . . . . . . . . . . . . . . . . 35


xi
List of Abbreviations
HTC Heat Transfer CoefficientHCFC Hydro Chloro Fluoro CarbonHFC Hydro Fluoro CarbonGWP Global Warming PotentialDWO Density Wave Oscillations


1
Chapter 1
Introduction
The use of energy in the world has increased in the last century in over an800%. Energy dependency is present everywhere, from domestic to indus-trial environments its increasing demand urges for a more efficient usage.Amongst the activities in which this energy is used, heat transfer covers asignificant part as it represents a vital feature of almost any energy convert-ing system. For this purpose, enhancing the heat transfer is crucial in orderto reduce the thermodynamical losses. Thus, improving the heat transfercoefficient of a heat exchange process is of vital importance in order to re-duce the amount of energy needed for the system.
In the pursuit for a larger heat transfer coefficient, heat exchangers designedto be used with a boiling fluid have proven to yield larger heat transfer coef-ficients. On the downside, the modelling of the heat transfer in a two-phasefluid represents a great challenge due to the complexity of the boiling pro-cess. Moreover, designing a heat exchange system relying on an unrealisticmodel, will likely result in energy losses due to an inefficient heat exchange,and in worst cases, it may even lead to burnout crisis that often produce aphysical damage in the facility.
Thus, it can be noticed the importance of providing realistic models inwhich the industry can rely when designing heat exchangers. This aim to-wards accuracy urges researches to be conducted for each specific arrange-ment in which the exchanger may be disposed, distinguishing as well forthe type of refrigerant used.
This project was focused particularly on the study of refrigerant R134a alonghorizontal smooth tubes. This setting is of significant relevance due to itswide use in the industry. Furthermore, experimental researches on flowboiling in horizontal smooth tubes have been conducted for almost a cen-tury, but only when finding an alternative for HCFCs started becoming anissue (due to their high chlorine concentration) was R134a studied in theseexperiments.
The modelling for R134a has revealed challenging and the correlations achievedstill fail to predict many aspects of its behaviour. When compared to the ex-perimental database, the errors are found mainly in the high quality region,where transitions between annular, dryout and mist flow regimes greatlyincrease the complexity of the process.
For this end, the research conducted in this project is focused on this regionand aims to provide guidance towards a better modelling by providing new

2 Chapter 1. Introduction
experimental data and reviewing the different studies developed on thetopic for further comparison.

3
Chapter 2
Literature Survey
2.1 Initial approach to heat transfer in tubes
Convective heat transfer is one of the main heat transfer mechanism andusually the dominant form of heat transfer in liquids and gases. It involvesthe combined processes of conduction (heat diffusion) and advection (heattransfer by bulk fluid flow). The effect is therefore based on the transferenceof heat due to fluid movement, thus, enhancing this movement enhancesconvection. For the case of a fluid flowing through a tube, convection willbe stronger if mass flux is increased. For this case, convection is often distin-guished as the dominant heat transfer mechanism when the HTC is almostindependent on heat flux but strongly dependent on mass flux and vapourquality.
Nucleate boiling heat transfer occurs when the temperature of the surfacecontaining the fluid increases over the saturation temperature. At this pointisolated bubbles form at different nucleation sites and separate from thesurface. This separation induces considerable fluid mixing near the surfaceand substantially increases the convective heat transfer coefficient. Con-cerning the case of a boiling fluid through a tube, nucleate boiling is distin-guished as the dominant heat transfer mechanism when the HTC is nearlyindependent on vapour quality and mass flux but strongly dependent onheat flux.
Annular flow is a flow regime encountered in boiling fluid through tubes. Itis characterized by the presence of a liquid film flowing on the channel wall(in a round channel this film is annulus-shaped which gives the name to thistype of flow) and with the gas flowing in the gas core. The flow core cancontain entrained liquid droplets. In horizontal channels the film thicknessis non-uniform around the channel perimeter due to gravity. Indeed, thelayer thickness presents gradually reduced from the bottom to the top ofthe tube.
Mist flow is the flow regime encountered at the highest vapour qualitiesfor flow boiling in tubes. At this stage the tube only contains vapour withentrained droplets of liquid which will continue evaporating until onlyvapour is left in the tube. Due to the low conductivity of the vapour theheat transfer coefficient is greatly reduced.
4 Chapter 2. Literature Survey
Dryout represents the transition from annular flow to mist flow. Duringdryout the liquid film next to the wall evaporates until the layer disappearsand only vapour and droplets of liquid are left.
2.2 State of the art on HTC for boiling R134a over highquality values
The first attempt to model the annular to mist flow transition during evapo-ration in horizontal tubes was made by Lavin and Young (Lavin and H.Young,1965). They proposed that the transition between annular and mist flowcovered another region corresponding to the burnout or dry wall conditionwhich, until then, had been considered to occur at a certain point and notgradually. Their experiments were carried for refrigerants R-22 and R-12and with the used apparatus heat transfer coefficient could not be obtainedwithin the dryout regime nor could be studied the conditions under whichthe dryout regime ends and stable mist flow was established. However,their work prompted the study of the dryout region in horizontal tubes.
Three decades later Kattan, Thome, and Favrat, 1998a would form the firstgeneralized heat transfer pattern map were refrigerant R-134a (which at themoment was a new refrigerant) was used for the experimental database. Incomparison with the earlier version in which the model was based (Steiner,1993), Kattan, Thome, and Favrat, 1998a modified the mist to annular flowboundary making it more realistic and incorporating the effect of the onsetof dryout at high vapour quality. Another keypoint of their study was thatthe map was also transformed into a mass velocity versus vapor qualityformat, which is much more useful when identifying the flow patterns.
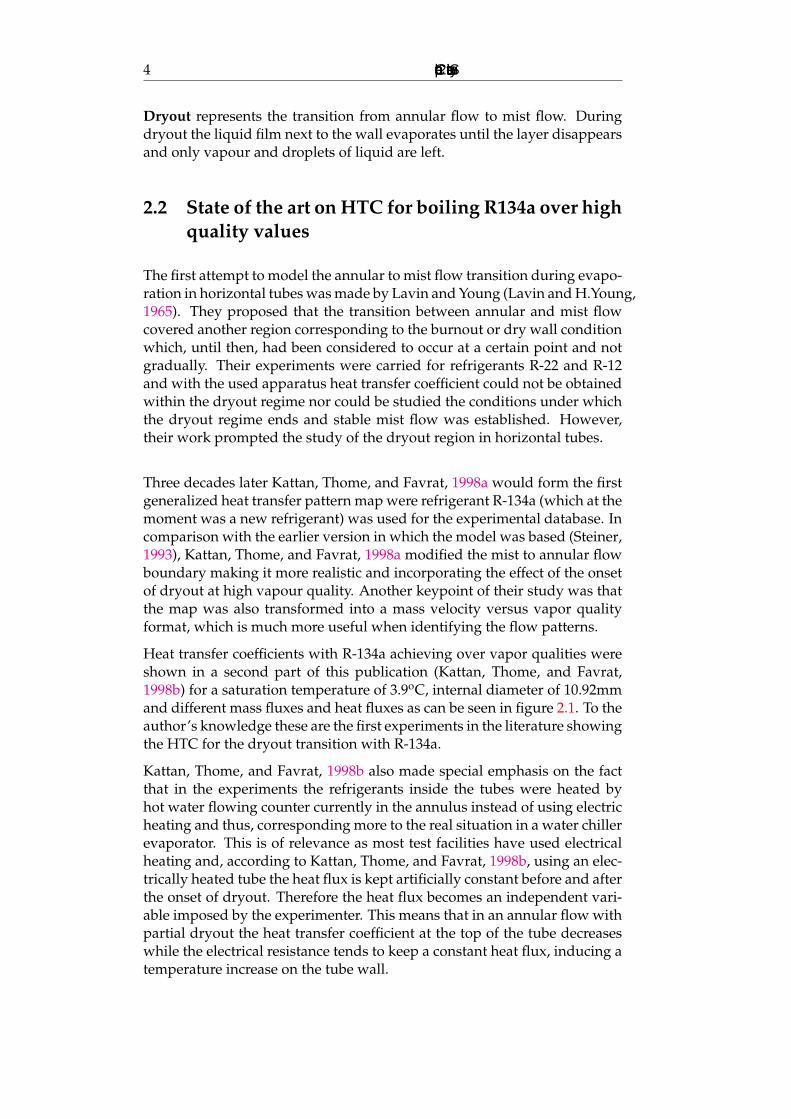
Heat transfer coefficients with R-134a achieving over vapor qualities wereshown in a second part of this publication (Kattan, Thome, and Favrat,1998b) for a saturation temperature of 3.9oC, internal diameter of 10.92mmand different mass fluxes and heat fluxes as can be seen in figure 2.1. To theauthor’s knowledge these are the first experiments in the literature showingthe HTC for the dryout transition with R-134a.
Kattan, Thome, and Favrat, 1998b also made special emphasis on the factthat in the experiments the refrigerants inside the tubes were heated byhot water flowing counter currently in the annulus instead of using electricheating and thus, corresponding more to the real situation in a water chillerevaporator. This is of relevance as most test facilities have used electricalheating and, according to Kattan, Thome, and Favrat, 1998b, using an elec-trically heated tube the heat flux is kept artificially constant before and afterthe onset of dryout. Therefore the heat flux becomes an independent vari-able imposed by the experimenter. This means that in an annular flow withpartial dryout the heat transfer coefficient at the top of the tube decreaseswhile the electrical resistance tends to keep a constant heat flux, inducing atemperature increase on the tube wall.

2.2. State of the art on HTC for boiling R134a over high quality values 5
FIGURE 2.1: HTC vs vapour quality results obtained byKattan, Thome, and Favrat, 1998a for R-134a
The models published in these articles would be later corrected by Wotjan2005;Wotjan2005a whose flow-pattern map and heat transfer models are the ba-sis for today’s corrections.
Although R-134a was not used in this research, it’s repercussion is of criti-cal importance for this project’s literature review. On their efforts towardsstudying the transition from annular to mist flow they integrated a newboundary in the flow pattern map that covered the dryout region, thus, di-viding the traditional annular to mist flow transition in annular-dryout anddryout-mist.
It was now obvious with the observations made in their experiments thatthere was no step-wise transition from annular flow to mist flow. For thisnew regime they sketched the dryout region as depicted in figure 2.2. Itcan be seen here how dryout occurs at the top of the tube first, where theliquid is thinner, and then progresses downward around the perimeter untilreaching the bottom.
Another significant observation regarding dryout was reported in their ex-periments stating that the qualities at which dryout inception and comple-tion occur increase with mass velocity. Should be reminded that these ex-periments were not using R-134a as a refrigerant so their results are notconclusive to our study. However, they shall be given attention as theyindicate how other refrigerants may behave.
Also a matter of interest reported in Wotjan2005 was the observation ofhysteresis in the process when reducing the heat duty after reaching mistflow. This points to a possible error when testing for increasing power ofthe preheaters instead of decreasing their power after having reached thedesired quality.
On this same year Saitoh, Daiguji, and Hihara, 2005 reported experimentsfor different small diameters with refrigerant R-134a. Results showed thatas the tube diameter decreased: (i) contribution of forced convective evap-oration to boiling heat transfer decreased; (ii) onset of dryout occurred in alower quality region.

6 Chapter 2. Literature Survey
FIGURE 2.2: Dryout zone during evaporation in a horizon-tal tube according to Wotjan2005
Despite the fact that, as can be observed in table 2.1, these experiments weremost of them performed with diameters too small for the range focusedin this project (D>3mm).Yet, Saitoh, Daiguji, and Hihara, 2007 stated thatthese two conclusions could be applied to higher diameters. Furthermore,the article uses these results to elaborate a new correlation for heat transferwhich is said to be appropriate for internal diameters ranging from 0.5mmto 10mm.
As HCFCs were phasing out due to their large concentration of chlorine,harmful for the ozone lager, investigations on HFCs such as R134a becamemore important as this new family was regarded as a likely substitute forHCFCs. For this purpose Greco, 2008 compared experimentally differentHCFCs and HFCs (including R-134a). Several conclusions affecting theheat transfer for high vapour qualities were drawn from the experiments:(i)HTCs always increase with mass flux following an exponential relation;(ii) HTCs depend on heat flux only in the region where nucleate boilingdominates; (iii) HTCs increase with saturation temperature due to the nu-cleate boiling contribution, this increase is less noticeable for higher vapourqualities.
Comparison between the different refrigerants also presented R-134a as abetter option, with a higher HTC than the rest. In addition, this differencewas observed to increase with the saturation temperature. Favourable re-searches towards R-134a such as this one induced an special interest on therefrigerant and consequently urged for further investigations during thenext years.
da Silva Lima, Quibén, and Thome, 2009 was (to the author’s knowledge)the first report to show HTC for R-134a with small quality increments in thehigh quality region. In this deep study into R-134a, different heat fluxes,mass velocities and saturation temperatures were used as variables (table2.1). The experimental procedure used, in which only one of the variableswould change while the other two remained constant, allowed for an or-derly classification of the effect of each of the variables in the HTC, which

2.2. State of the art on HTC for boiling R134a over high quality values 7
for higher vapour qualities showed the conclusions reported in the follow-ing paragraphs. Figure 2.3 shows the experimental results in which thoseconclusions are based and aims to provide the reader with a visual refer-ence that allows for a better understanding of the written results:
Saturation temperature influence: Opposite to Greco, 2008 the HTCdoes not always increase with Tsat instead, for higher vapour qual-ities the experiments show higher HTCs with lower Tsat . It is ex-plained that this decrease of HTC with Tsat for higher vapour qual-ities is due to: (i) Vapour density increases with Tsat , thus its velocitydecreases and thereby its convective boiling contribution; (ii) Liquidthermal conductivity decreases with Tsat . The same reasons are saidto force the HTC at dryout inception and completion to decrease withTsat while the vapour quality at which they occur is clearly seen to in-crease. During the dryout region, the curves with different Tsat mergetogether again and intersect.
Mass velocity influence: Its influence on the HTC is more importantfor higher vapour qualities and always leads to an increase in the HTCas it was also reported by Greco, 2008. Mass velocity is also said to de-crease the vapour quality at which dryout inception and completionoccur due to the increase that mass velocity produces on the convec-tive boiling contribution.
Heat flux influence: The vapour quality at which dryout inceptionoccurs is observed to decrease with increasing heat flux. This earlierdryout implicates that the HTC achieved at dryout is lower for higherheat fluxes. Thus stating that an increasing heat flux decreases theHTC of the onset of dryout.
Kim and Mudawar, 2013 focused on the study of dryout and claimed thatdryout is closely associated with the saturated inlet conditions and the de-velopment of a clearly identifiable annular flow regime. The article differ-entiates dryout depending on the type of heat transfer regime were theyoccur: (i)For nucleate boiling dominant heat transfer bubbly and slug flowregimes occupy a significant portion of the channel length and the heattransfer coefficient decreases with vapour quality due to gradual suppres-sion of nucleate boiling; (ii)On the other hand for convective boiling dom-inant heat transfer, annular flow spans a significant fraction of the channellength. Here, gradual evaporation and thinning of the annular liquid filmcauses the heat transfer coefficient to increase along the channel length.
With a sufficiently high wall heat flux or sufficiently long channel, the an-nular film becomes vanishingly thin for both heat transfer regimes and alack of perfect symmetry in the film flow or uneven evaporation causes ini-tial dry patches to form at the location of dryout incipience where the HTCbegins to decrease appreciably until dryout completion occurs. Schematicsof the flow regimes with either nucleate boiling heat transfer or convectiveboiling heat transfer as dominant taken from this article are shown in figure2.4.
Grauso et al., 2013 compared R1234ze(E) (a low-GWP refrigerant) with R134a.For this comparison further experiments were made with R134a coveringpart of the high quality region. Despite only some of the experiments were

8 Chapter 2. Literature Survey
FIGURE 2.3: Experimental results on heat transfer coeffi-cient for R134a obtained in da Silva Lima, Quibén, and
Thome, 2009
conducted until dryout completion, their results are quite interesting sincethey help corroborate most of the conclusions affirmed by da Silva Lima,Quibén, and Thome, 2009 while being conducted with a much smaller di-ameter as can be seen in table 2.1.
Another important observation can be made when comparing the exper-imental database shown in Grauso et al., 2013 that is displayed in figure2.5 with the one in da Silva Lima, Quibén, and Thome, 2009 displayed in2.3(c) under similar conditions but with a much larger diameter (13.84mm):Recalling the mentioned article of Saitoh, Daiguji, and Hihara, 2005, whoseresults showed that a decrease in the internal diameter leads to a lowervapour quality for the dryout inception, we can observe the exact oppo-site behaviour in this comparison as figure 2.5 shows a vapour quality forthe dryout inception higher than 0.95 while in figure 2.3 (c) the differentcurves present the dryout inception at a similar vapour quality of around0.85. This contradiction in the literature shall be reminded as it will be com-mented later on the discussion part of this report.
The next set of experimental results on the topic would be published in Chi-apero, Fernandino, and Dorao, 2014 were a different region was exploredby setting a larger saturation temperature in the experiments conducted(table 2.1). The results show a much larger nucleate boiling contribution

2.2. State of the art on HTC for boiling R134a over high quality values 9
FIGURE 2.4: Schematics of flow regimes for (a) nucle-ate boiling dominant and (b) convective boiling dominant.
Taken from Kim and Mudawar, 2013
as expected (nucleate boiling was found to increase with Tsat in previousarticles). For instance, in the experiments with the highest heat flux andlowest mass flux, HTC shows almost no dependence on the vapour quality,revealing that nucleate boiling is the most important mechanism.
Regarding dryout inception under the conditions used of high saturationtemperature and with an internal diameter of 5mm, the experiments withdifferent mass fluxes and heat fluxes shown in this article all present avapour quality for the dryout inception of at least 0.92. The vapour qual-ity at which dryout completion occurs is slightly over 1, thus showing anabrupt fall of the HTC in the dryout region.
Simultaneously on the same year, Kundu, Kumar, and Gupta, 2014 pub-lished experimental results for R134a using an internal diameter of 7mmand low saturation temperatures (table 2.1). These results show an unex-pected behaviour quite different from what has been seen in other articles.Dryout inception occurs at a significantly low vapour quality of 0.7, butmore surprising is that the experiments cover until a quality of 0.85-0.9 andfor these qualities dryout completion is not presented, thus showing a re-markably large dryout region that covers qualities from 0.7 to at least 0.85.Those results shall be subject of further inspection in the discussion part ofthis report.
On a different aspect of HTC for a boiling fluid through a tube, Pike-Wilsonand Karayiannis, 2014 made a study on the influence that the material usedin the heated section has on the experimental data acquired. He comparedthe results with stainless steel, brass and copper tubes. The study reportsthat the magnitude of the HTC is similar for all three materials but with aslight variation in trend. The heat transfer coefficient is seen to peak at high

10 Chapter 2. Literature Survey
FIGURE 2.5: Experimental results acquired in Grauso et al.,2013
vapour qualities for stainless steel and brass, which is less evident withcopper.
This conclusion has an important relevance for the evaluation of the resultscollected in this literature review. The different experiments that have beenmentioned do not use the same materials so it is important to consider theeffect that this might have had in the results yielded by each of them. WhileGrauso et al., 2013; Chiapero, Fernandino, and Dorao, 2014; and Deng, Fer-nandino, and Dorao, 2016 (which will be mentioned next) conducted exper-iments with stainless steel, Kattan, Thome, and Favrat, 1998a; and da SilvaLima, Quibén, and Thome, 2009 used copper tubes.
The most recent set of experimental data in this literature review was ac-quired by Deng, Fernandino, and Dorao, 2016 that made specific focus onhigher vapour qualities. Experiments reported data between qualities of0.7 and 1.2 with the smallest quality increments that have been observed inthe articles mentioned in this literature review, thus allowing for a detaileddescription of the behaviour of the HTC as can be seen in figure 2.6.
This study includes various novelties both in the experimental procedureand in the results. Regarding the experimental procedure: (i) A heatingdown approach from qualities around 1.2 was conducted instead of heatingup from the lowest quality. A possible error due to the "heating up" proce-dure was already mentioned in Kattan, Thome, and Favrat, 1998b. More-over, in this article, one experiment with "heating up" was added in orderto show the improvements that the "heating down" procedure implies. Theresults can be appreciated in figure 2.7 showing that there is a noticeablehysteresis effect in the "heating up" procedure; (ii)Instead of maintaininga constant heat flux in the testing heater, the power in all the heaters wasequally decreased to lower the quality. It is said in the article that this pro-cedure avoids the jump in the wall temperature that is observed when the

2.2. State of the art on HTC for boiling R134a over high quality values 11
onset of nucleate boiling occurs or sudden changes in the flow regime.
The novelty regarding the shape of these curves is the appearance of a sharpincrease of the HTC before the dryout inception. This article is the first oneto report such behaviour and affirms that the reason behind it is a slightdecrease in the wall temperature. For better illustration the differences be-tween the inner wall and saturation temperature (∆T = Tw Tsat ) wasplotted in the article and can be observed in figure 2.8. Deng mentions thatthe possible reasons may be that "at high qualities, the vapour velocity isquite high and the film is very unstable until dryout occurs. Meanwhile,the interfacial shear between the vapour and the film enhances the heattransfer. On the other hand, the vapour of high velocity and the high wallheat flux may contribute to the entrainment, which will reduce the filmthickness and the heat transfer coefficient will increase".
FIGURE 2.6: HTC agains vapor quality at average mass fluxof 300kg/m2s (Deng, Fernandino, and Dorao, 2016)
The last articles mentioned make the state of the art on heat transfer forR134a in horizontal smooth tubes over high vapour qualities. Thus, thecorrelations elaborated in these articles make up for the current differentmodels that allow to extrapolate the experimental database to a much largerrange of conditions. Clearly, these models differ from each other depend-ing mostly on the experimental database used to develop the correlations.Thus, it is of importance to have present the differences between all theexperiments that have been conducted on the topic. Table 2.1 shows theexperiments in the area of interest of this project, all of which correspond toarticles reviewed in this literature survey.

12 Chapter 2. Literature Survey
FIGURE 2.7: Heating up and heating down procedurescomparison by Deng, Fernandino, and Dorao, 2016
FIGURE 2.8: Difference between the inner wall and satura-tion temperatures as plotted in Deng, Fernandino, and Do-
rao, 2016
2.2. State of the art on HTC for boiling R134a over high quality values 13
Art
icle
Insi
deD
iam
eter
[mm
]
Hea
tFlu
x[Kw/m
2]
Mas
sFl
ux[Kg/m
2s]
Satu
rati
onTe
mpe
ratu
re[o C
]
Qua
lity
rang
eD
ryou
tin
cept
ion
Dry
out
com
plet
ion
Sait
oh,
Dai
guji,
and
Hih
ara,
2005
0.51
;1.
12;
3.1
5-3
915
0-4
505
-15
0.02
-0.9
/10.
9(D
=3.1
mm
)1 (D
=3.1
mm
)da
Silv
aLi
ma,
Qui
bén,
and
Thom
e,20
09
13.8
47.
5;17
.530
0;50
05;
15;2
00.
01-0
.99
0.8
-0.9
0.86
-0.9
1
Gra
uso
etal
.,20
136
5-2
0.4
146
-520
-2.9
-12.
10.
1-0
.9/1
0.96
0.99
Chi
aper
o,Fe
r-na
ndin
o,an
dD
orao
,201
4
510
.5;2
029
7.7
-49
7.8
33.4
-34.
30
-10.
91
Kun
du,
Kum
ar,
and
Gup
ta,2
014
73
-10
100
-400
5.8
-8.9
0.1
-0.9
0.7
>0.9
Den
g,Fe
r-na
ndin
o,an
dD
orao
,201
6
5va
ryin
g30
0-4
0015
.7-3
9.4
0.01
-1.2
0.82
-0.8
91
TAB
LE
2.1:
Expe
rim
enta
ldat
abas
eon
heat
tran
sfer
for
R13
4ain
hori
zont
alsm
ooth
tube
sov
erhi
ghva
pour
qual
itie
s


15
Chapter 3
Experimental facility
This chapter aims to present the different aspects of the experimental fa-cility used by providing a detailed description of its current set-up and in-strumentation. The construction of this facility has been possible thanks tothe great effort conducted by both academic and technical staff prior to thework presented on this project.
The rig has a vast amount of settings that allow for reproducing differentprocesses regarding flow in horizontal circular tubes. In this chapter onlythe features corresponding to the arrangement that was used for the exper-iments presented in this work will be covered.
3.1 Description of apparatus
3.1.1 Thermo-hydraulic system
The experimental facility is an R134a closed loop consisting of a main tank,a pump, pre-conditioner, a heated test section with in and outlet restric-tions, and a condenser. In addition, a visualization glass is incorporatedafter the test section which, by using a high speed camera, allows for flowvisualization and recording. A coriolis flow meter is used before the heatedtest section in order to give an accurate measurement of the mass flux cir-culating. The loop with these mentioned features is represented in figure3.1.
3.1.2 Working fluid
R134a, also known as Tetrafluoroethane (CF3CH2F), from the family ofHFC refrigerants is used as a working fluid in this facility.
R134a first appeared in the early 1990s as a replacement for Dichlorodifluo-romethane (R-12), which has significant ozone depleting properties. R134ahas been atmospherically modelled for its impact on depleting ozone andas a contributor to global warming. Due to its high GWP it is now beingsubstituted in several environments, such as the automotive industry, forlower GWP refrigerants. However, its relevance and use in the industry isstill high.

16 Chapter 3. Experimental facility
FIGURE 3.1: Simplified schematic flow diagram of the ex-perimental configuration used in this work. Adopted from
Sorrum, 2014
It has great thermodynamic properties for its use as a refrigerant, low tem-perature of vaporization and a relatively high heat of vaporization. At thesame time it is safe for normal handling as it is non-toxic, non-flammableand non-corrosive. Therefore proving safe for its use in an experimentalfacility.
3.1.3 Pump
A gear pump (GB-MICROPUMP) with magnetic drive coupling is usedto circulate the fluid through the circuit. The liquid refrigerant enters thepump from the bottom of the main tank, thus, assuring that the level of thetank would have to be at its lowest in order to malfunction. Nevertheless,checking the main tank’s liquid level can be easily done by looking into twosight glasses in the vessel.
The speed of the pump can be regulated by changing the DC-voltage pro-vided to the motor drive. This function can be regulated through the soft-ware interface in order to dictate the flow rate required in the loop for acertain experiment. In addition, a bypass valve parallel to the pump allowsfor a wider range of experimental flow rates.
3.1.4 Pre-conditioner
The temperature of R134a entering the test section is controlled by a plate-and-fin heat exchanger (B8THx14 SWEP). Here, heat is exchanged with awater-glycol mixture which is subsequently cooled by an Applied ThermalControl (ATC) K9 chiller. Controlling the inlet temperature of the R134a

3.1. Description of apparatus 17
into the test section is therefore achieved by controlling the temperature ofthe chiller.
The chiller’s temperature is set as one of the inputs in the software interface.With regard to the maintenance of this system it is important to alwaysassure a sufficient level of glycol in the chiller.
As for the function that this chiller has in the experimental procedure, regu-lating the inlet temperature to the test section implies setting the subcoolingwith which the fluid enters the tube. This subcooling will be one of the fac-tors that dictate the quality at which the fluid is encountered at a givendistance in the tube.
3.1.5 Heated test section
The test section is a 2035 mm long, horizontal circular tube made of stainlesssteel. Its internal diameter is 5mm and the outside diameter is 8mm. Theentire test section is equipped with an electrical heating system that worksby application of a rectified sine wave (Joule heating).
Six electrodes are disposed limiting 5 equally long segments along the tube.This disposition allows the reproduction of non-uniform heating by indi-vidually varying the electrical power supplied to each segment. For thispurpose, the software interface allows for for an independent control ofeach segment.
Insulation over the test section reduces the heat loss to the surroundingswhich will never exceed 8% and is indeed accounted for when calculatingthe actual heat transfer to the fluid.
Testing in the tube is done through various measuring instruments. Sevenpressure taps are located in the tube for differential pressure drop mea-surements. Pressure transducers connected to the pressure taps allow fora custom point of measurement and the overall test section pressure drop.External thermocouples measuring the wall temperature together with twointernal thermocouples are able to yield the heat transfer supplied to thefluid. Ten thermocouples are distributed along the outside bottom wall ofthe test section while there are seven on top. An schematic view of the dis-posal of the mentioned features of the heated test section can be found infigure 3.2.
Figure 3.3 presents the test section viewed from its exit. Pressure taps areconnected from the left hand side and internal and external thermocouplesfrom right. Electric power is applied through the copper blocks. The testsection is mounted between two sheets of insulating material, as the oneshown in the picture, to minimize heat loss to the surroundings.
3.1.6 Flow restrictions
As was observed in figure 3.1, the test section is equipped with an inletthrottling valve and an exit orifice.

18 Chapter 3. Experimental facility
FIGURE 3.2: Sketch of the test section. Adopted fromUgueto, 2013
The inlet valve can be manually operated in order to change the conditionsof the flux. Bad regulation of the valve may lead to density wave oscilla-tions. This phenomena is well explained in Sorrum, 2014. At the same time,closing the valve up to a safe limit when starting the facility increases theflow speed and helps avoiding vapour entering the test section.
3.1.7 Condenser
Working fluid leaving the heated section is condensed back to liquid formin the tubes of a shell and tube heat exchanger (CFC-12-Alfa Laval). Theexcess of heat is exchanged with the water-glycol found in the shell-side.
This secondary coolant circuit is thermally controlled by an ATC K6 Chiller.Same as with the K6 chiller mentioned earlier, the temperature of this chillercan be adjusted through the software interface. This temperature will dic-tate the loop’s pressure and, thus, the saturation temperature at which R134aboils.
3.2 Associated instrumentation
The next section will describe the measurements and the accuracy of differ-ent instruments present in the facility and relevant to this study.
3.2.1 Mass flow rate
Mass flow rate is measured before the fluid enters the test section. Thereason behind it is that accurate measurements on mass flow for a two-phase flow (which would be encountered at the exit) are generally harder.
3.2. Associated instrumentation 19
FIGURE 3.3: View of the horizontal test section from its exit.Adopted from Ruspini, 2013
In order to record the flow rate, two Coriolis flow meters (Bronkhorst Cori-Tech R134A 3L/min) are placed upstream of the test section. The first one(G1)is situated close to the pre-conditioner while the second one is placedright upstream of the test section. An accuracy of 0.2% of the reading isgiven by the supplier.
The volumetric flow rate that is read y the Coriolis flow meter is convertedinto mass flux by using the densities stated in NIST REFPROP propertiesdatabase.
3.2.2 Pressure
System pressure is calculated as the absolute pressure recorded betweenthe inlet restriction and the heated test section. The overall accuracy for theGE-UNIK 5000 Premium pressure sensor is 0.04% of full scale where fullscale is 16 bar. This translates to about 0.11% (or 0.01 bar) in the relevantexperimental pressure range.
3.2.3 Temperature
The fluid temperature was recorded at the inlet of the heated section. Allthermocouples used in the facility are standard K-Type of 0.5 mm diameter.The thermocouple accuracy after in-house calibration was found to be 0.1K.
In order to calculate the inlet subcooling (difference between the satura-tion temperature and fluid temperature) the measured inlet temperaturewas compared to the saturation temperature corresponding to the abso-lute pressure. Calculations for obtaining the saturation temperature from

20 Chapter 3. Experimental facility
the absolute pressure were done using the equilibrium thermodynamicalproperties presented in NIST REFPROP.
3.2.4 Heat Flux
The power supply is constructed in-house. A voltage potential from acontroller-rectifier circuit is applied over 6 electrodes evenly distribute alongthe heated section. Though smooth direct current (DC) would have beenthe ideal, the use of capacitors in the power supply has been omitted toreduce load on the transformers, resulting in a rectified sine wave. Dueto the massive ripple in the signal, a digital oscilloscope was used to ob-tain the actual shape of the voltage and current signal to each of the heatedsections. Data is acquired at every 0.1 second (10Hz) while the mains fre-quency is 50Hz rendering the first unusable to sample the later. Thus, aver-aged DC-equivalent values derived by numerical integration of the actualsignal shape must be used as correction factors to the voltage and currentmeasured by the acquisition card.
Errors in the heat input are also associated to the voltage and current mea-surements. Calibration of the measurements has shown <10% error. Ac-curacy of the power measure chain was taken assuming a power of 200Wgiving a final accuracy of 20W (Ruspini, 2013).
Since the heated section is thermally insulated, most of the heat generatedin the pipe wall is absorbed by the fluid. However, the effect of thermallosses must also be taken into account when determining the heat transferto the fluid. Calibration of this heat tranfser was done using the test sec-tion inlet and the two internal thermocouples in order to measure the heattransfer and compare it with the heat transfer yielded by considering en-ergy conservation. It is remarked that the heat losses in experimental casesare never higher than 8%.
3.2.5 Uncertainties and accuracy of measurements
Details regarding the accuracy of the facility instrumentation as well as theuncertainties of the main operational parameters can be found in tables 3.1and 3.2 respectively.
3.2.6 Software interface
The National Instruments LabVIEW software (short for Laboratory VirtualInstrument Engineering Workbench) is used to control and monitor the ex-perimental facility. The software interface is used to set pump speed, con-trol heaters and the two chillers (K6 and K9). It is also used for monitoringthe conditions measured by the heaters, flow meters, absolute and differen-tial pressure transducers, and thermocouples in a schematic flow diagram.Moreover, the software provides a very useful on-line visualization of theinlet flow trace. The main window of the LABVIEW software interface ispresented in figure 3.4.

3.3. Main specification overview 21
Name Instrument Localization Range Measurementaccuracy
Max. Statis-tical error
G1,G2 Coriolis flowmeter
Test sectionentrance
0-3 L/min 0.01 L/min <0.01 L/min
DP1 DP-transducer
Test section 0-1 bar 0.075 kPa 0.1 kPa
DP2 DP-transducer
Orificeplate
0-1 bar 0.075 kPa 0.2 kPa
DP3 DP-transducer
Inlet re-striction
0-1bar 0.075 kPa 0.2 kPa
DP4 DP-transducer
Test section 0-30 mBar
DP5 DP-transducer
Test section 0-50 mBar
P1-5 Abs.Pressure Whole loop 1-16 bar 10kPa 1kPaT1-20 Thermocouple Whole loop -50-100 oC 0.1 oC 0.1 oCQ1-5 Power sup-
plyTest section 0-2500 W 20W 20W
TABLE 3.1: Accuracy of the facility instrumentation.Adopted from Ruspini, 2013
Parameter Symbol ErrorMass flux G 10 Kg/m2s
Inlet pressure Pi 10 kPaInlet temperature Ti 0.2 oC
Heat flux (all 5 zones) q" < 40 W
TABLE 3.2: Uncertainties of the main operational parame-ters. Adopted from Ugueto, 2013
Logging of experiments is performed with the LabVIEW data acquisitiontool. The data is processed with matlab in order to plot the results of theexperiments. In addition, the logging feature allows for online monitoringof the experimental condition in Matlab.
3.3 Main specification overview
Table 3.3 provides a summary of the main specifications of the facility used.
3.4 Risk assessment and safety
A complete risk assesment report of the facility was created by Ruspini andLangorgen, 2011 in order to get an operation authorization at the ThermalLaboratory at NTNU.

22 Chapter 3. Experimental facility
FIGURE 3.4: Software interface - main system overview inLabVIEW. Adopted from Sorrum, 2014
Fluid R134aSystem pressure P=4-12 barMass flow rate G=5-2000 kg/m2s
Inlet temperature (Subcooling) Tin = 20 40oC (∆Tsub = 0 50oC)Max power input Q=1500W
Test section exit temperature 0oC<Te<110oCHorizontal test section
Length LHS = 2.035m (Ltotal 6m)
Diameter dh = 5mm (dpiping = 12.4)
TABLE 3.3: Key specification of the two-phase flow instabil-ity facility. Adopted from Sorrum, 2014
Amongst the main hazards that can be recognized in the experimental ap-paratus: (i)The loop contains a pressurized fluid even when not in opera-tion. As a general precaution, safety glasses were always used when work-ing close to the rig. (ii) The room has a sizeable volume so local frostbites isthe primary risk in case of leakage.
The facility was controlled and monitored from a computer station next toit. Repetitive strain injuries (RSI) might have been a risk involved in thiskind of laboratory work. However, none of the mentioned issues, or otherincidents, were ever encountered.

23
Chapter 4
Methods
This chapter describes and explains the scientific methodology employed.The aim is to provide information on the experimental procedures that havebeen used in order to achieve the desired set of conditions, minimizing pos-sible deviations from the real model. That is a throughout description onhow to collect the necessary experimental data and the analytic proceduresfrom which conclusions will be drawn. The intention is to bridge the pre-vious chapter describing the experimental facility to the following focusingexperimental results. The study shown in this chapter was previously con-ducted by Sorrum, 2014; Ruspini, 2013; Ugueto, 2013 and thus, their workhas been taken as a reference.
4.1 Execution of experiments
The task is to determine the behaviour of the heat transfer coefficient in anhorizontal in-tube boiling system. This has to be achieved by providinga reliable model that accurately replicates this case. Thus, an appropriateway of conducting experiments has to be developed.
4.1.1 General steps in operating the facility
Inlet restriction, outlet configuration and the pump bypass valve areconfigured.
The pump is started.
K6 and K9 chillers are set to values corresponding to the desired sys-tem pressure inlet subcooling.
Heat is applied close to the desired starting value (close to a qualityvalue of 1.2)
Pump drive, condenser chiller (K6) and conditioner chiller (K9) re-quire iterative tuning in order to achieve an accurate flow rate, pres-sure and subcooling according to the planned experiment. Adjustingone variable usually affects several parameters making this processquite complex.
Tuning of operating condition is manually carried out by the operator.

24 Chapter 4. Methods
A considerable run-in time at the given conditions is needed to allowthe system to settle at a true steady state. This can typically take anhour for each set of conditions.
Once set at the desired conditions, two experiments are measuredmaintaining the same inputs.
Power on the preheaters is decreased to a lower value in order to de-crease the quality in the test section.
The system is allowed time to settle to this condition. Once it is set,two experiments are measured.
Power is again decreased in the preheaters repeating the same processcontinuously until achieving the lowest power on the preheaters.
Experiments are conducted for 150-200 seconds. Settling time in betweenexperiments depends on the region that is being tested but generally takesover 180 seconds.
The second experiment conducted under each quality, is processed beforeit has finished in order to observe its resemblance to the first experiment.If the results of both experiments are too distant from each other, furtherexperiments are conducted until an accurate result is achieved.
4.1.2 Stable system configuration
Measuring with the facility under the desired conditions has to be per-formed cautiously. Paying attention to possible deviations from the modelto be replicated is crucial. On this frame, two incidents that must be avoidedhave been found likely to occur if the required measures are not taken:
Appearance of DWO specially at lower heat fluxes. Density WaveOscillations appeared when the inlet valve was widely open. Thus,when conditioning the set up of the first experiments, inlet valve hadto be only slightly opened in order to avoid DWO but still allowingfor safe circulation of the refrigerant.
Difference in mass flux measurements was found between the twoflow meters. This appeared when starting the pump as a consequenceof accumulated vapour between both flow meters. In order to avoidthis deviation, mass flux was abruptly increased, for a small period oftime, by opening the inlet valve (manually) and increasing the massvelocity (through the computer station). As a result, vapour wouldmove on to the heating section. Inlet valve and mass flux were slowlychanged to their desired conditions after measurements from bothflow meters showed similar enough values.

4.2. Data acquisition and logging 25
4.2 Data acquisition and logging
The fact that all experimental data is acquired and logged digitally, givesalmost unlimited opportunities when it comes to data processing and plot-ting. “One experiment” is captured by logging in a 150-200 seconds timeinterval. Experiments are repeated at the given conditions until it is evidentthat it resembles the steady state nature of the system. Acquisition period(sampling interval) was set to 100 ms (i.e. 10 samples per second) duringall experiments.
Several MatLab scripts have been prepared to do monitoring and process-ing of experimental data. Some more specific measurements required fordifferent scripts to process the data and, as mentioned before, processingthe data could be conducted while still running the experiment, allowingto follow the results.
4.3 Data reduction
The rig facilitates a two figured number of sensors in which data is loggedcontinuously when experiments are running. It goes without saying thata significant effort has been spent in data reduction. That is to transformthe bulk numerical information derived from in-experiment measurementsinto a corrected, ordered and simplified form. The prime goal is to convertexperimental results into a suitable and convenient form that can be easilysummarized in charts and tables.
Among these key figures characterizing the system is the heat transfer coef-ficient. This step is preformed after data from one experiment has been timeaveraged. Results that for different reasons are out of trend are left out, inparticular if the reason is due to a known error or disturbance. This couldfor instance be sudden change in temperature inside laboratory or simplythat insufficient time was spent for the condition to settle.
4.4 Measuring of the HTC
The heat transfer coefficient is the proportionality coefficient between theheat flux and the thermodynamic driving force for the heat flow (∆T ). Theheat transfer coefficient for convective boiling flows is based on the wallsurface temperature (Ts) and bulk fluid temperature (Tf ).
h =q”
Ts Tf
There are several ways to quote a heat transfer coefficients, one is the over-all, or global, heat transfer coefficient. To give a wider perspective on boil-ing flow heat transfer, a local heat transfer coefficient will also be quotedon two locations were fluid temperatures could be attained directly frominternal thermocouples.
26 Chapter 4. Methods
It should be noticed that this work will name the global, or length averaged,heat transfer coefficient the overall heat transfer coefficient. This overall(global) heat transfer coefficient do only account for the heat transfer innerwall of the heated tube to the fluid.
4.5 Global HTC
Using an average of the difference between the surface and fluid temper-atures along the length of the heated section and the total heat flux trans-ferred to the fluid, the global heat transfer coefficient was calculated.
h =q”
Tw;i T f
Here, temperature index Tw;i and Tf refers to the inner wall and bulk fluidtemperature respectively. It cannot be measured directly and need somespecial care. A comprehensive description of the method is given in thenext sections.
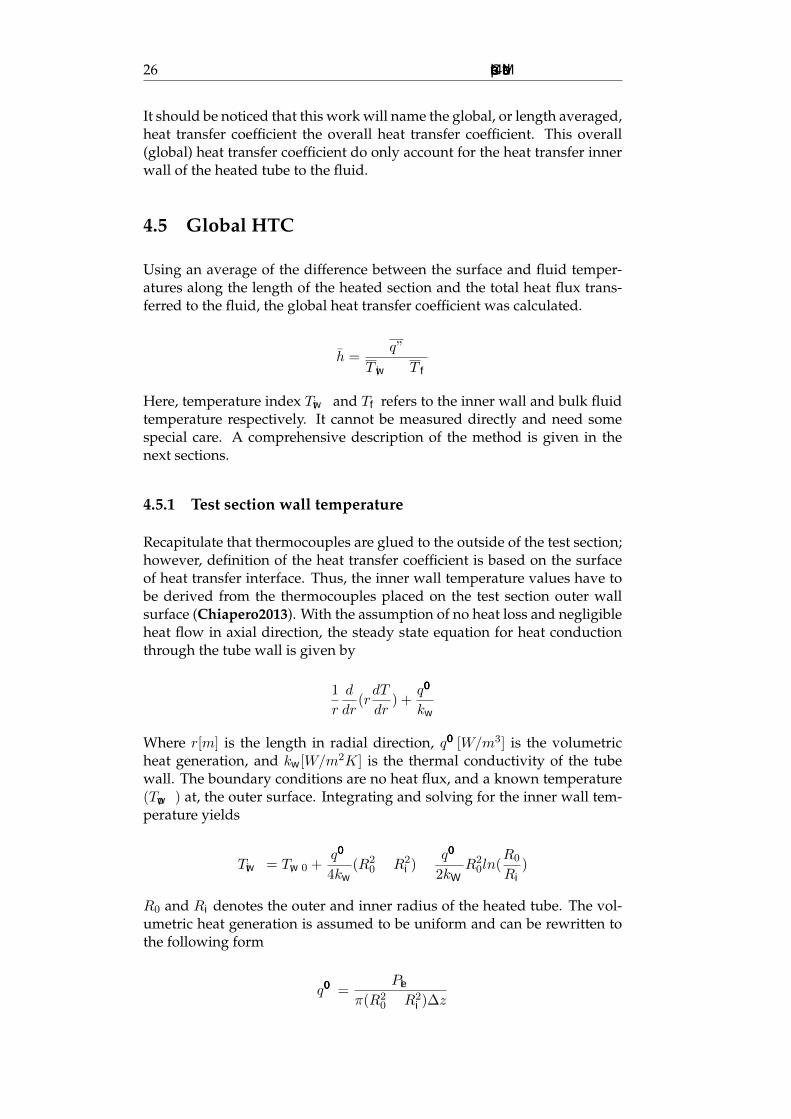
4.5.1 Test section wall temperature
Recapitulate that thermocouples are glued to the outside of the test section;however, definition of the heat transfer coefficient is based on the surfaceof heat transfer interface. Thus, the inner wall temperature values have tobe derived from the thermocouples placed on the test section outer wallsurface (Chiapero2013). With the assumption of no heat loss and negligibleheat flow in axial direction, the steady state equation for heat conductionthrough the tube wall is given by
1
r
d
dr(rdT
dr) +
q000
kw
Where r[m] is the length in radial direction, q000[W/m3] is the volumetricheat generation, and kw [W/m2K] is the thermal conductivity of the tubewall. The boundary conditions are no heat flux, and a known temperature(Tw;o) at, the outer surface. Integrating and solving for the inner wall tem-perature yields
Tw;i = Tw;0 +q000
4kw(R2
0 R2i )
q000
2kWR2
0ln(R0
Ri)
R0 and Ri denotes the outer and inner radius of the heated tube. The vol-umetric heat generation is assumed to be uniform and can be rewritten tothe following form
q000=Pel
π(R20 R2
i )∆z

4.5. Global HTC 27
With Pel being the total applied electrical power and ∆z being the lengthof the heated section. Combining the last two equations gives the final ex-pression for calculating the inner wall temperature.
Tw;i = Tw;0 +Pel
4πkw∆z
R20
(R20 R2
i )ln(
R0
Ri)
This result is implemented in the MatLab scripts calculating the heat trans-fer coefficient.
4.5.2 Calculating the fluid temperature
The fluid temperature was calculated from the inlet temperature, inlet pres-sure, and total heat flux supplied, using a steady-state thermodynamic equi-librium model. An approach as simple as possible was chosen rather thanimplementing features such as two phase distributed pressure drop, non-equilibrium thermodynamic models or fancy numerical schemes.
A homogeneous flow model was chosen for its simplicity, assuming thatthe two-phase flow is well mixed. The slip ration, defined as the ratio be-tween gas and liquid velocity, is then (by definition) assumed to be unity(non-slip condition). This is a fair assumption since the high Reynolds num-bers of all experimental cases are associated with a great deal of turbulentmixing caused by Eddies diffusion. It also makes sense as the heat transfercoefficient is based on the bulk fluid temperature.
Any effects of non-equilibrium thermodynamic are disregarded, even thoughthe time for phase transition to occur is limited.
Starting with the distance, velocity and time formula
z = vt
Changing it to incremental form and rewriting the velocity gives
∆z = v∆t =V
Ac∆t =
G
ρ∆t
Next to come is discretization in time and space. Notice that the upcomingtime step is based on the current density
tn+1 tn =ρ(n)
G(zn+1 zn)
This gives the time a fluid particle spends in one of the infinite small controlvolumes, commonly referred to as grid cells.

28 Chapter 4. Methods
The energy balance contains the enthalpy h(P,T) which will later be used tofinally determine the temperature:
m∆h = q
The mass entering a cell is equal to the mass exiting the same cell, guaran-teeing mass conservation in this steady state model.
m = ρAcv
Combining the two equations above contains the enthalpy change of thefluid inside a single cell.
(ρV )∆h = q00As∆t
The test section is a tube with cylindrical geometry.
ρπd2dx
4∆h = q00(dπdx)∆t
Reorganizing and particularising:
hn+1 hn =q00(tn+1 tn)4
d
Finally, the two discretized equations, time and state (enthalpy) equationwere implemented in a Matlab script on the following form:
tn+1 = tn +ρ(n)
G(zn+1 zn)
hn+1 = hn +q00(tn+1 tn)4
d
The scheme is first order explicit in both time and thermodynamically state.Relative small steps were used to mitigate the adverse numerical effects, inparticular numerical diffusion, such simple schemes tend to introduce. Theheat flux is uniform and the diameter remains the same. The temperature atany incremental position can finally be found from the computed enthalpyand test section inlet pressure.
Tn = f(p, hn)
The described scheme makes it possible to evaluate the fluid temperatureat any position in the test section based on the geometry, a known inletcondition (temperature, pressure and mass flow rate) and the heat input.Other quantities, such as vapour quality and mean fluid particle residencetime (transit time or tau) can also be acquired from this model.
This simple unambiguous, textbook like, approach for computing the fluidtemperature was chosen by practical reasons. In the end, the heat transfer

4.6. Local HTC 29
coefficient will always be a computed or derived value, since it cannot bemeasured directly.
4.6 Local HTC
Heat transfer performance will also be evaluated and quoted locally fortwo locations, namely the thermocouples at position 6 and 10 (see figure3.2). These two location feature four external thermocouples placed on top,bottom and both side of the tube in addition to an internal thermocouplemeasuring the in-fluid temperature.
The heat transfer coefficient can hence be calculated from the actual mea-sured fluid temperature rather than the modelled. Measurements in thesetwo particular points will therefore be given special attention.


31
Chapter 5
Background experimental work
The main set of proper experimental results that was achieved in this projectrepresents only a small portion of all the work that had to be carried outwith the experimental facility. The learning process required in order toachieve accurate results is also part of the work behind this project, as wellas the time spent with experiments that for several reasons were either notreliable or unachievable under the desired conditions.
The following chapter gives a brief explanation on how the learning processand pre-work was conducted as well as the different circumstances that ledto discard other experiments.
5.1 Learning process
The learning process involved developing fluency with the facility. The dif-ferent inputs that control the regulation of the fluid have an effect on theoutput that varies both in the strength of the effect and the time that it re-quires depending on the conditions of the flow. Thus, different experimentswith no other aim than to develop experience in handling the facility wereconducted.
The conditions set for these experiments were the same as in Deng, Fer-nandino, and Dorao, 2016, were the same facility at the Department of En-ergy and Process Engineering at NTNU was used. Therefore, the experi-mental results in Deng, Fernandino, and Dorao, 2016 served as a referenceto be compared with the results obtained along the learning process. Oncesimilar results with comparable quality (in terms of accuracy and reliabil-ity) were achieved, it was considered that enough experience in workingwith the experimental facility had been gained in order to conduct new ex-periments.
However the learning process as a particular stage was terminated here,many other aspects of the facility were still to be learned as new conditionsrequired some different approaches.

32 Chapter 5. Background experimental work
5.2 Pre-work
Experiments in Deng, Fernandino, and Dorao, 2016 were made with vary-ing heat flux, a different approach was intended for this study. Constantheat flux was desired when sweeping along decreasing qualities. In orderto do this, part of the heating section had to be maintained with constantpower while the previous heaters were required to vary in order to showresults for different qualities.
In a first approach the last three heaters were maintained constant while thetwo first heaters were set to vary in power in order to control the quality,they were used as "pre-heaters". However, this method presented a disad-vantage, setting a high fixed power in the last three heaters meant that nomatter how low the pre-heaters were set in power, lower qualities couldnot be achieved due to the quality increase experimented in the fixed heat-ing section. On the other hand, setting a low fixed power in the last threeheaters prevented from achieving higher qualities since the power that canbe supplied by the heaters is limited, as mentioned in chapter 3.
For this purpose it was studied the possibility of using only one heater withfixed power. The last heater was the one set to be constant while the otherfour were used as pre-heaters. Results were compared to the ones obtainedwith the previous method (three heaters with constant power) and showedthe same values, proving this method as reliable as the previous one.
Proceeding with four pre-heaters allowed for a larger range of possible ex-periments but still, limitations were found under certain conditions as willbe explained in the following section.
5.3 Limitations
The pressure inside the loop was not changed in any of the experiments.Variation of mass flux and heat flux were the object of study and for certainvalues of both variables the facility proved unable to work under this con-ditions.
Higher mass fluxes required as well higher heat fluxes in order to achieve avapour quality value over 1 in the test section. Mass flux ofG = 500kg/m2swas the highest value tested with the facility and proved infeasible. In or-der to achieve qualities above 1 with the fixed heater at the maximum heatflux experimented (q00= 47.7 47.8kW/m2 which corresponds to a powerof Q = 300kW for the heater), the pre-heaters had to yield a power over320kW each one. This power proved unbearable by the pre-heaters thatafter few minutes would stop working under these conditions for safetyreasons due to overheating.
For the same reasons, the conditions ofG = 400kg/m2s and q00= 15.9kW/m2
in the last heater, also proved infeasible for higher qualities. Thus, theexperimental data is limited by the combination of high mass flux andlow heat flux at this value, and the limiting experiment with highest mass

5.4. Errors and malfunctions 33
flux/heat flux relation presented in the main set of experimental data wasG = 400kg/m2s and q00= 31.8 31.8kW/m2.
Lower mass flux than the ones that will be presented in the next chapterwith experimental results were also tested. In this case, experiments withG = 100kg/m2s proved too unstable. Conditions in the high quality regionwere observed to vary out of the range determined for reliability on theresults when logging the experiments. Therefore they are not presentedamongst the results.
5.4 Errors and malfunctions
As was mentioned in chapter 4, under certain conditions the facility is likelyto suffer DWO and vapour entrainment between the two flow meters (lead-ing to inaccurate measuring of the flow). Learning how to avoid these phe-nomena was based on trial and error. Many experiments had to be dis-carded due to appearance of DWO or differing measurements of the flowmeters until different approaches, that helped on avoiding these deviations(explained in chapter 4), were developed and systematically used in thefollowing experiments.
Malfunctions of the facility also occurred in several occasions and incre-mented the work load required to achieve the desired experimental results:
Shutdown of chiller K6 due to lack of glycol led some inaccurateexperiments that had to be discarded. The problem was solved bysealing the leakage that had generated the lack of glycol and refillingthe tank.
Changes in the electric grid that supplies power to the facility werefound to cause an overload depending on the order in which the dif-ferent features of the facility were started. Changing this order pro-vided with a temporal reliable solution while the grid arrangementwas fixed.
Shutdown of chiller K6 due to unknown reasons was observed onthe last experiments after functioning for a long period of time. Someexperiments had to be completely repeated because of this while inothers the chiller was immediately turned back on without producingany perceivable deviation.
Apart from errors due to malfunctions of the facility, mistakes by the authorof this work when working with the facility also occurred and in variouscases compromised the experiments, which had to be repeated.


35
Chapter 6
Experimental Results
This chapter provides an overview of the main experimental results. Thedifferent experiments were conducted under a pressure of 550kPa (corre-sponding to a saturation temperature of 18.7oC) and varying heat fluxesand mass fluxes. The range of conditions covered by the main set of ex-perimental results can be appreciated in table 6.1. The results on the HTCprovided by these experiments are shown in figure 6.1 which provides witha general outlook. For a more organised and classified visualization of theresults, they will be plotted in smaller groups over the next sections of thischapter, allowing for a more detailed appreciation of the results.
q00= 41.7kW/m2 q00= 31.8kW/m2 q00= 15.9kW/m2
G = 400kg/m2s X XG = 300kg/m2s X X XG = 200kg/m2s X X X
TABLE 6.1: Range of conditions presented in the main set ofexperimental data
As a general appreciation it can be seen in figure 6.1 how the experimentsmainly differ before dryout. Even if dryout is encountered at differentvapour qualities and HTC values, after dryout inception the behaviour isquite similar, showing an abrupt fall of the HTC until mist flow is reached.For this mist flow regime, the differences between experiments are negligi-ble compared to the differences before dryout inception.
6.1 Study of the effect of mass flux
The variation of the HTC with the mass flux is perceptible only after a cer-tain vapour quality has been reached. This value for the vapour qualitydepends on the heat flux. For the highest heat flux experimented (q00 =47.7 47.8kW/m2) the HTC does not show a noticeable dependence on themass flux until a vapour quality of approximately 0.8 has been reached. Onthe other hand, in the set of experiments conducted under the lowest heatflux (q00= 15.9kW/m2) the HTC shows a dependence on the mass flux fromvapour qualities of 0.4.
This dependence not only is perceptible from lower qualities for lower heatfluxes but also, is stronger for lower heat fluxes: The difference in the HTC

36 Chapter 6. Experimental Results
FIGURE 6.1: Main set of experimental data on HTC ob-tained in this project
that the experiments under the lowest heat flux show at a quality of 0.8 ismuch larger than the difference shown for the highest heat flux at the samequality value.
Nevertheless, when perceptible, the main effect that the mass flux has is anincrease of the HTC with increasing mass flux.
Experiments under same mass flux and different heat fluxes can be ob-served in figures 6.2; 6.3; 6.4. As a result of the behaviour of the mass fluxwith the vapour quality that was stated in the previous paragraphs, it canbe observed how experiments with same mass flux tend to become moresimilar as the quality increases and how this similarity becomes more no-ticeable for higher mass fluxes.
The profile presented by the experiments also changes with the mass flux.While experiments under lower mass flux present a more planar profile,higher mass flux changes this profile with the appearance of a slope at lowerqualities which later becomes planar until another increase of the HTC be-fore dryout inception can be observed. This peak before dryout is also seento be dependent on the mass flux. For simplicity, the point at which thesharp increase starts will be from now on referred to as pre-dryout, usingthe same name as in Deng, Fernandino, and Dorao, 2016 were this trendwas first observed.
It can be seen how for higher mass flux and under the same heat flux, the in-crease of the HTC from pre-dryout becomes sharper and more abrupt. Forexample, for the cases under constant heat flux of q00= 31.8 31.8kW/m2,the experiment under the lowest mass flux shows an insignificant increaseafter pre-dryout, while the cases with intermediate and highest mass flux
6.2. Study of the effect of heat flux 37
perfectly show this increase and with a higher slope at the highest massflux. Furthermore, the vapour quality at which the pre-dryout is encoun-tered also changes with the mass flux, showing that for higher mass fluxespre-dryout is encountered at lower vapour qualities.
When focusing the dryout region, at dryout inception a higher mass fluximplies higher HTC, while at dryout completion mass flux does not seemto have an effect on the HTC. On the other hand, vapour quality at dryoutinception does not show a clear change with the mass flux, while vapourquality at dryout completion is seen to diminish with the mass flux.
FIGURE 6.2: Experimental HTC results for the lowest massflux (G 200) under three different heat fluxes
6.2 Study of the effect of heat flux
The variation of the HTC with the heat flux is significant for the differentmass fluxes experimented and along all the quality range of each curve.This proves an important contribution of the nucleate boiling mechanismto the heat transfer. This dependence on the heat flux, opposite to the de-pendence observed on the mass flux, is stronger for lower qualities andalso for lower mass fluxes as can be observed when comparing the HTCdifference between curves in each of the figures 6.2, 6.3 and 6.4.
Thus, experiments under same mass flux and different heat fluxes, showmore similar HTC results as the quality increases. For higher qualities con-vective boiling contribution appears combined with the nucleate boilingcontribution and the dependence on the heat flux is therefore reduced asmass flux becomes an influential factor as was explained in the previoussection.

38 Chapter 6. Experimental Results
FIGURE 6.3: Experimental HTC results for the intermediatemass flux (G 300) under three different heat fluxes
The profile presented by the different curves also changes with the heat fluxwhile maintaining the same mass flux. Higher heat flux is seen to imply amore planar profile. For lower heat fluxes a slope is found more markedlyat lower qualities. After pre-dryout, for the lowest mass flux case the sharpincrease is found steeper for the lower heat flux while for the intermediateand high mass flux case this effect is not clearly observed. The vapour qual-ity at which pre-dryout occurs is also not observed to obey a clear responseto the variation of the heat flux.
When focusing the dryout region, at dryout inception a higher heat fluximplies higher HTC, while at dryout completion heat flux does not seem tohave an effect of the HTC. With regard to the quality at which they occur,dryout inception is observed to occur at a lower vapour quality for increas-ing heat fluxes while the vapour quality at which dryout completion occursdoes not show a relation with the heat flux.

6.2. Study of the effect of heat flux 39
FIGURE 6.4: Experimental HTC results for the highest massflux (G 400) under two different heat fluxes

41
Chapter 7
Discussion
The primary difficulty in an investigation lies in the proper interpretationof results once they are obtained. The literature survey serves as a guideto pinpoint the most important parameters. The methods chapter gave anexhaustive description of the choice of analytical model obtaining a heattransfer coefficient and its implications. Experimental data is already pre-sented in the previous results chapter. Main results will be used again forfurther interpretation and discussion of its significance. The following sec-tion will provide in-depth discussion of these results, attempting to explainthem, compare them to knowledge in the current up to date literature, andmap out their practical significance.
7.1 General aspects
It was already mentioned on the previous section how in the experimentspresented the heat flux has a much larger repercussion on the HTC than themass flux and how this repercussion is more noticeable for lower vapourqualities.
Recalling what was stated at the beginning of chapter 2: Convection is of-ten distinguished as the dominant heat transfer mechanism when the HTCis almost independent on heat flux but strongly dependent on mass fluxand vapour quality; Nucleate boiling is distinguished as the dominant heattransfer mechanism when the HTC is nearly independent on the vapourquality and mass flux and strongly dependent on heat flux.
Distinguishing amongst the experimental results, it can be seen how con-vection is never dominant. Nucleate boiling on the other hand can be dis-tinguished as the dominant heat transfer mechanism at lower qualities, spe-cially for lower mass flux and higher heat flux cases. As a matter of fact, thecase processed under the lowest mass flux and highest heat flux (the uppercurve in figure 6.2) reflects nucleate boiling as the dominant heat transfermechanism until dryout inception.
Comparing with cases under similar conditions and with similar measur-ing methods (da Silva Lima, Quibén, and Thome, 2009; Grauso et al., 2013;and Chiapero, Fernandino, and Dorao, 2014), the results showed in theseexperiments show a much larger nucleate boiling contribution. If we take

42 Chapter 7. Discussion
a look back to figures 2.3 and 2.5, we can appreciate a much larger convec-tive boiling contribution (larger dependence on mass flux) only comparablewith the two cases experimented under the lowest heat flux of this project.
Chiapero, Fernandino, and Dorao, 2014 is the only article that presents anexperimental case with a planar profile as the ones that have been foundin this work. It can be seen in figure 7.1 where the experimental results arerepresented with blue crosses.
FIGURE 7.1: Experimental results from Chiapero, Fer-nandino, and Dorao, 2014. Blue crosses show the exper-iment under G = 297.7kg/m2s; Tsat = 34.3oC; q′′ =
20kW/m2
A high saturation temperature of Tsat = 18.7oC was used in this work’sexperiments and this has been mentioned several times in the literaturereview to increase the nucleate boiling contribution. However, the maindifference between the experiments presented in this work and previousexperiments is the heat flux that has been used. While the heat fluxes usedin the cited articles were always below 20kW/m2, the heat flux used in thisproject ranges from 15.8 to 47.8 kW/m2. This means that only the lowercurves of figure 6.1 are at a similar heat flux as those found in the cited ar-ticles. On the other hand the upper curves under a heat flux of 47.8 kW/m2
are far away from previous experimented conditions and, thus, represent acompletely new behaviour in which nucleate boiling seems to be the dom-inant heat transfer mechanism up to a vapour quality of almost 0.8.
This new behaviour defies statements made in other articles such as Greco,2008 were it was said that the HTC always increases with mass flux and thatthis increment is actually exponential. In the results presented in this workit can be seen how this statement is only correct when there is a significanteffect of the nucleate boiling contribution. Furthermore, it was found in thisarticle’s experimental results together with Grauso et al., 2013 that, after a

7.2. Dryout 43
local minimum that may be present at low vapour qualities, and until dry-out inception, the HTC always increased with vapour quality. However thelarge regions of nucleate boiling contribution in the experiments presentedin this work reflect a planar profile in which the HTC is constant for a sig-nificant range of vapour qualities.
7.2 Dryout
Dryout was, in the presented experimental results, measured cautiously,allowing to visualize in detail this gradual transition between annular flowand mist flow.
In da Silva Lima, Quibén, and Thome, 2009 the quality at which dryoutoccurs was said to decrease with mass flux and heat flux. The results shownin this work corroborate an earlier dryout inception with an increasing heatflux, but mass flux variation does not show a clear effect on the vapourquality at which dryout inception occurs.
Deng, Fernandino, and Dorao, 2016 also presented results in which massflux does not show an effect on the vapour quality at which dryout incep-tion occurs (figure 7.2). At the same time these experiments showed a largernucleate boiling contribution than convective as the ones presented in thiswork. Thus, it makes sense that, due to this smaller convective boiling con-tribution, mass flux does not have a significant effect on the vapour qualityfor dryout inception. Further experiments would be required to prove thishypothesis indicating that the effect of mass flux on dryout quality is de-pendent on the strength of the convective boiling contribution.
FIGURE 7.2: Experimental results from Deng, Fernandino,and Dorao, 2016 under different mass fluxes

44 Chapter 7. Discussion
While the quality at which dryout inception occurs was not observed tovary with the mass flux. Vapour quality at dryout completion was ob-served to slightly decrease with masss flux. This trend was also found muchstronger in da Silva Lima, Quibén, and Thome, 2009.
The reason behind this contrast might be that while the independence ofdryout inception quality with the mass flux was said previously to occurdue to the strong nucleate boiling contribution. In the mist flow region, nu-cleate boiling disappears. This might be why mass flux has an effect on thequality at which dryout completion occurs but not on the quality at whichdryout inception occurs.
If we were to compare the experiments from da Silva Lima, Quibén, andThome, 2009 in figure 2.3 with the ones in this experiment under similarconditions of heat flux, mass flux and saturation temperature, a great dif-ference can be observed in the quality at which dryout occurs. While thecase under G = 300kg/m2s; q00= 17.5kW/m2 and Tsat = 20oC shows adryout inception quality of 0.85, a similar case presented in this work withG 300kg/m2s and q = 15.9kW/m2 presents a dryout inception qualityof 0.95. The only difference between this two cases is that experiments inda Silva Lima, Quibén, and Thome, 2009 were performed with a coppertube while the experiments presented in this work were performed with astainless steel tube.
If we recall from the literature survey in chapter 2, it was mentioned thatthe heat transfer coefficient is seen to peak at higher vapour qualities forstainless steel. However, this was taken from Pike-Wilson and Karayian-nis, 2014 were experiments were not conducted for R134a, but for R245fa.Thus, this comparison presented in the previous paragraph indicates thatthis effect might be also important for R134a.
Moreover, articles Grauso et al., 2013 and Deng, Fernandino, and Dorao,2016 (both used stainless steel tubes) also show a quality for dryout incep-tion around 0.95 or higher. Further proving the mentioned effect of thematerial used.
However, this conclusion must be regarded cautiously as there is anotherfactor that differs in both experiments and is the tube diameter used. Whileda Silva Lima, Quibén, and Thome, 2009 used an internal diameter of 13.84mm,it was 5mm for this work.
So far in this section it has been mentioned the variation of the vapour qual-ity at which dryout inception and completion occur, without treating theHTC that is reached for these points.
In da Silva Lima, Quibén, and Thome, 2009 were convective heat transferwas dominant, HTC at dryout inception was said to increase with mass fluxand decrease with heat flux. This work also shows an increase of the HTCat dryout inception with mass flux (although not as strong due to the smallconvective boiling contribution) but presents the opposite result with heatflux than the cited article.

7.3. Sharp increase before dryout 45
The reason behind this is that, in da Silva Lima, Quibén, and Thome, 2009the nucleate boiling contribution is so small that the HTC variation withthe heat flux is almost negligible at vapour qualities close to dryout. Atthe same time, dryout inception occurs at an earlier vapour quality withincreasing heat flux and the HTC increases with quality when approachingdryout. Thus, a dryout inception at a lower quality results in a lower HTCwhen dryout inception occurs.
The experimental results presented in this work also show an increase ofthe HTC with vapour quality close to dryout, as well as an earlier inceptionof dryout with increasing heat flux (as was previously commented in thissection). However, the main difference is the strong influence of the heatflux in the HTC even at dryout inception. While HTC at dryout inceptionfor a higher heat flux case may be slightly lower than it would if dryoutinception had occurred at the same vapour quality as a similar case withlower heat flux, this difference is much smaller than the HTC that bothcases have right before dryout due to the heat flux difference.
Thus, this behaviour indicates that whether heat flux increase results in ahigher or lower HTC at dryout inception, depends on the strength of each ofthe heat transfer mechanisms over the other one. Therefore, with dominantconvective heat transfer mechanism it appears that HTC diminishes withheat flux, however, as nucleate boiling gains strength in the process thiseffect may fade until nucleate boiling contribution grows strong enough toproduce the opposite effect, increasing the HTC at dryout inception withincreasing heat flux.
7.3 Sharp increase before dryout
It was mentioned in chapter 2 that Deng, Fernandino, and Dorao, 2016 wasthe first and only other article in the literature review observing a sharp in-crease before dryout. It has been already commented on the previous chap-ter regarding experimental results how this behaviour is also observed inthis work. Thus, special focus was made on this feature due to the noveltythat it supposes.
Deng, Fernandino, and Dorao, 2016 mentioned that this sharp increase iscaused by a slight decrease on the wall temperature. For this purpose, fig-ure 7.3 shows simultaneously the variation of the HTC and the differencebetween inner wall and saturation temperatures (∆T = Tw Tsat ), againstthe vapour quality. The saturation temperature keeps almost constant dur-ing the process so that ∆T can also represent the variation of inner walltemperature. These results show a direct relation between the HTC andthe temperature difference ∆T , as the experiments published in Deng, Fer-nandino, and Dorao, 2016.
Furthermore, the article states that a possible reason for this improvementon the HTC might be that at high vapour qualities, the vapour velocity isquite high and the film is very unstable until the dryout occurs. Mean-while, the interfacial shear between the vapour and the film enhances theheat transfer. On the other hand, the vapour of high velocity and the high

46 Chapter 7. Discussion
wall heat flux may contribute to the entrainment, which reduces the filmthickness and the heat transfer coefficient increases.
If this hypothesis was true, an increase in the vapour velocity enhances thisphenomena. Thus, higher mass fluxes would result in more pronouncedpeaks. In figure 7.3 the process can be observed for two different massfluxes and, in agreement with the hypothesis, both the HTC and the temper-ature difference ∆T show a more pronounced change for the higher massflux case.
FIGURE 7.3: Difference between the inner wall and satura-tion temperatures, and HTC plotted against vapour quality
Moreover, Deng, Fernandino, and Dorao, 2016 also mentions that the vapourquality at which pre-dryout (the starting point of the sharp increase) occurs,also depends on the mass flux. This statement is based on the experimentalresults published in this article for two different mass fluxes. Those werealready commented on the dryout section and plotted in figure 7.2, werepre-dryout can be found for a quality of 0.82 for the higher mass flux andof 0.75 for the lower mass flux. However, this behaviour is not observed inthe experiments presented in this work. Further study on this region wouldbe required in order to understand this difference and the mechanisms im-pulsing this HTC enhancement.

47
Chapter 8
Conclusion
In the present study, the heat transfer coefficient for boiling R134a in a tubewas experimentally evaluated for a pressure of 5.5 bar (saturation tem-perature of 18.7oC); mass fluxes ranging between G 200kg/m2s andG 400kg/m2s ; and specially high heat fluxes ranging between q00 =15.8kW/m2 and q00= 47.8kW/m2 in a 5mm internal diameter tube.
Due to the high heat fluxes used, the experimental results show a strongnuclear boiling contribution, quite uncommon in previous studies on thetopic.
This strong nucleate boiling contribution appears to yield similar resultsfor experiments under the same heat flux, this similarity increases with theheat flux and decreases with the mass flux and vapour quality. Therefore,results under the same heat flux and different mass fluxes only show an in-crease of the HTC with mass flux after a certain vapour quality value. Thus,opposing to previous experimental results published on the topic were, dueto the strong convective boiling contribution HTC showed a noticeable in-crease with the mass flux for most of the quality range.
At the same time a more planar profile is found that terminates with a sud-den sharp increase before dryout inception. This behaviour is more pro-nounced for lower mass fluxes and higher heat fluxes, therefore, when nu-cleate boiling contribution is dominant.
Measuring with small quality increments for high vapour qualities allowedfor a detailed visualization of the HTC during the dryout region.
In agreement with previous studies, dryout inception occurred at lowerqualities with increasing heat flux. However, an increase of this dryoutinception quality with the mass flux was not observed in the results as itwas in previous studies. A possible reason may have been that due to thesmaller convective boiling contribution presented in these experiments, themass flux does not have a noticeable effect on the quality at dryout incep-tion. For the same reasons it is believed that the HTC achieved at dryoutinception for different mass fluxes did not show a strong increase with themass flux and was more dependent on the heat flux.
However, mass flux did show a slight influence in the quality at which dry-out completion occurred. As in previous publications, an earlier dryoutcompletion was found with increasing mass fluxes. A possible explanation

48 Chapter 8. Conclusion
for the mass flux affecting the vapour quality for dryout completion butnot for dryout inception might be that at dryout inception, nucleate boilingcontribution still had an strong effect, however, nucleate boiling disappearswhen entering the mist flow region, leaving a stronger contribution fromconvective boiling and ,thus, of the mass flux.
Comparisons were also made with results collected from the literature re-view regarding the effect of the material used for the tube and the dryoutquality. Pike-Wilson and Karayiannis, 2014 already studied this effect withrefrigerant R245fa and concluded in an earlier dryout inception for coppertubes than stainless steel tubes. The same appreciation was made in thiswork with R134a, although some differences in the experiments compareddo not allow for it to be a conclusive result, but an indication for furtherstudies.
Regarding the HTC that is achieved at dryout inception, it was found toincrease with mass flux although not as significantly as in previous exper-iments on the topic with larger convective contribution. However, com-pletely opposite to previous results as the ones published in da Silva Lima,Quibén, and Thome, 2009. HTC at dryout inception was seen to increasewith heat flux.
The reason behind this is that in previous studies with dominant convectivemechanism when approaching dryout inception, heat flux did not influencethe HTC at each vapour quality. On the other hand, higher heat fluxes pre-sented earlier dryout inceptions and, since HTC also increased with quality,this earlier occurrence of dryout inception provoked that the HTC achievedat dryout inception was smaller for experiments under higher heat fluxes.
In the experiments presented in this work HTC also generally increaseswith quality and as mentioned earlier higher heat flues produce an earlierinception of dryout. However, experiments with different heat fluxes showa large difference in the HTC that they present when approaching dryout.Therefore, even if the HTC achieved for a higher heat flux case is smallerthat if it had continued the same trend until a vapour quality correspond-ing to the dryout inception quality of a lower heat flux case, this differenceis much smaller than the initial gap presented between both experimentsunder different heat fluxes.
Thus, this behaviour indicates that whether heat flux increase results in ahigher or lower HTC at dryout inception, depends on the strength of eachof the heat transfer mechanisms over the other one. With dominant convec-tive heat transfer HTC diminishes with heat flux, but as nucleate boilinggains strength in the process this effect fades until nucleate boiling contri-bution grows strong enough to produce the opposite effect, increasing theHTC at dryout inception with increasing heat flux.
Finally, a sharp increase of the HTC with quality was found before dryoutinception for all the cases experimented except the ones with lower massflux and higher heat flux (stronger nucleate boiling contribution). This im-provement in the heat transfer coefficient had only been reported before in

Chapter 8. Conclusion 49
Deng, Fernandino, and Dorao, 2016 and mentioned to occur due to a slightdecrease of the wall temperature. A possible reason for this phenomenawas said to be that the vapour at high quality moves faster and thereforeremoves the heat more efficiently, meanwhile, the interfacial shear betweenvapour and film enhances the heat transfer contributing to this enhance-ment of the HTC prior to dryout.
Experiments conducted in this work presented this sharp increase in directrelation with a decrease on the wall temperature. Moreover, higher massfluxes showed a more pronounced increase, thus, favouring the hypothesismade by Deng, Fernandino, and Dorao, 2016 on the mechanism behind thisfeature. Nevertheless, further studies on this characteristic are required inorder to achieve a decisive conclusion.


51
Bibliography
Al, Saitoh et (2007). “ Boiling Heat Transfer of R-134A Flowing in Hori-zonta Small-Diameter Tubes”. In: ASME-JSME Thermal Engineering Sum-mer Heat Transfer Conference, pp. 1–10.
Chen, J C (1966). “Correlation for boiling heat transfer to saturated fluidsin convective flow”. In: Industrial & Engineering Chemistry Process Designand development 5.3, pp. 322–329.
Chiapero, E Manavela, M Fernandino, and C A Dorao (2014). “ Experimen-tal results on boiling heat transfer coefficient, frictional pressure drop andflow patterns for R134a at a saturation temperature of 34 °C”. In: In-ternational Journal of Refrigeration 40.1, pp. 317–327. URL: http: / /dx.doi.org/10.1016/j.ijrefrig.2013.11.026 .
da Silva Lima, Ricardo J., Jesús Moreno Quibén, and John R. Thome (2009).“Flow boiling in horizontal smooth tubes: New heat transfer results forR-134a at three saturation temperatures”. In: Applied Thermal Engineer-ing 29.7, pp. 1289–1298. URL: http : / /www.sciencedirect . com/science/article/pii/S1359431108002779 .
Deng, Han, Maria Fernandino, and Carlos A. Dorao (2016). “ Flow Boilingin a horizontal tube at high vapor qualities”. In: Proceedings of the ASME2016 Summer Heat Transfer Conference.
Fang, Xiande (2013). “A new correlation of flow boiling heat transfer co-efficients based on R134a data”. In: International Journal of Heat and MassTransfer 66, pp. 279–283. URL: http://linkinghub.elsevier.com/retrieve/pii/S0017931013005693 .
Fatouh, M. et al. (1991). “Heat transfer characteristics of R410A during itsevaporation inside horizontal tube”. In: International Journal of Energy andEnvironment 113.July, pp. 189–193.
Grauso, S. et al. (2013). “Flow pattern map, heat transfer and pressure dropsduring evaporation of R-1234ze(E) and R134a in a horizontal, circularsmooth tube: Experiments and assessment of predictive methods”. In:International Journal of Refrigeration 36.2, pp. 478–491. URL: http://www.sciencedirect.com/science/article/pii/S0140700712001867 .
Greco, A (2008). “Convective boiling of pure and mixed refrigerants: Anexperimental study of the major parameters affecting heat transfer”. In:International Journal of Heat and Mass Transfer 51.3-4, pp. 896–909.
Kandlikar, S. G. (1990). “A General Correlation for Saturated Two-PhaseFlow Boiling Heat Transfer Inside Horizontal and Vertical Tubes”. In:Journal of Heat Transfer 112.1, p. 219.
Kandlikar, Satish G. (2002). “ Two-Phase Flow Patterns, Pressure Drop, andHeat Transfer during Boiling in Minichannel Flow Passages of CompactEvaporators”. In: Heat Transfer Engineering 23, pp. 5–23.
Kattan, N., J. R. Thome, and D. Favrat (1998a). “Flow Boiling in HorizontalTubes: Part 1—Development of a Diabatic Two-Phase Flow Pattern Map.Journal of Heat Transfer, 120(1), 140–147. http://doi.org/10.1115/1.2830037low

52 BIBLIOGRAPHY
Boiling in Horizontal Tubes: Part”. In: Journal of Heat Transfer 120.1, pp. 140–147.
Kattan, N., J. R. Thome, and D. Favrat (1998b). “Flow boiling in horizontaltubes: Part 2: New heat transfer data for five refrigerants”. In: Journal ofheat transfer 120.February, pp. 148–155. URL: http://cat.inist.fr/?aModele=afficheN\&cpsidt=2169649 .
Kattan, N, J R Thome, and D Favrat (1998c). “Flow Boiling in HorizontalTubes: Part 3—Development of a New Heat Transfer Model Based onFlow Pattern”. In: Journal of Heat Transfer 120.1, pp. 156–165. URL: http://dx.doi.org/10.1115/1.2830039 .
Kim, Sung Min and Issam Mudawar (2013). Universal approach to predict-ing saturated flow boiling heat transfer in mini/micro-channels - Part I. Dryoutincipience quality.
Kundu, Arijit, Ravi Kumar, and Akhilesh Gupta (2014). “Heat transfer char-acteristics and flow pattern during two-phase flow boiling of R134a andR407C in a horizontal smooth tube”. In: Experimental Thermal and FluidScience 57, pp. 344–352. URL: http : / /dx .doi .org /10 .1016 / j .expthermflusci.2014.05.020 .
Kureta, Masatoshi et al. (1998). “Pressure Drop and Heat Transfer for Flow-Boiling of Water in Small-Diameter Tubes”. In: JSME International JournalSeries B 41.4, pp. 871–879.
Lavin, J. Gerard and Edwin H.Young (1965). “Heat transfer to evaporatingrefrigerants in two-phase flow,” in: A.I.Ch.E. Journall, pp. 1124–1132.
Oh, Hoo Kyu and Chang Hyo Son (2011). “Evaporation flow pattern andheat transfer of R-22 and R-134a in small diameter tubes”. In: Heat andMass Transfer/Waerme- und Stoffuebertragung 47.6, pp. 703–717.
Pike-Wilson, E. A. and T. G. Karayiannis (2014). “Flow boiling of R245fa in1.1mm diameter stainless steel, brass and copper tubes”. In: ExperimentalThermal and Fluid Science.
Quibén, Jesús Moreno et al. (2009). “Flow boiling in horizontal flattenedtubes: Part I - Two-phase frictional pressure drop results and model”. In:International Journal of Heat and Mass Transfer 52.15-16, pp. 3634–3644. URL:http://dx.doi.org/10.1016/j.ijheatmasstransfer.2008.12.032 .
Raush, G. et al. (2009). “Analysis of the heat transfer and friction factor cor-relations influence in the prediction of evaporating flows inside tubes”.In: International Journal of Refrigeration 32.7, pp. 1744–1755.
Rossi, F. de, A. W. Mauro, and A. Rosato. “Local heat transfer coefficientsand pressure gradients for R-134a during flow boiling at temperaturesbetween -9 oC and +20 oC”. In: Energy Conversion and Management 7,pp. 1714–1721.
Ruspini, L. and E. Langorgen (2011). Risk assessment report: Two-phase flowinstabilities project. Tech. rep. NTNU.
Ruspini, L.C. (2013). “Experimental and numerical investigation on two-phase flow instabilities”. PhD thesis. NTNU.
Saitoh, Shizuo, Hirofumi Daiguji, and Eiji Hihara (2005). “ Effect of tubediameter on boiling heat transfer of R-134a in horizontal small-diametertubes”. In: International Journal of Heat and Mass Transfer 48.23-24, pp. 4973–4984.

BIBLIOGRAPHY 53
– (2007). “Correlation for boiling heat transfer of R-134a in horizontal tubesincluding effect of tube diameter”. In: International Journal of Heat andMass Transfer 50.25-26, pp. 5215–5225.
Shiferaw, D. et al. (2007). “Examination of heat transfer correlations anda model for flow boiling of R134a in small diameter tubes”. In: Inter-national Journal of Heat and Mass Transfer 50.25-26, pp. 5177–5193. URL:http : / / www . sciencedirect . com / science / article / pii /S0017931007004401 .
Sorrum, Mikkel (2014). “Experimental investigaton of the impact in the heattransfer coefficient and pressure drop during phase flow instabilities”.PhD thesis. NTNU.
Steiner, D. (1993). “Heat Transfer to Boiling Saturated Liquids”. In: VDI HeatAtlas,
Ugueto, L. (2013). “Experimental study of density wave oscillations”. PhDthesis. NTNU.
Wojtan, Leszek, Thierry Ursenbacher, and John R. Thome (2005a). “Inves-tigation of flow boiling in horizontal tubes: Part I—A new diabatic two-phase flow pattern map”. In: International Journal of Heat and Mass Trans-fer 48.14, pp. 2955–2969. URL: http : / /www.sciencedirect .com/science/article/pii/S0017931005000268 .
– (2005b). “Investigation of flow boiling in horizontal tubes: Part II—Developmentof a new heat transfer model for stratified-wavy, dryout and mist flowregimes”. In: International Journal of Heat and Mass Transfer 48.14, pp. 2970–2985. URL: http://www.sciencedirect.com/science/article/pii/S001793100500027X .
Yan, Yi Yie and Tsing Fa Lin (1999). “Condensation heat transfer and pres-sure drop of refrigerant R-134a in a small pipe”. In: International Journalof Heat and Mass Transfer 42.4, pp. 697–708.
Zürcher, Olivier, John R. Thome, and Daniel Favrat (2000). “An onset of nu-cleate boiling criterion for horizontal flow boiling”. In: International Jour-nal of Thermal Sciences 39.9-11, pp. 909–918. URL: http://linkinghub.elsevier.com/retrieve/pii/S1290072900011881 .