Estonian financial services market as at 31 December 2016 · Estonian financial services market ......
29
Estonian financial services market as at 31 December 2016 The overview discusses services provided in Estonia by companies under the supervision of Finantsinspektsioon
Transcript of Estonian financial services market as at 31 December 2016 · Estonian financial services market ......

Estonian financial services marketas at 31 December 2016
The overview discusses services provided in Estonia by
companies under the supervision of Finantsinspektsioon

Table of contents
1. Generaldevelopmentofthefinancialmarket 3
2. Divisionofprivatecustomersbyservices 5
3. Lifeinsurance 6
3.1.Lifeinsurancebrokers 8
4. Non-lifeinsurance 9
4.1.Non-lifeinsurancebrokers 11
5. Investmentandpensionfunds 14
6. Paymentsfromsecondpillarpension 17
7. Portfoliomanagement 18
8. Paymentservices 20
9. Loansissuedbycreditinstitutions 21
10. Loansissuedbycreditors 25
11. Deposits 27

Estonian financial services market as at 31 December 2016
3
1. General development of the financial market
The year 2016 brought along diverse developments, reflecting current trends in the Estonian economy. The volume growth of voluntary long-term savings and investment services, which had slowed over the last years, picked up speed in 2016. The growth of services used for financing consumption1 con-tinued to be strong.
Total balance of deposits increased by 5% in 2016, or by 798 million euros. This growth was supported by demand and overnight deposits (855 million euros were added), owing primarily to low interest rates. The balance of term and savings deposits dropped by 37 million euros. As at the end of 2016, the deposits amounted to 16.3 billion euros.
Consolidated balance of the banks’ loan portfolio2 increased by 6% in 2016, or by 1 billion euros3. As at the end of the year, the banks’ loan portfolio amounted to 17.8 billion euros. Loans issued by creditors has been added as a new service, the volume of which was 0.7 billion euros4 as at the end of the year.
Investment service volumes have increased, especially in the funds segment. In addition to the 18% higher pension fund volumes, the volume of real estate funds made an upsurge of 61% in 2016. At the same time, investments in foreign funds5 and other investments in financial instruments decreased, both by 4% in a year. Aggregated volume of individual port-folios increased by 5%.
Altogether, the volume of assets placed in financial services targeted at savings and investing in 2016 – includ-ing investment and pension funds, individual portfolios, other financial instruments, term and savings deposits and investment and other deposits – grew by 5% to 10.2 billion euros by the year-end (at the end of 2015, it amounted to 9.7 billion euros6). At the same time, the funds held in current accounts increased by 7% in the year, amounting to 12.9 bil-lion euros at the year-end.
The volume of insurance premiums in life insurance increased by 3% in 2016 and amounted to 86 million euros. The volume of insurance premiums in non-life insurance increased by 8% and amounted to 302 million euros.
The volume of investment and banking services provided by Estonian financial institutions as at the end of 2016 (EUR mln)
Service Volume incl. to Estonian resident private persons
volume share in total service
Investment funds 742 - -
Pension funds 3,238 3,238 100%
Foreign funds offered in Estonia 505 102 20%
Unit-linked life insurance appropriations 242 242 100%
Individual portfolios 658 94 14%
Bank loans 17,770 7,613 43%
Creditor loans 741 741 100%
Demand and overnight deposits 12,891 4,543 35%
Term and savings deposits 3,349 1,614 48%
Investment and other deposits 93 67 72%
Other financial instruments 1,406 330 23%
1 According to Statistics Estonia, private consumption increased 2.6% in 2016. 2 This also includes loans issued by creditors in Estonia.3 Total volume of loans issued by credit institutions actually increased by 9%; however, this included a loan of one market participant issued within its
group (ca 0.4 billion euros).4 Starting from 21 March 2016, Finantsinspektsioon carries out supervision also over creditors and credit intermediaries; their data has been included
also in this overview.5 To avoid duplication of data, the investments of Estonian insurance undertakings and investment and pension funds have been deducted from
investments made into foreign investment funds.6 The financial assets also contain the securities held in the securities accounts of Estonian credit institutions.
1. General developm
ent of the financial market

Estonian financial services market as at 31 December 2016
4
Financial assets and liabilities of Estonian resident private persons
From 2016, Finantsinspektsioon has access to the reports of creditors; accordingly, the data of loans issued by them has been added also to this overview.
In 2016, the financial assets of Estonian resident pri-vate persons exceeded their liabilities: the volume of finan-cial assets was 10.2 billion euros as at the end of the year, while the balance of financial liabilities was 8.4 billion euros.
The average volume of assets of an Estonian resident private person was 7,709 euros and the balance of loans 6,339 euros as at the end of 2016. The average net financial assets of a private person were accordingly 1,370 euros (1,458 euros as
Average net financial assets of Estonian resident private persons
Consequently, the net financial assets of Estonian resident pri-vate persons amounted to 1.8 billion euros at the year-end. The net financial assets decreased compared to 2016 (at the end of 2015 they amounted to 1.9 billion euros), above all because liabilities now include loans issued by creditors. Without these loans, the balance of financial liabilities would have been 7.6 billion euros and the net financial assets 2.5 billion euros.
-8,000
-4,000
0
4,000
8,000
-6,000
-2,000
2,000
6,000
10,000
31.12.2011 31.12.2012 31.12.201631.12.2013 31.12.2014 31.12.2015
Investment and other deposits
Term and savings deposits
Demand and overnight deposits
Unit-linked life insurance provisions
Individual portfolios
Pension funds
Investment funds
Other financial instruments
Loans
Net financial assets
EUR
mln
31.12.2011 31.12.2012 31.12.201631.12.2013 31.12.2014 31.12.2015
-6,000
8,000
-4,000
0
4,000
-2,000
2,000
6,000
EUR
-756
10452
1,0141,458 1,370
Liabilities
Net financial assets
Assets
at the end of 2015). Without creditors’ loans, the average net financial assets would have increased to 1,932 euros at the end of the year.
1. General developm
ent of the financial market

Estonian financial services market as at 31 December 2016
5
2. Division of private customers7 by services
7 A customer means a person that holds one contract.8 As the requirements of the European Union have changed, the number of contracts in the insurance segment is not shown here.9 Current accounts, which have a positive balance, opened in credit institutions.10 Loan contracts concluded with banks and other creditors. Some persons may have concluded several loan contracts.
Number of contracts of private persons by financial services
Based on the number of contracts known8 to Finantsinspekt-sioon, demand deposit, that is the current account, is the most popular service in Estonia. As at the end of 2016, pri-vate persons had 1.911 million current accounts9 (many private persons have several current accounts). However, the number of private person current accounts has still been decreasing in recent years: for example, five years ago, or at the end of June 2011, there were 2.484 million current accounts.
The second most popular financial product of private persons is loans. As at the end of 2016, the number of loan contracts concluded with private persons was 1.149 million10. The number of persons who had concluded a contract with pension funds increased from 770 thousands to 783 thou-sands over the year. At the same time, the number of term, savings and investment deposit contracts decreased from 449 thousands to 417 thousands.
31.12.2015
31.12.2016
770,000
783,000
680,000
706,000
443,000
1,919,000
1,911,000
449,000
417,000
Pensionfunds
Creditorloans
Bank loans Demand andovernightdeposits
Term, savings and investment
deposits
2. Division of private custom
ers by services

Estonian financial services market as at 31 December 2016
6
Insurance premIums
In 2016, the life insurance undertakings in Estonia collected 85.7 million euros12 in insurance premiums. In the previous year, 83.3 million euros in insurance premiums were collected, meaning that in a year-on-year comparison the volume of insurance premiums has increased by 2.9%.
The biggest share of the growth originated from annuity and whole life insurance premiums. The volume of annuity premi-ums increased from 19 million euros to 23 million euros in a year and the whole life insurance premiums from 12 million to 14 million euros. At the same time, the volume of unit-linked life insurance premiums dropped from 32 million euros to 29 million euros. The volume of capital insurance premiums decreased from 16 million euros to 14 million euros.
The product with the largest volume is still unit-linked life insurance, accounting for 34% of all life insurance prod-ucts in 2016 (39% in 2015). The second most popular life insurance product is annuity, whose share was 26% in 2016 (23% in the year before). The growth in annuity premiums is primarily caused by the increased volume of II pension pillar contracts13. The whole life insurance premiums with a share of 17% has risen to third place (15% a year before). Capital insurance also accounts for 17% of all life insurance products (19% a year before).
11 In 2016, the Solvency II supervisory framework entered into force; thus, the reporting submitted to Finantsinspektsioon has considerably changed. Accordingly, the data of Statistics Estonia has been used for the life insurance overview.
12 The information does not include insurance premiums collected outside of Estonia.13 Read more about II pillar payments in Chapter 6.
Insurance provIders
Based on insurance premiums, the three largest life insur-ance undertakings – Swedbank Life Insurance SE, SEB Elu- ja Pensionikindlustus, and Compensa Life Vienna Insurance Group SE – received 87% of all insurance premiums in 2016 (85% the year before).
In 2016, the volume of insurance premiums collected by Compensa Life Vienna Insurance Group SE continued to grow (23%), which resulted in an increase in its market share to 23%, from 19%. The increase in the volume of insurance premiums was mainly supported by annuity premiums. The market share of AS SEB Elu- ja Pensionikindlustus remained at 25%. The market share of other life insurance undertakings decreased, whereas the biggest decrease was experienced by Swedbank Life Insurance SE, to 39% from 41%.
Premiums by types of life insurance (EUR mln)
16
19
12
0
4
14
29
23
14
0
5
2015
2016
32
Capitalinsurance
Whole lifeinsurance
AnnuityUnit-linkedlife
insurance
Birth andmarriageinsurance
Supplementaryinsurances
Market division of life insurance undertakings by premiums received in 2016 (2015 in brackets)
Mandatum Life Insurance Baltic SE 6% (7%)
Swedbank Life Insurance SE39% (41%)
SEB Elu- ja Pensionikindlustus
25% (25%)
ERGO Life Insurance SEEstonia branch 7% (8%)
Compensa Life Vienna Insurance Group SE
23% (19%)
3. Life insurance
3. Life insurance11
Market division: Swedbank Life Insurance SE 39% SEB Elu- ja Pensionikindlustus 25%Compensa Life Vienna Insurance Group SE 23%
Service volume: In 2016, the collected insurance premiums amounted to 85.7 million euros

Estonian financial services market as at 31 December 2016
7
The volume of capital premiums decreased over the year almost in all life insurance undertakings (except for Com-pensa Life Vienna Insurance Group SE). The market shares of insurance undertakings have not changed very much, how-ever. The largest capital insurance service provider in Estonia as at the end of 2016 was SEB Elu- ja Pensionikindlustus with a market share of 48%.
The collection of unit-linked life insurance premiums has decreased in all life insurance undertakings. The mar-ket shares of insurance undertakings have not changed very much, however. The market leader is still Swedbank Life Insurance SE and although the volume of premiums has decreased, its market share has grown from 60% to 61%.
In 2016, the collection of annuity premiums increased in Com-pensa Life Vienna Insurance Group SE by 30% and SEB Elu- ja Pensionikindlustus by 49%. This has led to an increase in their market shares, from 67% to 72% and from 13% to 16%, respectively. The market share of ERGO Life Insurance SE Estonia branch decreased from 20% to 12%.
The market shares of whole life insurance providers have changed only slightly. The largest part of the market is covered by Swedbank Life Insurance SE with 64%, followed by SEB Elu- ja Pensionikindlustus with 26%.
Market division of capital insurance at the end of 2016 (end of 2015 in brackets)
Market division of unit-linked life insurance at the end of 2016 (end of 2015 in brackets)
Mandatum Life Insurance Baltic SE6% (5%)
Swedbank Life Insurance SE30% (32%)
SEB Elu- ja Pensionikindlustus
48% (47%)
ERGO Life Insurance SE Estonia branch
11% (11%)
Compensa Life Vienna Insurance Group SE
5% (5%)
Mandatum Life Insurance Baltic SE13% (14%)
Swedbank Life Insurance SE61% (60%)
Compensa Life Vienna Insurance Group SE
7% (7%)
SEB Elu- ja Pensionikindlustus
19% (19%)
Market division of annuity at the end of 2016 (end of 2015 in brackets)
Market division of whole life insurance at the end of 2016 (end of 2015 in brackets)
SEB Elu- ja Pensionikindlustus
16% (13%)
Compensa Life Vienna Insurance Group SE
72% (67%)
ERGO Life Insurance SE Estonia branch
12% (20%)
Mandatum Life Insurance Baltic SE 3% (4%)
Swedbank Life Insurance SE64% (62%)
Compensa Life Vienna Insurance Group SE
3% (3%)
SEB Elu- ja Pensionikindlustus
26% (27%)
ERGO Life Insurance SE Estonia branch4% (4%)
Swedbank Life Insurance SE
0% (0%)
3. Life insurance

Estonian financial services market as at 31 December 2016
8
Brokered Insurance premIums
According to the data received by Finantsinspektsioon, insur-ance brokers registered in Estonia brokered insurance pre-miums in life insurance for the total amount of 459 thousand euros in 2016. The volume of brokered insurance premiums decreased by 15% over the year. The volume of premiums decreased almost in all insurance types, most of all in annuity.
In 2016, the insurance brokers mediated mainly accident and sickness contracts and other life insurance contracts in the amount of 207 thousand and 251 thousand euros, respectively. The most popular type among other life insurance contracts was still unit-linked life insurance. The volume of insurance premiums under unit-linked life insurance contracts and annu-ity insurance premiums was less than one thousand euros.
Estonian life insurance brokers largely mediate insur-ance contracts of the insurance providers of the countries of the European Economic Area, which accounted for 66% of insurance premiums (52% in 2015) and 47% of the number of contracts (48% in 2015) in 2016.
Insurance Brokers
In 2016, there were ten insurance brokers intermediating life insurance contracts. KindlustusEst Kindlustusmaakler still held the biggest market share (61%), followed by UADBB Aon Baltic Estonia branch (15%) and Marks ja Partnerid Kindlus-tusmaaklerid (10%).
3.1. Life insurance brokers
Market division of insurance brokers by life insurance premiums in 2016 (2015 in brackets)
IIZI Kindlustusmaakler5% (1%)
KindlustusEstKindlustusmaakler
61% (48%)
UADBB Aon Baltic Estonia branch
15% (12%)
Marks ja PartneridKindlustusmaaklerid
10% (15%)
Other 9% (24%)
3.1. Elukindlustust vahendavad kindlustusmaaklerid
Market division: KindlustusEst Kindlustusmaakler 61%UADBB Aon Baltic Estonia branch 15% Marks ja Partnerid Kindlustusmaaklerid 10%
Customers: 810 brokered contracts
Service volume: In 2016, the brokered insurance premiums amounted to 459 thousand euros
Insurance premiums brokered by insurance brokers by type of life insurance (EUR thousands)
4 1
267
207228
251
2015
2016
1
39
AnnuityUnit-linkedlife insurance
Accident and sicknessinsurance
Other types

Estonian financial services market as at 31 December 2016
9
Market division: If P&C Insurance 23%ERGO Insurance SE 17%Swedbank P&C Insurance 16%
Customers: no information available
Service volume:
4. Non-life insurance14
14 The data on non-life insurance include only contracts concluded in Estonia and do not include insurance contracts concluded by foreign branches of Estonian insurance undertakings. In 2016, Solvency II supervision framework entered into force, thus, reports submitted to Finantsinspektsioon have changed considerably. The non-life insurance review has therefore been prepared using the data of Statistics Estonia.
Insurance premiums by types of non-life insurance (EUR mln)
Land vehicle insurance, i.e. optional motor vehicle insurance, is still the largest type of insurance with aggregated insurance premiums amounting to 102 million euros in 2016. This was followed by property insurance and motor third party liability insurance with volumes of premiums being 80 million euros and 79 million euros, respectively.
In 2016, 177 million euros were paid out as indemni-ties, being 14 million euros more than in the previous year. The amount of indemnities paid out increased most in prop-erty insurance (from 32 million to 40 million euros) and land vehicle insurance (from 64 million to 69 million euros). The amounts of indemnities decreased in accident and sickness insurance from 11 million to 8 million euros.
71
19
96
3
74
29 7
79
18
102
3
80
39 9
2015
2016
Motor third partyliability insurance
Accident andsicknessinsurance
Propertyinsurance
Land vehicleinsurance
Motor vehicleliability insurance
(excl. motor TPL insurance)
Civil liabilityinsurance
Financial lossinsurance
Other vehicleand goods in
transit insurance
Indemnities paid out by types of non-life insurance (EUR mln)
49
11
64
1
32
1 4 2
52
8
69
1
40
1 3 3
2015
2016
Motor third partyliability insurance
Accident andsicknessinsurance
Propertyinsurance
Land vehicleinsurance
Motor vehicleliability insurance
(excl. motor TPL insurance)
Civil liabilityinsurance
Financial lossinsurance
Other vehicleand goods in
transit insurance
4. Non-life insurance
In 2016, the collected insurance premiums amounted to 302 million euros
Insurance premIums
In 2016, non-life insurance undertakings and the branches of foreign non-life insurance undertakings operating in Estonia received altogether 302 million euros in insurance premi-ums (280 million euros in 2015). 76 million, i.e. 25% of these comprised the branches of foreign insurance undertakings in Estonia (63 million euros, or 23% in 2015). Of insurance pre-miums collected by non-life insurance undertakings, 115 mil-lion euros (or 38% of all premiums) were collected via insur-ance brokers (37%, or 105 million euros in 2015).
The volume of premiums has increased in almost all non-life insurance classes. The biggest growth occurred in motor third party liability insurance (by 9 million euros), land vehicle insurance (by 6 million euros) and property insurance (by 6 million euros).
Estonian financial services market as at 31 December 2016
10
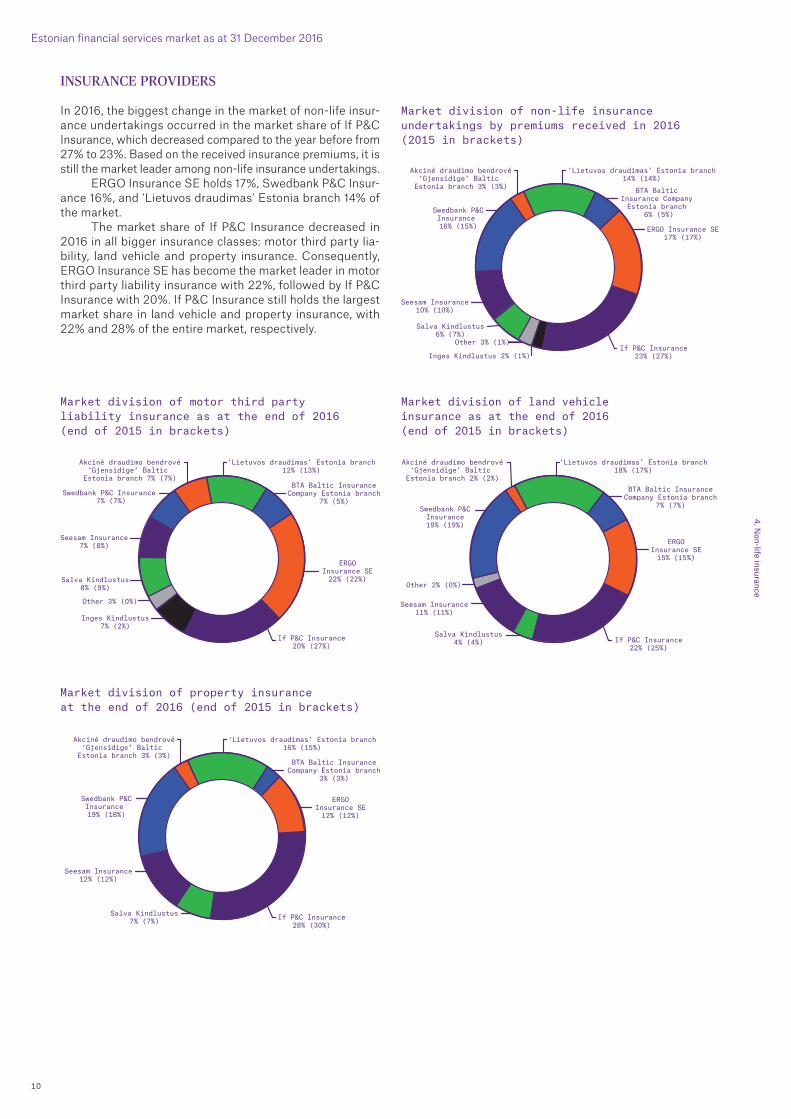
Insurance provIders
In 2016, the biggest change in the market of non-life insur-ance undertakings occurred in the market share of If P&C Insurance, which decreased compared to the year before from 27% to 23%. Based on the received insurance premiums, it is still the market leader among non-life insurance undertakings.
ERGO Insurance SE holds 17%, Swedbank P&C Insur-ance 16%, and ‘Lietuvos draudimas’ Estonia branch 14% of the market.
The market share of If P&C Insurance decreased in 2016 in all bigger insurance classes: motor third party lia-bility, land vehicle and property insurance. Consequently, ERGO Insurance SE has become the market leader in motor third party liability insurance with 22%, followed by If P&C Insurance with 20%. If P&C Insurance still holds the largest market share in land vehicle and property insurance, with 22% and 28% of the entire market, respectively.
Market division of non-life insurance undertakings by premiums received in 2016 (2015 in brackets)
Market division of motor third party liability insurance as at the end of 2016 (end of 2015 in brackets)
Market division of land vehicle insurance as at the end of 2016 (end of 2015 in brackets)
Salva Kindlustus8% (9%)
Seesam Insurance7% (8%)
If P&C Insurance20% (27%)
ERGOInsurance SE22% (22%)
Swedbank P&C Insurance 7% (7%)
Inges Kindlustus7% (2%)
Akciné draudimo bendrové‘Gjensidige’ Baltic Estonia branch 7% (7%)
Other 3% (0%)
BTA Baltic InsuranceCompany Estonia branch
7% (5%)
‘Lietuvos draudimas’ Estonia branch12% (13%)
Salva Kindlustus4% (4%)
Seesam Insurance11% (11%)
If P&C Insurance22% (25%)
ERGOInsurance SE15% (15%)
Swedbank P&CInsurance19% (19%)
Akciné draudimo bendrové‘Gjensidige’ Baltic
Estonia branch 2% (2%)BTA Baltic Insurance
Company Estonia branch7% (7%)
‘Lietuvos draudimas’ Estonia branch18% (17%)
Salva Kindlustus7% (7%)
Seesam Insurance12% (12%)
If P&C Insurance28% (30%)
ERGOInsurance SE12% (12%)
Swedbank P&CInsurance 19% (18%)
Akciné draudimo bendrové‘Gjensidige’ Baltic Estonia branch 3% (3%)
BTA Baltic InsuranceCompany Estonia branch
3% (3%)
‘Lietuvos draudimas’ Estonia branch16% (15%)
Other 2% (0%)
Salva Kindlustus6% (7%)
Seesam Insurance10% (10%)
If P&C Insurance23% (27%)
ERGO Insurance SE17% (17%)
Swedbank P&CInsurance 16% (15%)
Inges Kindlustus 2% (1%)
Akciné draudimo bendrové‘Gjensidige’ Baltic
Estonia branch 3% (3%)
Other 3% (1%)
BTA Baltic Insurance Company Estonia branch
6% (5%)
‘Lietuvos draudimas’ Estonia branch14% (14%)
Market division of property insurance at the end of 2016 (end of 2015 in brackets)
4. Non-life insurance

Estonian financial services market as at 31 December 2016
11
Market division: IIZI Kindlustusmaakler 32%Marsh Kindlustusmaakler 12%KindlustusEst Kindlustusmaakler 10%
Customers: 789,602 brokered contracts
Service volume:
4.1. Non-life insurance brokers
15 In addition to the contracts of insurers, the contracts of foreign re-insurers were also brokered, which is not covered in this overview. The volume of these insurance premiums was 6.7 million euros in 2016.
insurance premiums of non-life insurance undertakings in 2016, 119 million euros (or 80% of all premiums) were medi-ated via Estonian insurance undertakings and 30 million, that is 20%, via foreign insurance undertakings. The big-gest share of contracts of foreign insurance undertakings is in other vehicle and goods in transit insurance (11 million euros), followed by financial loss insurance (6 million euros) and property insurance (5 million euros). For most types of non-life insurance, more than a half of insurance premiums are mediated by brokers.
In 2016, foreign insurers were also used: above all for insuring other vehicles (air and water crafts) and goods in transit, where the volume of insurance premiums mediated by foreign insurance undertakings was four times higher than that of the Estonian insurers.
Insurance premiums received via insurance brokers by types of non-life insurance (EUR mln)
The share of non-life insurance premiums received via brokers
36
3
47
17
29
15 5
1
42
3
45
13
25
4 5 62
2015
2016
Motor thirdparty liability
insurance
Accident andsicknessinsurance
Propertyinsurance
Land vehicleinsurance
Motor vehicleliability insurance(excl. motor TPL
insurance)
Civilliabilityinsurance
Financial lossinsurance
OtherOther vehicleand goods in
transit insurance
51%
16%
49%
532%
39%
58% 62%78%
53%
16%
44%
464%
32%
137%
54%68%
2015
2016
Motor third partyliability insurance
Accident andsicknessinsurance
Propertyinsurance
Land vehicleinsurance
Motor vehicleliability insurance
(excl. motor TPL insurance)
Civil liabilityinsurance
Financial lossinsurance
Other vehicleand goods in
transit insurance
4.1. Non-life insurance brokers
In 2016, the brokered insurance premiums amounted to 149 million euros
Brokered Insurance premIums
According to the data received by Finantsinspektsioon, insur-ance brokers registered in Estonia brokered insurance con-tracts in non-life insurance for the total amount of 149 million euros15 in 2016 (145 million euros in 2015).
As the premiums received by the non-life insurance undertakings reveal, the largest brokered type of insurance based on the volume of insurance premiums mediated by brokers was land vehicle insurance, where insurance pre-miums in the amount of 45 million euros were brokered. Unlike in case of non-life insurance undertakings, the sec-ond popular class was motor third party liability insurance (42 million euros), followed by property insurance (25 million euros).
Estonian insurance brokers intermediate contracts of both Estonian and foreign insurance undertakings. Of all

Estonian financial services market as at 31 December 2016
12
Insurance Brokers
As at the end of 2016, non-life insurance contracts were medi-ated by 40 insurance brokers, of which IIZI Kindlustusmaakler held the largest market share by non-life premiums (32%)16. They were followed by Marsh Kindlustusmaakler with 12% and KindlustusEst Kindlustusmaakler with 10%.
At the end of 2016, the largest market share (51%) in motor third party liability insurance belonged to IIZI Kind-lustusmaakler, followed by KindlustusEst Kindlustusmaakler (19%) and UADBB Aon Baltic Estonia branch (3%).
In land vehicle insurance, the largest market share is held by IIZI Kindlustusmaakler (42%), followed by Kindlus-tusEst Kindlustusmaakler (9%) and DNB Kindlustusmaak-ler (8%).
In property insurance, the market leader is Marsh Kind-lustusmaakler with 27%, followed by IIZI Kindlustusmaakler (17%) and UADBB Aon Baltic Estonia branch (15%).
In travel insurance, the largest market share is held by IIZI Kindlustusmaakler (45%), followed by KindlustusEst Kindlustusmaakler (10%) and UADBB Aon Baltic Estonia branch (6%).
Market division of insurance brokers by non-life insurance premiums in 2016 (2015 in brackets)
Market division of insurance brokers in motor third party liability insurance as at the end of 2016 (end of 2015 in brackets)
Market division of insurance brokers in land vehicle insurance at the end of 2016 (end of 2015 in brackets)
Market division of insurance brokers in property insurance at the end of 2016 (end of 2015 in brackets)
16 Combines market shares of IIZI Kindlustusmaakler AS and Insurance broker services OÜ in 2015.
Market division of insurance brokers in travel insurance at the end of 2016 (end of 2015 in brackets)
KindlustusEstKindlustusmaakler
10% (7%)
VandeniKindlustusmaaklerid
6% (7%)
Aadel Kindlustusmaaklerid 3% (3%)
UADBB Aon BalticEstonia branch
6% (6%)
Kominsur Kindlustusmaakler 4% (3%)
Other 24% (29%)
IIZIKindlustusmaakler
32% (30%)Marsh Kindlustusmaakler
12% (12%)
DNB Kindlustusmaakler 3% (3%)
Marsh Kindlustusmaakler3% (3%)
Fix Kindlustusmaakler 3% (2%)NB Kindlustusmaakler 3% (3%)
Aadel Kindlustusmaaklerid3% (3%)
DNB Kindlustusmaakler8% (7%)
Marsh Kindlustusmaakler 4% (4%)
UADBB Aon BalticEstonia branch
5% (3%)
ABC Kindlustusmaaklerid 3% (3%)UADBB Aon Baltic Estonia branch 3% (3%)
Aadel Kindlustusmaaklerid 2% (3%)
KindlustusEstKindlustusmaakler
19% (10%)
DNB Kindlustusmaakler2% (2%)
Other 21% (29%)
IIZI Kindlustusmaakler 51% (51%)
KindlustusEst Kindlustusmaakler 6% (5%)
CHB Kindlustusmaakler4% (10%)
IIZI Kindlustusmaakler17% (15%)
ABC Kindlustusmaaklerid5% (5%)
Marsh Kindlustusmaakler 27% (30%)
UADBBAon Baltic
Estonia branch15% (4%)
IIZIKindlustusmaakler
42% (40%)
KindlustusEstKindlustusmaakler
9% (8%)
Optimal Kindlustusmaakler4% (5%)
Smart Kindlustusmaakler5% (5%)
IIZIKindlustusmaakler
45% (37%)
Other 21% (27%)
Aadel Kindlustusmaaklerid 5% (5%) Other 19% (23%) Other 17% (23%)
Aadel Kindlustusmaaklerid 4% (4%)
KindlustusEstKindlustusmaakler
10% (12%)
UADBB Aon BalticEstonia branch
6% (6%)
ABC Kindlustusmaaklerid 4% (4%)
Vandeni Kindlustusmaaklerid3% (4%)
ABC Kindlustusmaaklerid2% (2%)
4.1. Non-life insurance brokers
Marsh Kindlustusmaakler3% (3%)
Fix Kindlustusmaakler 3% (2%)NB Kindlustusmaakler 3% (3%)
Aadel Kindlustusmaaklerid3% (3%)
DNB Kindlustusmaakler8% (7%)
Marsh Kindlustusmaakler 4% (4%)
UADBB Aon BalticEstonia branch
5% (3%)
ABC Kindlustusmaaklerid 3% (3%)UADBB Aon Baltic Estonia branch 3% (3%)
Aadel Kindlustusmaaklerid 2% (3%)
KindlustusEstKindlustusmaakler
19% (10%)
DNB Kindlustusmaakler2% (2%)
Other 21% (29%)
IIZI Kindlustusmaakler 51% (51%)
KindlustusEst Kindlustusmaakler 6% (5%)
CHB Kindlustusmaakler4% (10%)
IIZI Kindlustusmaakler17% (15%)
ABC Kindlustusmaaklerid5% (5%)
Marsh Kindlustusmaakler 27% (30%)
UADBBAon Baltic
Estonia branch15% (4%)
IIZIKindlustusmaakler
42% (40%)
KindlustusEstKindlustusmaakler
9% (8%)
Optimal Kindlustusmaakler4% (5%)
Smart Kindlustusmaakler5% (5%)
IIZIKindlustusmaakler
45% (37%)
Other 21% (27%)
Aadel Kindlustusmaaklerid 5% (5%) Other 19% (23%) Other 17% (23%)
Aadel Kindlustusmaaklerid 4% (4%)
KindlustusEstKindlustusmaakler
10% (12%)
UADBB Aon BalticEstonia branch
6% (6%)
ABC Kindlustusmaaklerid 4% (4%)
Vandeni Kindlustusmaaklerid3% (4%)
ABC Kindlustusmaaklerid2% (2%)

Estonian financial services market as at 31 December 2016
13
Market shares of largest non-life insurance brokers by the number of mediated contracts
Broker Market share
2016 2015
IIZI Kindlustusmaakler 63% 58%
KindlustusEst Kindlustusmaakler 10% 10%
Aadel Kindlustusmaaklerid 2% 2%
NB Kindlustusmaakler 2% 2%
DNB Kindlustusmaakler 2% 2%
Smart Kindlustusmaakler 2% 2%
ABC Kindlustusmaaklerid 2% 2%
BCP Kindlustusmaakler 2% 2%
Optimal Kindlustusmaakler 2% 2%
4.1. Non-life insurance brokers
In the segment of non-life insurance brokers, the majority of the market is divided between less than half of all bro-kers in terms of the number of brokered insurance contracts.
The below table reveals that 86% of mediated contracts were concluded by 23% of insurance brokers, i.e. 9 brokers out of 40.

Estonian financial services market as at 31 December 2016
14
Market division: Swedbank Investeerimisfondid 38% LHV Varahaldus 24%SEB Varahaldus 17%
Total number of unit holders: 793,146 valid contracts
Service volume: total fund volume 3.98 billion euros
volume of assets of funds
The volume of the assets of investment funds, including pen-sion funds, totalled 3.98 billion euros at the end of 2016, hav-ing increased by 636 million euros over the year, i.e. 19%18. In 2015, the asset volume had grown by 450 million euros.
The growth in the fund sector continued to be driven by mandatory pension funds: in 2016, the volume of their assets increased by 484 million euros, i.e. 19%, to 3.1 billion euros by the end of December.
In terms of growth, the mandatory pension funds are followed by real estate funds: in 2016, the volume of their assets increased by 136 million euros, i.e. 61%, to 359 million euros. For the first time, the volume of assets of real estate funds exceeded that of equity funds in 2016 and accord-ingly, the real estate funds became the second largest type of funds by volume. The growth of the volume of real estate
17 The data of investment funds includes all customers of investment funds registered in Estonia, including those of foreign countries.18 Asset volume is shown in market value.19 Local equity funds include also funds of funds and mixed funds.
5. Investment and pension funds17
Market value of fund investments (EUR mln)
funds has been supported by added new investors as well as the increased value of portfolios.
The volume of assets of equity funds19 increased by 40 million euros, i.e. 13%, to 339 million euros by the end of the year. Meanwhile, the volume of assets of bond funds dropped from 53 million euros to 8 million euros because due to the low interest rates, the interest of investors has waned.
Mandatory pension funds remained overwhelmingly the biggest fund type with a share of 78% of the total vol-ume of the assets in the fund sector. Real estate funds with a share of 9% have become the second popular fund type, followed by equity funds with an almost 9% share. Voluntary pension funds held 4% and venture capital funds 1% of the aggregate volume of the assets of funds.
53
299
2,61
2
128 223309
300
2,86
3
131281
318
339
3,09
6
142359
36
31.12.2015
30.06.2016
31.12.2016
Bond funds Equity funds Real estate fundsMandatorypension funds
Venture capitalfunds
Voluntarypension funds
5. Investment and pension funds

Estonian financial services market as at 31 December 2016
15
unIt holders of funds
In 2016, the number of unit holders increased by 10,329 to 793,146 by the year-end20. New unit holders were added mainly to mandatory pension funds21 and real estate funds (12,603 and 811, respectively). The number of unit holders in voluntary pension funds increased by 15.
In other types of funds, however, the number of unit holders has decreased. The biggest decrease was experi-enced in equity funds (by 2,730). Over the last six years, the number of unit holders in equity funds has dropped more than twice: from 23,987 at the end of 2010 to 9,272 at the end of 2016. As a result of the liquidation of bond funds, the number of unit holders decreased by 370.
Accordingly, the largest type of fund by the number of customers at the end of 2016 was mandatory pension funds (738,308 unit holders), followed by voluntary pension funds (44,446), equity funds (9,272) and real estate and venture capital funds (1,105).
fund management companIes
The biggest impact on the market of fund services in 2016 came from the acquisition of Danske Capital by LHV Vara-haldus. As a result, the market share of LHV Varahaldus increased from 17% to 24%, thereby becoming the second largest after Swedbank by the volume of managed assets.
The market shares of both SEB Varahaldus and Swed-bank Investeerimisfondid have decreased, from 19% to 17% and from 39% to 38%, respectively.
Number of unit holders of funds
385 12,002
725,705
44,431
294194 11,496
720,637
44,058
32115 9,272
738,308
44,446
1105
31.12.2015
30.06.2016
31.12.2016
Equity fundsBond funds Mandatorypensionfunds
Voluntarypensionfunds
Other funds
20 The number of unit holders includes also non-residents.21 The unit holders may have savings in different pension funds.
Market division of fund services as at the end of 2016 (end of 2015 in brackets)
Swedbank Investeerimisfondid 38% (39%)
Trigon Asset Management 3% (2%)
SEB Varahaldus 17% (19%)
LHVVarahaldus24% (17%)
Danske Capital 0% (7%)
Avaron AssetManagement2% (2%)
EfTEN Capital 6% (5%)
SmartCap 1% (1%)
Nordea Pensions Estonia
7% (7%)
Northern Horizon Capital2% (1%)
5. Investment and pension funds

Estonian financial services market as at 31 December 2016
16
In the equity funds market, the market shares of Trigon Asset Management and Avaron Asset Management increased in 2016 from 21% to 28% and from 19% to 22%, respectively. The market shares of Swedbank Investeerimisfondid and SEB Varahaldus dropped respectively from 52% to 47% and from 6% to 2%.
As at the end of 2016, there was only one bond fund22 left in the market, owned by Avaron Asset Management. SEB Varahaldus and Danske Capital liquidated their funds.
The biggest change in the market of mandatory pension funds was the increase in the market share of LHV Varahaldus, from 21% to 30%, thanks to its merger with Danske Capital. Therefore, LHV Varahaldus became the second largest fund management company for pension funds. The largest market share still belongs to Swedbank
Investeerimisfondid, however in 2016, it did not change and remained at 41%. In addition, the market shares of other management companies have remained unchanged over the year: SEB Varahaldus at 20% and Nordea Pensions Estonia at 9%.
The market share of LHV Varahaldus increased also on the market of voluntary pension funds, from 6% to 10% in 2016. Nordea Pensions Estonia increased its market share from 8% to 9%. The market share of Swedbank Investeeri-misfondid decreased at the same time from 57% to 56%.
The largest increase of the market share among other funds in 2016 was demonstrated by the market share of United Asset Management (previously Redgate Asset Man-agement; manages real estate funds), from 0% to 4% and the market share of EfTEN Capital, from 61% to 63%.
22 Bond funds include money market and interest funds.
Market division of equity funds at the end of 2016 (end of 2015 in brackets)
Market division of mandatory pension funds at the end of 2016 (end of 2015 in brackets)
SwedbankInvesteerimisfondid
47% (52%)Danske Capital 0% (1%)
Trigon Asset Management28% (21%)
Avaron Asset Management22% (19%)
SEB Varahaldus2% (6%)
SwedbankInvesteerimisfondid
41% (41%)
LHV Varahaldus30% (21%)
SEB Varahaldus 20% (20%)
Danske Capital 0% (9%)
Nordea PensionsEstonia9% (9%)
SwedbankInvesteerimisfondid
56% (57%)
LHV Varahaldus10% (6%)
SEB Varahaldus 25% (25%)
Danske Capital 0% (4%)
Nordea PensionsEstonia9% (8%)
LHV Varahaldus1% (1%)
FB Asset Management2% (2%)
Northern Horizon Capital20% (18%)
Birdeye Capital2% (2%)
EfTEN Capital 61% (63%)
Trigon AssetManagement4% (5%)
SmartCap 7% (10%)
United Asset Management4% (0%)
Market division of voluntary pension funds at the end of 2016 (end of 2015 in brackets)
Market division of other funds at the end of 2016 (end of 2015 in brackets)
5. Investment and pension funds
SwedbankInvesteerimisfondid
47% (52%)Danske Capital 0% (1%)
Trigon Asset Management28% (21%)
Avaron Asset Management22% (19%)
SEB Varahaldus2% (6%)
SwedbankInvesteerimisfondid
41% (41%)
LHV Varahaldus30% (21%)
SEB Varahaldus 20% (20%)
Danske Capital 0% (9%)
Nordea PensionsEstonia9% (9%)
SwedbankInvesteerimisfondid
56% (57%)
LHV Varahaldus10% (6%)
SEB Varahaldus 25% (25%)
Danske Capital 0% (4%)
Nordea PensionsEstonia9% (8%)
LHV Varahaldus1% (1%)
FB Asset Management2% (2%)
Northern Horizon Capital20% (18%)
Birdeye Capital2% (2%)
EfTEN Capital 61% (63%)
Trigon AssetManagement4% (5%)
SmartCap 7% (10%)
United Asset Management4% (0%)

Estonian financial services market as at 31 December 2016
17
According to the Estonian Central Register of Securities, as at the end of 2016, there were 32,272 people entitled to II pil-lar pension payments, being 4,541 more than the year before. Of these people, 38% or 12,104 were men and 62% or 20,168 were women. Over the year, the proportion of women and men remained unchanged.
In 2016, the share of people who had signed pension contracts23 grew from 14% to 16% of those entitled to dis-bursements. 39% of those entitled to II pillar payments received only funded pension24 payments as at the end 2016. 10% received payments through funds and lump sum pay-ments25. 16% of those entitled to payments received only
6. Payments from second pillar pension
23 A pension contract is an insurance contract entered into between a unit holder and a life insurance undertaking, based on which the insurance undertaking shall make pension payments until the death of the person who concluded the contract.
24 Funded pension is a scheme agreed on between a unit holder and the management company of the pension fund, based on which regular payments from the pension fund are made to the unit holder during a specified time.
25 Lump sum payments are payments withdrawn all at once from the pension fund.26 Statistics on state pension, mandatory funded pension and voluntary funded pension (in Estonian). Ministry of Finance.
lump sum payments. 16% of those entitled to payments received payments under pension contracts.
The remaining 19% of people who were entitled to II pension pillar payments have not requested it.
Of life insurance undertakings, the largest market share on the II pension pillar market, which is 63%, belonged to Compensa Life Vienna Insurance Group.
The average amount of pension paid under a II pen-sion pillar contract as at the end of 2016 was 54 euros per month (in 2015, 52 euros), the average funded pension was 41 euros per month (in 2015, 43 euros) and the average single disbursement 960 euros (in 2015, 1,109 euros)26.
Division of old-age pensioners who have joined the second pension pillar by type of payment at the end of 2016
Market division of insurance undertakings by number of second pension pillar contracts at the end of 2016 (end of 2015 in brackets)
Only funded pension39% (39%)
Only lump sumpayments16% (17%)
Funded pensionand lump sumpayments 10% (10%)
No payments received19% (20%)
SEB Elu- jaPensionikindlustus
18% (18%)
ERGO LifeInsurance SEEstonia branch
19% (21%)Pension contracts
16% (14%)
Compensa Life Vienna Insurance Group63% (61%)
6. Payments from
second pillar pension

Estonian financial services market as at 31 December 2016
18
Market division: Swedbank grupp 49%SEB Bank grupp 27%LHV Pank 9%Nordea Bank AB Estonia branch 8%
Service volume: Total volume of portfolios 658 million euros
volume of portfolIos
The portfolio management service is provided by fund-management companies, banks and investment firms. The combined volume of portfolios increased by 5% in 2016 and amounted to 658 million euros (at the end of 2015, 628 mil-lion euros).
The volume of portfolios managed by fund manage-ment companies increased in 2016 from 171 million euros to 186 million euros. The volume of customer portfolios managed by credit institutions increased from 454 million euros to 466 million euros and that of investment firms from 3 million to 6 million euros.
7. Portfolio management27
27 The data on portfolio management include all market participants in Estonia providing this service, incl. advisory service. Their customers may be from Estonia or foreign countries.
28 Financial institutions include insurance undertakings, pension funds, credit institutions and other financial institutions. Companies include also state or local government companies. Private persons include also non-profit associations. Government also means national social assistance funds.
Portfolio volumes (EUR mln)
101
Investment firms Fund managementcompanies
Credit institutions
171
3
454
179
4
453
186
6
46631.12.2015
30.06.2016
31.12.2016
customers of portfolIo management servIces
At the end of 2016, the majority share of combined customer portfolios belonged to Estonian residents: approximately 85%, i.e. 559 million euros (at the end of 2015, 550 million euros) of the total volume. Of this amount, 340 million euros belonged in turn to financial institutions, 123 million euros to compa-nies, 2 million euros to the government and 94 million euros to private persons28.
Combined volume of individual portfolios by residence (EUR mln)
736
628 636 658
1,018955
1,058971 965 1010987
31.12.2011
31.12.2012
30.06.2016
31.12.2016
30.06.2015
30.06.2014
30.06.2013
30.06.2012
31.12.2013
31.12.2014
31.12.2015
Estonian residents
Total
545 550 559624 586
649710 655 646630
538
7. Portfolio managem
ent

Estonian financial services market as at 31 December 2016
19
Swedbank44% (45%)
Trigon Asset Management 3% (0%)
Danske Capital0% (3%)
Nordea Bank AB Estonia branch8% (9%)
SEB Pank 10% (11%)
Swedbank Investeerimisfondid
5% (5%)
Other 2% (2%)
Kawe Kapital 2% (2%)
SEB Varahaldus17% (16%)
LHV Pank 9% (7%)
Avaron Asset Management3% (3%)
Kawe Kapital 7% (8%)
SEB Varahaldus61% (60%)
Swedbank Investeerimisfondid 19% (16%)
Trigon AssetManagement9% (0%)
Limestone Platform1% (2%)
LHV Pank 12% (10%)
Nordea Bank ABEstonia branch
12% (12%)
SEB Pank14% (15%)
Swedbank62% (63%)
Danske Capital0% (11%)
portfolIo managers
At the end of 2016, the largest share in the market of port-folio management – 49% – belonged to Swedbank Group companies. The market share of SEB Pank Group compa-nies accounted for 27%. They were followed by LHV Pank with a 9% market share and Nordea Bank AB Estonia branch with 8%.
Danske Capital ceased offering the portfolio manage-ment service, which resulted in a statistical distribution of its market share (3%) between other service providers.
In terms of fund management companies, the largest mar-ket share by managed portfolio volume (61%) belonged to SEB Varahaldus. Swedbank Investeerimisfondid held 19% and Trigon Asset Management 9% of the fund management companies market.
The biggest portfolio among credit institutions is man-aged by Swedbank, who held 62% of the market at the year-end. They were followed by SEB Pank (14%), Nordea Bank AB Estonia branch (12%) and LHV Pank (12%).
Market division of portfolio management by service providers at the end of 2016 (end of 2015 in brackets)
Market division of portfolio management by fund management companies at the end of 2016 (end of 2015 in brackets)
Market division of portfolio management by credit institutions at the end of 2016 (end of 2015 in brackets)
7. Portfolio managem
ent
Swedbank44% (45%)
Trigon Asset Management 3% (0%)
Danske Capital0% (3%)
Nordea Bank AB Estonia branch8% (9%)
SEB Pank 10% (11%)
Swedbank Investeerimisfondid
5% (5%)
Other 2% (2%)
Kawe Kapital 2% (2%)
SEB Varahaldus17% (16%)
LHV Pank 9% (7%)
Avaron Asset Management3% (3%)
Kawe Kapital 7% (8%)
SEB Varahaldus61% (60%)
Swedbank Investeerimisfondid 19% (16%)
Trigon AssetManagement9% (0%)
Limestone Platform1% (2%)
LHV Pank 12% (10%)
Nordea Bank ABEstonia branch
12% (12%)
SEB Pank14% (15%)
Swedbank62% (63%)
Danske Capital0% (11%)

Estonian financial services market as at 31 December 2016
20
Market division: Talveaed 36%TavexWise 34%Eurex Capital 19%
Service volume: Total volume of payments 519 million euros
As at the end of 2016, there were 13 payment institutions operating in Estonia, including five operating under an excep-tion authorisation29. In reality, 10 payment institutions medi-ated payments in 2016.
The volume of payments intermediated by Estonian payment institutions decreased by 42% in 2015, while the number of payments increased by 32%. In 2016, Estonian payment institutions intermediated payments in the amount of 519 million euros (892 million euros the year before). In 2016, there were 3.4 million payments made (2.6 million payments the year before).
Market division of payment institutions by turnover of intermediated transactions as at the end of 2016 (end of 2015 in brackets)
8. Payment services
29 The special authorisation is based on exceptions made to the providers of e-money services based on Section 12 of the Payment Institutions and E-money Institutions Act.
Turnover of transactions intermediated by payment institutions (EUR mln)
Q1 Q2 Q3 Q4
201620152014
241
213225
242
209 211
267
205
112132
181
94
The market division of payment service providers changed significantly in 2016: based on the volume of payments, the market share of Talveaed made an upsurge, increasing from 2% to 36%. The market share of TavexWise grew from 25% to 34%. The market share of Eurex Capital, however, dropped from 68% to 19%.
The largest market share by the amount of payments was still held by Coop Finants (former ETK Finants), which intermediated 96% of all payments.
Eurex Capital 19% (68%)
Talveaed 36% (2%)
Other 1% (1%)
Coop Finants 10% (4%)
TavexWise 34% (25%)
8. Payment services

Estonian financial services market as at 31 December 2016
21
Market division: Swedbank 39%SEB Pank 23%Nordea Bank AB Estonia branch 19%
Private customers: 705,913 effective contracts
Service volume: Consolidated loan portfolio volume 17.8 billion euros
loan portfolIo
The balance of loans issued by credit institutions continued to grow in 2016. The balance of the Estonian loan portfo-lio of credit institutions increased over the year by 8.9%, i.e. by 1.5 billion euros, to 17.8 billion euros by the year-end31. (In 2015, the balance of loans had increased by 1.2 billion euros). Loans to companies32 amounted to 42% and loans to private persons33 to 43% of the total portfolio.
The largest part of the loan growth was contributed by companies, the loan balance of which increased by 566 mil-lion euros over the year. The balance of loans granted to finan-cial institutions increased by 521 million euros and to private persons by 378 million euros. The balance of loans issued to the government, however, decreased by 8 million euros.
9. Loans issued by credit institutions30
30 Loans issued by credit institutions in Estonia. 31 The total volume of loans issued by credit institutions actually increased by 6%, however this included an intra-group loan of one
market participant (ca 0.4 billion euros).32 Includes also state or local government companies.33 Includes also non-profit associations.34 Includes also insurers and pension funds.35 The government includes the central government, local government, national social security fund and other non-budgetary funds.
Balance of loans issued by credit institutions (EUR mln)
31.12.2015
30.06.2016
31.12.2016
483 459 475
1,5632,147 2,083
6,935 7,2007,501 7,332 7,481 7,710
Government Financial institutions Companies Private persons
As at the end of 2016, the loans issued to private persons amounted to 7.7 billion euros and to companies 7.5 billion euros. Loans to financial institutions34 accounted for 2.1 bil-lion euros and to the government35 475 million euros.
In 2016, the balance of housing loans increased the most among loans granted to private persons: by 339 mil-lion euros, amounting to 6.7 billion euros by the year-end. In addition, the balance of consumer loans increased sig-nificantly: by 37 million euros, to 452 million euros by the end of the year. The volume of student loans continued to decline: by 19 million euros, to 112 million euros by the end of the year.
Balance of loans issued to private persons
6,400
6,800
7,200
8,000
7,600
31.12.2011
31.12.2012
30.06.2016
31.12.2016
30.06.2015
30.06.2014
30.06.2013
30.06.2012
31.12.2013
31.12.2014
31.12.2015
EUR
mln
9. Loans issued by credit institutions
Balance of loans to private persons (EUR mln)
6,312
131415
20 151 303
6,434
120438
18 152 318
6,651
112452
19 157 319
31.12.2015
30.06.2016
31.12.2016
Housing loans Student loans Credit cardsConsumer loans Other loansOverdraft

Estonian financial services market as at 31 December 2016
22
loans granted to prIvate persons
The loan burden of private persons in 2016 was influenced the most by housing loans and consumer loans. The average balance of housing loans increased by 1,191 euros over the year, however that of consumer loans decreased by 222 euros. The change in the average loan balance was smaller in other loan types.
The average balance of housing loans increased from 37,892 euros to 39,083 euros in a year. Meanwhile, the balance of student loans decreased from 2,219 euros to 2,192 euros. In addition, the balance of consumer loans decreased from 2,425 euros to 2,203 euros. The average balance of overdraft increased from 282 euros to 288 euros and that of credit cards from 794 euros to 828 euros. The average balance of other loans36 increased from 13,624 euros to 14,083 euros. The reason for the large average balance of other loans is the fact that these loans are taken also to finance business operations.
The number of loan contracts concluded with private persons has increased by almost 26 thousand over the year. The main increase came on the account of consumer loans, where the number of contracts rose by 20%, i.e. almost by 34 thousand contracts (most of all Bigbank and Inbank). Accordingly, consumer loans became the largest loan type with 205,070 contracts. In addition, the number of housing loan contracts increased over the year and was the highest ever at the end of 2016: 170,175 (at the end of 2015, 166,577). The number of student loan contracts at the end of the year was 51,249 (at the end of 2015, 59,182), overdraft contracts 66,652 (at the end of 2015, 70,786), credit card contracts 190,110 (at the end of 2015, 190,174) and other loan contracts 22,657 (at the end of 2015, 22,211).
market dIvIsIon of Bank loans
In 2016, the Estonian loan market was still divided mainly between four large credit institutions holding altogether 89% of the loan market. The largest market share belonged to Swedbank (39% of the total loan portfolio), followed by SEB Pank (23%). The loan balance of Nordea Bank AB Esto-nia branch has increased faster than that of the others, as a result of which its market share also increased from 16% to 19%. Danske Bank A/S Estonia branch covered 8% of the loan market.
The remaining 11% of the market was divided between 12 banks, of which the largest market share, i.e. 3%, is held by DNB Pank.
36 Private persons and non-profit associations take other loans, among other things, to purchase securities and start and expand business activity.
Market division of bank loans as at the end of 2016 (end of 2015 in brackets)
Swedbank39% (40%)
SEB Pank 23% (24%)
Other 8% (8%)
Danske Bank A/S Estonia branch 8% (9%)
Nordea Bank ABEstonia branch
19% (16%)
DNB Pank 3% (3%)
The average balance of loans granted to private persons (EUR)
31.12.2015 30.06.2016 31.12.2016
Housing loans 37,892 38,299 39,083
Student loans 2,219 2,227 2,192
Consumer loans 2,425 2,259 2,203
Overdraft 282 250 288
Credit cards 794 791 828
Other loans 13,624 14,261 14,083
9. Loans issued by credit institutions

Estonian financial services market as at 31 December 2016
23
The market share of government loans has changed to some extent. The balance of loans issued to the government increased in Danske Bank A/S Estonia branch and decreased in SEB Pank and Nordea Bank AB Estonia branch. This influ-enced also their market shares. As at the end of 2016, Danske Bank A/S Estonia branch, whose market share increased from 30% to 33% in a year-on-year comparison, has issued the most loans to the government. However, the market share of Nordea Bank AB Estonia branch and SEB Pank decreased, from 15% to 11% and from 20% to 16%, respectively. Swed-bank had 29% of loans granted to the government at the end of the year.
In addition, the loan market of financial institutions has changed over the year. The fast increase in the balance of loans of Nordea Bank AB Estonia branch in 2016 brought along the redistribution of the loan market of financial
Market division of the loans of financial institutions as at the end of 2016 (end of 2015 in brackets)
Swedbank30% (38%)
SEB Pank23% (28%)
Other 4% (9%)
LHV Pank 7% (8%)
Nordea Bank ABEstonia branch
36% (17%)
Market division of corporate loans as at the end of 2016 (end of 2015 in brackets)
Swedbank34% (34%)
SEB Pank21% (22%)
Nordea Bank ABEstonia branch
19% (19%)
Other 4% (4%)
Danske Bank A/SEstonia branch
8% (8%)
DNB Pank 6% (6%)
LHV Pank 4% (4%)
OP Corporate Bank plcEstonia branch
4% (3%)
Market division of loans to private persons as at the end of 2016 (end of 2015 in brackets)
Swedbank46% (46%)
Nordea Bank ABEstonia branch
14% (14%)
Other 6% (5%)
Danske Bank A/SEstonia branch
8% (9%)
SEB Pank 26% (26%)
institutions. The market share of Nordea Bank AB Estonia branch increased from 17% to 36%, while that of Swedbank and SEB Pank dropped, from 38% to 30%, and from 28% to 23%, respectively.
The market of corporate loans has not changed very much, however. Over the year, the market share of OP Corpo-rate Bank plc Estonia branch (former Pohjola Bank plc Esto-nia branch) grew from 3% to 4%, while that of SEB Pank decreased from 22% to 21%. The other banks retained their previous market share. The largest market share is still held by Swedbank (34%).
The balance of private person loans decreased in Dan-ske Bank A/S Estonia branch, as a result also their market share decreased from 9% to 8% in 2016. The largest part in the balance of private person loans is still concentrated in Swedbank AS (46%) and AS SEB Pank (26%).
Market division of government loans as at the end of 2016 (end of 2015 in brackets)
Swedbank29% (29%)
SEB Pank 16% (20%)
Danske Bank A/SEstonia branch
33% (30%)
Nordea Bank ABEstonia branch
11% (15%)
Other 8% (5%)
DNB Pank 3% (1%)
9. Loans issued by credit institutions

Estonian financial services market as at 31 December 2016
24
In terms of loan types, the division of loans issued to private persons has not changed. Most of the loans granted to pri-vate persons are housing loans: as at the end of 2016, 86% of the total loan balance, or 6.7 billion euros. The share of consumer loans among loans intended for everyday expen-ditures (consumer loans, credit card limits, overdraft), how-ever, has increased (from 71% to 72%). By the end of 2016, the amount of loans issued for everyday consumption totalled 0.6 billion euros.
The loan market of private persons is very concentrated: almost half of the market belonged to Swedbank as at the end of 2016 and the remaining market was divided mainly between AS SEB Pank, Danske Bank A/S Estonia branch, and Nordea Bank AB Estonia branch. In terms of consumer loans, the market share of Inbank increased significantly in 2016: from 6% to 10%. In terms of the balance of consumer loans, Inbank has become the third largest bank, following Swedbank (70%) and SEB Pank (11%).
Distribution of loans related to everyday consumption as at the end of 2016 (end of 2015 in brackets)
Distribution of private person loans as at the end of 2016 (end of 2015 in brackets)
Student loans 2% (2%)
Other loans 4% (4%)
Consumer loans 6% (6%)
Housing loans 86% (86%) Consumer loans 72% (71%)
Credit cards 2% (2%)
Credit cards 25% (26%)
Overdraft3% (3%)
Market division of private person consumer loans as at the end of 2016 (end of 2015 in brackets)
Market division of private person housing loans as at the end of 2016 (end of 2015 in brackets)
SEB Pank 33% (33%)Nordea Bank AB Estonia branch
16% (15%)
SEB Pank 28% (27%)
Danske Bank A/S Estonia branch9% (10%)
Swedbank44% (45%)
Other 2% (2%)
DNB Pank 1% (0%)
Danske Bank A/S Estonia branch1% (1%)
Swedbank64% (64%)
Nordea Bank ABEstonia branch
1% (1%)
Other 1% (1%)
Nordea Bank AB Estonia branch
1% (2%)
SEB Pank 11% (11%)
SEB Pank 31% (28%)
Bigbank 6% (5%)
Swedbank70% (74%)
Other 1% (1%)
Inbank 10% (6%)
Danske Bank A/S Estonia branch2% (5%)
Swedbank51% (42%)
Nordea Bank ABEstonia branch
4% (4%)
Other 2% (2%)
LHV Pank 10% (19%)
Danske Bank A/SEstonia branch
1% (1%)
9. Loans issued by credit institutions
Market division of other private person loans as at the end of 2016 (end of 2015 in brackets)
Market division of private person credit cards as at the end of 2016 (end of 2015 in brackets)
Nordea Bank AB Estonia branch6% (5%)
SEB Pank 20% (22%)
Other 7% (7%)
Swedbank69% (67%)
Other 3% (3%)
Danske Bank A/S Estonia branch 2% (3%)
Swedbank22% (23%)
Nordea Bank AB Estonia branch11% (12%)
DNB Pank 21% (22%)
Citadele banka Estonia branch 3% (2%)
SEB Pank17% (18%)
Danske Bank A/SEstonia branch
8% (10%)
LHV Pank11% (6%)
Estonian financial services market as at 31 December 2016
25
Market division: Swedbank Liising 24%Nordea Finance Estonia 22%SEB Liising 20%
Private customers: 443,380 effective contracts
Service volume: Consolidated loan portfolio volume 741 million euros
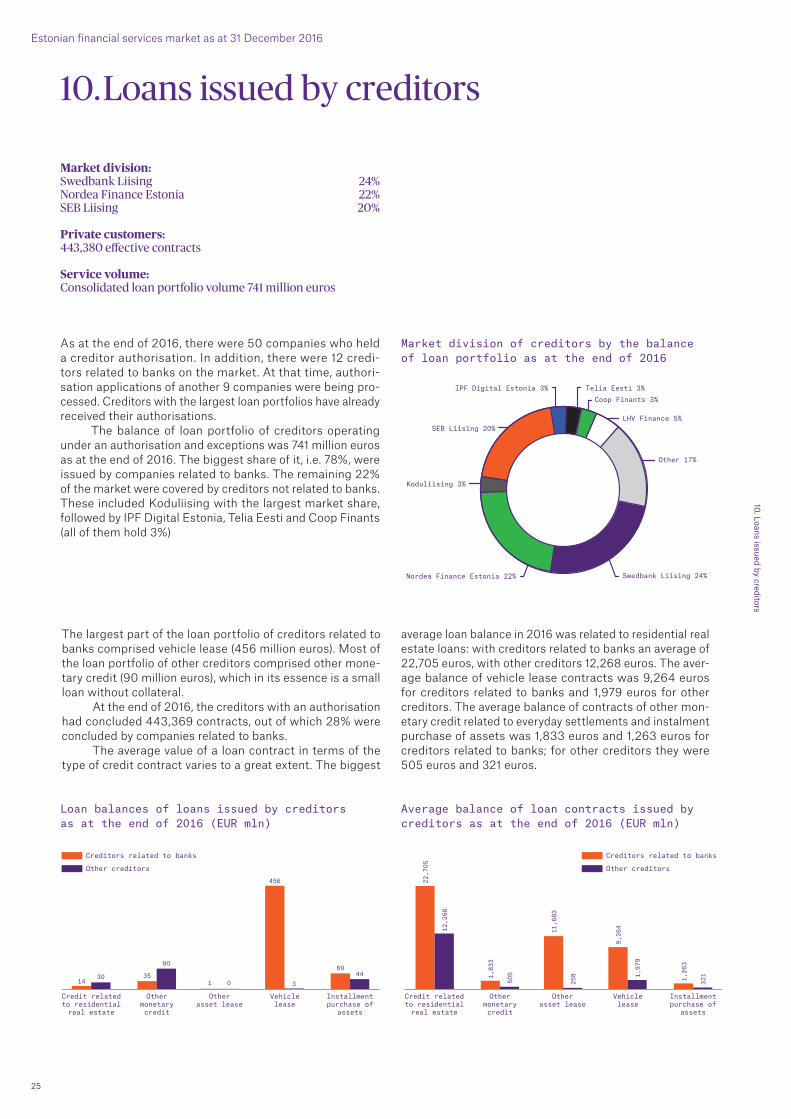
As at the end of 2016, there were 50 companies who held a creditor authorisation. In addition, there were 12 credi-tors related to banks on the market. At that time, authori-sation applications of another 9 companies were being pro-cessed. Creditors with the largest loan portfolios have already received their authorisations.
The balance of loan portfolio of creditors operating under an authorisation and exceptions was 741 million euros as at the end of 2016. The biggest share of it, i.e. 78%, were issued by companies related to banks. The remaining 22% of the market were covered by creditors not related to banks. These included Koduliising with the largest market share, followed by IPF Digital Estonia, Telia Eesti and Coop Finants (all of them hold 3%)
10. Loans issued by creditors
Market division of creditors by the balance of loan portfolio as at the end of 2016
SEB Liising 20%
Swedbank Liising 24%Nordea Finance Estonia 22%
Other 17%
Koduliising 3%
LHV Finance 5%
Telia Eesti 3%IPF Digital Estonia 3%Coop Finants 3%
10. Loans issued by creditors
Loan balances of loans issued by creditors as at the end of 2016 (EUR mln)
1435
1
456
6930
90
0 344
Creditors related to banks
Other creditors
Credit relatedto residentialreal estate
Otherasset lease
Othermonetarycredit
Vehiclelease
Installmentpurchase of
assets
Average balance of loan contracts issued by creditors as at the end of 2016 (EUR mln)
The largest part of the loan portfolio of creditors related to banks comprised vehicle lease (456 million euros). Most of the loan portfolio of other creditors comprised other mone-tary credit (90 million euros), which in its essence is a small loan without collateral.
At the end of 2016, the creditors with an authorisation had concluded 443,369 contracts, out of which 28% were concluded by companies related to banks.
The average value of a loan contract in terms of the type of credit contract varies to a great extent. The biggest
average loan balance in 2016 was related to residential real estate loans: with creditors related to banks an average of 22,705 euros, with other creditors 12,268 euros. The aver-age balance of vehicle lease contracts was 9,264 euros for creditors related to banks and 1,979 euros for other creditors. The average balance of contracts of other mon-etary credit related to everyday settlements and instalment purchase of assets was 1,833 euros and 1,263 euros for creditors related to banks; for other creditors they were 505 euros and 321 euros.
Creditors related to banks
Other creditors
Credit relatedto residentialreal estate
Otherasset lease
Othermonetarycredit
Vehiclelease
Installmentpurchase of
assets
22,7
05
1,83
3
11,6
83
9,26
4
1,26
3
12,2
68
505
258 1,97
9
321
Estonian financial services market as at 31 December 2016
26
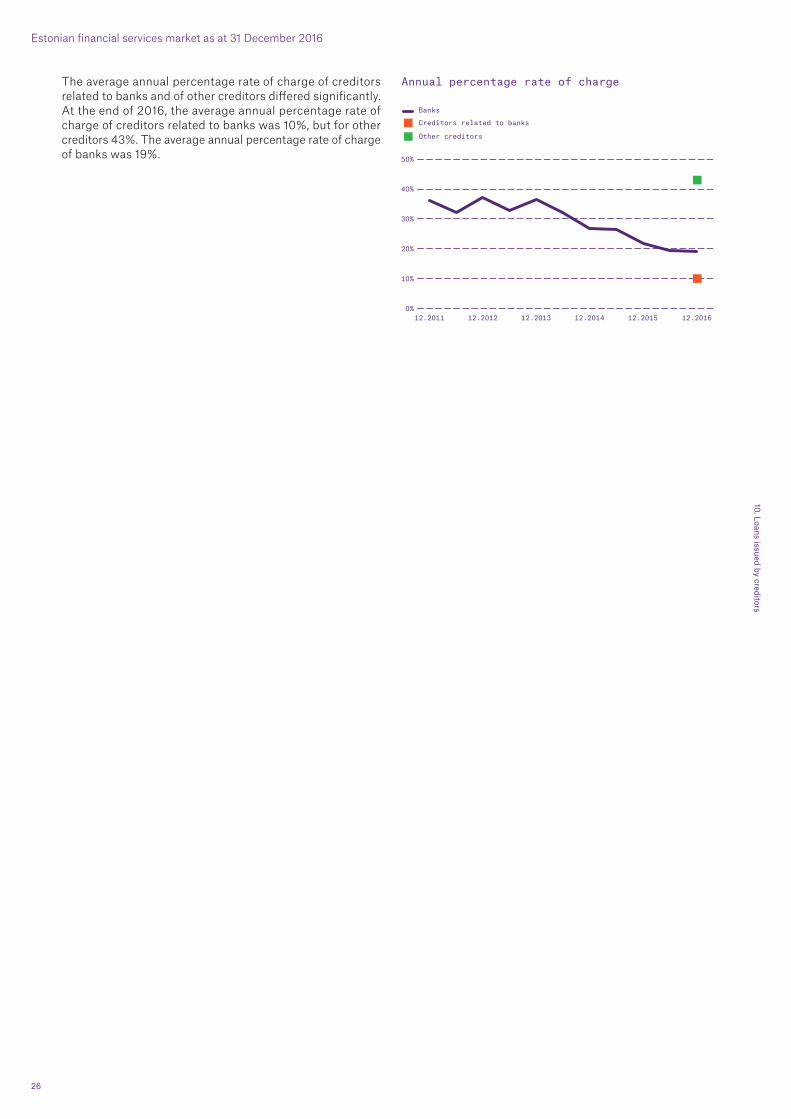
The average annual percentage rate of charge of creditors related to banks and of other creditors differed significantly. At the end of 2016, the average annual percentage rate of charge of creditors related to banks was 10%, but for other creditors 43%. The average annual percentage rate of charge of banks was 19%.
Annual percentage rate of charge
0%
10%
20%
40%
50%
30%
12.2011 12.2012 12.201612.2013 12.2014 12.2015
Creditors related to banks
Other creditors
Banks
10. Loans issued by creditors

Estonian financial services market as at 31 December 2016
27
11. Deposits37
Market division: Swedbank 48%SEB Pank 23%Nordea Bank AB Estonia branch 11%
Customers: 2,589,174 effective contracts
Service volume: consolidated deposit volume 16.3 billion euros
Balance of deposIts
The balance of deposits in Estonian banks increased by 5.1%, i.e. by 798 million euros in 2016, amounting to 16.3 billion euros by the end of 2016. (In 2015, the balance of deposits had grown by 657 million euros). Demand and overnight depos-its increased the most: their balance amounted to 12.9 bil-lion euros. As interest rates are still low, the balance of term and savings deposits remained unchanged to a large extent, amounting to 3.3 billion euros. Other deposits (incl. invest-ment deposits) made 0.1 billion euros. Accordingly, only 21% of deposits were placed for a fixed term. Due to a higher growth rate, the share of demand and overnight deposits increased from 77% to 79% in a year-on-year comparison. At the same time, the share of term and savings deposits decreased from 22% to 21%.
The majority of the deposits were placed by compa-nies38: 6.9 billion euros, that is 42% of total balance of depos-its. Most of these corporate deposits, i.e. 88% were demand and overnight deposits, totalling at 6.1 billion euros, and the remaining 12% term and savings deposits.
Private persons39 held deposits worth 6.8 billion euros, being almost 42% of the balance of deposits. The majority of them were also demand and overnight deposits: 4.9 bil-lion euros, or 71% of all private person deposits. The share of term and savings deposits was 27%, altogether 1.9 billion euros, and investment and other deposits made 0.1 billion euros.
The deposits of financial institutions40 and the govern-ment were respectively 1.6 billion and 1 billion euros at the end of 2016.
The share of deposits of non-residents decreased from 16% to 12% in 2016.
37 The data includes deposits placed in all credit institutions operating in Estonia and in Estonian branches of foreign banks, i.e. deposits of both Estonian residents and non-residents. The data does not include deposits opened in foreign branches of Estonian credit institutions.
38 Includes also state or local government companies.39 Includes also non-profit associations.40 Includes also insurance undertakings and pension funds.
Balance of deposits (EUR mln)
31.12.2015
30.06.2016
31.12.201694
3 1,14
1
1,022
1,30
4
1,60
5
1,573
6,90
9
6,63
9
6,912
6,38
0
6,60
8
6,826
Government Financialinstitutions
Companies Private persons
11. Deposits

Estonian financial services market as at 31 December 2016
28
market dIvIsIon of Bank deposIts
The balance of deposits grew mostly on account of Swed-bank and SEB Pank in 2016, which resulted in an increase of their market shares from 47% to 48% and from 22% to 23%, respectively. Swedbank is still the market leader in most of the customer segments.
In the second half of 2016, Danske Bank A/S Estonia branch ended its retail client programme and changed the pricing of deposits of legal persons, which led to a significant decrease in business volumes. As a result, the market share of Danske Bank A/S Estonia branch dropped from 7% to 4%.
The majority of the government deposit market belongs to SEB Pank (29% of the balance of deposits), fol-lowed by Swedbank (22%) and DNB Pank (16%). The biggest change, however, occurred in the market share of Danske Bank A/S Estonia branch, which dropped from 20% to 3%.
As regards the deposits of financial institutions, the amounts deposited in SEB Pank have grown, which caused its market share to increase from 19% to 23%. The big-gest market share is still held by Swedbank, although it has dropped from 52% to 39% in a year-on year comparison.
Redistribution in the market of corporate deposits continued also in the second half of 2016. Major outflow occurred in Danske Bank A/S Estonia branch and Verso-bank, as a result of which their market shares decreased respectively from 7% to 4% and from 4% to 2%. The balance of deposits in several other banks, especially large banks, however, increased. Over the year, the market share of Swed-bank increased from 45% to 46%, that of SEB Pank from 20% to 21% and that of Nordea Bank AB Estonia branch
Market division of the deposits of financial institu-tions as at the end of 2016 (end of 2015 in brackets)
Market division of government deposits as at the end of 2016 (end of 2015 in brackets)
Market division of private person deposits as at the end of 2016 (end of 2015 in brackets)
Market division of corporate deposits as at the end of 2016 (end of 2015 in brackets)
SEB Pank29% (26%)
Swedbank 22% (8%)
Danske Bank A/SEstonia branch
3% (20%)
DNB Pank 16% (18%)
Nordea Bank ABEstonia branch
17% (25%)
OP Corporate Bank plc Estonia branch
10% (0%)
Other 3% (3%)
SEB Pank 23% (19%)
Nordea Bank ABEstonia branch
17% (10%)
Swedbank 39% (52%)
Danske Bank A/SEstonia branch
8% (8%)
LHV Pank 7% (5%)
Other 3% (4%)
Citadele bankaEstonia branch
3% (2%)
Versobank 2% (4%)
Swedbank46% (45%)
Eesti Krediidipank 2% (2%)
Nordea Bank ABEstonia branch
12% (11%)
TALLINNA ÄRIPANK 2% (2%)
LHV Pank 5% (5%)
OP Corporate Bank plc Estonia branch 2% (0%)
Citadele banka Estonia branch 2% (2%)
Danske Bank A/S Estonia branch4% (7%)
SEB Pank 21% (20%)
DNB Pank 2% (2%)
Eesti Krediidipank 2% (2%)
Swedbank56% (55%)
Nordea Bank AB Estonia branch7% (7%)
Other 2% (3%)
LHV Pank 4% (3%)
Bigbank 3% (3%)
Danske Bank A/SEstonia branch
3% (5%)
SEB Pank 23% (22%)
11. Deposits
Market division of deposits as at the end of 2016 (end of 2015 in brackets)
Versobank 1% (2%)
Swedbank48% (47%)
Bigbank 1%(1%)
Nordea Bank AB Estonia branch11% (10%)
TALLINNA ÄRIPANK 1% (1%)
LHV Pank 5% (4%)
OP Corporate Bank plcEstonia branch
1% (0%)
Citadele banka Estonia branch 1% (2%)
Danske Bank A/SEstonia branch
4% (7%)
SEB Pank 23% (22%)
DNB Pank 2% (2%)Eesti Krediidipank 2% (2%)
from 11% to 12%. The balance of corporate deposits, how-ever, has grown the most in OP Corporate Bank plc Estonia branch, resulting in a rise of market share from 0% to 2%.
The balance of private person deposits has increased the most in Swedbank and has caused the bank’s market share to grow from 55% to 56%. In addition, SEB Pank mar-ket share has increased from 22% to 23%. The market share of Danske Bank A/S Estonia branch dropped from 5% to 3%.

Estonian financial services market as at 31 December 2016
29
numBer and sIze of deposIts
The number of deposit contracts decreased in 2016: demand and overnight deposits by ca 6,700, term and savings depos-its by 27,800 and other deposits by 5,400.
Kehtivate hoiuselepingute arv41 2016. aasta lõpu seisuga:
• demand and overnight deposits 2,164,000 incl. private person deposits 1,912,000• term and savings deposits 407,000 incl. private person deposits 400,000• investment and other deposits 18,000 incl. private person deposits 17,000
The average amount of demand and overnight deposits of private persons as at the end of 2016 was 2,550 euros (2,261 euros at the end of 2015), the amount of term and savings deposits was 4,694 euros (at the end of 2015, 4,590 euros) and the amount of investment and other depo-sits 4,310 euros (3,714 euros at the end of 2015).
Average balance of deposits of private persons (EUR)
41 Deposits with a monetary balance.
31.12.2015
30.06.2016
31.12.2016
2,261
2,413
2,550
4,590
4,564
4,694
3,714
3,899
4,310
Demand andovernight deposits
Term and savingsdeposits
Other deposits
11. Deposits