
Estimativa de Precipitação por...
32
Estimativa de Precipitação por Satélite Treinamento GeonetCast - 22 de junho de 2016
Transcript of Estimativa de Precipitação por...
Estimativa de Precipitação por Satélite
Treinamento GeonetCast - 22 de junho de 2016
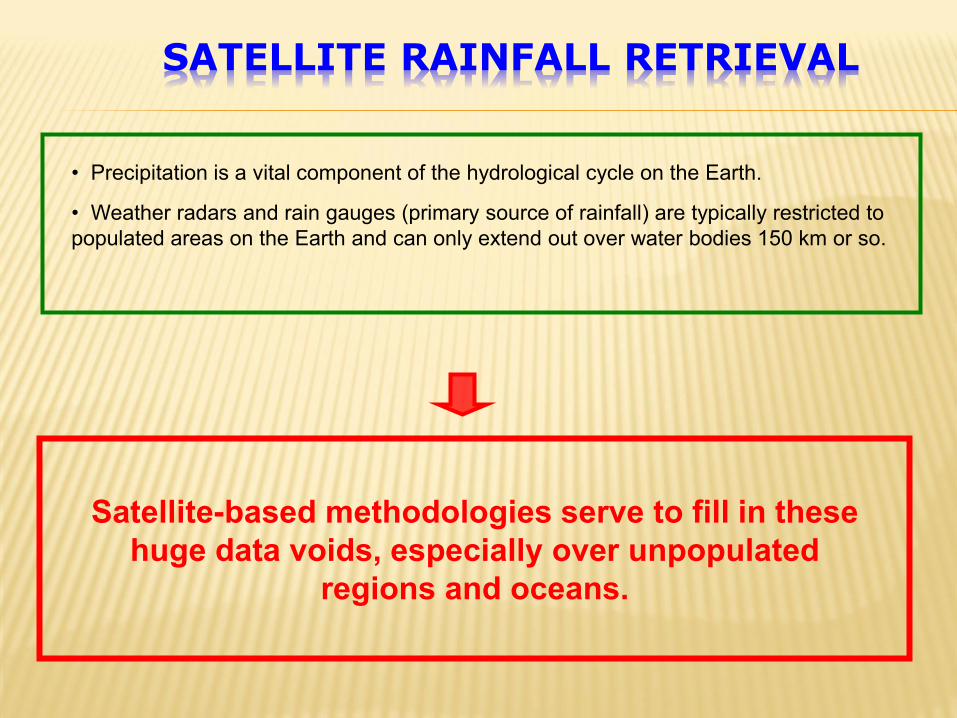
• Precipitation is a vital component of the hydrological cycle on the Earth.
• Weather radars and rain gauges (primary source of rainfall) are typically restricted to populated areas on the Earth and can only extend out over water bodies 150 km or so.
Satellite-based methodologies serve to fill in these
huge data voids, especially over unpopulated
regions and oceans.
SATELLITE RAINFALL RETRIEVAL
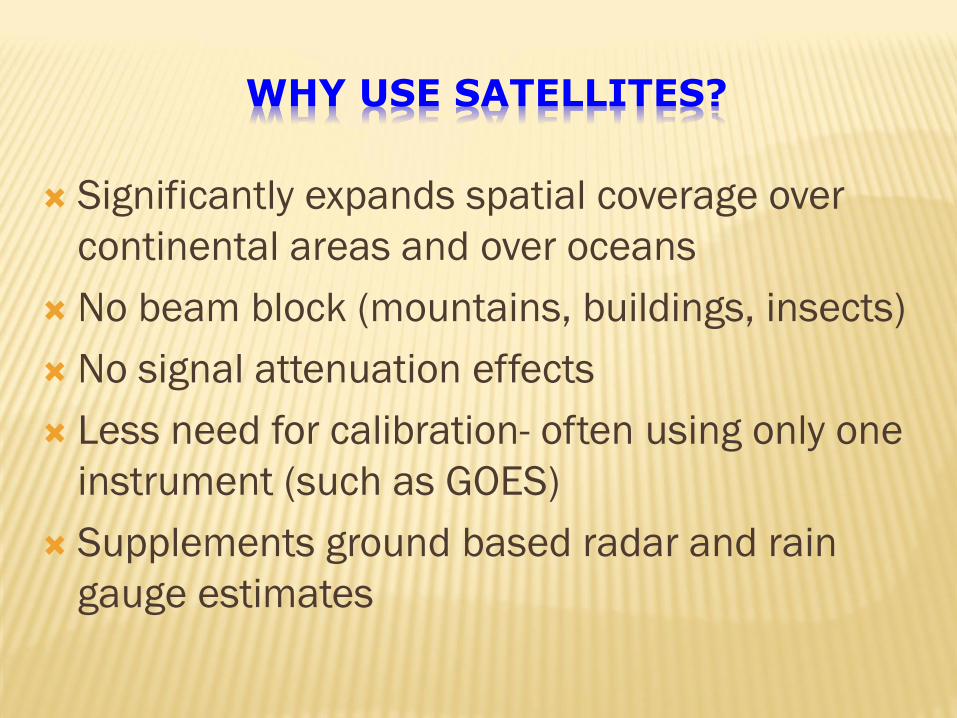
WHY USE SATELLITES?
Significantly expands spatial coverage over
continental areas and over oceans
No beam block (mountains, buildings, insects)
No signal attenuation effects
Less need for calibration- often using only one
instrument (such as GOES)
Supplements ground based radar and rain
gauge estimates
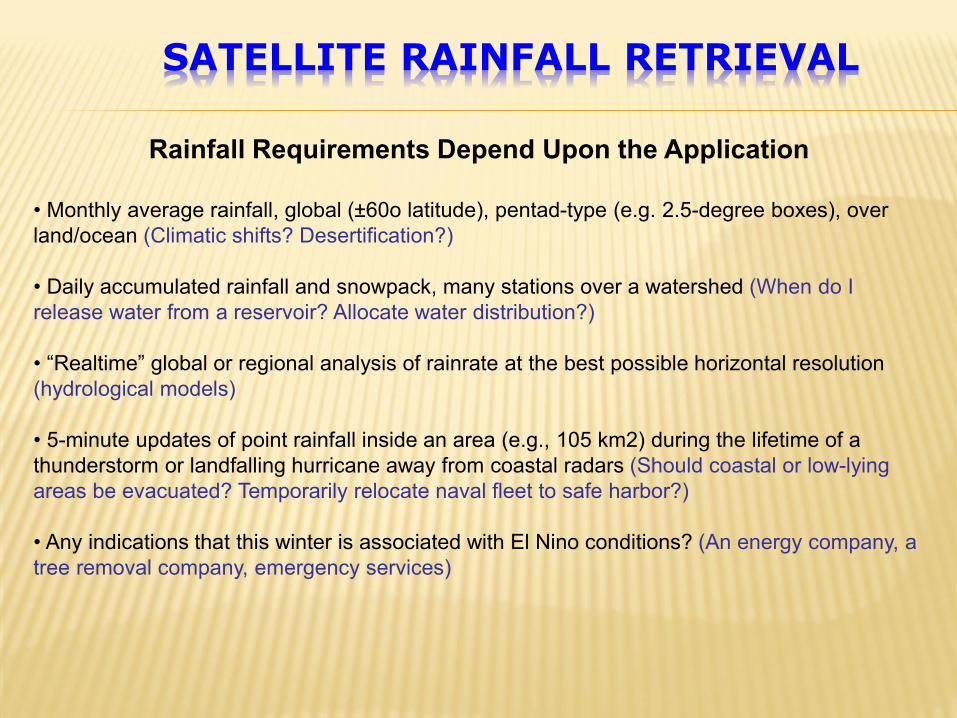
Rainfall Requirements Depend Upon the Application
• Monthly average rainfall, global (±60o latitude), pentad-type (e.g. 2.5-degree boxes), over land/ocean (Climatic shifts? Desertification?) • Daily accumulated rainfall and snowpack, many stations over a watershed (When do I release water from a reservoir? Allocate water distribution?) • “Realtime” global or regional analysis of rainrate at the best possible horizontal resolution (hydrological models) • 5-minute updates of point rainfall inside an area (e.g., 105 km2) during the lifetime of a thunderstorm or landfalling hurricane away from coastal radars (Should coastal or low-lying areas be evacuated? Temporarily relocate naval fleet to safe harbor?) • Any indications that this winter is associated with El Nino conditions? (An energy company, a tree removal company, emergency services)
SATELLITE RAINFALL RETRIEVAL
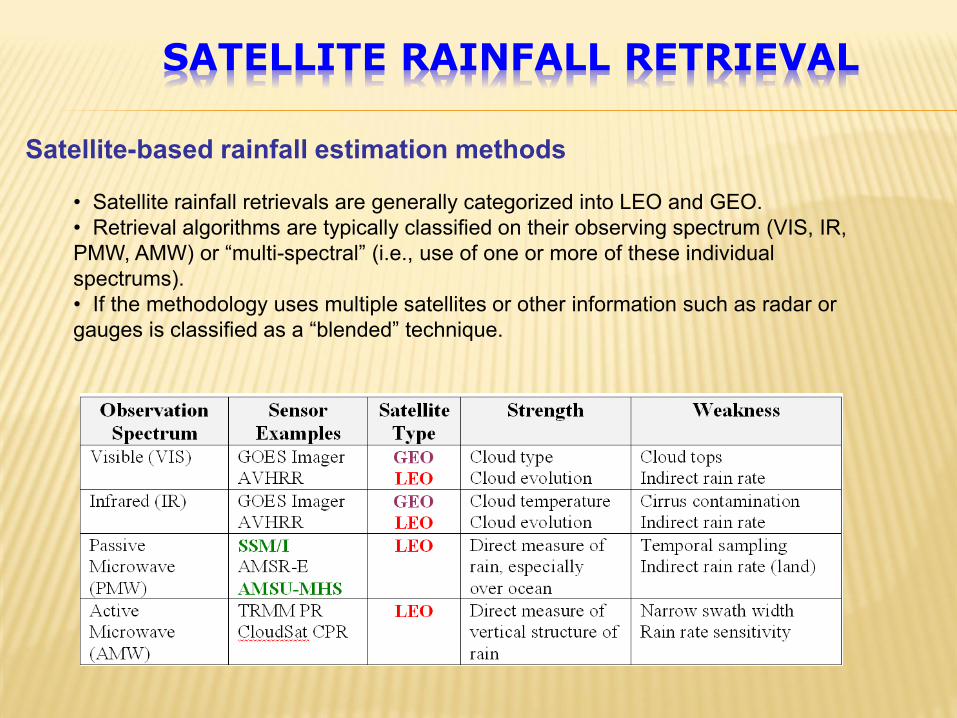
Satellite-based rainfall estimation methods
• Satellite rainfall retrievals are generally categorized into LEO and GEO. • Retrieval algorithms are typically classified on their observing spectrum (VIS, IR, PMW, AMW) or “multi-spectral” (i.e., use of one or more of these individual spectrums). • If the methodology uses multiple satellites or other information such as radar or gauges is classified as a “blended” technique.
SATELLITE RAINFALL RETRIEVAL
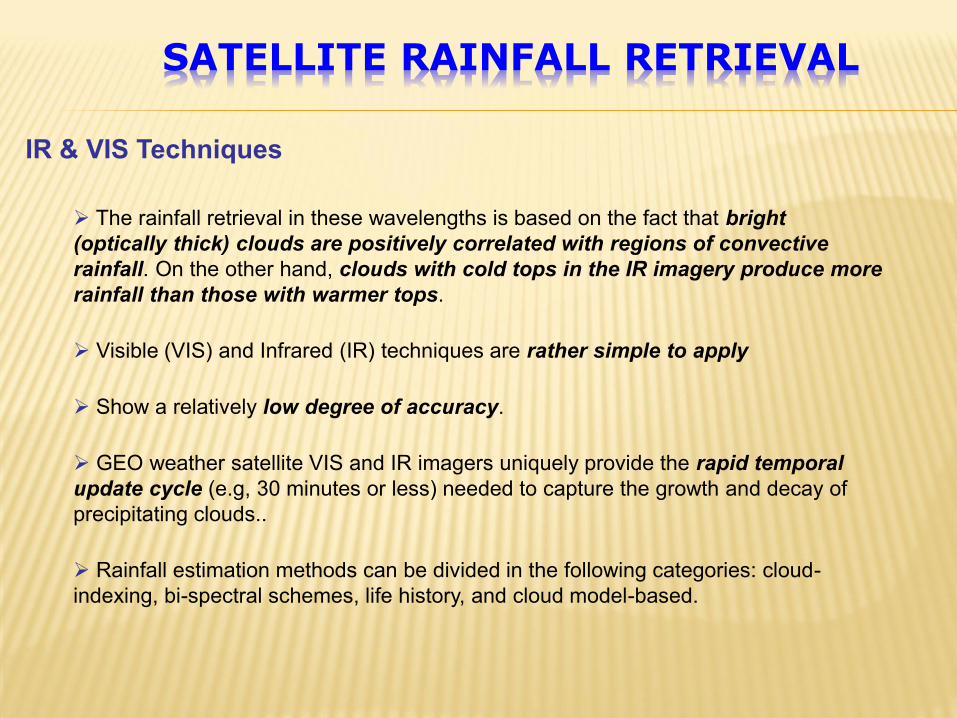
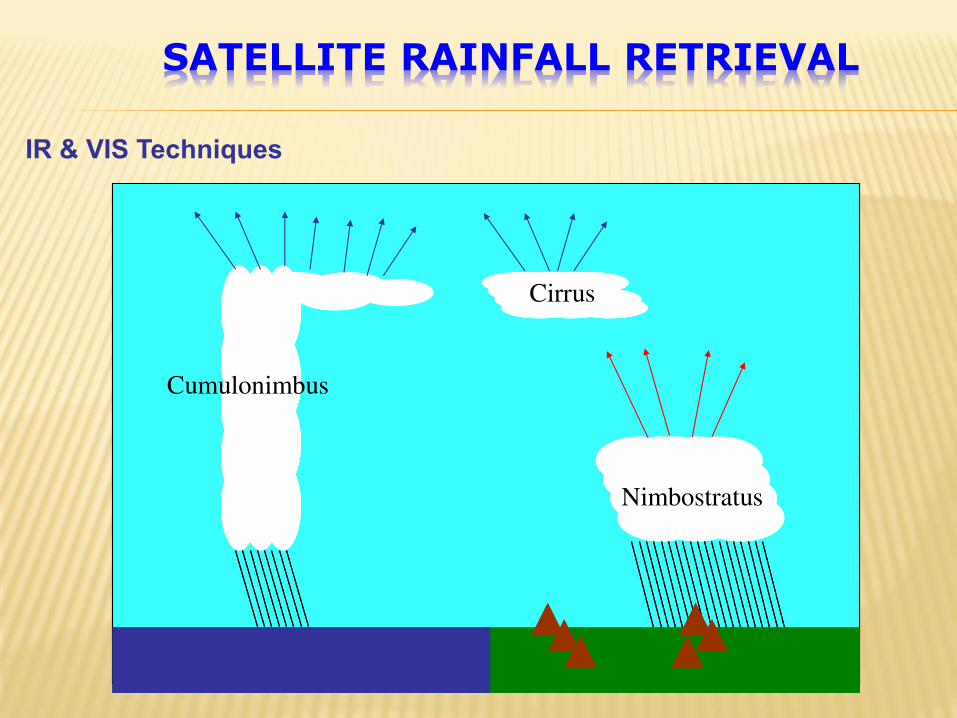
IR & VIS Techniques
The rainfall retrieval in these wavelengths is based on the fact that bright
(optically thick) clouds are positively correlated with regions of convective
rainfall. On the other hand, clouds with cold tops in the IR imagery produce more
rainfall than those with warmer tops.
Visible (VIS) and Infrared (IR) techniques are rather simple to apply
Show a relatively low degree of accuracy.
GEO weather satellite VIS and IR imagers uniquely provide the rapid temporal
update cycle (e.g, 30 minutes or less) needed to capture the growth and decay of precipitating clouds..
Rainfall estimation methods can be divided in the following categories: cloud-indexing, bi-spectral schemes, life history, and cloud model-based.
SATELLITE RAINFALL RETRIEVAL
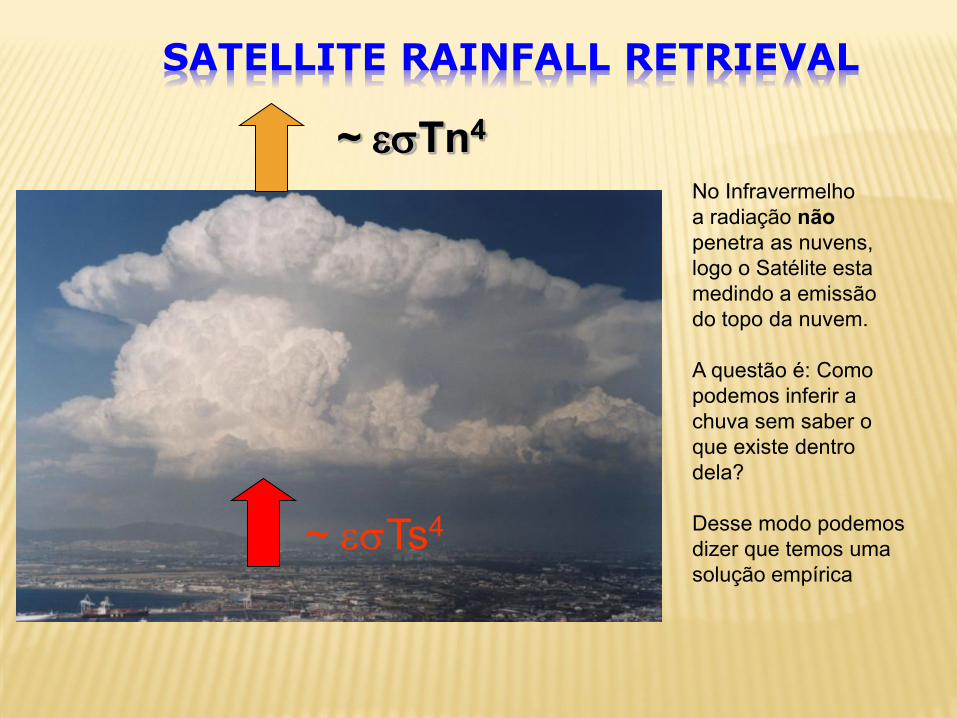
~ Ts4
~ Tn4
No Infravermelho a radiação não
penetra as nuvens, logo o Satélite esta medindo a emissão do topo da nuvem. A questão é: Como podemos inferir a chuva sem saber o que existe dentro dela? Desse modo podemos dizer que temos uma solução empírica
SATELLITE RAINFALL RETRIEVAL
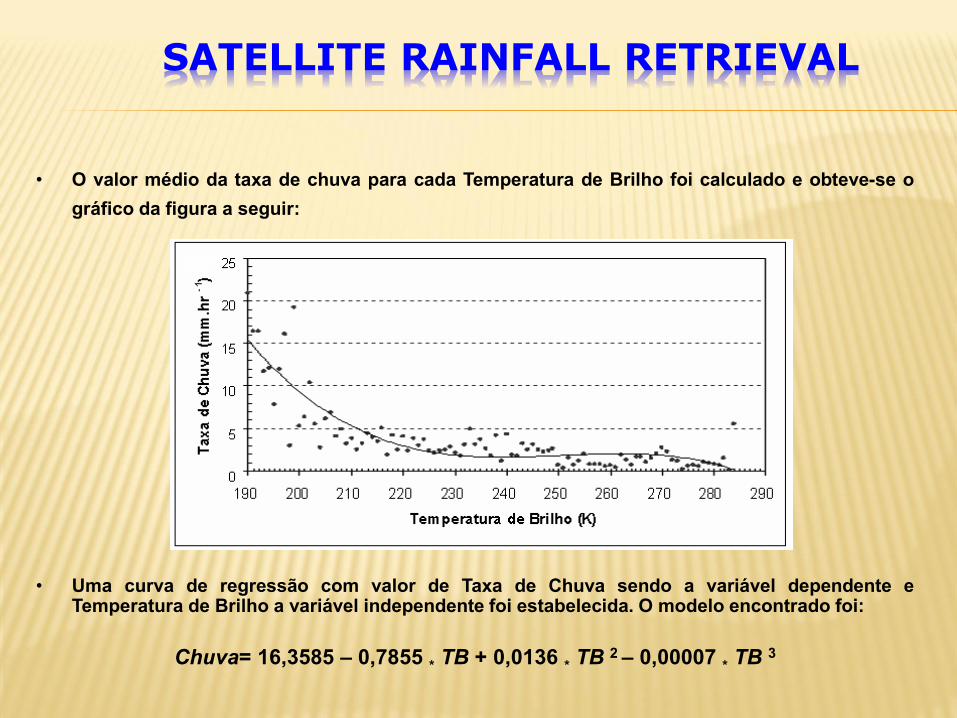
• O valor médio da taxa de chuva para cada Temperatura de Brilho foi calculado e obteve-se o
gráfico da figura a seguir:
• Uma curva de regressão com valor de Taxa de Chuva sendo a variável dependente e Temperatura de Brilho a variável independente foi estabelecida. O modelo encontrado foi:
Chuva= 16,3585 – 0,7855 * TB + 0,0136 * TB 2 – 0,00007 * TB 3
SATELLITE RAINFALL RETRIEVAL
IR & VIS Techniques
Nimbostratus
Cumulonimbus
Cirrus
Nimbostratus
Cumulonimbus
Cirrus
SATELLITE RAINFALL RETRIEVAL
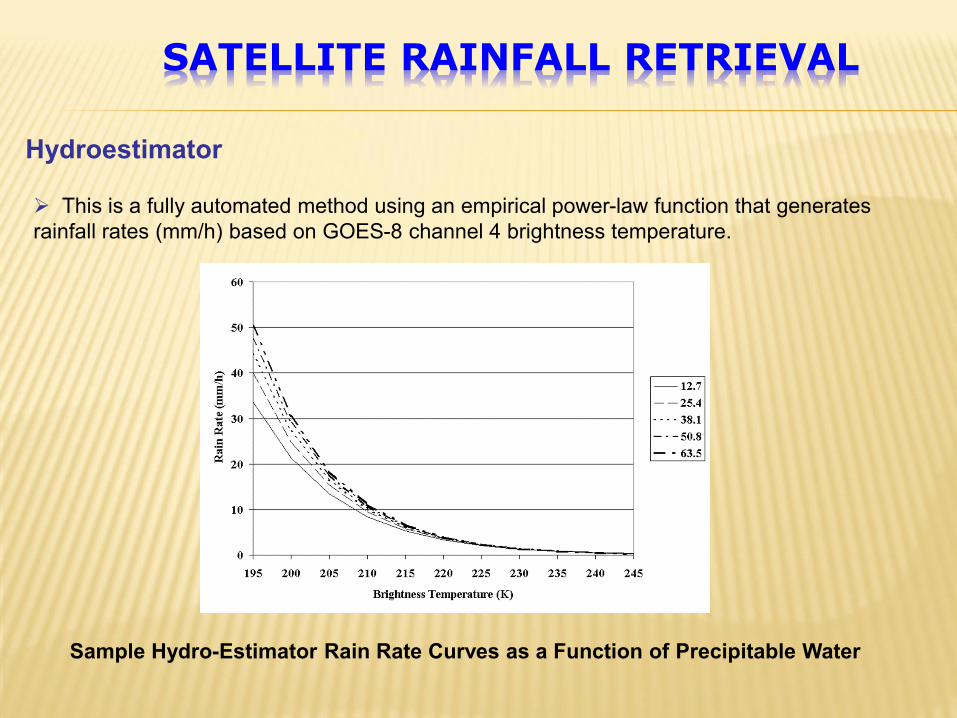
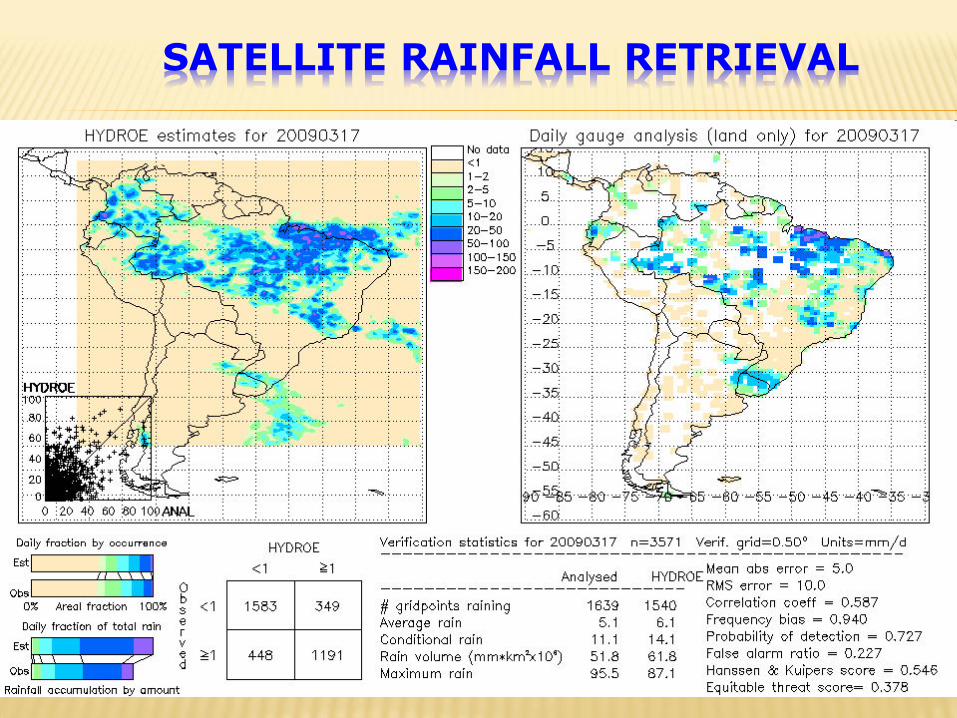
This is a fully automated method using an empirical power-law function that generates rainfall rates (mm/h) based on GOES-8 channel 4 brightness temperature.
Sample Hydro-Estimator Rain Rate Curves as a Function of Precipitable Water
Hydroestimator
SATELLITE RAINFALL RETRIEVAL
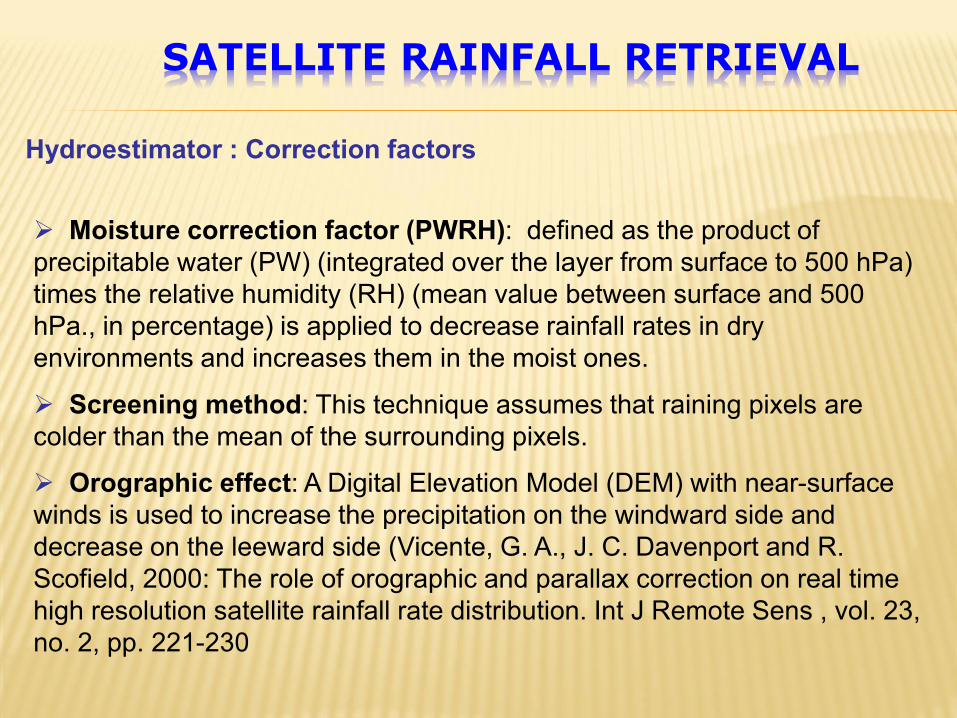
Hydroestimator : Correction factors
Moisture correction factor (PWRH): defined as the product of precipitable water (PW) (integrated over the layer from surface to 500 hPa) times the relative humidity (RH) (mean value between surface and 500 hPa., in percentage) is applied to decrease rainfall rates in dry environments and increases them in the moist ones.
Screening method: This technique assumes that raining pixels are colder than the mean of the surrounding pixels.
Orographic effect: A Digital Elevation Model (DEM) with near-surface winds is used to increase the precipitation on the windward side and decrease on the leeward side (Vicente, G. A., J. C. Davenport and R. Scofield, 2000: The role of orographic and parallax correction on real time high resolution satellite rainfall rate distribution. Int J Remote Sens , vol. 23, no. 2, pp. 221-230
SATELLITE RAINFALL RETRIEVAL
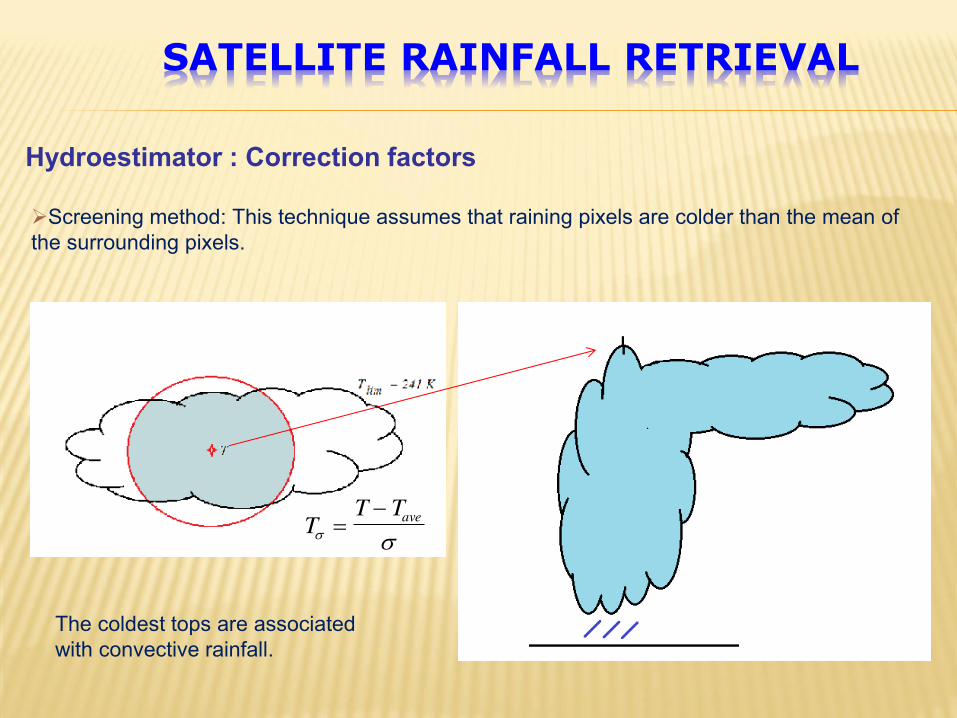
Screening method: This technique assumes that raining pixels are colder than the mean of the surrounding pixels.
TT Tave
=
-
The coldest tops are associated with convective rainfall.
Hydroestimator : Correction factors
SATELLITE RAINFALL RETRIEVAL
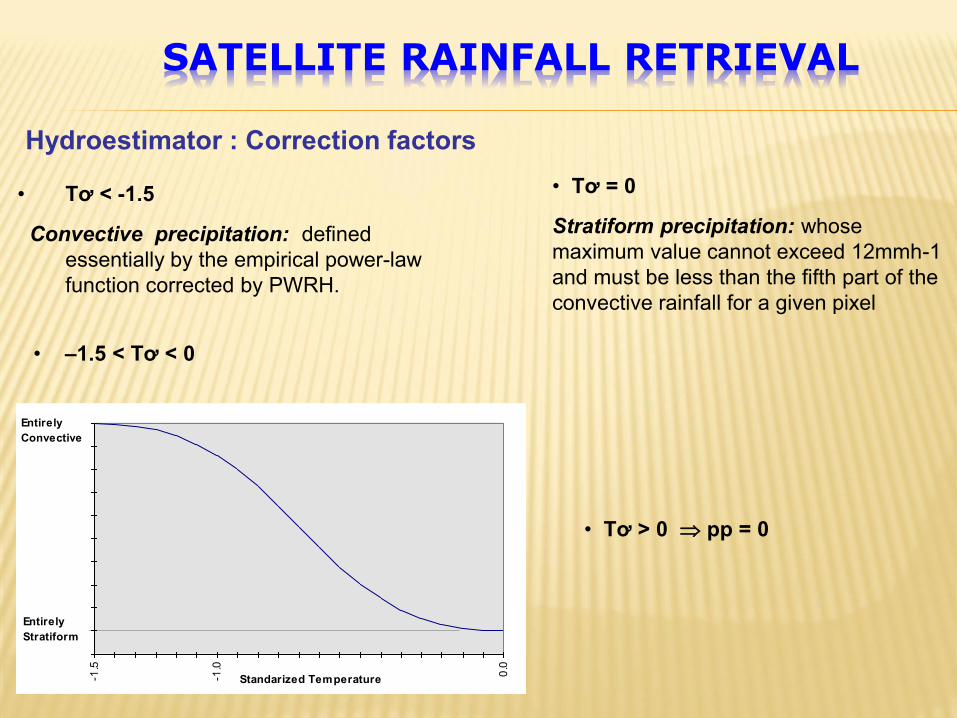
• Tơ < -1.5
Convective precipitation: defined essentially by the empirical power-law function corrected by PWRH.
• Tơ = 0
Stratiform precipitation: whose maximum value cannot exceed 12mmh-1 and must be less than the fifth part of the convective rainfall for a given pixel
• –1.5 < Tơ < 0
• Tơ > 0 pp = 0
-1.5
-1.0
0.0
Entirely
Convective
Entirely
Stratiform
Standarized Temperature
Hydroestimator : Correction factors
SATELLITE RAINFALL RETRIEVAL
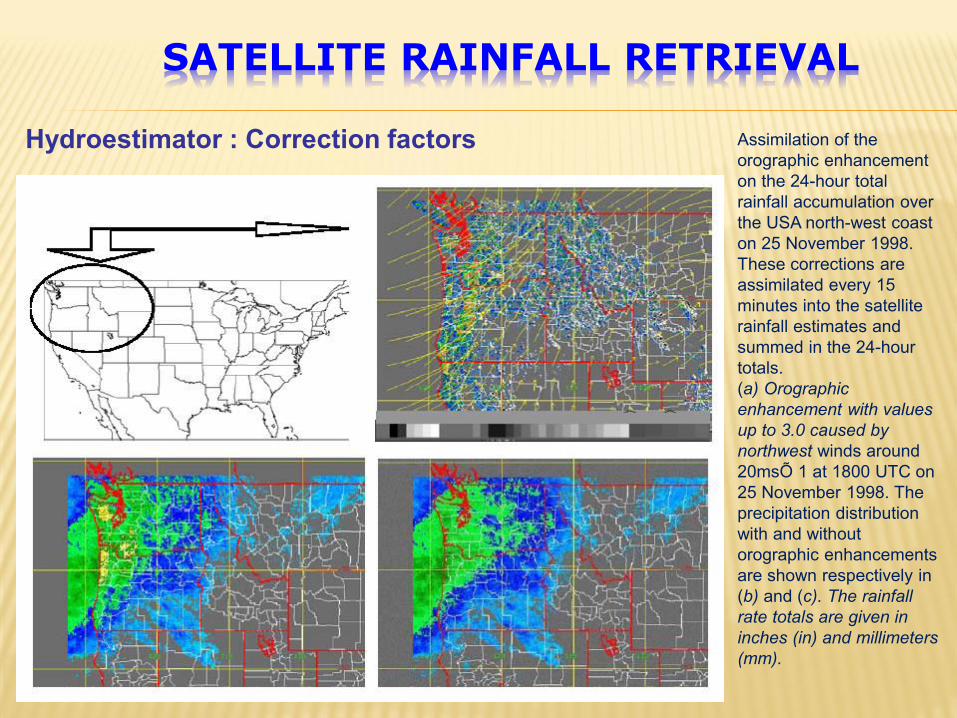
Hydroestimator : Correction factors Assimilation of the orographic enhancement on the 24-hour total rainfall accumulation over the USA north-west coast on 25 November 1998. These corrections are assimilated every 15 minutes into the satellite rainfall estimates and summed in the 24-hour totals. (a) Orographic
enhancement with values
up to 3.0 caused by
northwest winds around 20msÕ 1 at 1800 UTC on 25 November 1998. The precipitation distribution with and without orographic enhancements are shown respectively in (b) and (c). The rainfall
rate totals are given in
inches (in) and millimeters
(mm).
SATELLITE RAINFALL RETRIEVAL
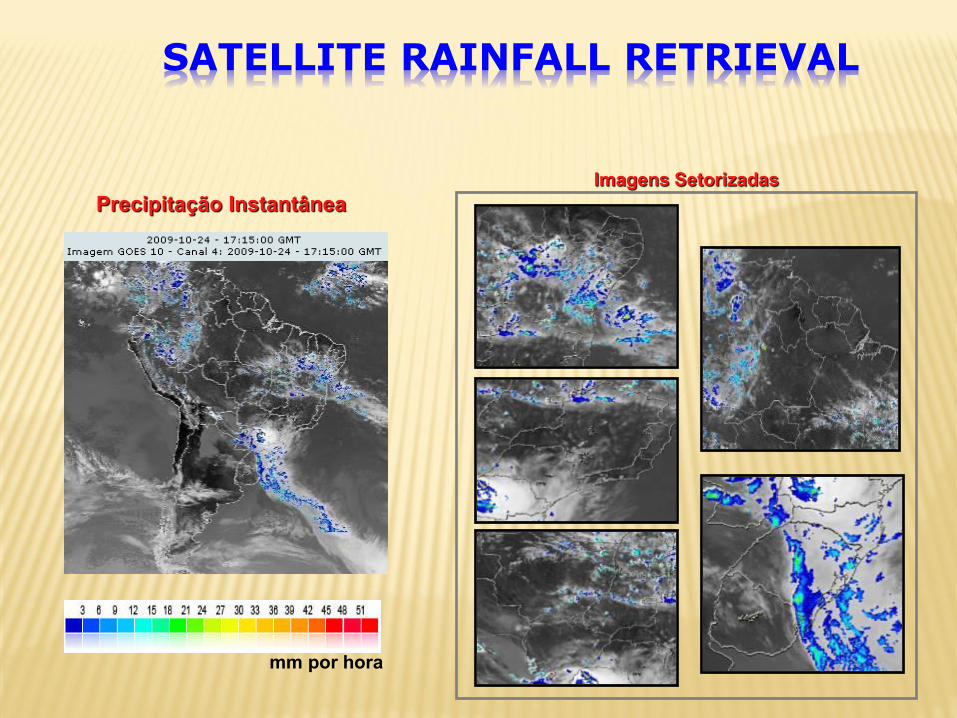
Precipitação Instantânea
Imagens Setorizadas
mm por hora
SATELLITE RAINFALL RETRIEVAL
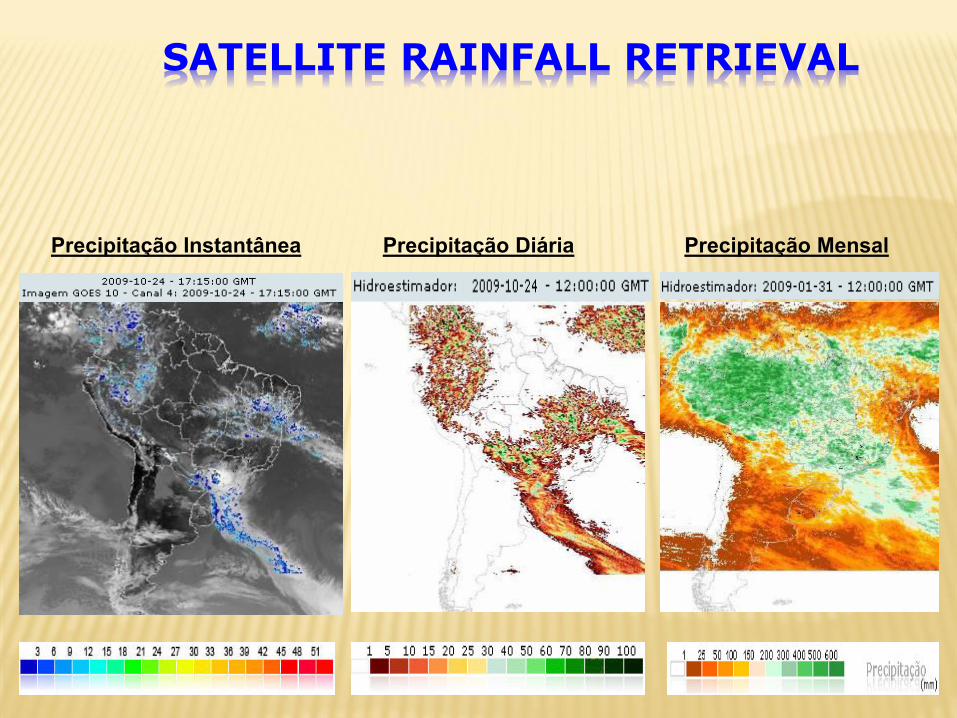
Precipitação Instantânea Precipitação Diária Precipitação Mensal
SATELLITE RAINFALL RETRIEVAL
SATELLITE RAINFALL RETRIEVAL
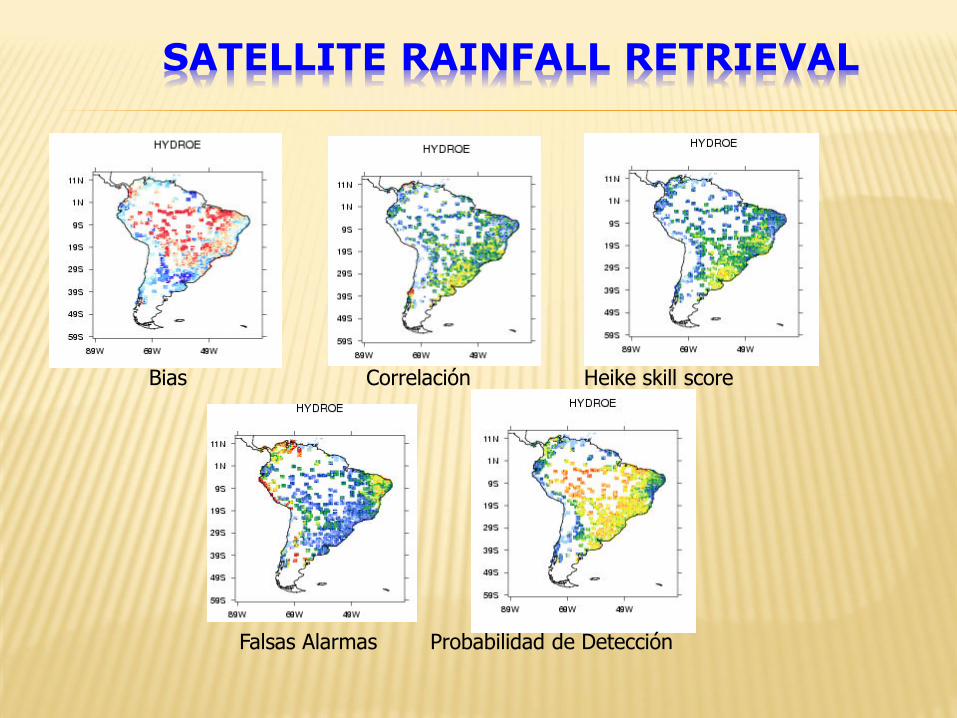
Falsas Alarmas Probabilidad de Detección
Bias Correlación Heike skill score
SATELLITE RAINFALL RETRIEVAL
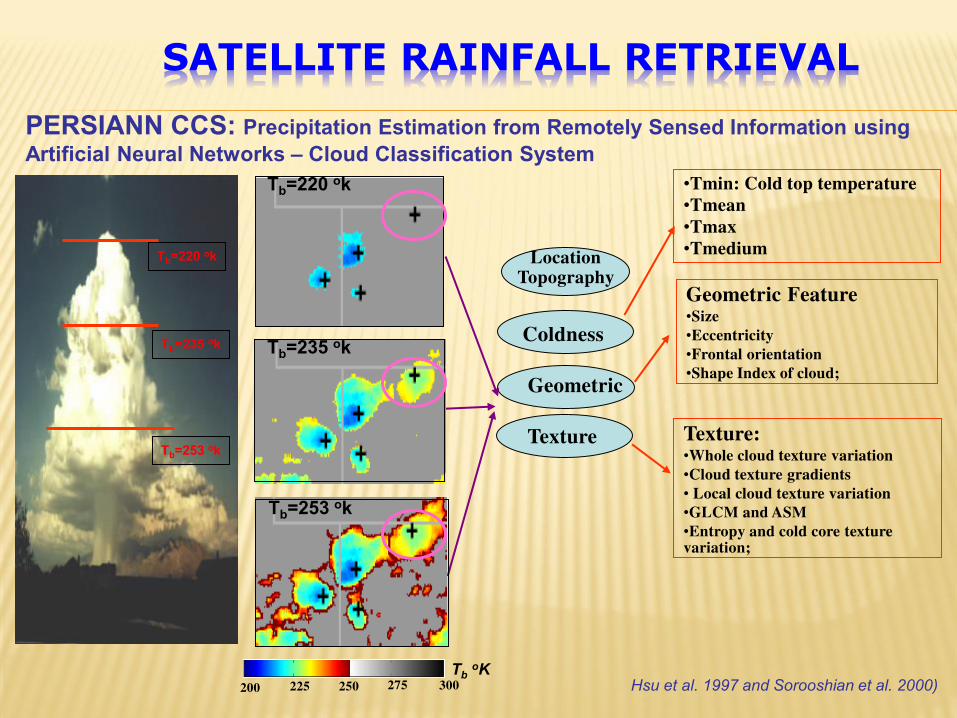
Tb=220 ok
Tb=235 ok
Tb=253 ok
•Tmin: Cold top temperature
•Tmean
•Tmax
•Tmedium
Geometric Feature •Size
•Eccentricity
•Frontal orientation
•Shape Index of cloud;
Texture: •Whole cloud texture variation
•Cloud texture gradients
• Local cloud texture variation
•GLCM and ASM
•Entropy and cold core texture variation;
Coldness
Geometric
Texture
Tb oK 200 225 250 275 300
Tb=235 ok
Tb=253 ok
Tb=220 ok Location Topography
PERSIANN CCS: Precipitation Estimation from Remotely Sensed Information using
Artificial Neural Networks – Cloud Classification System
Hsu et al. 1997 and Sorooshian et al. 2000)
SATELLITE RAINFALL RETRIEVAL
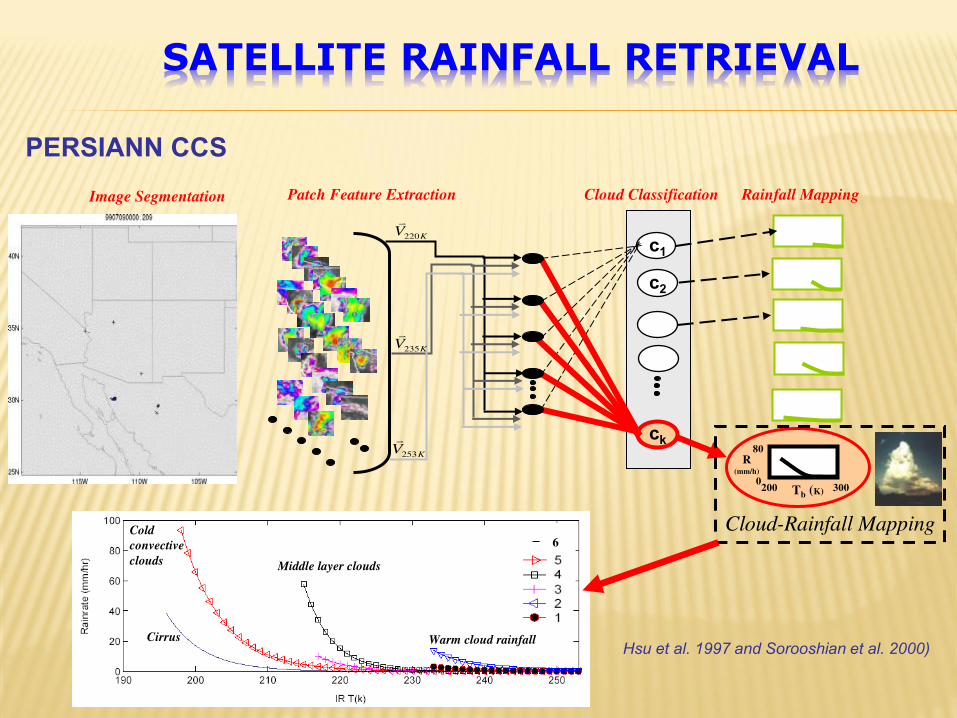
PERSIANN CCS
c1
c2
Tb (K)
R (mm/h)
200 300 0
80
KV220
KV253
KV235
Cloud Classification Patch Feature Extraction Image Segmentation Rainfall Mapping
ck
Cloud-Rainfall Mapping _
6_
6Cold
convective
clouds
Cirrus
Middle layer clouds
Warm cloud rainfallHsu et al. 1997 and Sorooshian et al. 2000)
SATELLITE RAINFALL RETRIEVAL
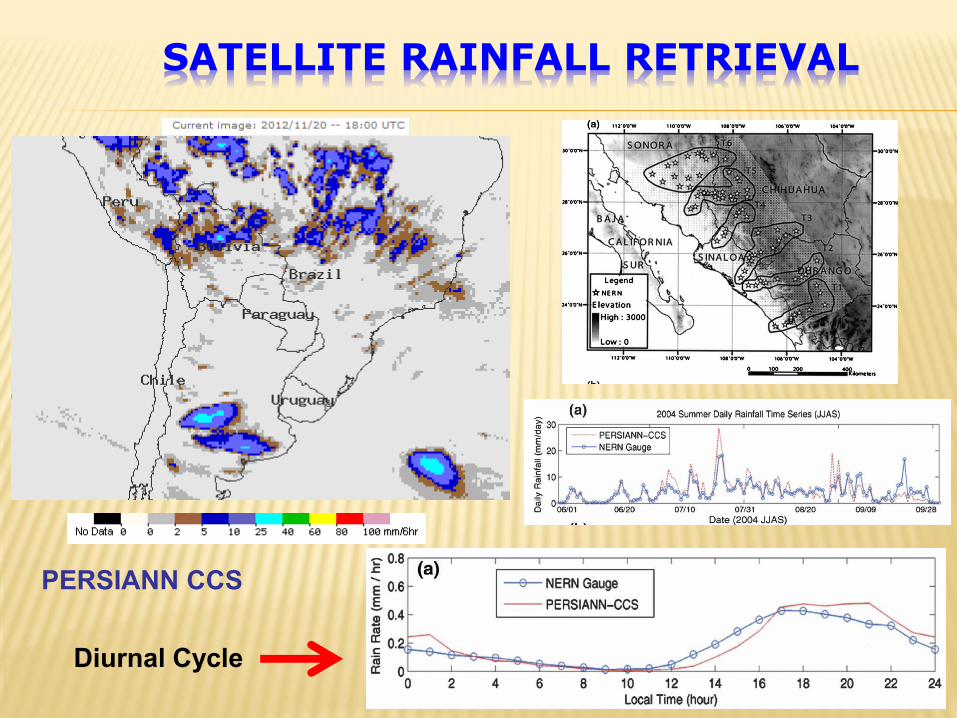
PERSIANN CCS
Diurnal Cycle
SATELLITE RAINFALL RETRIEVAL
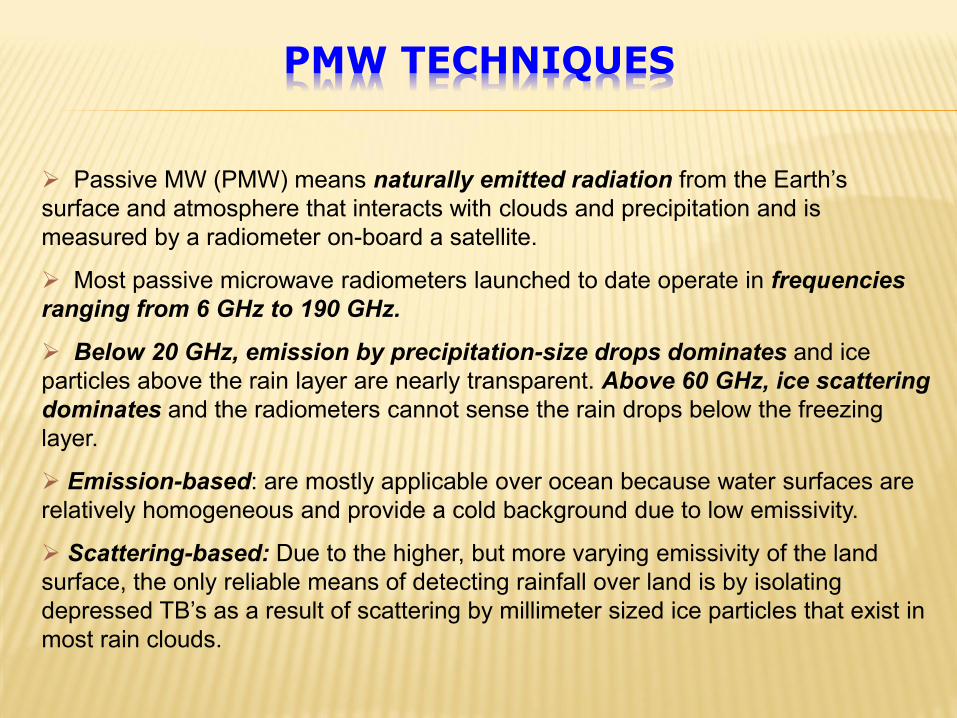
Passive MW (PMW) means naturally emitted radiation from the Earth’s surface and atmosphere that interacts with clouds and precipitation and is measured by a radiometer on-board a satellite.
Most passive microwave radiometers launched to date operate in frequencies
ranging from 6 GHz to 190 GHz.
Below 20 GHz, emission by precipitation-size drops dominates and ice particles above the rain layer are nearly transparent. Above 60 GHz, ice scattering
dominates and the radiometers cannot sense the rain drops below the freezing layer.
Emission-based: are mostly applicable over ocean because water surfaces are relatively homogeneous and provide a cold background due to low emissivity.
Scattering-based: Due to the higher, but more varying emissivity of the land surface, the only reliable means of detecting rainfall over land is by isolating depressed TB’s as a result of scattering by millimeter sized ice particles that exist in most rain clouds.
PMW TECHNIQUES
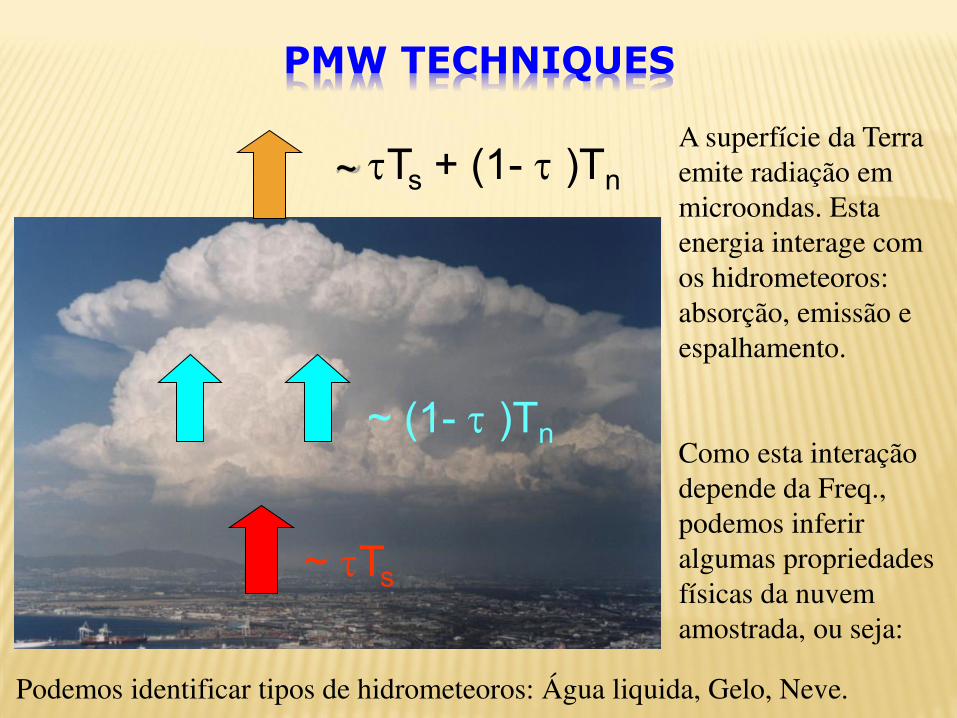
~ Ts
~ Ts + (1- )Tn
~ (1- )Tn
A superfície da Terra emite radiação em microondas. Esta energia interage com os hidrometeoros: absorção, emissão e espalhamento.
Como esta interação depende da Freq., podemos inferir algumas propriedades físicas da nuvem amostrada, ou seja:
Podemos identificar tipos de hidrometeoros: Água liquida, Gelo, Neve.
PMW TECHNIQUES
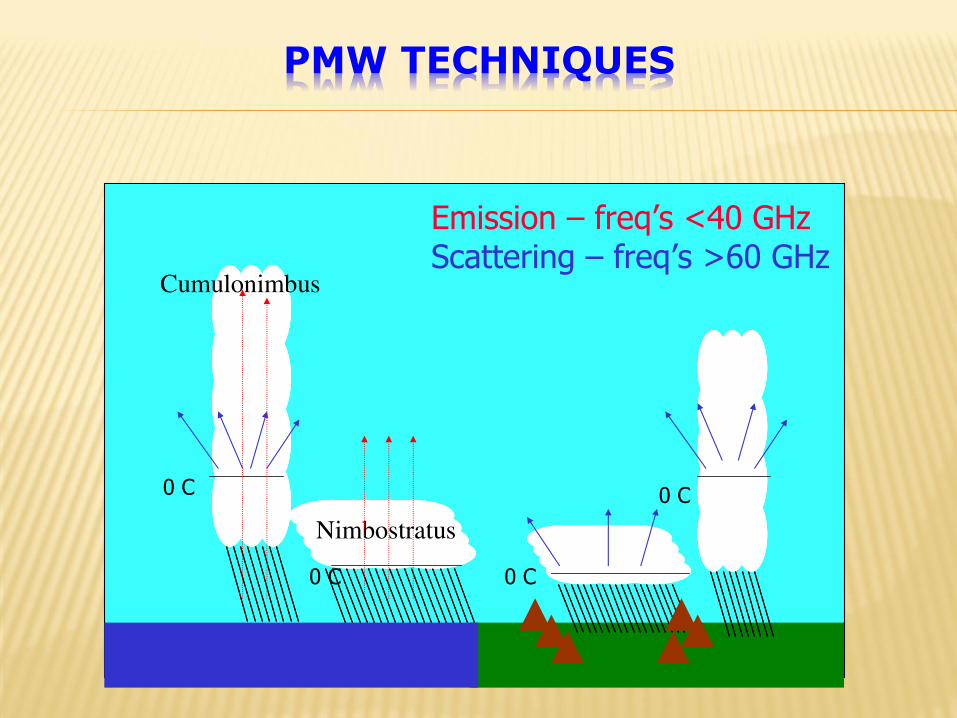
PMW TECHNIQUES
Nimbostratus
Cumulonimbus
0 C
0 C
0 C
0 C
Emission – freq’s <40 GHzScattering – freq’s >60 GHz
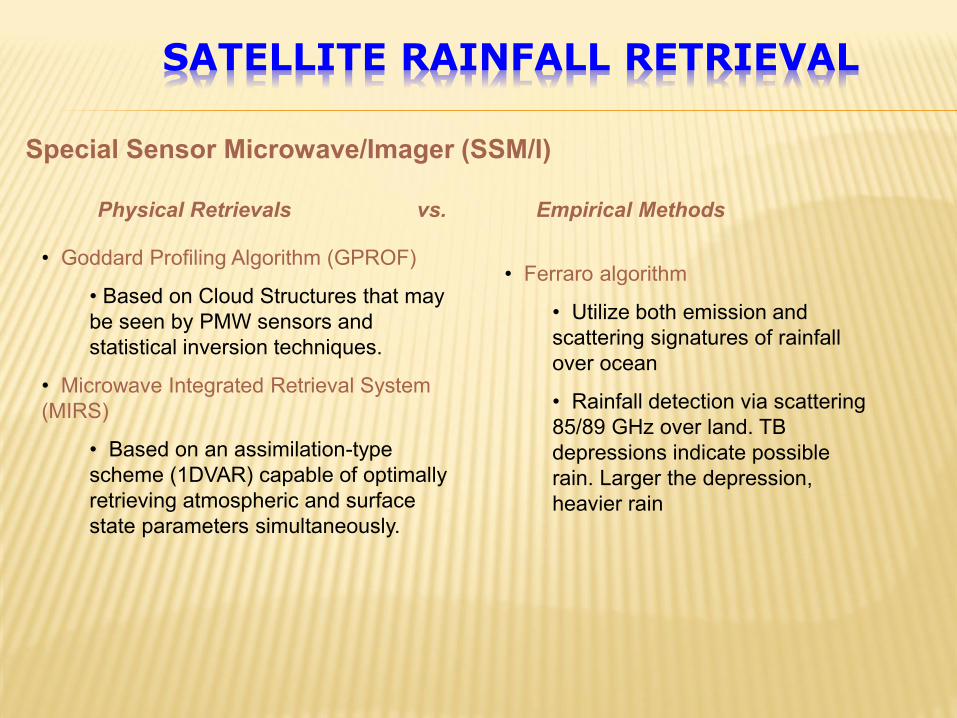
Special Sensor Microwave/Imager (SSM/I)
Physical Retrievals vs. Empirical Methods
• Goddard Profiling Algorithm (GPROF)
• Based on Cloud Structures that may be seen by PMW sensors and statistical inversion techniques.
• Microwave Integrated Retrieval System (MIRS)
• Based on an assimilation-type scheme (1DVAR) capable of optimally retrieving atmospheric and surface state parameters simultaneously.
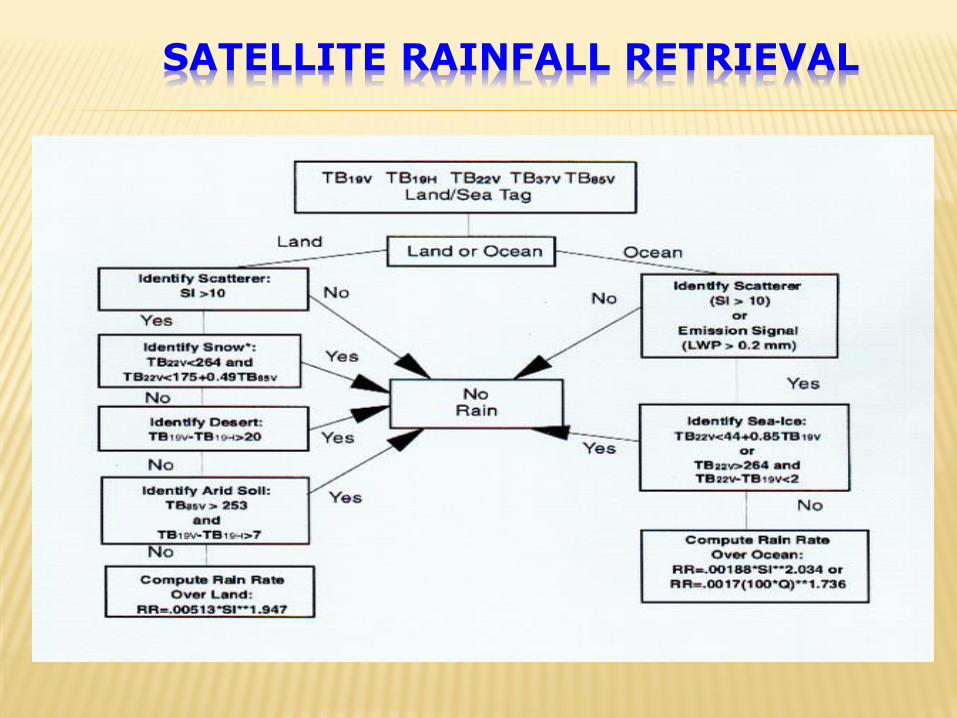
• Ferraro algorithm
• Utilize both emission and scattering signatures of rainfall over ocean
• Rainfall detection via scattering 85/89 GHz over land. TB depressions indicate possible rain. Larger the depression, heavier rain
SATELLITE RAINFALL RETRIEVAL
SATELLITE RAINFALL RETRIEVAL
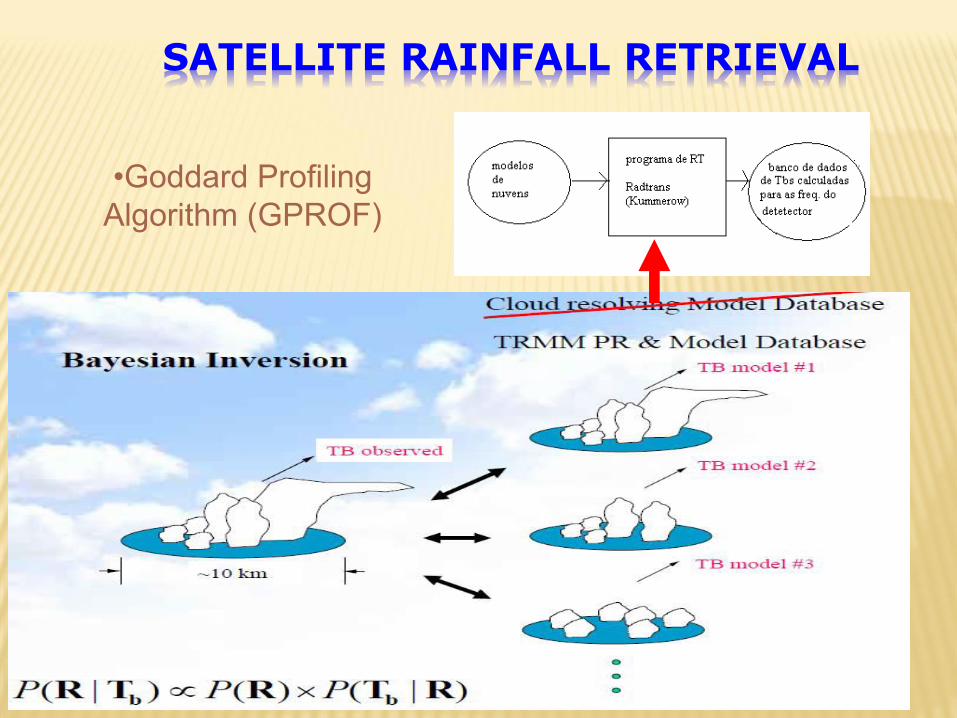
•Goddard Profiling
Algorithm (GPROF)
SATELLITE RAINFALL RETRIEVAL
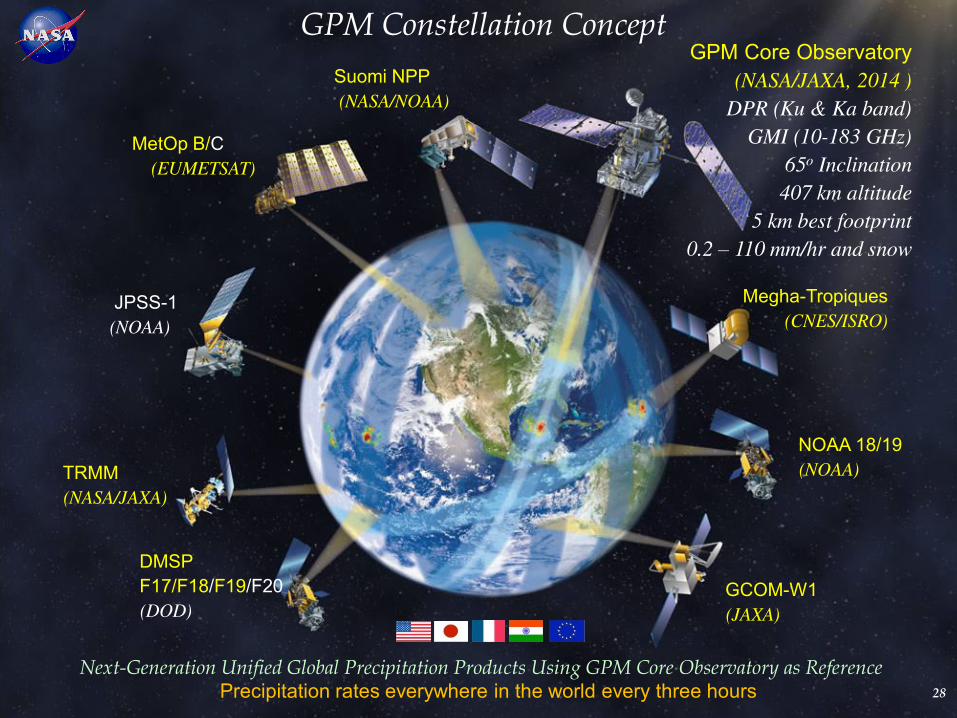
GPM Constellation Concept GPM Core Observatory
(NASA/JAXA, 2014 )
DPR (Ku & Ka band)
GMI (10-183 GHz)
65o Inclination
407 km altitude
5 km best footprint
0.2 – 110 mm/hr and snow
Suomi NPP
(NASA/NOAA)
MetOp B/C (EUMETSAT)
JPSS-1 (NOAA)
DMSP F17/F18/F19/F20 (DOD)
GCOM-W1
(JAXA)
NOAA 18/19
(NOAA)
Megha-Tropiques
(CNES/ISRO)
Next-Generation Unified Global Precipitation Products Using GPM Core Observatory as Reference Precipitation rates everywhere in the world every three hours 28
TRMM (NASA/JAXA)
29 Page
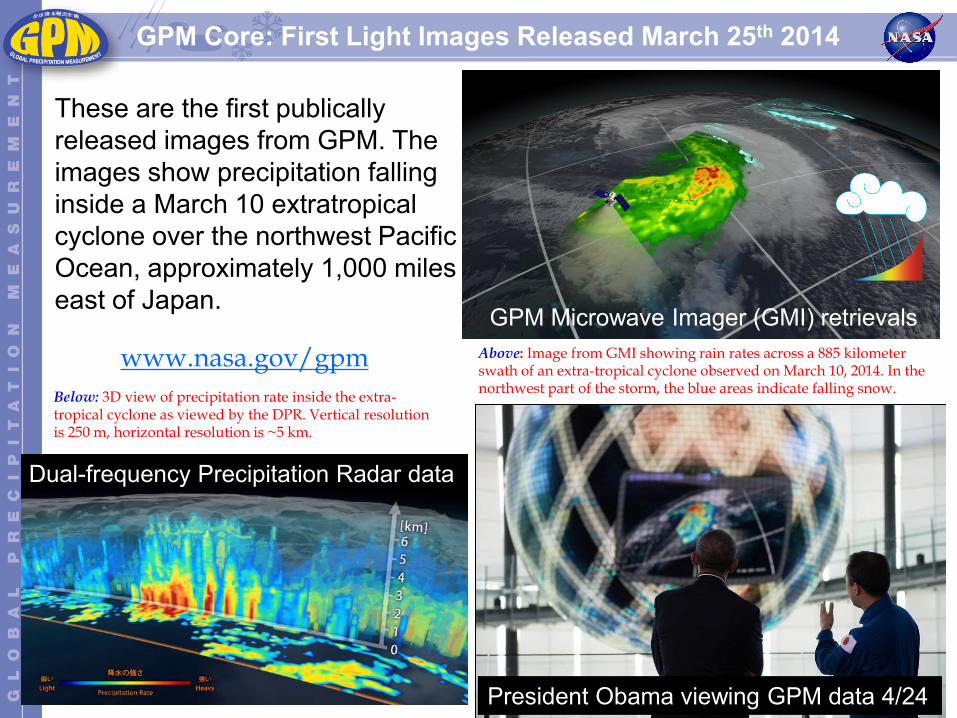
These are the first publically released images from GPM. The images show precipitation falling inside a March 10 extratropical cyclone over the northwest Pacific Ocean, approximately 1,000 miles east of Japan.
GPM Core: First Light Images Released March 25th 2014
Below: 3D view of precipitation rate inside the extra-tropical cyclone as viewed by the DPR. Vertical resolution is 250 m, horizontal resolution is ~5 km.
www.nasa.gov/gpm Above: Image from GMI showing rain rates across a 885 kilometer swath of an extra-tropical cyclone observed on March 10, 2014. In the northwest part of the storm, the blue areas indicate falling snow.
GPM Microwave Imager (GMI) retrievals
Dual-frequency Precipitation Radar data
President Obama viewing GPM data 4/24
30 Page
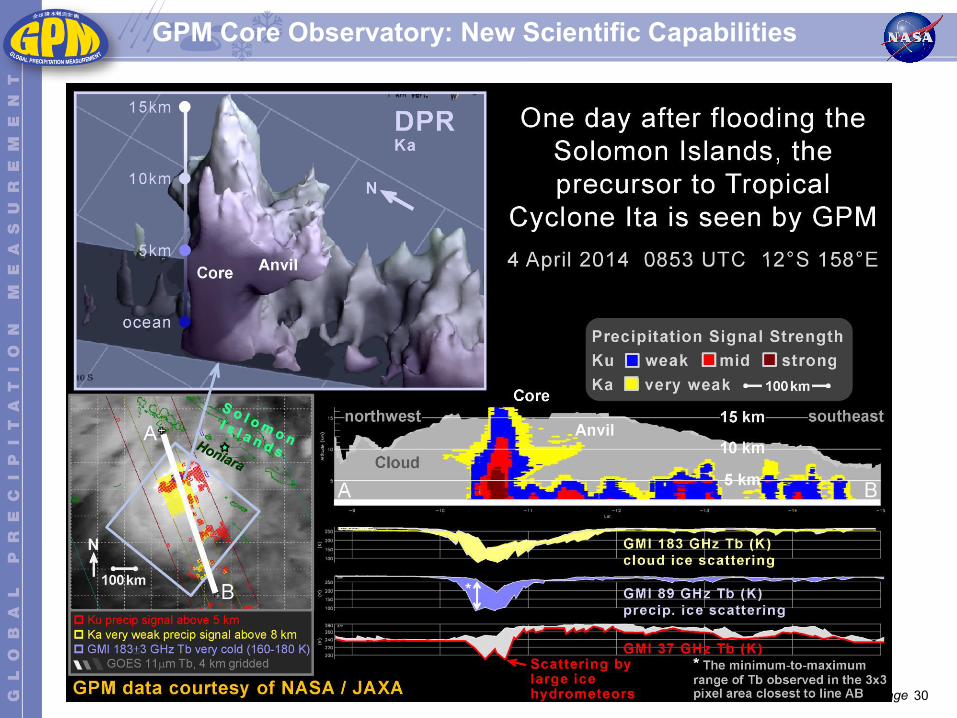
GPM Core Observatory: New Scientific Capabilities
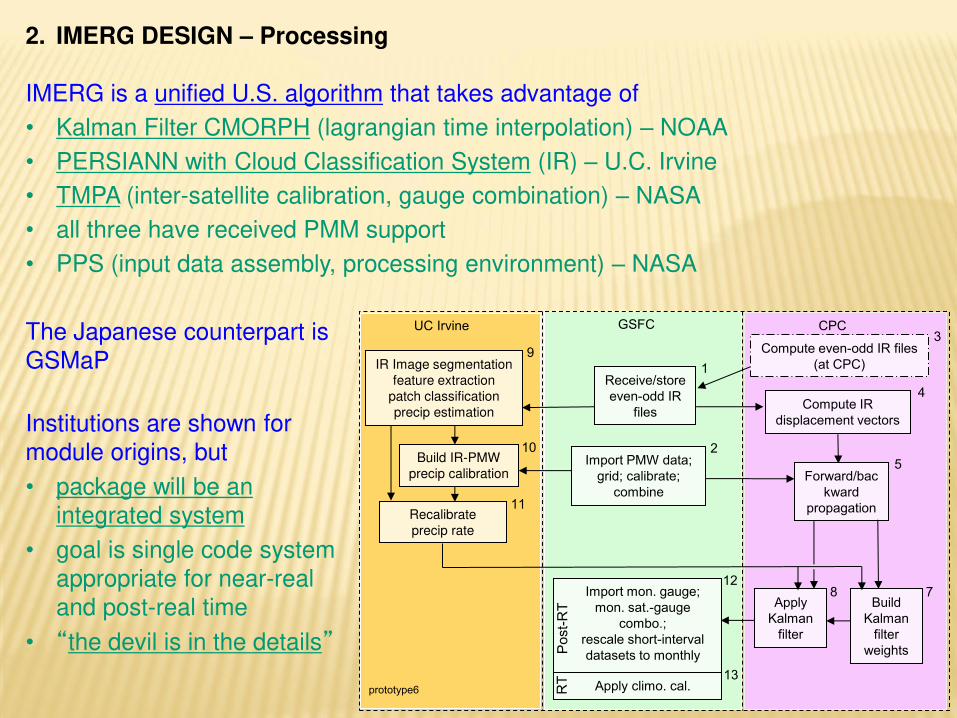
2. IMERG DESIGN – Processing
IMERG is a unified U.S. algorithm that takes advantage of
• Kalman Filter CMORPH (lagrangian time interpolation) – NOAA
• PERSIANN with Cloud Classification System (IR) – U.C. Irvine
• TMPA (inter-satellite calibration, gauge combination) – NASA
• all three have received PMM support
• PPS (input data assembly, processing environment) – NASA
The Japanese counterpart is
GSMaP
Institutions are shown for
module origins, but
• package will be an
integrated system
• goal is single code system
appropriate for near-real
and post-real time
• the devil is in the details
GSFC CPC UC Irvine
prototype6
Receive/store even-odd IR
files
1
Import PMW data; grid; calibrate;
combine
2
Compute even-odd IR files (at CPC)
3
Compute IR displacement vectors
4
Build IR-PMW
precip calibration
10
IR Image segmentation
feature extraction
patch classification
precip estimation
9
Apply Kalman
filter
8 Build
Kalman filter
weights
7
Forward/backward
propagation
5
Import mon. gauge; mon. sat.-gauge
combo.; rescale short-interval datasets to monthly
Apply climo. cal. RT
P
ost
-RT
13
12
11 Recalibrate
precip rate
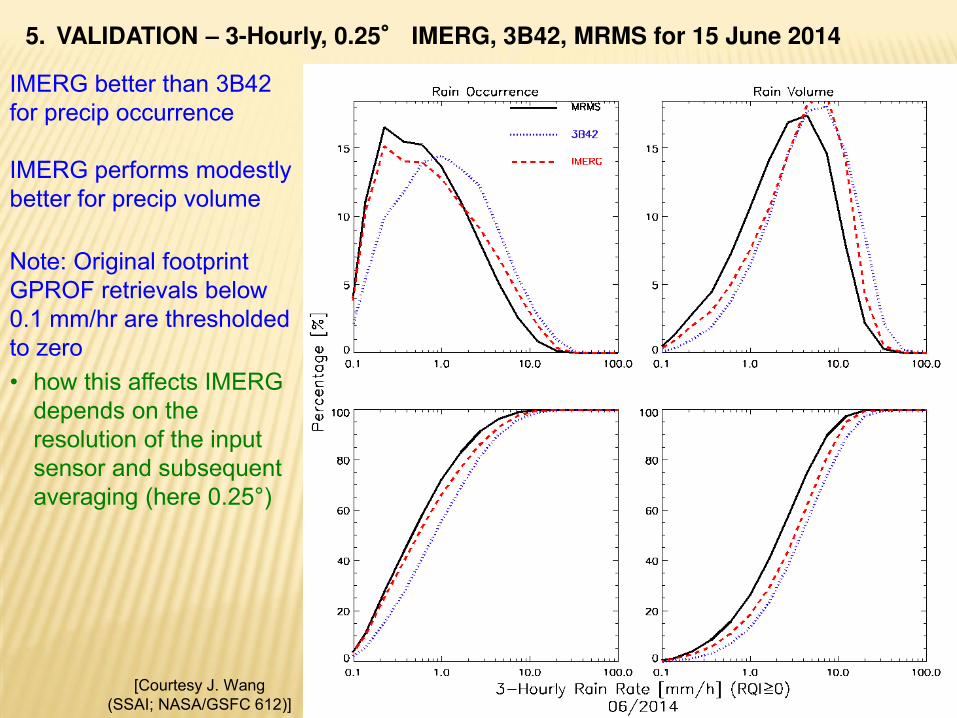
5. VALIDATION – 3-Hourly, 0.25° IMERG, 3B42, MRMS for 15 June 2014
IMERG better than 3B42 for precip occurrence IMERG performs modestly better for precip volume
Note: Original footprint GPROF retrievals below 0.1 mm/hr are thresholded to zero
• how this affects IMERG depends on the resolution of the input sensor and subsequent averaging (here 0.25°)
[Courtesy J. Wang (SSAI; NASA/GSFC 612)]