ESTIMATING THE SKILL STOCK IN PUNJAB
56
ESTIMATING THE SKILL STOCK IN PUNJAB Leveraging a household survey conducted by the Centre for Monitoring Indian Economy to understand the supply of skills in Punjab.
Transcript of ESTIMATING THE SKILL STOCK IN PUNJAB

ESTIMATING THE SKILL STOCK
IN PUNJAB
Leveraging a household survey conducted by the Centre for Monitoring
Indian Economy to understand the supply of skills in Punjab.


Table of Contents
A. Introduction
B. Consumer Pyramids Household Survey (CPHS): Survey Design
C. Executive Summary
D. Insights from the household survey
E. Annexure: Examples of how the stock of skills is defined / measured in different countries 31
Tables 34
I. Overview of Punjab's Labour market 7
II. Formal Vocational Training 10
1. Access to formal vocational training 10
2. Duration of course 13
3. Benefits of formal vocational training 17
III. Informally Skilled and Employed 21
1. Years of experience and source of skill acquisition 23
2. Awareness about formal skill development programs 24
3. Willingness to enroll in formal skill development programs 24
IV. Informally Skilled and Not Employed 25
1. Source of skill acquisition 26
2. Awareness about formal skill development programs 26
3. Willingness to enroll in formal skill development programs 27
V. Not Skilled and Not Employed 29
1. Awareness about formal skill development programs 30
2. Willingness to enroll in formal skill development programs 30
4
5
6
7

A. Introduction
The Centre for Monitoring Indian Economy (CMIE) periodically conducts household surveys, known as the Consumer
Pyramids Household Survey (CPHS), across India to generate estimates of income, expenses, savings, borrowings,
investments and ownership of assets of households. It also provides estimates of the age, gender, education,
occupation, health and financial inclusion of individuals.
To study the supply of skills in India, the National Skill Development Corporation (NSDC) collaborated with CMIE and
added skills-related questions in the 13th round of its CPHS conducted in January-April 2018. The objective was to gain a
better understanding of the stock of skills existing in India, type of training programs that are taken up, benefits of
formal training, source of skill acquisition for working persons, awareness about and willingness to enroll in formal
training programs, among others.
The guiding principle used to understand skills is the following definition stated by the National Sample Survey
Organization (NSSO):
Additionally, the NSSO notes that the primary objective of vocational education and training is to 'prepare persons,
especially the youth, for the world of work and make them employable for a broad range of occupations in various
industries and economic sectors or enable access opportunities of self-employment'. A similar observation has been
made in National Industrial Classification (NIC)-2008 – 'technical and vocational secondary education include programs
that emphasize subject-matter specialization and instruction in both theoretical background and practical skills,
generally associated with present or prospective employment'.
The NSSO also conducts household-based Employment Unemployment Surveys (EUS) in India to provide estimates for
labour market indicators. The last quinquennial survey was undertaken in 2011-2012. Considering the need for more
frequent labour force statistics, the first Periodic Labour Force Survey (PLFS) was conducted over July 2017-June 2018.
While data on labour market indicators is available both from PLFS and CMIE, this report focuses only on descriptive
findings obtained from an analysis of CMIE data.
'Any marketable expertise, however acquired, irrespective of whether marketed or not, and whether the intention
is to market it or not, is considered as skill. Thus, a person holding a certificate/ diploma on an appropriate subject
will be considered to possess the specified skill along with persons who have acquired the said skill without any
such certificate/ diploma or even without attending any institution. When a person has acquired skill in more than
one trade, the skill in which he is more (most) proficient is considered as his skill.'
This report presents findings for the state of Punjab. Findings at an all-India level and for other states are also
available on request.
4
B. Consumer Pyramids Household Survey (CPHS):
All India Survey Design
1The panel of households in the Consumer Pyramids survey contains about 1,73,181 households . Each survey wave is
executed over four months ('round') and there are three rounds in a year. The data available with NSDC pertains to a
survey conducted in January-April 2018 of 1,33,869 households (4,38,258 individuals).
The survey is conducted by visiting the panel of households and interviewing members of the household. Data is
captured on a mobile phone on a specially developed software application. The survey is conducted across the country,
except in – Arunachal Pradesh, Nagaland, Manipur, Mizoram, Andaman & Nicobar Islands, Lakshadweep, Dadra &
Nagar Haveli, Daman & Diu. A stratified multi-stage survey design was used by CMIE to draw its sample of households.
The Primary Sampling Units (PSUs) were the villages and towns of the 2011 Census. The Ultimate Sampling Units (USUs)
were the households from these PSUs.
The broadest level of strata for sampling purpose was the Homogeneous Region (HR), which is a set of neighbouring
districts that have similar agro-climatic conditions, urbanization levels and female literacy. HRs are also approximately
of the same size, except in the North East, where the entire set of states is considered as one HR.
Within each HR, two strata were formed – a rural stratum comprising all villages and an urban stratum comprising all
towns. Towns within a HR were stratified further based on the number of households in 2011, as follows:
1. Very large towns had more than 200,000 households
2. Large towns had between 60,000 and 200,000 households
3. Medium sized households had between 20,000 and 60,000 households
4. Those with less than 20,000 households were the small towns
One or more towns were randomly selected from each of these categories, with a total of 329 towns. From each of these
towns, on an average 21 Census Enumeration Blocks (CEB) were randomly selected. A CEB is a cluster of about 100-125
neighbouring households. Households were then selected through a process of systematic random sampling from
each of the CEBs. A total of 7890 CEBs and 110615 urban households were selected through this process.
The rural sample selection is also a two-staged sampling process. Villages were selected through simple random
sampling process. Households were selected from these through a process of systematic random sampling. Rural India
is surveyed in 102 HRs. The rural sample comprises 62,566 households from 3,911 villages.
The survey was conducted for the sample of households and individuals, as per the survey design. Survey weights were
applied to derive population-level estimates that are mentioned in the sections below.
1https://consumerpyramidsdx.cmie.com/kommon/bin/sr.php?kall=wtabnav&tab=4000&type=9100&sid=9100
5

C. Executive Summary
Punjab's population (aged 15 years and above) is 239.18 lakh, of which 103.16 lakh (43%) persons are in the labour force
(persons who are either working or willing to work and actively looking for work). Female labour force participation rate
in the state is 6% compared to, 74% for males. Unemployment rate in the state is 8.5%.
64% of the state's labour force is in rural areas. 64% of all employed persons are working in rural areas and 66% in non-
agriculture occupations. Among employed persons, 31% earn Rs. 20,000 or lower and 24% earn between
Rs. 20,001-50,000.
1.5693 lakh persons (1% of population aged 15 years and above) have received or are undergoing formal vocational
training, of whom 1.06 lakh are 15-30 years of age. Females constitute 52.62% (0.8258 lakh) of the formally trained
segment. 72% of this segment took up short-term training courses and 62%, paid training. 75% (1.174 lakh) persons are
in the labour force - of whom, 0.696 lakh (59%) are employed. Among the employed, formally trained persons, 99% are
working in non-agriculture occupations. 14.37% earn Rs. 20000 or lower and 37.83% earn between Rs. 20,001-50,000.
94.1 lakh persons (39% of the state's population aged 15 years and above) have informally acquired skills. As source of
skill acquisition, 29% reported Hereditary, 23% On the job learning, 41% Self-learning and 7% other sources. Among the
employed, informally skilled persons, 65% (60.71 lakh) are working in non-agriculture occupations. 31% earn Rs. 20,000
or lower and 24% earn between Rs. 20,001-50,000. 74% have work experience of more than 10 years.
38.77 lakh informally skilled persons are aware of formal skill development programs. 12.96 lakh are willing to enroll for
formal programs, of whom 1.36 lakh would like to enroll if the training is free/sponsored, 10.76 lakh if it is subsidized
and 0.85 lakh even if they have to pay. 2.585 lakh are willing to enroll in short-term programs and 0.428 lakh in long-
term. There are 1.303 lakh persons who are willing to enroll in formal programs and the duration of training does not
matter for them.
142.65 lakh persons (59.64% of population aged 15 years and above) in the state do not possess any skill and are not
employed (unemployed or not in labour force). Females constitute 72.82% (103.88 lakh) of this segment. 60% reside in
rural areas. Within this segment, 49.707 lakh are aware of formal skill development programs of whom, 22.001 lakh
(44%) are 15-30 years of age and 35.672 lakh (72%) are females. Among those who are willing to enroll in formal training,
63% reported- Yes, if they are subsidised and 50% reported preferred training duration - Do not know.
6

D. Insights from the household survey
I. Overview of Punjab's Labour market
Figure 1
Figure 2
64% of the labour force in the state resides in rural areas (68% of India's labour force resides in rural areas).
Population of persons aged 15 years and above in Punjab is 239.18 lakhs. There are 103.16 lakhs persons in the labour
force (persons who are either working or willing to work and actively looking for work). 8.5% of the state's labour force is
unemployed. 97% of the unemployed are in the age-group of 15-30 years. (5.9% of India's labour force is unemployed;
90% of the unemployed are in the age-group of 15-30 years)
Female labour force participation rate in the state is 6% (All-India Female labour force participation rate is 11.7%).
7

61.96 lakh (66%) persons are working in non-agriculture occupations and 32.42 lakh in agriculture (65% of all employed
persons in India, are working in non-agricultural occupations).
Figure 3
Out of all persons aged 15 years and above, 66% are 10th Std & Below /Not Educated, 19% are 11th to 12th Std and 15%
are Graduate & above.
Figure 4
8

Figure 5
64% of all employed persons in the state are working in rural areas.
Among the employed persons in the state, 31% earn Rs. 20,000 or lower (All-India: 19%) and 24% earn between
Rs. 20,001-50,000 (All-India: 51%).
Among the employed males, 30% earn Rs. 20,000 or lower (All-India: 16%), and 23% earn between Rs. 20,001-50,000
(All-India: 53%). Among the employed females in the state, 21% earn Rs. 20,000 or lower (All-India: 50%) and 35% earn
between Rs. 20,001-50,000 (All-India: 37%).
In the following sections, respondents are classified into four categories (in line with the approach adopted in the survey
questionnaire for capturing skill stock): Formally Vocationally Trained, Informally Skilled and Employed, Informally
Skilled and Not Employed; Not Skilled and Not Employed. The characteristics of each category of persons are described,
giving population estimates that are derived using survey weights.
Figure 6
9

II. Formal Vocational Training
2
certificates, diplomas or degrees, recognized by State/Central Government, Public Sector and other reputed concerns.
Formal vocational training: Follows a structured training program (prescribed syllabus and curriculum; specified duration; eligibility in terms of education and age) and leads to
Figure 7
Figure 8
1. Access to formal vocational training
1.57 lakh persons (1% of population aged 15 years and above) are estimated to have received or are undergoing 2formal vocational training (All-India: 2.16 crore, 2.2% of population aged 15 years and above). There are 1.06 lakh
formally trained persons who are 15-30 years of age and 0.27 lakh 31-40 years of age. There are 0.83 lakh formally
trained females (53% of all formally trained persons).
47% of formally trained persons in the state reside in rural areas (54.7% of all formally trained persons in India, reside in
rural areas).
Out of all persons aged 15 years and above who received formal vocational training, 26.4% are 10th Std & Below, 39.7% are 11th to 12th Std and 33.9% are Graduate & above (at all-India level, 35% are 10th Std & Below/Not Educated, 26% are 11th to 12th Std and 38.9% are Graduate & above).
10
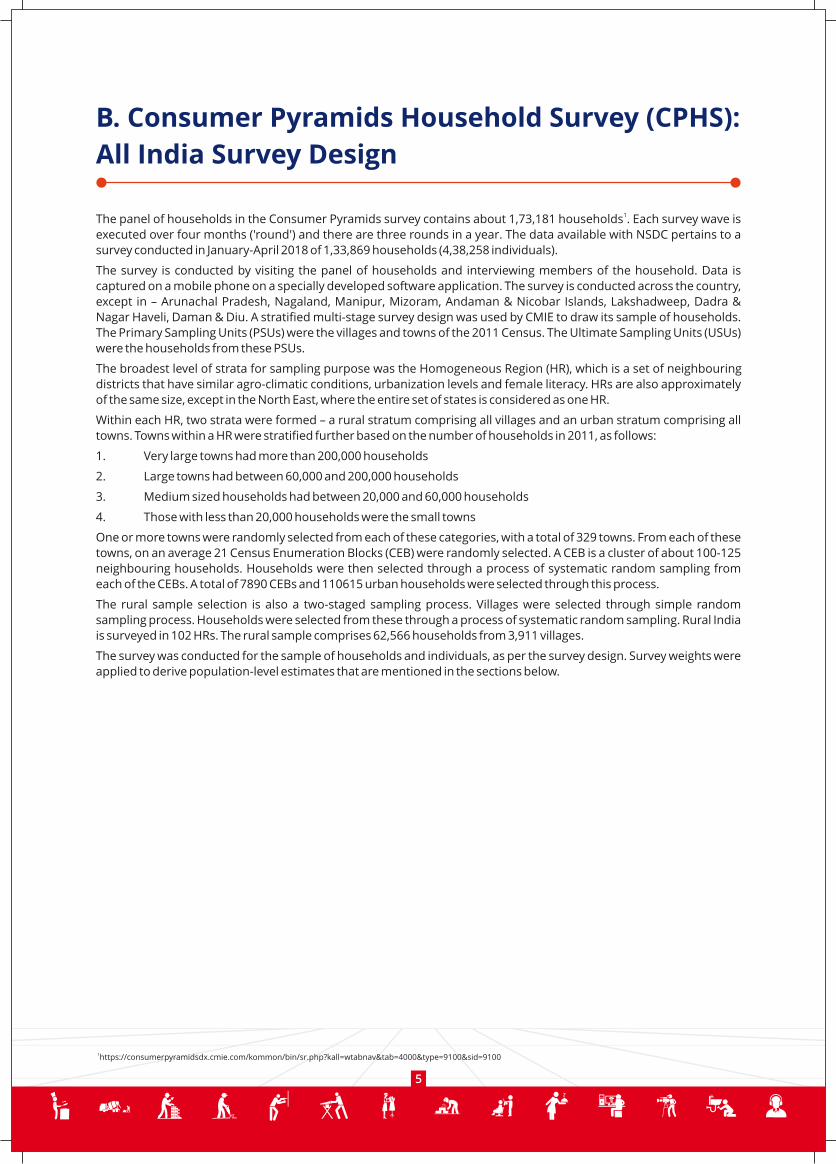
Number of formally trained persons aged 15 years and above in Punjab is 1.57 lakhs. Among the formally trained
persons, there are 1.174 lakh persons in the labour force (persons who are either working or willing to work and actively
looking for work).
40.74% of this labour force is unemployed (11% of the formally trained labour force in India, are unemployed). 81.5% of the
unemployed are in the age-group of 21-30 years. (All India:73% of the unemployed are in the age-group of 21-30 years).
Female labour force participation rate among the formally trained is 64% in Punjab (All-India female labour force
participation rate for formally trained females is 58%).
Figure 9
Among the employed persons who have received formal vocational training in the state, 14% earn Rs. 20000 or lower
(All-India: 8%) and 38% earn between Rs. 20,001-50,000 (All-India: 37%).
Among the employed males who have received formal vocational training in the state, 14.8% earn Rs. 20000 or lower
(All-India: 5%) and 31.1% earn between Rs. 20,001-50,000 (All-India: 33%). Among the employed females who have
received formal vocational training in the state, 13% earn Rs. 20000 or lower (All-India: 14%) and 58% earn between
Rs. 20,001-50,000 (All-India: 57%).
Figure 10
11
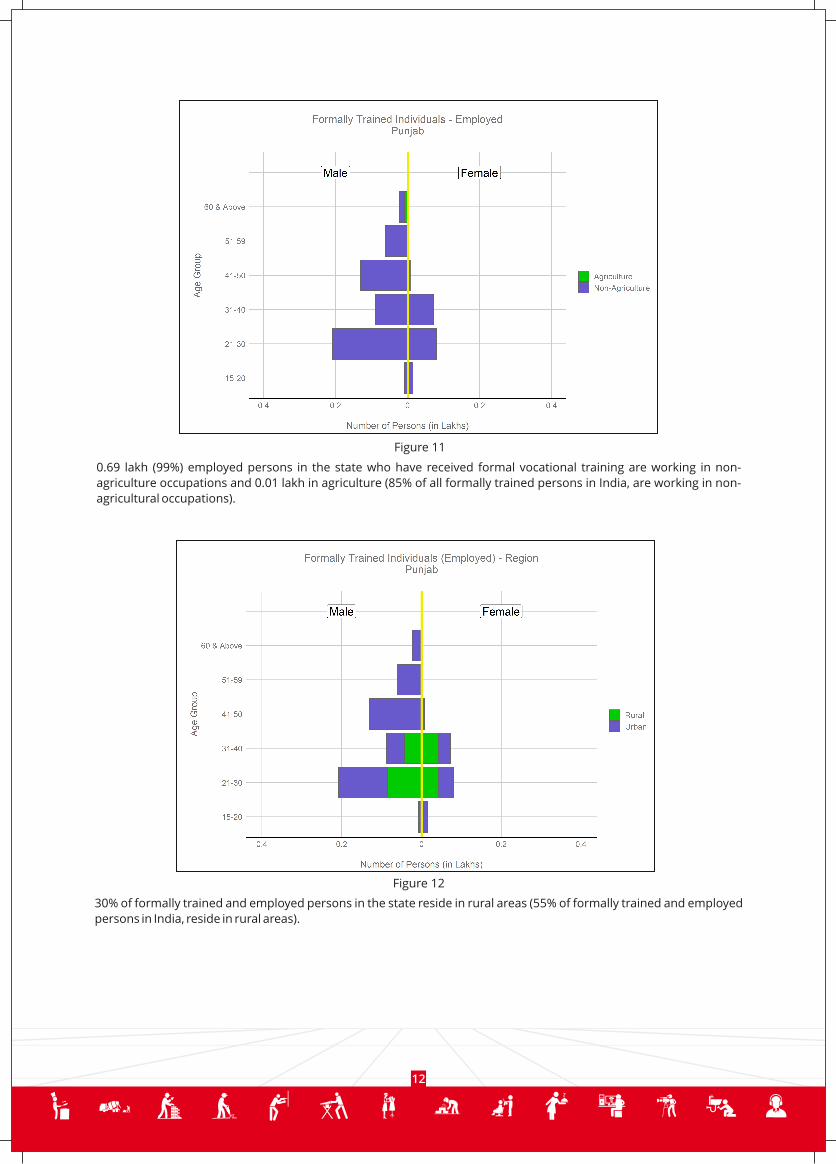
Figure 11
Figure 12
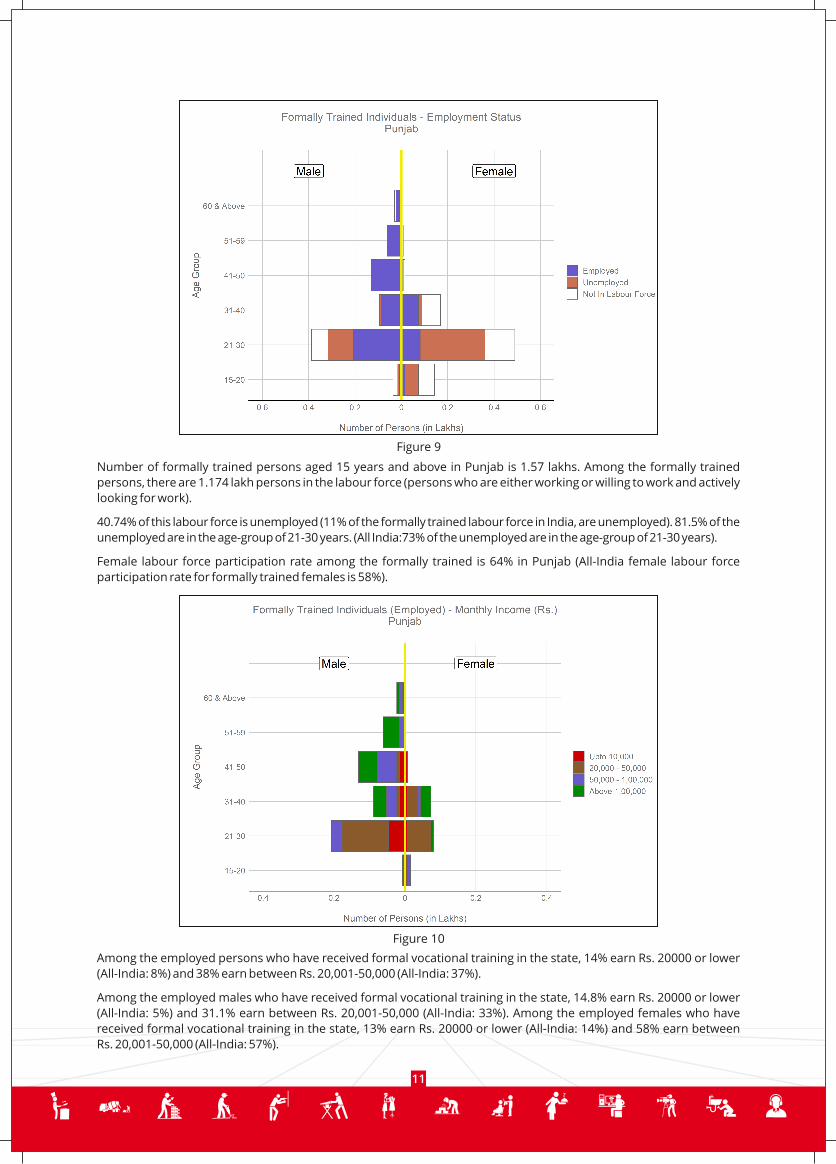
0.69 lakh (99%) employed persons in the state who have received formal vocational training are working in non-
agriculture occupations and 0.01 lakh in agriculture (85% of all formally trained persons in India, are working in non-
agricultural occupations).
30% of formally trained and employed persons in the state reside in rural areas (55% of formally trained and employed
persons in India, reside in rural areas).
12

2. Duration of course
72% of formally trained persons in the state took up short-term training (69% of all formally trained persons in
India, took up short- term training).
Figure 13
Figure 14
62% of formally trained persons in the state took up paid training (56% of all formally trained persons in India, took up-
paid training).
13

50% of formally trained persons who took up short-term training in the state resides in rural areas (All-India: 54% of all
formally trained persons in India, who took up short-term training, reside in- rural areas).
Figure 15
Figure 16
Out of all persons aged 15 years and above who received short-term formal vocational training: 26.8% are 10th Std & Below, 46% are 11th to 12th Std and 27.2% are Graduate & above (At all-India level: 38% are 10th Std & Below/Not Educated, 27.2% are 11th to 12th Std, 34.7% are Graduate & above).
14
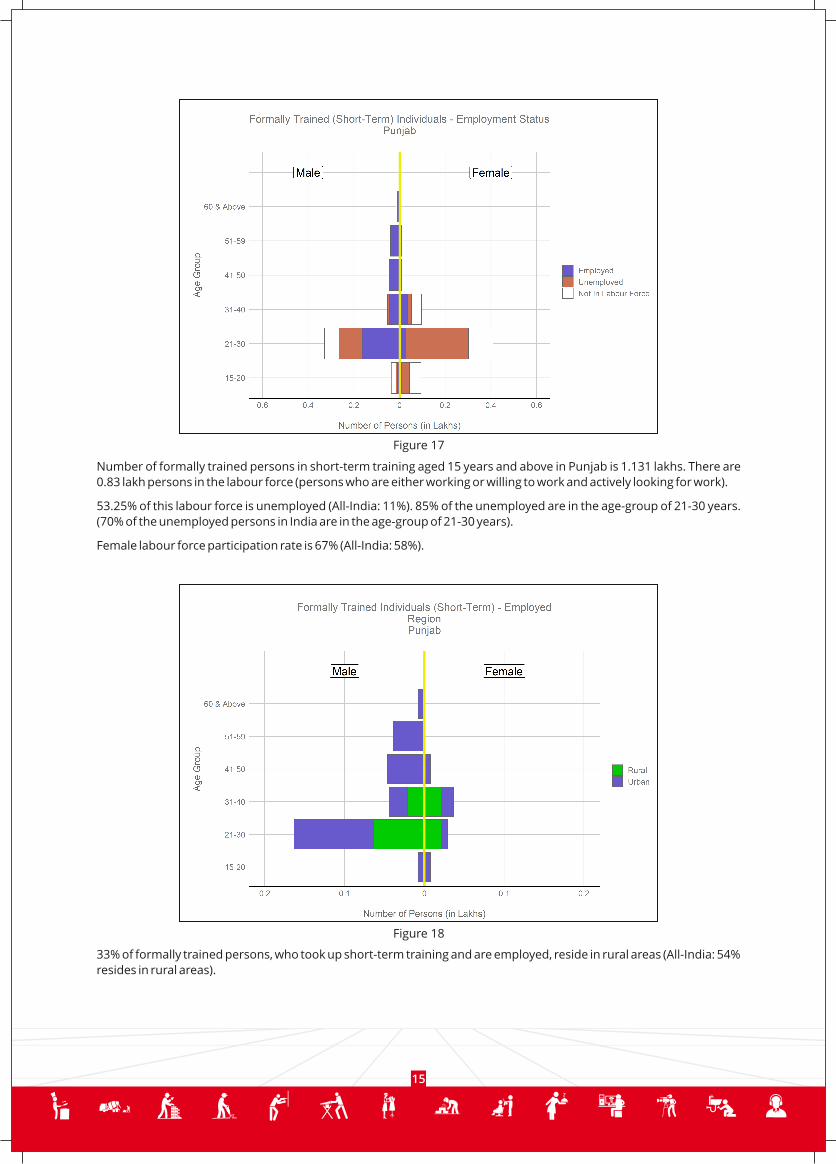
Figure 17
Number of formally trained persons in short-term training aged 15 years and above in Punjab is 1.131 lakhs. There are
0.83 lakh persons in the labour force (persons who are either working or willing to work and actively looking for work).
53.25% of this labour force is unemployed (All-India: 11%). 85% of the unemployed are in the age-group of 21-30 years.
(70% of the unemployed persons in India are in the age-group of 21-30 years).
Female labour force participation rate is 67% (All-India: 58%).
Figure 18
33% of formally trained persons, who took up short-term training and are employed, reside in rural areas (All-India: 54%
resides in rural areas).
15

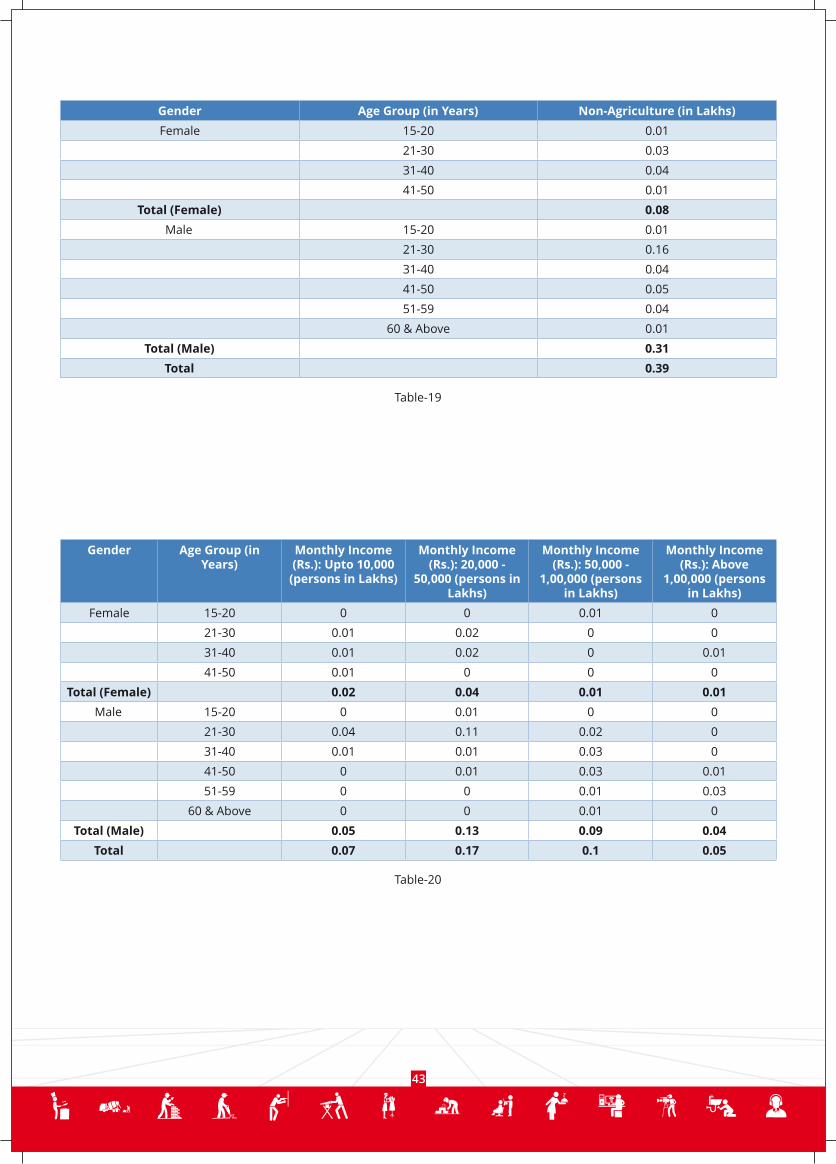
Figure 19
100% (0.39 lakh) of employed persons who are formally trained in short-term trainings, are working in non-agriculture
occupations (All-India: 85% are working in non-agricultural occupations).
Figure 20
Among the employed persons who have received short-term formal vocational training in the state, 18% earn
Rs. 20,000 or lower (All-India: 7%) and 45% earn between Rs. 20,001-50,000 (All-India: 38%).
Among the employed males who have received short-term formal vocational training in the state, 15% earn Rs. 20,000
or lower (All-India: 5%) and 43.1% earn between Rs. 20,001-50,000 (All-India: 34%). Among the employed females who
have received short-term formal vocational training in the state, 29% earn Rs. 20,000 or lower (All-India: 16%) and 52%
earn between Rs. 20,001-50,000 (All-India: 59%).
16
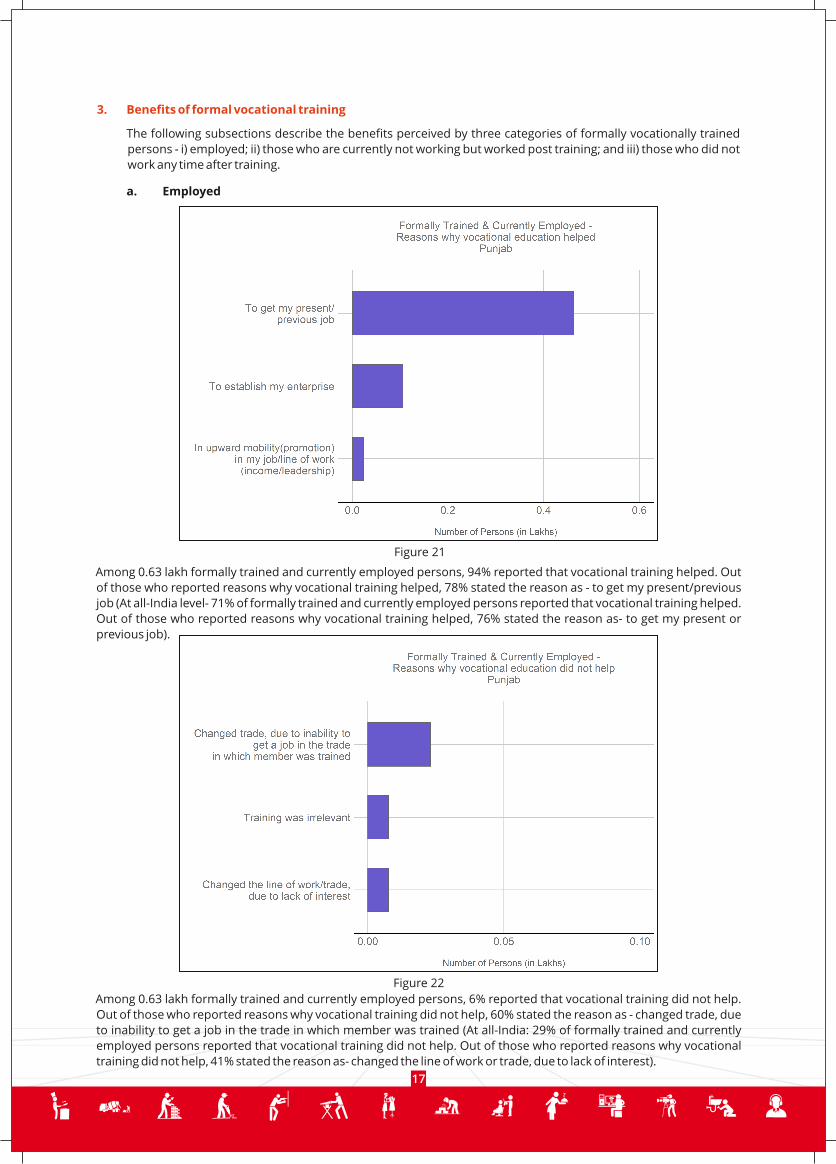
3. Benefits of formal vocational training
The following subsections describe the benefits perceived by three categories of formally vocationally trained
persons - i) employed; ii) those who are currently not working but worked post training; and iii) those who did not
work any time after training.
a. Employed
Figure 21
Figure 22
Among 0.63 lakh formally trained and currently employed persons, 94% reported that vocational training helped. Out
of those who reported reasons why vocational training helped, 78% stated the reason as - to get my present/previous
job (At all-India level- 71% of formally trained and currently employed persons reported that vocational training helped.
Out of those who reported reasons why vocational training helped, 76% stated the reason as- to get my present or
previous job).
Among 0.63 lakh formally trained and currently employed persons, 6% reported that vocational training did not help.
Out of those who reported reasons why vocational training did not help, 60% stated the reason as - changed trade, due
to inability to get a job in the trade in which member was trained (At all-India: 29% of formally trained and currently
employed persons reported that vocational training did not help. Out of those who reported reasons why vocational
training did not help, 41% stated the reason as- changed the line of work or trade, due to lack of interest).
17
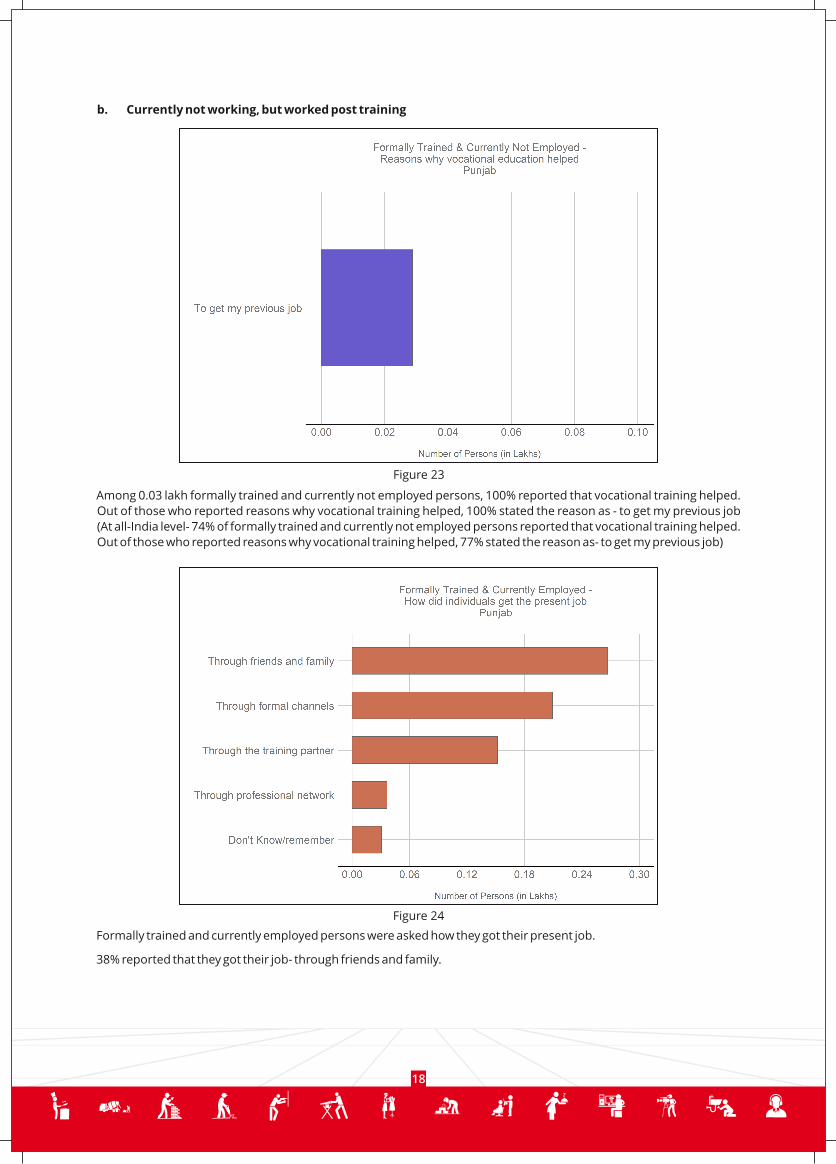
b. Currently not working, but worked post training
Figure 23
Among 0.03 lakh formally trained and currently not employed persons, 100% reported that vocational training helped.
Out of those who reported reasons why vocational training helped, 100% stated the reason as - to get my previous job
(At all-India level- 74% of formally trained and currently not employed persons reported that vocational training helped.
Out of those who reported reasons why vocational training helped, 77% stated the reason as- to get my previous job)
Formally trained and currently employed persons were asked how they got their present job.
38% reported that they got their job- through friends and family.
Figure 24
18

Those who got a job after training but are currently not working, were asked how they got their previous job. 73%
reported that they got their previous job- through friends and family.
Figure 25
19

c. Not worked any time post training
Formally trained persons, who did not work any time after training, were asked the reason for not taking up
employment. 85% reported the reason as -did not get a job.
Figure 26
20
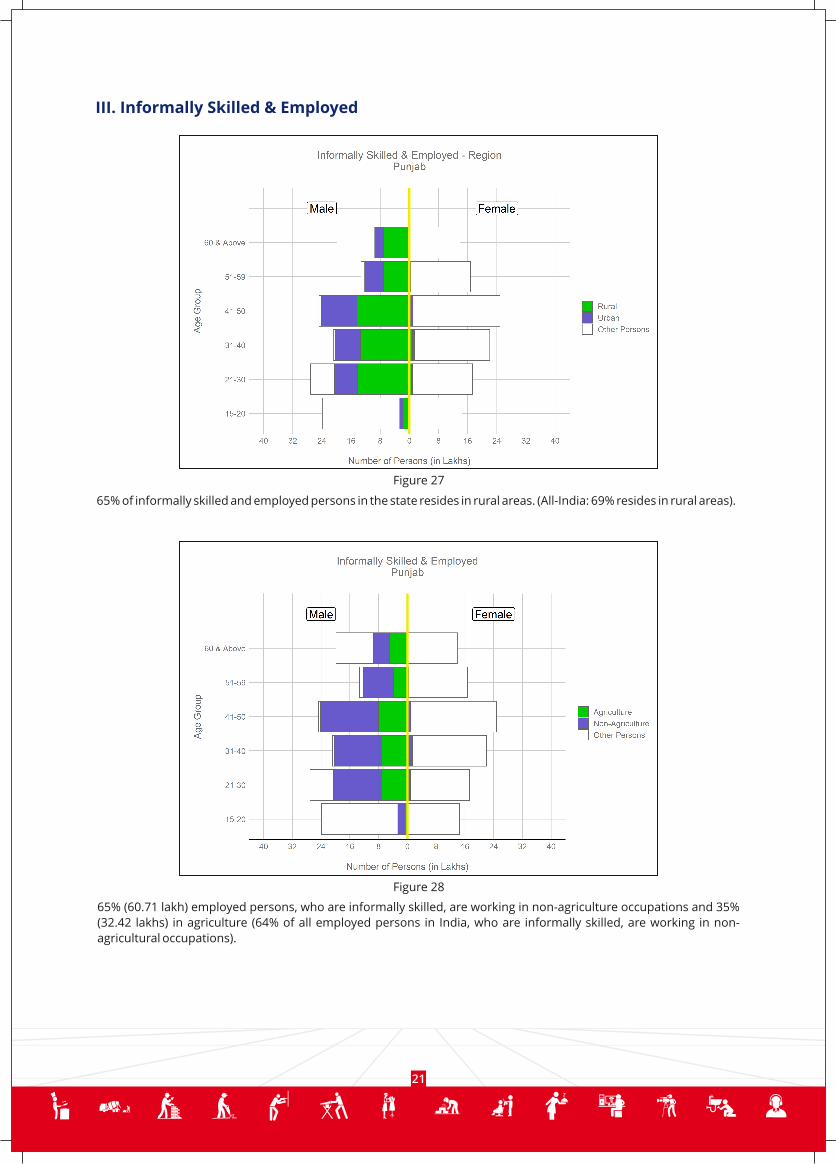
Figure 27
65% of informally skilled and employed persons in the state resides in rural areas. (All-India: 69% resides in rural areas).
Figure 28
65% (60.71 lakh) employed persons, who are informally skilled, are working in non-agriculture occupations and 35%
(32.42 lakhs) in agriculture (64% of all employed persons in India, who are informally skilled, are working in non-
agricultural occupations).
III. Informally Skilled & Employed
21
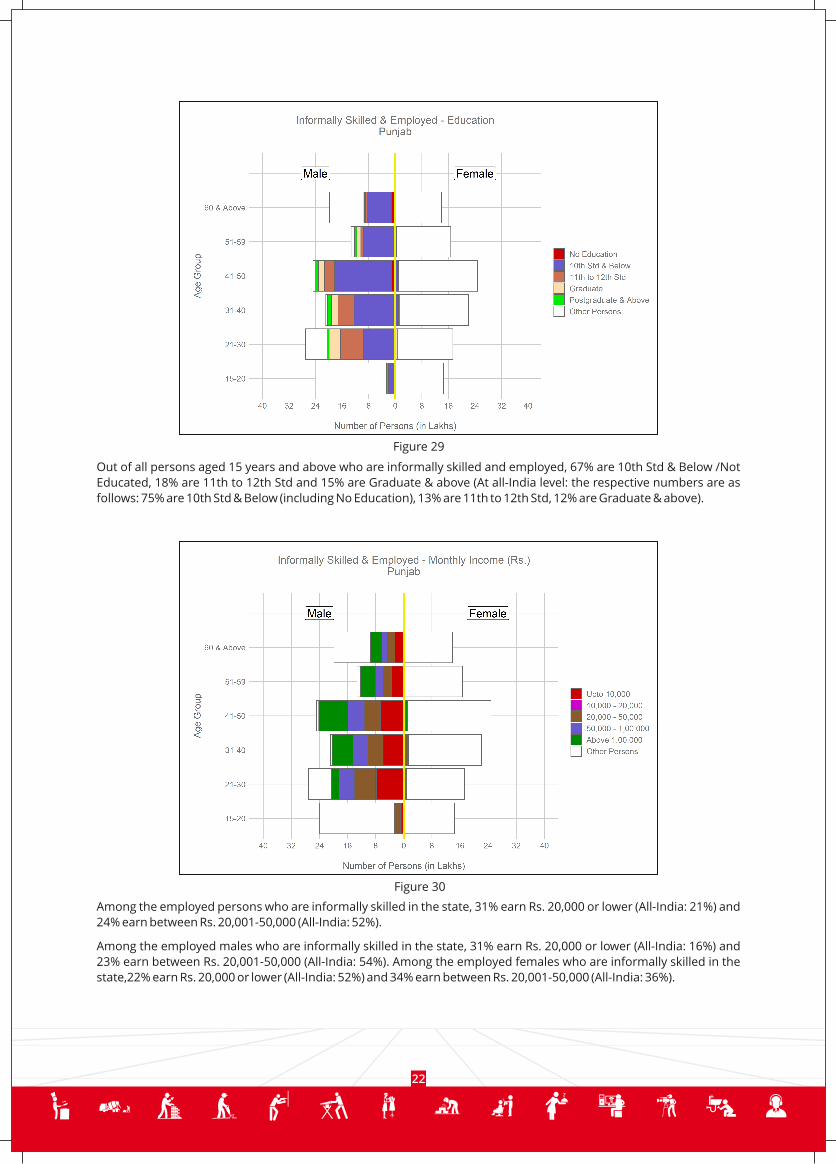
Out of all persons aged 15 years and above who are informally skilled and employed, 67% are 10th Std & Below /Not
Educated, 18% are 11th to 12th Std and 15% are Graduate & above (At all-India level: the respective numbers are as
follows: 75% are 10th Std & Below (including No Education), 13% are 11th to 12th Std, 12% are Graduate & above).
Figure 29
Figure 30
Among the employed persons who are informally skilled in the state, 31% earn Rs. 20,000 or lower (All-India: 21%) and
24% earn between Rs. 20,001-50,000 (All-India: 52%).
Among the employed males who are informally skilled in the state, 31% earn Rs. 20,000 or lower (All-India: 16%) and
23% earn between Rs. 20,001-50,000 (All-India: 54%). Among the employed females who are informally skilled in the
state,22% earn Rs. 20,000 or lower (All-India: 52%) and 34% earn between Rs. 20,001-50,000 (All-India: 36%).
22

1. Years of experience and source of skill acquisition
Figure 31
74% of informally skilled and employed persons in the state have work experience of- more than 10 years (67% of
informally skilled and employed persons in India, have work experience of- more than 10 years).
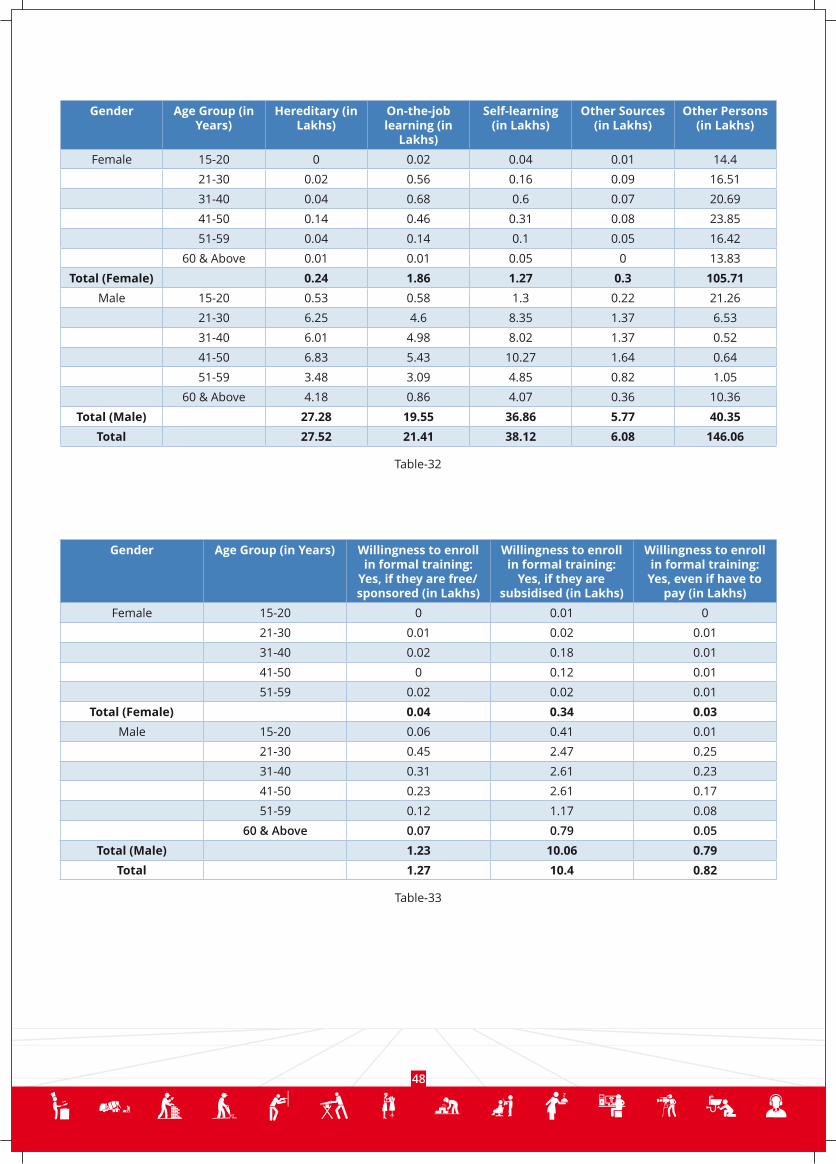
Figure 32
Informally skilled and employed persons were asked their source of skill acquisition.
330% reported 'Hereditary ', 23% acquired 'On the job learning', 41% through 'Self-learning' and 7% through
'Other sources'.
3Hereditary: Expertise for a vocation or trade acquired from other household members through gradual exposure; Self-learning: Expertise acquired by a person through his/her own
effort; Learning on the job: Expertise acquired by a person while in employment (current and/or past), either through informal training by the employer or organisation or through the
exposure to the job; Other: Expertise developed even from the household members, provided the said vocation or trade was different from the one relating to their ancestors
23
To understand the segment consisting of 'informally skilled and employed persons' better, consider the following
characteristics.

2. Awareness about formal skill development programs
3. Willingness to enroll in formal skill development programs
37.91 lakh informally skilled and employed persons are aware of formal skill development programs. 26.23 lakh
are working as farmers or managers or workers/labourers.
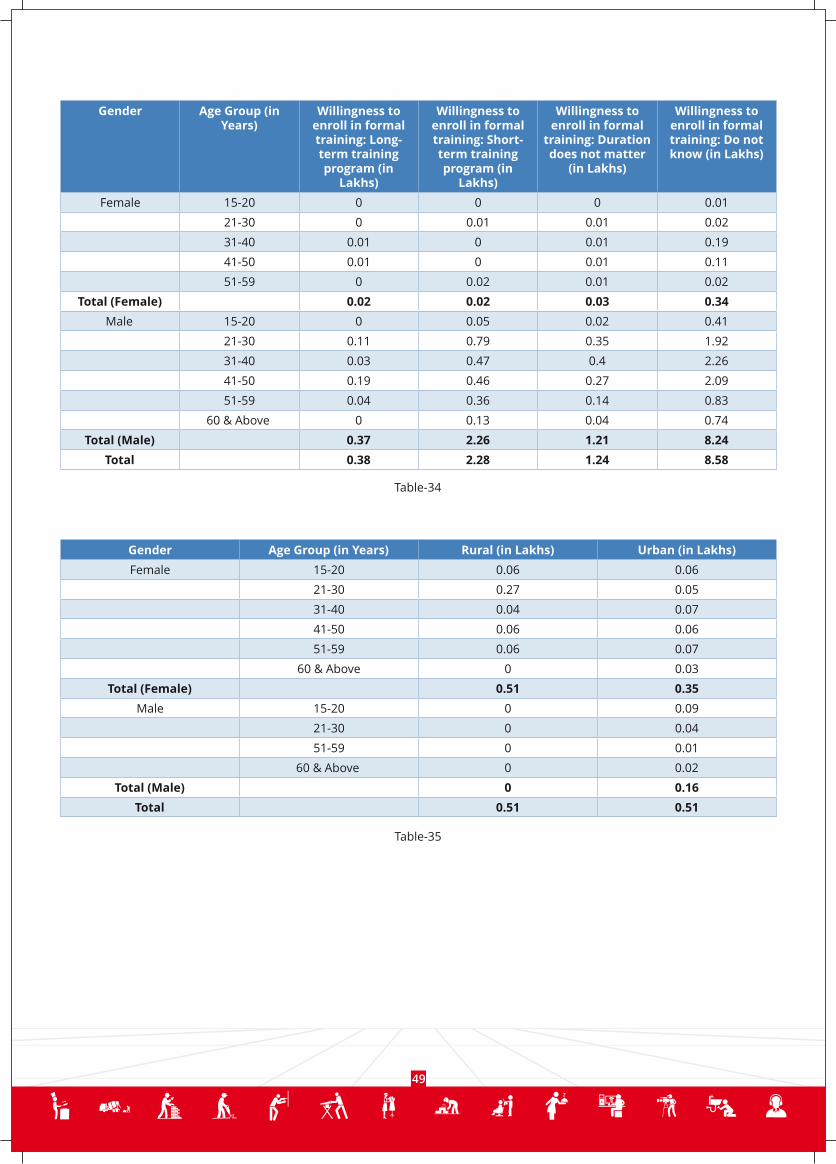
Informally skilled and employed persons who are willing to enroll in formal training were asked about their preferred
duration of training. 69% respondents reported- do not know.
Figure 33
Figure 34
Informally skilled and employed persons were asked their willingness to enroll in formal training. Out of those who said
Yes, 83% reported- Yes, if they are subsidised.
24

Figure 35
Figure 36
IV. Informally Skilled and Not Employed
50% of informally skilled and not employed persons in the state resides in rural areas (64% of informally skilled and not
employed persons in India, reside in rural areas).
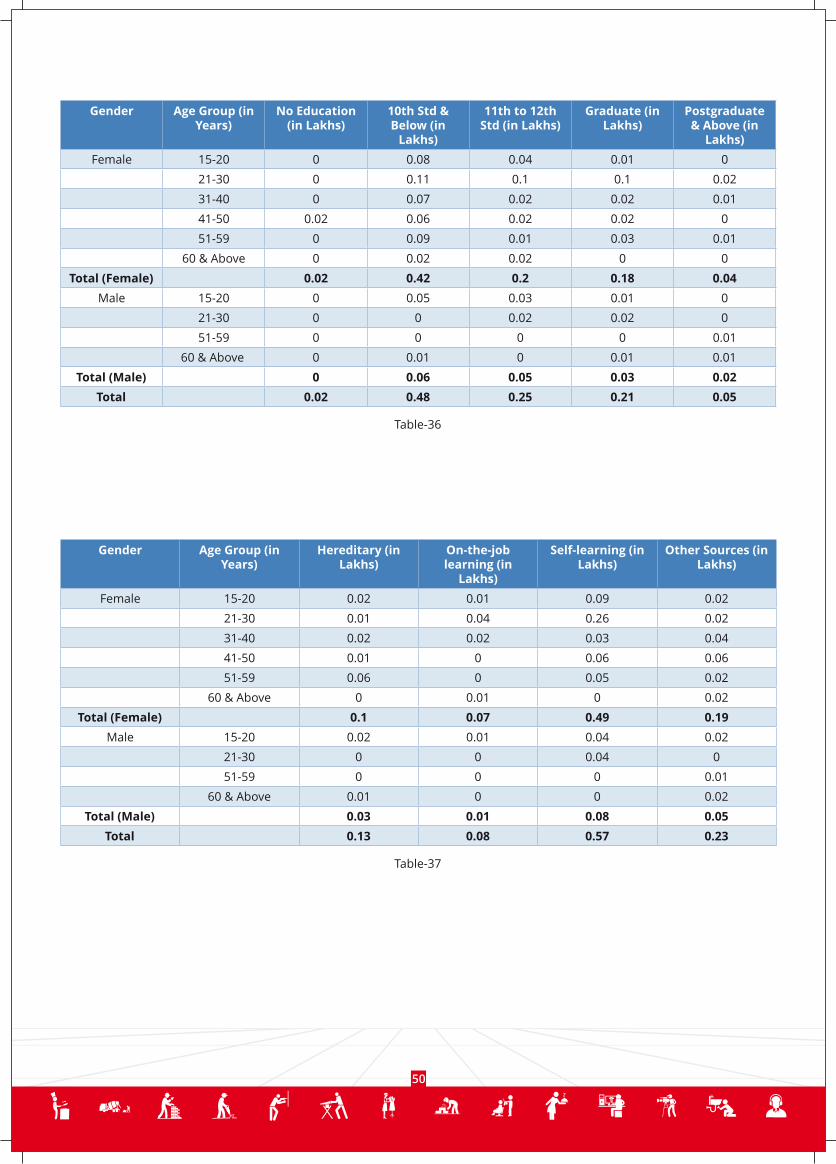
Out of all persons aged 15 years and above who are informally skilled and not employed, 50% are 10th Std & Below /Not
Educated, 25% are 11th to 12th Std and 25% are Graduate & above (All-India: 60% are 10th Std & Below /Not Educated,
25% are 11th to 12th Std, 15% are Graduate & above).
25
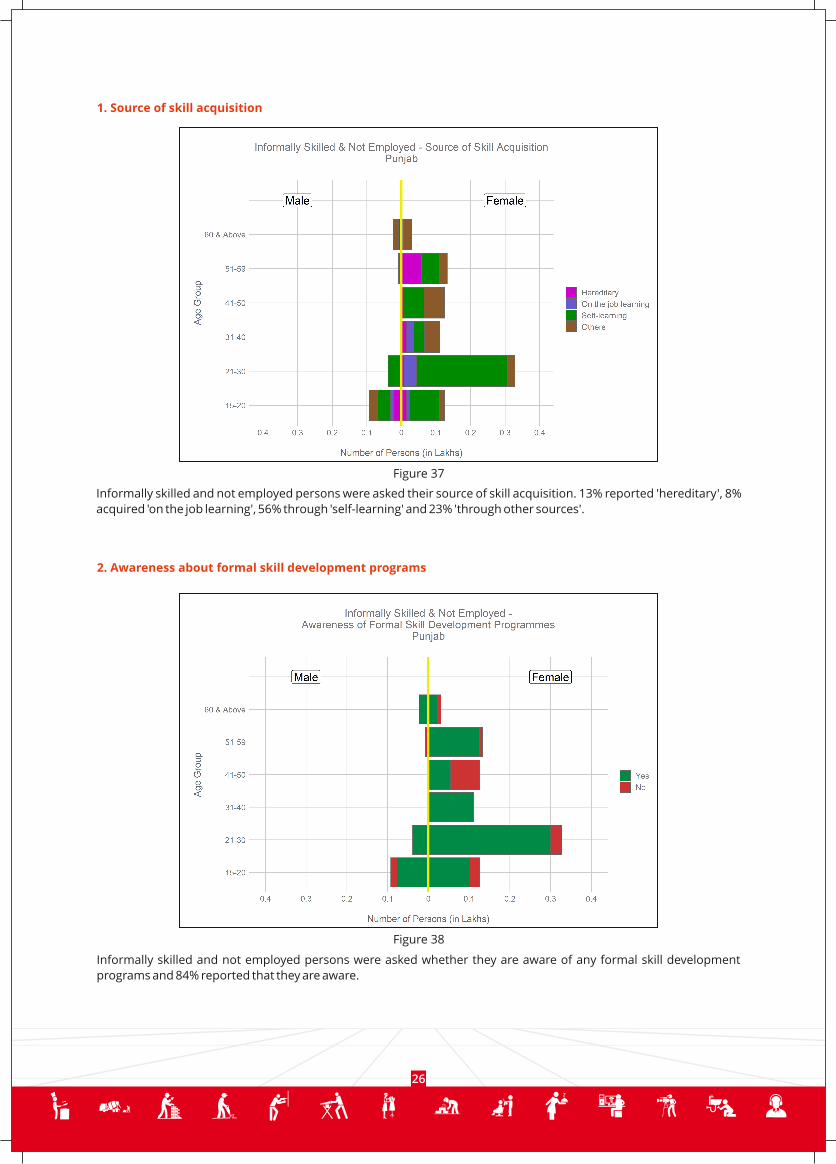
Figure 37
1. Source of skill acquisition
Informally skilled and not employed persons were asked their source of skill acquisition. 13% reported 'hereditary', 8%
acquired 'on the job learning', 56% through 'self-learning' and 23% 'through other sources'.
2. Awareness about formal skill development programs
Figure 38
Informally skilled and not employed persons were asked whether they are aware of any formal skill development
programs and 84% reported that they are aware.
26

Figure 39
3. Willingness to enroll in formal skill development programs
Informally skilled and not employed persons were asked their willingness to enroll in formal training. Among those who
are willing to enroll, 76% reported- Yes, if they are subsidised.
Figure 40
Informally skilled and not employed persons who are willing to enroll in formal training, were asked about training
duration. Maximum (64%) respondents reported- short-term training program.
27

28
Adding up across the Employed and Not Employed categories, there are an estimated 94.1 lakh persons (All-India:39
crore) (39% of the state's population aged 15 years and above, compared to the All-India figure at 40%) with informally
acquired skills. Over 24.7 lakh informally skilled persons are 15-30 years of age (All-India:10.6 crore) and 47.2 lakh 31-
50 years of age (All-India:20.4 crore).
62.6 lakh (66%) informally skilled persons are 10th Std & Below/Not Educated (All-India:2.4 crore, 75%), 17.2 lakh (18%)
are 11th to 12th Std (All-India:32 crore, 13%), 14.4 lakh (15%) are Graduate & above (All-India:4.6 crore, 12%).
60.6 lakh informally skilled persons are in rural regions (All-India:26.9 crore).
Nearly 38.8 lakh informally skilled persons are aware of formal skill development programs (All-India:5.6 crore).
13 lakh are willing to enroll for formal programs (All-India:4.24 crore), of which 1.4 lakh would like to enroll if the training
is free/sponsored (All-India:2.8 crore), 10.8 lakh if it is subsidized (All-India:0.93 crore), and 0.8 lakh even if they have to
pay (All-India:0.52 crore).
2.6 lakh are willing to enroll in short-term programs (All-India:2.95 crore) and 0.4 lakh in long-term (All-India:0.46 crore).
There are 1.3 lakh persons who are willing to enroll in formal programs and the duration of training does not matter for
them (All-India:0.47 crore).

Figure 41
V. Not Skilled and Not Employed
60% of persons, who say they do not possess any skills in the state and are not employed, reside in rural areas (65% of unskilled and not employed persons in India reside in rural areas).
Figure 42
Out of all persons aged 15 years and above who say they do not possess any skills and are not employed, 66% are 10th
Std & Below/Not Educated, 20% are 11th to 12th Std and 14% are Graduate & above (All-India: 75% are 10th Std &
Below/Not Educated, 16% are 11th to 12th Std, 8% are Graduate & above).
29

1. Awareness about formal skill development programs
2. Willingness to enroll in formal skill development programs
49.71 lakh persons do not possess any skill but are aware of formal skill development programs. 22 lakh (44%) are
15-30 years of age and 35.8 lakh (72%) are females.
Figure 43
Among persons who said that they do not possess any skills (are not employed and willing to enroll in formal training)
63% reported- Yes, if they are subsidised.
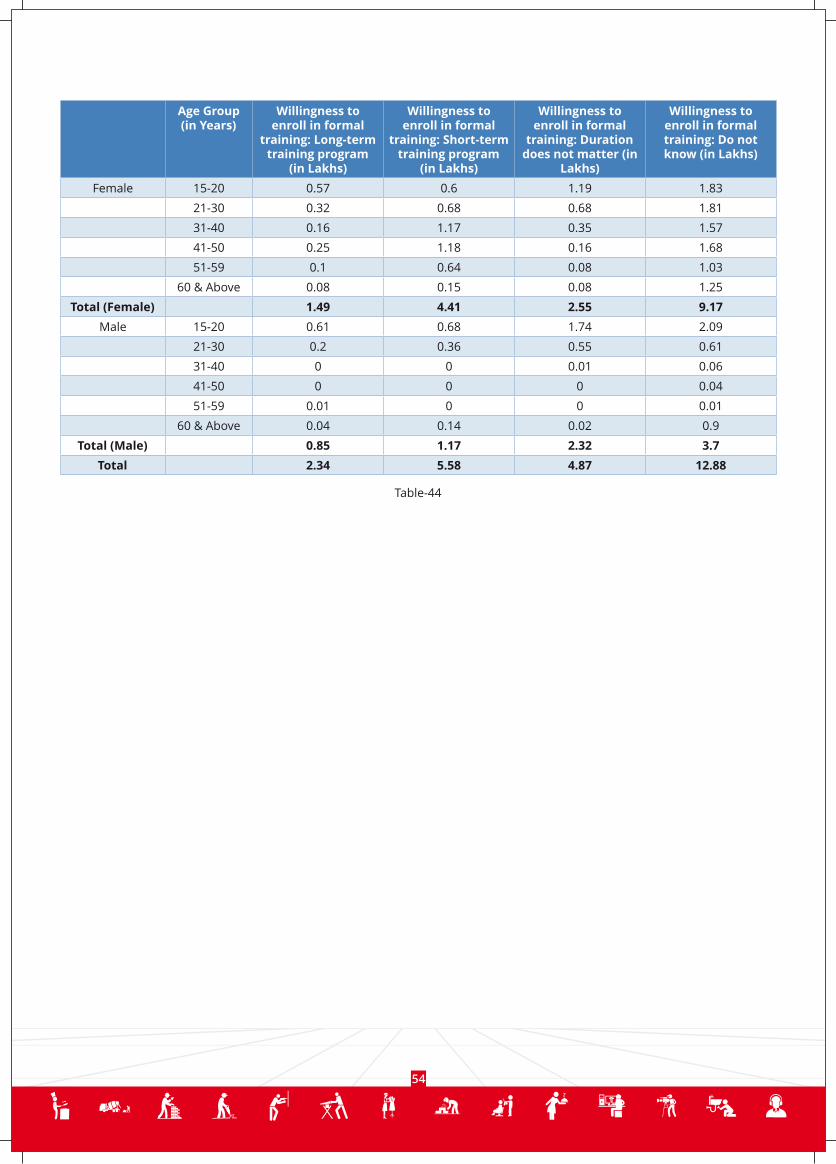
Figure 44
Persons who say they do not possess any skills (are not employed and are willing to enroll in formal training) were asked
about training duration. Maximum (50%) respondents reported “Do not know”.
30

E. Annexure: Examples of how the stock of skillsis defined / measured in different countries
Country Source Defined
Skilled /
Unskilled
Definition Indicator
Hong Kong
Hong Kong
Council of
Social
Service
Unskilled
Labour Occupation
Advanced
managerial
and
technological
skills
Occupation
South
Africa
Statistics
South Africa
Skilled
Labour Occupation
Vietnam
Ministry of
Labor,
Invalids and
Social Affairs
and General
Statistics
Office
Skilled
Labour Education
Vietnam
International
Labour
Organization
(ILO) and
Institute of
Labor
Science and
Social Affairs
Skilled
Labour Occupation
20.2% of employed persons classified as
'unskilled labour' (2016), that is, workers in the
elementary occupations as defined by the Census
and Statistics Department. These include:
Street vendors; domestic helpers and cleaners;
messengers; private security guards; watchmen;
freight handlers; lift operators; construction
laborers; hand packers; food preparation
assistants; agricultural and fishery laborers.
39% of occupied jobs in the employed population
requiring advanced managerial and technological
skills (2016) – managers and administrators,
professionals and associate professionals.
Over 1994-2014, low-skilled labor grew by 49% to
4.3 million, semiskilled labor by 66% to 7 million,
and skilled labor by 108% to 3.8 million.
Low-skilled: Those with 'elementary' skills and
domestic workers;
Semiskilled: Includes clerks, sales & service,
skil led agriculture, craftsmen, machine
operators;
Skilled: Managers, professionals and
technicians
Skilled labor force includes people aged 15 years
and over that hold a certificate/degree with a
training duration of 3 months and above. As per
labor employment surveys, 20% of the
Vietnamese labor force was skilled: Primary
Vocational (3.1%), secondary vocational (1.4%),
prof-secondary school (3.7%), vocational college
(0.3%), professional college (2.7%) and university
and higher (9.1%).
Skilled workers are defined as those who
currently hold leadership/management/
administration, professional or
technician/associate professional positions. In
2014, Vietnam has nearly 5.4 million skilled
workers, including 585,000 leaders, managers
and administrators (10.9% of the total skilled
workforce), 3,165,000 professionals (58.7%) and
1,638,000 technicians and associate
professionals (30.4%).
31

Germany
Germany
Trade and
Invest
Unskilled
Labour
Multiple UNDP Skilled
Labour Education
India
NSSO
Skilled
Labour
Latin
America
Brambillaetal
(2011)
Skilled
Labour
Education
OECD
Countries
OECD Social,
Employment
and
Migration
Working
Paper
Highly
Skilled
Migrant
Labour
Education
and
Occupation
US
The Social
Studies Help
Center
Skilled and
Unskilled
Labour
Occupation
Skilled labor refers to workers who have received specialized training to do their jobs. They have developed and honed a special skill and may or may not need to be licensed or certified by the state. For example, carpenters, plumbers, electricians, engineers, accountants, police etc.Unskilled labor comprise of workers who have received no special training and have few specific skills. Examples are construction workers, painters, factory assembly line workers etc.
Any marketable expertise, however acquired, irrespective of whether marketed or not, and whether the intention is to market it or not, is considered as skill. Thus, a person holding a certificate/ diploma on an appropriate subject will be considered to possess the specified skill along with persons who have acquired the said skill without any such certificate/ diploma or even without attending any institution. When a person has acquired skill in more than one trade, the skill in which he is more (most) proficient is considered as his skill.
Migrant population in OECD countries is categorized as 'highly skilled' based on education and occupation. It comprises of individuals who have completed post-secondary education (university-level) which includes those who have a vocational, technical or professional qualification of a shorter duration than a bachelor's degree as defined in the ISCE, or those who are in managerial, professional or associate professional occupations as defined in the International Standard Classification for Occupations (ISCO).
32
Germany Trade and Invest, the economic development agency of the Federal Republic of Germany uses Federal Statistical Office data to classify its workforce by level of professional education. In 2015, German workforce was allocated to the following categories: Skilled Craftsmen, i.e., apprentices from dual education (52%), University Graduates (21%), Graduates from vocational colleges and technicians, master
4craftsman (10%) and Unskilled (18%).
4Formula used for obtaining India-level estimates: 1) Persons having at least a University degree;2) Persons who have a Diploma certificate;3) Persons with
vocational/technical education; 4) Persons who reported that they have acquired skills through informal sources
UNDP measures skilled labour force as a percentage of the labour force aged 15 years and above with intermediate or advanced education, as classified by the International Standard Classification of Education (ISCE) (Class 10th and above). It defines labour force as a country's working-age population that engages actively in the labour market, either by working or looking for work.
Education
and
Vocational
Training
According to a paper written by Brambilla et al. (2011), which was published in The World Bank Economic Review, skilled labour is defined as individuals who hold a high school diploma or more. Out of these, individuals who hold a high school diploma are semi-skilled, while those who hold more than a high school diploma (individuals with tertiary education, some college experience, college degree, and graduate degree) are highly-skilled.
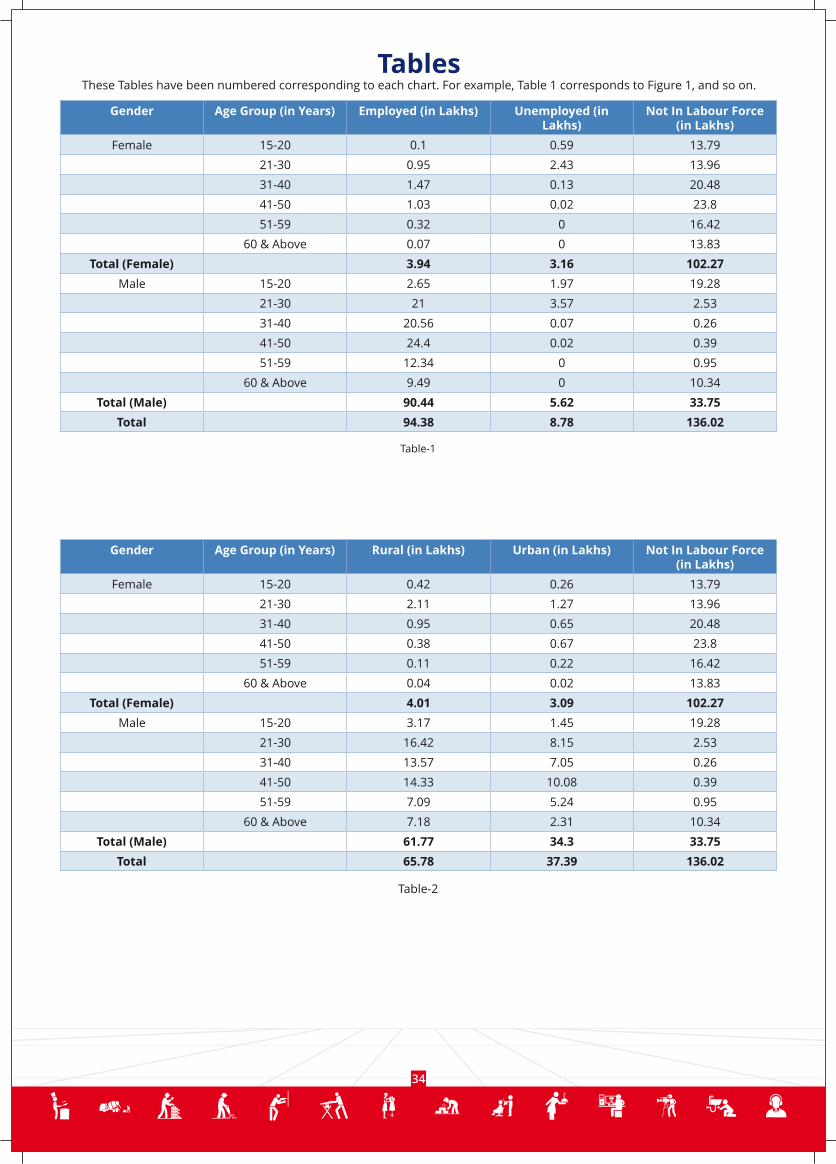
TablesThese Tables have been numbered corresponding to each chart. For example, Table 1 corresponds to Figure 1, and so on.
34
Gender Age Group (in Years) Employed (in Lakhs) Unemployed (in Lakhs)
Not In Labour Force (in Lakhs)
Female 15-20 0.1 0.59 13.79
21-30 0.95 2.43 13.96
31-40 1.47 0.13 20.48
41-50 1.03 0.02 23.8
51-59 0.32 0 16.42
60 & Above 0.07 0 13.83
Total (Female) 3.94 3.16 102.27
Male 15-20 2.65 1.97 19.28
21-30 21 3.57 2.53
31-40 20.56 0.07 0.26
41-50 24.4 0.02 0.39
51-59 12.34 0 0.95
60 & Above 9.49 0 10.34
Total (Male) 90.44 5.62 33.75
Total 94.38 8.78 136.02
Table-1
Gender Age Group (in Years) Rural (in Lakhs) Urban (in Lakhs) Not In Labour Force (in Lakhs)
Female 15-20 0.42 0.26 13.79
21-30 2.11 1.27 13.96
31-40 0.95 0.65 20.48
41-50 0.38 0.67 23.8
51-59 0.11 0.22 16.42
60 & Above 0.04 0.02 13.83
Total (Female) 4.01 3.09 102.27
Male 15-20 3.17 1.45 19.28
21-30 16.42 8.15 2.53
31-40 13.57 7.05 0.26
41-50 14.33 10.08 0.39
51-59 7.09 5.24 0.95
60 & Above 7.18 2.31 10.34
Total (Male) 61.77 34.3 33.75
Total 65.78 37.39 136.02
Table-2

35
Gender Age Group (in Years) Agriculture (in Lakhs) Non-Agriculture (in Lakhs)
Unemployed/Not in Labour Force (in
Lakhs)
Female 15-20 0.02 0.07 14.38
21-30 0.06 0.89 16.39
31-40 0.3 1.17 20.61
41-50 0.22 0.81 23.81
51-59 0.04 0.28 16.42
60 & Above 0.04 0.02 13.83
Total (Female) 0.68 3.25 105.44
Male 15-20 0.71 1.94 21.24
21-30 7.07 13.93 6.1
31-40 7.08 13.48 0.33
41-50 8.01 16.38 0.41
51-59 3.87 8.47 0.95
60 & Above 5 4.49 10.34
Total (Male) 31.74 58.7 39.37
Total 32.42 61.96 144.8
Table-3
Gender Age Group (in Years)
No Education (in Lakhs)
10th Std & Below (in
Lakhs)
11th to 12th Std (in Lakhs)
Graduate (in Lakhs)
Postgraduate & Above (in
Lakhs)
Female 15-20 0.01 8.78 5.15 0.53 0
21-30 0.2 6.81 5.13 3.54 1.65
31-40 0.73 14.23 3.88 1.78 1.48
41-50 1.44 19.07 1.62 1.62 1.1
51-59 1.22 12.76 0.82 1.2 0.73
60 & Above 2.18 9.46 0.52 0.93 0.81
Total (Female) 5.78 71.11 17.12 9.59 5.77
Male 15-20 0 13.61 9.6 0.68 0
21-30 0.13 10.33 9.45 6.15 1.03
31-40 0.56 12.07 4.93 2.04 1.29
41-50 1.05 17.74 2.98 1.9 1.14
51-59 0.6 9.73 0.87 1.3 0.78
60 & Above 2.19 12.72 1.33 2.02 1.57
Total (Male) 4.53 76.22 29.16 14.09 5.81
Total 10.31 147.33 46.28 23.68 11.58
Table-4

36
Gender Age Group (in Years)
Monthly Income (Rs.): Upto 10,000 (persons in
Lakhs)
Monthly Income (Rs.):
10,000 - 20,000 (persons in
Lakhs)
Monthly Income (Rs.):
20,000 - 50,000 (persons in
Lakhs)
Monthly Income
(Rs.): 50,000 - 1,00,000
(persons in Lakhs)
Monthly Income (Rs.):
Above 1,00,000 (persons in
Lakhs)
Female 15-20 0 0.02 0.04 0.03 0
21-30 0.14 0.12 0.35 0.12 0.22
31-40 0.13 0.1 0.7 0.29 0.25
41-50 0.15 0.06 0.21 0.13 0.48
51-59 0.07 0.02 0.05 0.06 0.13
60 & Above 0.01 0.04 0.01 0.01 0
Total (Female) 0.49 0.36 1.37 0.64 1.08
Male 15-20 0.51 0.48 1.4 0.2 0.06
21-30 7.81 0.36 6.06 4.5 2.27
31-40 5.88 0 4.31 4.33 6.03
41-50 6.57 0.1 4.55 4.73 8.44
51-59 3.35 0.07 2.51 2.04 4.37
60 & Above 2.46 0.08 2.21 1.52 3.23
Total (Male) 26.58 1.09 21.05 17.32 24.4
Total 27.07 1.45 22.41 17.96 25.48
Table-6
Gender Age Group (in Years) Rural (in Lakhs) Urban (in Lakhs) Unemployed/Not in Labour Force (in
Lakhs)
Female 15-20 0.04 0.05 14.38
21-30 0.51 0.45 16.39
31-40 0.91 0.56 20.61
41-50 0.38 0.65 23.81
51-59 0.11 0.22 16.42
60 & Above 0.04 0.02 13.83
Total (Female) 1.98 1.95 105.44
Male 15-20 1.82 0.84 21.24
21-30 14.4 6.61 6.1
31-40 13.53 7.03 0.33
41-50 14.33 10.07 0.41
51-59 7.09 5.24 0.95
60 & Above 7.18 2.31 10.34
Total (Male) 58.35 32.1 39.37
Total 60.33 34.05 144.8
Table-5

37
Gender Age Group (in Years)
10th Std & Below (in Lakhs)
11th to 12th Std (in Lakhs)
Graduate (in Lakhs)
Postgraduate & Above (in Lakhs)
Female 15-20 0.05 0.09 0 0
21-30 0.07 0.23 0.12 0.07
31-40 0.05 0.02 0.03 0.07
41-50 0.02 0 0 0
51-59 0.01 0 0 0
Total (Female) 0.19 0.34 0.16 0.14
Male 15-20 0 0.04 0 0
21-30 0.09 0.21 0.08 0.01
31-40 0.04 0.01 0.01 0.04
41-50 0.06 0.02 0.05 0.01
51-59 0.01 0.01 0.02 0.02
60 & Above 0.02 0 0.01 0
Total (Male) 0.22 0.28 0.17 0.07
Total 0.41 0.62 0.32 0.21
Table-7
Gender Age Group (in Years) Rural (in Lakhs) Urban (in Lakhs)
Female 15-20 0.11 0.04
21-30 0.27 0.22
31-40 0.08 0.08
41-50 0 0.02
51-59 0 0.01
Total (Female) 0.46 0.36
Male 15-20 0.02 0.02
21-30 0.21 0.18
31-40 0.04 0.05
41-50 0 0.13
51-59 0 0.06
60 & Above 0 0.03
Total (Male) 0.27 0.47
Total 0.74 0.83
Table-8

38
Gender Age Group (in Years) Employed (in Lakhs) Unemployed (in Lakhs)
Not In Labour Force (in Lakhs)
Female 15-20 0.02 0.06 0.07
21-30 0.08 0.28 0.13
31-40 0.07 0.02 0.08
41-50 0.01 0 0.01
51-59 0 0 0.01
Total (Female) 0.18 0.35 0.3
Male 15-20 0.01 0.01 0.02
21-30 0.21 0.11 0.07
31-40 0.09 0.01 0
41-50 0.13 0 0
51-59 0.06 0 0
60 & Above 0.02 0 0.01
Total (Male) 0.52 0.12 0.1
Total 0.7 0.48 0.4
Table-9
Gender Age Group (in Years)
Monthly Income (Rs.): Upto 10,000
(persons in Lakhs)
Monthly Income (Rs.): 20,000 -
50,000 (persons in Lakhs)
Monthly Income (Rs.): 50,000 -
1,00,000 (persons in Lakhs)
Monthly Income (Rs.): Above
1,00,000 (persons in Lakhs)
Female 15-20 0 0.01 0.01 0
21-30 0.01 0.07 0 0.01
31-40 0.01 0.03 0.01 0.03
41-50 0.01 0 0 0
Total (Female) 0.02 0.1 0.02 0.04
Male 15-20 0 0.01 0 0
21-30 0.05 0.13 0.03 0
31-40 0.02 0.01 0.03 0.04
41-50 0.02 0.01 0.05 0.05
51-59 0 0 0.02 0.05
60 & Above 0 0.01 0.01 0.01
Total (Male) 0.08 0.16 0.14 0.14
Total 0.1 0.26 0.15 0.18
Table-10

39
Gender Age Group (in Years) Agriculture (in Lakhs) Non-Agriculture (in Lakhs)
Female 15-20 0 0.015
21-30 0 0.081
31-40 0 0.073
41-50 0 0.008
Total (Female) 0 0.177
Male 15-20 0 0.008
21-30 0 0.207
31-40 0 0.088
41-50 0 0.131
51-59 0 0.062
60 & Above 0.008 0.015
Total (Male) 0.008 0.511
Total 0.008 0.688
Table-11
Gender Age Group (in Years) Rural (in Lakhs) Urban (in Lakhs)
Female 15-20 0 0.015
21-30 0.042 0.038
31-40 0.042 0.031
41-50 0 0.008
Total (Female) 0.084 0.092
Male 15-20 0 0.008
21-30 0.084 0.123
31-40 0.042 0.046
41-50 0 0.131
51-59 0 0.062
60 & Above 0 0.023
Total (Male) 0.127 0.392
Total 0.211 0.484
Table-12

40
Gender Age Group (in Years) Long-Term Training (in Lakhs)
Short-Term Training (in Lakhs)
Female 15-20 0.05 0.09
21-30 0.08 0.41
31-40 0.07 0.1
41-50 0.01 0.01
51-59 0 0.01
Total (Female) 0.21 0.61
Male 15-20 0 0.04
21-30 0.06 0.33
31-40 0.04 0.05
41-50 0.08 0.05
51-59 0.02 0.04
60 & Above 0.02 0.02
Total (Male) 0.23 0.52
Total 0.44 1.13
Table-13
Gender Age Group (in Years) Free Training (in Lakhs) Paid Training (in Lakhs)
Female 15-20 0.1 0.04
21-30 0.28 0.21
31-40 0.06 0.11
41-50 0.02 0
51-59 0 0.01
Total (Female) 0.46 0.37
Male 15-20 0 0.04
21-30 0.06 0.33
31-40 0.02 0.08
41-50 0.05 0.08
51-59 0.01 0.05
60 & Above 0.02 0.02
Total (Male) 0.14 0.6
Total 0.6 0.97
Table-14

41
Gender Age Group (in Years)
10th Std & Below (in Lakhs)
11th to 12th Std (in Lakhs)
Graduate (in Lakhs)
Postgraduate & Above (in Lakhs)
Female 15-20 0.03 0.07 0 0
21-30 0.07 0.21 0.07 0.06
31-40 0.03 0.02 0.02 0.03
41-50 0.01 0 0 0
51-59 0.01 0 0 0
Total (Female) 0.14 0.29 0.09 0.09
Male 15-20 0 0.04 0 0
21-30 0.08 0.17 0.07 0
31-40 0.04 0.01 0.01 0
41-50 0.03 0 0.02 0
51-59 0.01 0.01 0.02 0
60 & Above 0.01 0 0.01 0
Total (Male) 0.16 0.23 0.13 0
Total 0.3 0.52 0.22 0.09
Table-15
Gender Age Group (in Years) Rural (in Lakhs) Urban (in Lakhs)
Female 15-20 0.06 0.03
21-30 0.23 0.18
31-40 0.04 0.05
41-50 0 0.01
51-59 0 0.01
Total (Female) 0.34 0.28
Male 15-20 0.02 0.02
21-30 0.19 0.14
31-40 0.02 0.03
41-50 0 0.05
51-59 0 0.04
60 & Above 0 0.02
Total (Male) 0.23 0.28
Total 0.57 0.56
Table-16

42
Gender Age Group (in Years) Rural (in Lakhs) Urban (in Lakhs)
Female 15-20 0 0.01
21-30 0.02 0.01
31-40 0.02 0.02
41-50 0 0.01
Total (Female) 0.04 0.04
Male 15-20 0 0.01
21-30 0.06 0.1
31-40 0.02 0.02
41-50 0 0.05
51-59 0 0.04
60 & Above 0 0.01
Total (Male) 0.08 0.22
Total 0.13 0.26
Table-18
Gender Age Group (in Years) Employed (in Lakhs) Unemployed (in Lakhs)
Not In Labour Force (in Lakhs)
Female 15-20 0.01 0.04 0.05
21-30 0.03 0.27 0.11
31-40 0.04 0.02 0.04
41-50 0.01 0 0
51-59 0 0 0.01
Total (Female) 0.08 0.32 0.21
Male 15-20 0.01 0.01 0.02
21-30 0.16 0.1 0.06
31-40 0.04 0.01 0
41-50 0.05 0 0
51-59 0.04 0 0
60 & Above 0.01 0 0.01
Total (Male) 0.31 0.12 0.09
Total 0.39 0.44 0.3
Table-17
43
Gender Age Group (in Years) Non-Agriculture (in Lakhs)
Female 15-20 0.01
21-30 0.03
31-40 0.04
41-50 0.01
Total (Female) 0.08
Male 15-20 0.01
21-30 0.16
31-40 0.04
41-50 0.05
51-59 0.04
60 & Above 0.01
Total (Male) 0.31
Total 0.39
Table-19
Gender Age Group (in Years)
Monthly Income (Rs.): Upto 10,000
(persons in Lakhs)
Monthly Income (Rs.): 20,000 -
50,000 (persons in Lakhs)
Monthly Income (Rs.): 50,000 -
1,00,000 (persons in Lakhs)
Monthly Income (Rs.): Above
1,00,000 (persons in Lakhs)
Female 15-20 0 0 0.01 0
21-30 0.01 0.02 0 0
31-40 0.01 0.02 0 0.01
41-50 0.01 0 0 0
Total (Female) 0.02 0.04 0.01 0.01
Male 15-20 0 0.01 0 0
21-30 0.04 0.11 0.02 0
31-40 0.01 0.01 0.03 0
41-50 0 0.01 0.03 0.01
51-59 0 0 0.01 0.03
60 & Above 0 0 0.01 0
Total (Male) 0.05 0.13 0.09 0.04
Total 0.07 0.17 0.1 0.05
Table-20

44
Vocational Training Helped Persons (in Lakhs)
"To get my present/ previous job" 0.46
To establish my enterprise 0.11
"In upward mobility(promotion) in my job/line of work (income/leadership)"
0.02
Total 0.59
Table-21
Vocational Training Did Not Help - Reasons Persons (in Lakhs)
"Changed trade, due to inability to get a job in the trade in which member was trained"
0.02
Training was irrelevant 0.01
"Changed the line of work/trade, due to lack of interest" 0.01
Total 0.04
Table-22
Got Present Job Persons (in Lakhs)
Through friends and family 0.27
Through formal channels 0.21
Through the training partner 0.15
Through professional network 0.04
Don't Know/remember 0.03
Total 0.7
Table-24
Vocational Training Helped Persons (in Lakhs)
To get my previous job 0.03
Total 0.03
Table-23

45
Got Previous Job Persons (in Lakhs)
Through friends and family 0.02
Through formal channels 0.01
Total 0.03
Table-25
Reasons For Not Taking Up Work Persons (in Lakhs)
Did not get a job 0.72
"Could not pursue for personal reasons" 0.1
Not interested to work 0.03
Total 0.84
Table-26
Gender Age Group (in Years) Rural (in Lakhs) Urban (in Lakhs) Other Persons (in Lakhs)
Female 15-20 0.04 0.03 14.4
21-30 0.46 0.36 16.51
31-40 0.87 0.52 20.69
41-50 0.38 0.62 23.85
51-59 0.11 0.22 16.42
60 & Above 0.04 0.02 13.83
Total (Female) 1.9 1.77 105.71
Male 15-20 1.82 0.82 21.26
21-30 14.31 6.26 6.53
31-40 13.47 6.91 0.52
41-50 14.33 9.83 0.64
51-59 7.07 5.17 1.05
60 & Above 7.18 2.29 10.36
Total (Male) 58.18 31.28 40.35
Total 60.08 33.05 146.06
Table-27

46
Gender Age Group (in Years) Agriculture (in Lakhs) Non-Agriculture (in Lakhs)
Other Persons (in Lakhs)
Female 15-20 0.02 0.05 14.4
21-30 0.06 0.76 16.51
31-40 0.3 1.09 20.69
41-50 0.22 0.78 23.85
51-59 0.04 0.28 16.42
60 & Above 0.04 0.02 13.83
Total (Female) 0.68 2.99 105.71
Male 15-20 0.71 1.93 21.26
21-30 7.07 13.5 6.53
31-40 7.08 13.3 0.52
41-50 8.01 16.15 0.64
51-59 3.87 8.37 1.05
60 & Above 4.99 4.48 10.36
Total (Male) 31.73 57.73 40.35
Total 32.42 60.71 146.06
Table-28
Gender Age Group (in Years)
No Education (in
Lakhs)
10th Std & Below (in
Lakhs)
11th to 12th Std (in
Lakhs)
Graduate (in Lakhs)
Postgraduate & Above (in
Lakhs)
Other Persons (in
Lakhs)
Female 15-20 0 0.03 0.02 0.02 0 14.4
21-30 0.02 0.13 0.07 0.34 0.27 16.51
31-40 0.14 0.46 0.21 0.1 0.48 20.69
41-50 0.16 0.41 0.02 0.13 0.28 23.85
51-59 0.01 0.15 0.05 0.02 0.08 16.42
60 & Above 0.04 0.02 0 0.01 0 13.83
Total (Female) 0.37 1.2 0.36 0.62 1.12 105.71
Male 15-20 0 2.06 0.54 0.04 0 21.26
21-30 0.13 9.52 6.88 3.37 0.67 6.53
31-40 0.54 11.84 4.86 1.93 1.2 0.52
41-50 1.05 17.28 2.96 1.81 1.06 0.64
51-59 0.56 9.02 0.8 1.16 0.7 1.05
60 & Above 1.22 7.27 0.54 0.27 0.17 10.36
Total (Male) 3.5 56.99 16.59 8.57 3.8 40.35
Total 3.87 58.19 16.95 9.19 4.92 146.06
Table-29

47
Gender Age Group (in Years)
Monthly Income (Rs.): Upto 10,000 (persons in
Lakhs)
Monthly Income
(Rs.): 10,000 - 20,000
(persons in Lakhs)
Monthly Income
(Rs.): 20,000 - 50,000
(persons in Lakhs)
Monthly Income
(Rs.): 50,000 - 1,00,000
(persons in Lakhs)
Monthly Income
(Rs.): Above 1,00,000
(persons in Lakhs)
Other Persons (in
Lakhs)
Female 15-20 0 0.02 0.04 0.02 0 14.4
21-30 0.12 0.12 0.29 0.11 0.18 16.51
31-40 0.11 0.1 0.67 0.28 0.22 20.69
41-50 0.14 0.06 0.21 0.13 0.46 23.85
51-59 0.07 0.02 0.05 0.06 0.13 16.42
60 & Above 0.01 0.04 0.01 0.01 0 13.83
Total (Female) 0.45 0.36 1.26 0.59 1 105.71
Male 15-20 0.51 0.48 1.39 0.2 0.06 21.26
21-30 7.76 0.36 5.9 4.4 2.15 6.53
31-40 5.85 0 4.31 4.28 5.94 0.52
41-50 6.53 0.1 4.54 4.67 8.32 0.64
51-59 3.35 0.07 2.51 2.02 4.29 1.05
60 & Above 2.46 0.08 2.2 1.51 3.22 10.36
Total (Male) 26.46 1.09 20.85 17.09 23.97 40.35
Total 26.91 1.45 22.12 17.68 24.97 146.06
Table-30
Gender Age Group (in Years)
Experience: 0-1 yr
(persons in Lakhs)
Experience: More than 1
& Less than 2 yrs (persons
in Lakhs)
Experience: More than 2
& Less than 5 yrs (persons
in Lakhs)
Experience: More than
5 & Less than 10 yrs (persons in
Lakhs)
Experience: More than 10 yrs (persons
in Lakhs)
Other Persons (in
Lakhs)
Female 15-20 0.02 0.05 0 0 0 14.4
21-30 0.07 0.2 0.39 0.07 0.1 16.51
31-40 0.02 0.03 0.07 0.47 0.8 20.69
41-50 0.01 0 0.01 0.03 0.95 23.85
51-59 0 0 0.02 0 0.3 16.42
60 & Above 0 0 0 0 0.07 13.83
Total (Female)
0.12 0.28 0.48 0.58 2.21 105.71
Male 15-20 0.82 1.48 0.22 0.01 0.11 21.26
21-30 0.64 3.54 8.47 5.68 2.23 6.53
31-40 0.03 0.02 0.16 1.74 18.43 0.52
41-50 0.03 0.01 0.03 0.14 23.96 0.64
51-59 0.02 0.01 0.02 0.05 12.14 1.05
60 & Above 0.01 0 0 0.03 9.43 10.36
Total (Male) 1.54 5.06 8.91 7.65 66.3 40.35
Total 1.66 5.34 9.39 8.22 68.51 146.06
Table-31
48
Gender Age Group (in Years)
Hereditary (in Lakhs)
On-the-job learning (in
Lakhs)
Self-learning (in Lakhs)
Other Sources (in Lakhs)
Other Persons (in Lakhs)
Female 15-20 0 0.02 0.04 0.01 14.4
21-30 0.02 0.56 0.16 0.09 16.51
31-40 0.04 0.68 0.6 0.07 20.69
41-50 0.14 0.46 0.31 0.08 23.85
51-59 0.04 0.14 0.1 0.05 16.42
60 & Above 0.01 0.01 0.05 0 13.83
Total (Female) 0.24 1.86 1.27 0.3 105.71
Male 15-20 0.53 0.58 1.3 0.22 21.26
21-30 6.25 4.6 8.35 1.37 6.53
31-40 6.01 4.98 8.02 1.37 0.52
41-50 6.83 5.43 10.27 1.64 0.64
51-59 3.48 3.09 4.85 0.82 1.05
60 & Above 4.18 0.86 4.07 0.36 10.36
Total (Male) 27.28 19.55 36.86 5.77 40.35
Total 27.52 21.41 38.12 6.08 146.06
Table-32
Gender Age Group (in Years) Willingness to enroll in formal training:
Yes, if they are free/ sponsored (in Lakhs)
Willingness to enroll in formal training:
Yes, if they are subsidised (in Lakhs)
Willingness to enroll in formal training: Yes, even if have to
pay (in Lakhs)
Female 15-20 0 0.01 0
21-30 0.01 0.02 0.01
31-40 0.02 0.18 0.01
41-50 0 0.12 0.01
51-59 0.02 0.02 0.01
Total (Female) 0.04 0.34 0.03
Male 15-20 0.06 0.41 0.01
21-30 0.45 2.47 0.25
31-40 0.31 2.61 0.23
41-50 0.23 2.61 0.17
51-59 0.12 1.17 0.08
60 & Above 0.07 0.79 0.05
Total (Male) 1.23 10.06 0.79
Total 1.27 10.4 0.82
Table-33
49
Gender Age Group (in Years)
Willingness to enroll in formal training: Long-term training program (in
Lakhs)
Willingness to enroll in formal training: Short-term training program (in
Lakhs)
Willingness to enroll in formal
training: Duration does not matter
(in Lakhs)
Willingness to enroll in formal training: Do not know (in Lakhs)
Female 15-20 0 0 0 0.01
21-30 0 0.01 0.01 0.02
31-40 0.01 0 0.01 0.19
41-50 0.01 0 0.01 0.11
51-59 0 0.02 0.01 0.02
Total (Female) 0.02 0.02 0.03 0.34
Male 15-20 0 0.05 0.02 0.41
21-30 0.11 0.79 0.35 1.92
31-40 0.03 0.47 0.4 2.26
41-50 0.19 0.46 0.27 2.09
51-59 0.04 0.36 0.14 0.83
60 & Above 0 0.13 0.04 0.74
Total (Male) 0.37 2.26 1.21 8.24
Total 0.38 2.28 1.24 8.58
Table-34
Gender Age Group (in Years) Rural (in Lakhs) Urban (in Lakhs)
Female 15-20 0.06 0.06
21-30 0.27 0.05
31-40 0.04 0.07
41-50 0.06 0.06
51-59 0.06 0.07
60 & Above 0 0.03
Total (Female) 0.51 0.35
Male 15-20 0 0.09
21-30 0 0.04
51-59 0 0.01
60 & Above 0 0.02
Total (Male) 0 0.16
Total 0.51 0.51
Table-35
50
Gender Age Group (in Years)
Hereditary (in Lakhs)
On-the-job learning (in
Lakhs)
Self-learning (in Lakhs)
Other Sources (in Lakhs)
Female 15-20 0.02 0.01 0.09 0.02
21-30 0.01 0.04 0.26 0.02
31-40 0.02 0.02 0.03 0.04
41-50 0.01 0 0.06 0.06
51-59 0.06 0 0.05 0.02
60 & Above 0 0.01 0 0.02
Total (Female) 0.1 0.07 0.49 0.19
Male 15-20 0.02 0.01 0.04 0.02
21-30 0 0 0.04 0
51-59 0 0 0 0.01
60 & Above 0.01 0 0 0.02
Total (Male) 0.03 0.01 0.08 0.05
Total 0.13 0.08 0.57 0.23
Table-37
Gender Age Group (in Years)
No Education (in Lakhs)
10th Std & Below (in
Lakhs)
11th to 12th Std (in Lakhs)
Graduate (in Lakhs)
Postgraduate & Above (in
Lakhs)
Female 15-20 0 0.08 0.04 0.01 0
21-30 0 0.11 0.1 0.1 0.02
31-40 0 0.07 0.02 0.02 0.01
41-50 0.02 0.06 0.02 0.02 0
51-59 0 0.09 0.01 0.03 0.01
60 & Above 0 0.02 0.02 0 0
Total (Female) 0.02 0.42 0.2 0.18 0.04
Male 15-20 0 0.05 0.03 0.01 0
21-30 0 0 0.02 0.02 0
51-59 0 0 0 0 0.01
60 & Above 0 0.01 0 0.01 0.01
Total (Male) 0 0.06 0.05 0.03 0.02
Total 0.02 0.48 0.25 0.21 0.05
Table-36

51
Gender Age Group (in Years) Awareness of formal training: Yes (in Lakhs)
Awareness of formal training: No (in Lakhs)
Female 15-20 0.1 0.02
21-30 0.3 0.03
31-40 0.11 0
41-50 0.05 0.07
51-59 0.12 0.01
60 & Above 0.02 0.01
Total (Female) 0.71 0.14
Male 15-20 0.08 0.02
21-30 0.04 0
51-59 0 0.01
60 & Above 0.02 0
Total (Male) 0.14 0.02
Total 0.85 0.16
Table-38
Gender Age Group (in Years)
Willingness to enroll in formal training: Yes, if they are free/sponsored (in
Lakhs)
Willingness to enroll in formal
training: Yes, even if have to pay (in Lakhs)
Willingness to enroll in formal
training: Yes, if they are
subsidised (in Lakhs)
Willingness to enroll in formal training: No, not
interested (in Lakhs)
Female 15-20 0.01 0 0.09 0.03
21-30 0.03 0 0.25 0.05
31-40 0.01 0.01 0.01 0.09
41-50 0.01 0 0.01 0.11
51-59 0 0 0.01 0.12
60 & Above 0 0 0 0.03
Total (Female) 0.05 0.01 0.36 0.43
Male 15-20 0.02 0.01 0.01 0.05
21-30 0.02 0 0 0.02
51-59 0 0.01 0 0
60 & Above 0 0 0 0.02
Total (Male) 0.04 0.02 0.01 0.1
Total 0.09 0.02 0.36 0.53
Table-39

52
Gender Age Group (in Years) Rural (in Lakhs) Urban (in Lakhs)
Female 15-20 8.74 5.37
21-30 11.02 4.61
31-40 13.11 7.28
41-50 13.87 9.8
51-59 9.14 7.13
60 & Above 7.9 5.91
Total (Female) 63.77 40.11
Male 15-20 12.88 8.24
21-30 3 2.77
31-40 0.25 0.07
41-50 0.34 0.07
51-59 0.4 0.52
60 & Above 4.5 5.74
Total (Male) 21.36 17.41
Total 85.14 57.52
Table-41
Gender Age Group (in Years)
Willingness to enroll in formal
training: Long-term training program (in
Lakhs)
Willingness to enroll in formal
training: Short-term training program (in
Lakhs)
Willingness to enroll in formal training:
Duration does not matter (in
Lakhs)
Willingness to enroll in formal
training: Do not know (in
Lakhs)
Willingness to enroll in formal
training: Not Interested (in
Lakhs)
Female 15-20 0.01 0.07 0 0.02 0.03
21-30 0 0.23 0.02 0.03 0.05
31-40 0.01 0 0.02 0 0.09
41-50 0.01 0 0 0.01 0.11
51-59 0 0 0.01 0 0.12
60 & Above 0 0 0 0 0.03
Total (Female) 0.02 0.3 0.05 0.05 0.43
Male 15-20 0.02 0 0.01 0.01 0.05
21-30 0 0 0.01 0.01 0.02
51-59 0 0.01 0 0 0
60 & Above 0 0 0 0 0.02
Total (Male) 0.02 0.01 0.02 0.02 0.1
Total 0.05 0.31 0.06 0.07 0.53
Table-40

53
Gender Age Group (in Years)
No Education (in Lakhs)
10th Std & Below (in
Lakhs)
11th to 12th Std (in Lakhs)
Graduate (in Lakhs)
Postgraduate & Above (in
Lakhs)
Female 15-20 0.01 8.62 5 0.48 0
21-30 0.18 6.51 4.74 2.93 1.27
31-40 0.58 13.65 3.63 1.63 0.9
41-50 1.26 18.58 1.59 1.46 0.79
51-59 1.21 12.52 0.76 1.14 0.64
60 & Above 2.14 9.43 0.5 0.92 0.81
Total (Female) 5.39 69.3 16.21 8.57 4.41
Male 15-20 0 11.49 9 0.62 0
21-30 0 0.72 2.34 2.49 0.21
31-40 0.02 0.19 0.04 0.05 0.03
41-50 0 0.4 0 0 0.01
51-59 0.04 0.7 0.06 0.09 0.02
60 & Above 0.97 5.43 0.79 1.68 1.38
Total (Male) 1.03 18.94 12.22 4.93 1.65
Total 6.42 88.24 28.43 13.5 6.07
Table-42
Gender Age Group (in Years) Willingness to enroll in formal training:
Yes, if they are free/sponsored (in Lakhs)
Willingness to enroll in formal training:
Yes, if they are subsidised (in Lakhs)
Willingness to enroll in formal training: Yes, even if have to
pay (in Lakhs)
Female 15-20 1.74 1.75 0.7
21-30 0.98 2.1 0.42
31-40 0.26 2.64 0.36
41-50 0.27 2.74 0.27
51-59 0.13 1.58 0.14
60 & Above 0.05 1.42 0.08
Total (Female) 3.43 12.23 1.96
Male 15-20 1.87 2.17 1.08
21-30 0.55 0.72 0.44
31-40 0 0.07 0
41-50 0 0.04 0
51-59 0.01 0.01 0
60 & Above 0.04 1 0.06
Total (Male) 2.47 4 1.58
Total 5.9 16.23 3.53
Table-43
54
Age Group (in Years)
Willingness to enroll in formal
training: Long-term training program
(in Lakhs)
Willingness to enroll in formal
training: Short-term training program
(in Lakhs)
Willingness to enroll in formal
training: Duration does not matter (in
Lakhs)
Willingness to enroll in formal training: Do not know (in Lakhs)
Female 15-20 0.57 0.6 1.19 1.83
21-30 0.32 0.68 0.68 1.81
31-40 0.16 1.17 0.35 1.57
41-50 0.25 1.18 0.16 1.68
51-59 0.1 0.64 0.08 1.03
60 & Above 0.08 0.15 0.08 1.25
Total (Female) 1.49 4.41 2.55 9.17
Male 15-20 0.61 0.68 1.74 2.09
21-30 0.2 0.36 0.55 0.61
31-40 0 0 0.01 0.06
41-50 0 0 0 0.04
51-59 0.01 0 0 0.01
60 & Above 0.04 0.14 0.02 0.9
Total (Male) 0.85 1.17 2.32 3.7
Total 2.34 5.58 4.87 12.88
Table-44


National Skill Development Corporation
301, West Wing, Worldmark 1, Aerocity, New Delhi 110037
T: +91-11-47451600-10 | F: +91-11-46560417
NSDCIndiaOfficial nsdcindia NSDCIndiaOfficialwww.nsdcindia.org
By Market Analytics Unit