Estimating the Demand for Settlement Balances in the ... · Estimating the Demand for Settlement...
43
Working Paper/Document de travail 2012-15 Estimating the Demand for Settlement Balances in the Canadian Large Value Transfer System by Nellie Zhang
Transcript of Estimating the Demand for Settlement Balances in the ... · Estimating the Demand for Settlement...

Working Paper/Document de travail 2012-15
Estimating the Demand for Settlement Balances in the Canadian Large Value Transfer System
by Nellie Zhang

2
Bank of Canada Working Paper 2012-15
May 2012
Estimating the Demand for Settlement Balances in the Canadian Large Value
Transfer System
by
Nellie Zhang
Funds Management and Banking Department Bank of Canada
Ottawa, Ontario, Canada K1A 0G9 [email protected]
Bank of Canada working papers are theoretical or empirical works-in-progress on subjects in economics and finance. The views expressed in this paper are those of the author.
No responsibility for them should be attributed to the Bank of Canada.
ISSN 1701-9397 © 2012 Bank of Canada

ii
Acknowledgements
I am indebted to Jonathan Chiu and Kim P. Huynh for very valuable comments. I also thank James Chapman, Rod Garratt, Miguel Molico, Denise Vasconcelos, and Ren Zhang for their helpful suggestions, as well as Anthony Chan of FMD and FBD Debt Management team for their data contributions.
iii
Abstract
This paper applies a static model of an interest rate corridor to the Canadian data, and estimates the aggregate demand for central-bank settlement balances in the Large Value Transfer System (LVTS). The empirical specification controls for various calendar effects that have been shown to cause fluctuations in LVTS payment flows. The analysis takes into account the downward divergence of the overnight interest rate from the target rate, which has been persistent since 2005. The results suggest that a target of $3 billion for LVTS settlement balances does not seem excessive during the time period when Canadian monetary policy was operating at the effective lower bound (ELB). Specifically, the model projects that, if the consistent downward divergence of overnight interest rate is taken into account, then on average $2.405 billion of LVTS settlement balances would probably have been sufficient to achieve the goal of keeping the overnight interest rate at or very close to the lower bound of the corridor. However, by targeting a slightly higher level, the Bank of Canada could be 95% certain that the overnight interest rate would on average not exceed its policy rate at the lower bound of the corridor. In addition, the estimation shows that the point elasticity of overnight interest rate is around 0.17 when the daily level of settlement balances is targeted at $3 billion under the ELB framework.
JEL classification: G01, E40, E50, C36 Bank classification: Interest rates; Monetary policy implementation; Payment, clearing, and settlement systems
Résumé
L’auteure applique aux données canadiennes un modèle statique formalisant un corridor de taux d’intérêt en vue d’estimer la demande totale de soldes de règlement au sein du Système de transfert de paiements de grande valeur (STPGV). La spécification empirique retenue neutralise différents effets de calendrier reconnus à l’origine de fluctuations dans les flux de paiement du STPGV. L’analyse tient compte de la divergence à la baisse du taux du financement à un jour qu’on observe depuis 2005 par rapport au taux visé. D’après les résultats obtenus, un niveau cible de 3 milliards de dollars pour les soldes de règlement durant la période où le taux directeur au Canada se situait à sa valeur plancher ne paraît pas excessif. Plus précisément, si l’on considère la divergence à la baisse persistante du taux à un jour, des soldes moyens de 2,405 milliards de dollars auraient probablement été suffisants, selon le modèle, pour que le taux à un jour se maintienne à la limite inférieure du corridor ou très près de celle-ci. Toutefois, en visant un montant légèrement supérieur, la Banque du Canada pouvait être sûre à 95 % que le taux à un jour ne dépasserait pas, en moyenne, le taux directeur (la limite inférieure du corridor). L’estimation montre en outre que l’élasticité du taux à un jour s’établit à environ 0,17 quand le niveau quotidien visé pour les soldes de règlement est de 3 milliards de dollars et que le taux directeur se trouve à sa valeur plancher.
Classification JEL : G01, E40, E50, C36 Classification de la Banque : Taux d’intérêt; Mise en œuvre de la politique monétaire; Systèmes de paiement, de compensation et de règlement

1 Introduction
Nowadays, most central banks implement monetary policy through control of
overnight interest rates. It is usually the case that the framework for the im-
plementation of monetary policy is tightly connected with the payment system
operated and/or overseen by the central bank, because the financial institutions
who directly transact in the payment system ultimately settle their final funds
positions on the books of the central bank. Being the ultimate supplier of set-
tlement balances (central bank money), the central bank is in a unique position
to exert its influence on the overnight interest rate through its influence on the
market for settlement balances. This paper estimates the aggregate demand
for settlement balances in the Canadian Large Value Transfer System (LVTS)
that has been a central setting for the conduct of monetary policy in Canada
for more than a decade.1 The focus of interest is to answer the question of how
big the supply of settlement balances should be when the central bank wants
to target the overnight interest rate at a very low level, for instance, during
economic downturns; and how much is too much?
The question becomes particularly interesting in the context of interest-rate
corridors, which many central banks around the world adopt for the implemen-
tation of monetary policy, including the Bank of Canada.2 A pure interest-rate
corridor (also known as “tunnel” or “channel”) system, in contrast to a period-
average reserve regime that relies on traditional reserves requirements to help
achieve a target interest rate, utilizes standing facilities to control the overnight
interest rate. Specifically, the central bank’s standing facilities establish an op-
erating band that contains the movements of the overnight rate; the interest
rate on overnight overdraft loans from the central bank provides a ceiling for
the overnight rate, while a floor is provided by the interest rate paid on the
deposits held overnight at the central bank. With the overnight interest rate
contained within the corridor, the downward-sloping aggregate demand curve
(for settlement balances) takes an inverted S -shape that becomes increasingly
flatter near both the top and bottom boundaries.
Hence, if a central bank wants to exploit the elastic region of the demand
curve (where changes in quantities of settlement balances have little impact on
the overnight rate), by setting its target for the overnight rate at the bottom
1For details about LVTS operations and risk controls, please see Arjani and McVanel(2006).
2Countries who are currently using a rate corridor regime include Australia, Mexico, NewZealand and Sweden.
2

of the corridor, how can it determine the proper level of settlement balances
needed to achieve the target rate?
The Canadian experience with a rate corridor regime provides a fitting
context and necessary data for examining this question. In spring 2009, in order
to preserve the effective functioning of financial markets in a low interest rate
environment, the Bank of Canada made several adjustments to its framework
for the implementation of monetary policy, which were to remain in effect for a
designated period of time. The key changes include: (i) setting the target for the
overnight interest rate at the bottom of the operating band as opposed to the
midpoint, as at normal times; (ii) narrowing the operating band from 50 basis
points previously to 25 basis points; (iii) targeting a daily level of settlement
balances in the LVTS at $3 billion rather than a small positive amount (e.g.
$25 million). With the first two adjustments, the Bank of Canada was setting
an effective lower bound (ELB) on the overnight interest rate; and by providing
a significantly more-than-required amount of settlement balances, the Bank of
Canada created competition among LVTS participants in loaning out surplus
funds at the end of each day, which successfully drove the overnight interest
rate quite close to the lower bound of the rate corridor.
Using a generalized linear model regression, this paper aims to estimate the
aggregate demand for settlement balances in LVTS and uncover whether or not
a large supply of settlement balances such as $3 billion is more than is needed
for the Canadian overnight rate to trade at the bottom of the corridor.
The main results of this study suggest that a target level of $3 billion for
LVTS settlement balances does not seem excessive in the ELB framework. Tak-
ing into account the fact that the average interest rate in Canadian overnight
market has been consistently drifting below the Bank of Canada’s target rate
for the past few years, the regression model projects that $2.405 billion of LVTS
settlement balances would probably have been sufficient to achieve the goal of
keeping the overnight interest rate at or very close to the lower bound of the
corridor. However, by targeting a slightly higher level, the Bank could be 95%
certain that the overnight rate would on average not exceed its policy rate at
the lower bound of the corridor. In addition, the estimation shows the point
elasticity of the overnight rate is around 0.17, when the daily level of LVTS
settlement balances is targeted at $3 billion under the ELB framework.
There is plenty of previous work in the literature on both theoretical mod-
elling and empirical estimation of the demand for settlement balances. Em-
pirical analyses are represented by the normal mixture time-series models first
3

explored by Hamilton (1996). These models capture observed features of the
overnight market for central-bank reserves. Hamilton (1997) followed by study-
ing the liquidity effect of central-bank open market operations on overnight
interest rate, which is measured by the slope of the demand curve for cen-
tral bank funds. One of the theoretical models is proposed by Berentsen and
Monnet (2008). The authors developed a dynamic general equilibrium frame-
work for an interest-rate corridor system, and found that such systems require
characterization of any monetary policy to be highly consistent with the sys-
tem properties. This paper, however, draws heavily on the theoretic model
proposed by Whitesell (2006), which is elaborated in Section 3 hereinafter.
The rest of this paper proceeds as follows. The next section provides a brief
illustration of an interest-rate corridor system and institutional background for
Canadian monetary policy implementation framework. Section 3 reviews the
interest-rate corridor model proposed by Whitesell (2006). A description of
data to which the model is applied and the empirical estimation can be found
in Section 4.1. Regression details are provided in Section 4.2 and estimation
results are presented in Section 4.3. Conclusions follow in Section 5.
2 Institutional Background
2.1 A Rate Corridor System
In general, there are three main elements in a rate corridor system: the central
bank’s target for the overnight interest rate and the two boundaries of the
corridor. The upper limit of the corridor is usually the interest rate offered by
the central bank’s standing lending facility (SLF), known as the Bank Rate in
Canada; the lower limit is the rate of interest that financial institutions earn
upon their deposits of excess settlement balances at the central bank, i.e. the
Deposit Rate.3 The spread between the two boundaries is often known as the
operating band. The prices the central bank sets on deposits and overdraft
loans create strong incentives for the movements of the overnight interest rate
to stay within the corridor. Figure 1 provides an illustration of an interest-rate
corridor. Typically, the central bank sets its target for overnight rate at the
midpoint of the operating band, to create symmetric opportunity costs around
the target rate. In Canada, based on current market conditions and its outlook
3In this paper, a “financial institution” is more specifically referring to a financial organi-zation that has access to central bank liquidity facilities.
4

for inflation, the Bank of Canada determines its target for the overnight rate,
the positioning and the width of the operating band, and announces its decision
on fixed dates each year.
Figure 1: Interest Rate Corridor Regime
Deposit Rate
Target Rate
Bank Rate
Settlement Balances
Overnight Rate
Demand
Supply
Operating Band
Consider the interest-rate corridor structure from a theoretical perspective
of the dynamics between supply and demand of settlement balances. As il-
lustrated in Figure 1, one can picture a vertical supply curve at the level of
settlement balances provided by the central bank; and a generally downward-
sloping demand curve for aggregate settlement balances being bounded within
the two limits of the corridor. The demand curve is steepest at the midpoint of
the corridor and becomes increasingly flatter near the two boundaries. Specif-
ically, as the overnight interest rate falls, the quantity of settlement balances
demanded rises; when it is approaching the floor of the corridor, the quantity of
settlement balances demanded can be anywhere between a very large number
and infinity (because of the close-to-perfect interest elasticity of demand near
the lower bound.)
In principle, a central bank may prefer an interest-elastic demand function,
because the interest rate would not be significantly affected by a relatively large
5

error in the supply of settlement balances, if it occurred. Given an inverted
S -shaped demand curve, if a central bank wants to benefit from the interest-
elastic region of the demand, it can lower its target rate from the midpoint of
the operating band to the floor, and simultaneously supply excess settlement
balances that is large enough to help drive the overnight rate to the bottom of
the corridor.
2.2 Implementation of Monetary Policy in the LVTS
The Bank of Canada typically sets a target rate (i.e. its policy rate) at the
midpoint of a 50-basis-point operating band. Changes in this target for the
overnight rate, through a transmission mechanism, affect other longer-term
market rates, the foreign exchange rate, the aggregate demand and ultimately
inflation.4
The Canadian experience shows that without imposing administrative bur-
dens on financial institutions related to reserve maintenance, a pure rate corri-
dor regime can be highly effective in keeping the overnight interest rate quite
close to the central bank’s policy rate, as well as in providing liquidity to the
money market. The difference between the reference overnight interest rate
and the target rate is considerably lower in Canada than similar measures in
other countries who adopt a rate corridor with reserve requirement.5
In response to the substantial stress in money markets during the recent
global financial turmoil, the Bank of Canada lowered its target for the overnight
interest rate several times, while keeping the spread of the operating band at
50 basis points and the target rate at the midpoint. In addition, given the
increased demand for overnight liquidity during this period, the Bank of Canada
also periodically increased the level of settlement balances. On April 21st,
2009, overall conditions in money markets improved notably as the financial
turbulence began to slowly subside. To preserve the effective functioning of
markets in a low interest rate environment, the Bank of Canada adjusted its
framework for the implementation of monetary policy by setting an effective
lower bound of 25 basis points on the overnight interest rate. As part of this
conditional commitment (conditional on inflation outlook and scheduled to be
withdrawn in June 2010), the Bank of Canada determined to provide excess
4For a more detailed account of the operational framework for the implementation ofmonetary policy in Canada, please see Engert, Gravelle, and Howard (2008).
5Both Whitesell (2006) and Engert, Gravelle, and Howard (2008) show a comparison ofthe volatility of overnight interest rates between Canada and other countries.
6

settlement balances to reinforce the target rate at the bottom of the operating
band, by setting a daily target level of settlement balances in the LVTS at $3
billion, which is unprecedentedly high compared to a small amount of $25 to
$50 million at normal times.6
3 The Model
3.1 The Typical Setting
Whitesell (2006) developed a static model for interest-rate corridor systems,
and this analysis is based mainly on this theoretical representation.
The basic setup of the model is that a financial institution usually has an
approximate idea about its target end-of-day funds position, T , however, not
with perfect certainty. Presumably, there is a random liquidity shock ε that
occurs during the latter part of the day and can be attributed to events such as
unanticipated payment requests from its clients, or accounting-induced delay.
The stochastic estimation error is assumed to have a zero mean, i.e. E(ε) = 0.
Financial institutions trade with each other at the market rate i in the overnight
money market.
Under normal economic conditions where the central bank target rate i∗ is
typically set at the midpoint between the central bank lending rate and deposit
rate, then a representative financial institution, with no prior knowledge of
ε, faces a problem of minimizing two types of costs: (i) the opportunity cost
of depositing a positive settlement balance at its central bank account versus
earing a higher rate i in the market; that is (T +ε)×[i−(i∗−s)], where T +ε > 0;
s is half of the spread between the central bank lending rate and deposit rate.
(ii) the additional cost of taking overnight advances from the central bank
to fulfil its negative settlement obligations as opposed to borrowing from the
market; that is (T + ε) × (i∗ + s − i), where T + ε < 0.7
6Other actions taken by the Bank of Canada include: narrowing the width of the operat-ing band from 50 basis points to 25 basis points, temporarily expanding the list of eligiblecollateral for Special Purchase and Resale Agreements transactions, engaging in multiplerounds of repos to inject extra overnight liquidity, and launching term Purchase and Resale
Agreements operations, etc.7There are two other main assumptions in support of the model. First, a typical financial
institution is indifferent at the margin between dealing with the central bank directly andtrading with other financial institutions in the market. Second, the lending and depositfacilities offered by the central bank are perfect substitutes for the corresponding inter-banktransactions in the overnight market. For more details about the model specification, pleasesee Whitesell (2006).
7
The first-order condition for this minimization problem is derived as follows:
F (−T ∗) =1
2+
i − i∗
2s(1)
where F (·) is the cumulative distribution function of the later-day liquidity
shock ε; T ∗ is the optimal amount of settlement balance for a typical financial
institution.
Therefore, a financial institution’s demand for central bank settlement bal-
ances is simply given by the inverse of equation (1). And the aggregate demand
in the system, denoted by D, is thus obtained by summing the individual de-
mand over all the participants who have access to the central bank liquidity
facilities, indexed by j.
D =∑
j
T ∗
j = −∑
j
F−1j
(1
2+
i − i∗
2s
)(2)
If the liquidity shock ε is assumed to be normally distributed, with zero
mean and non-zero variance σ2, i.e. ε ∼ Φ(0, σ2) and F (−T ∗) = Φ(−T ∗/σ),
then the aggregate demand for central bank settlement balances can be written
as:8
D = −Φ−1
(1
2+
i − i∗
2s
) ∑
j
σj (3)
where σ2j represents the uncertainly of end-of-day liquidity shock faced by fi-
nancial institution j; Φ is the cumulative distribution function (CDF) for the
normal distribution.
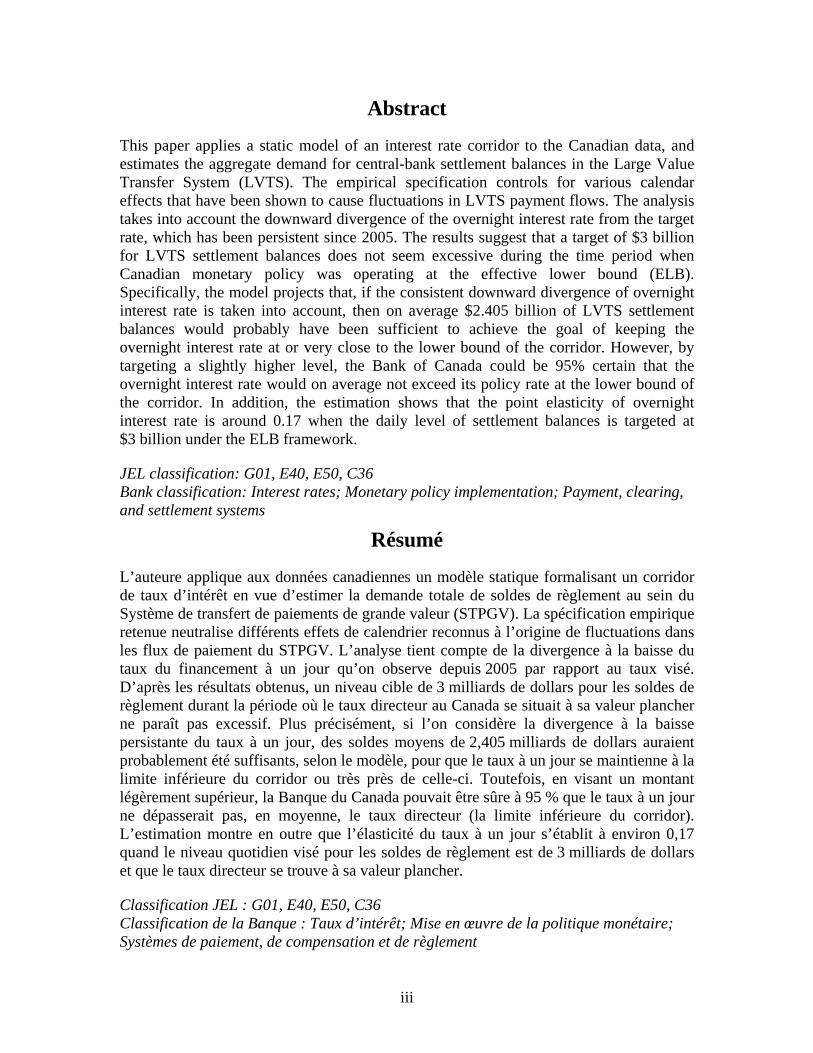
In light of equation (3), the relationship between the overnight interest rate
and the quantity of aggregate demand for central bank settlement balances
can be illustrated by Figure 2. The generally downward-sloping demand curve
becomes increasingly flatter near both boundaries of the corridor. This suggests
that the demand for settlement balances can be positive or negative infinity
when the overnight interest rate asymptotically approaches the central bank’s
lending and deposit rates. The vertical line represents the supply of settlement
balances, solely controlled by the central bank.
Also shown in Figure 2, as the spread between the central bank’s lending
8It is recognized that the normality assumption may not be well justified by the centrallimit theorem in the cases where there are only a small number of financial institutions whosettle their transactions in the books of the central bank. However, it is a simple naturalstart in the absence of a better assumption. Future work can explore alternative choices forthe distribution of the liquidity shock.
8

Figure 2: Interest Rate Corridor - Financial Institution’s Demand forCentral Bank Settlement Balances
T*=0
i*−s’
Deposit Rate(i*−s)
Target Rate(i*)
Bank Rate(i*+s)
i*+s’
Settlement Balances
i
D’’
D
D’
Note: curve D′: increase in spread of the corridor; curve D′′: increase in uncertainties about end-of-day liquidity shocks.
and deposit rates widens, e.g. s′ > s, the demand curve D expands vertically
to position D′, and the interest-rate elasticity of demand decreases near the
target interest rate. Likewise, if the uncertainties about liquidity shocks rise in
the system, the demand curve will be stretched horizontally to D′′ and become
relatively more elastic in the middle.
The Whitesell (2006) model proves one advantage of adopting a pure interest-
rate corridor system; that is, as long as the central bank targets the overnight
interest rate at the midpoint of the operating band, in theory, the demand for
central bank settlement balances should always be close to zero. In addition, the
implementation of this corridor framework turns out to be remarkably simple,
because several variables become inconsequential and can be eliminated from
consideration. The premise of this advantage is the assumption of liquidity
shocks having a symmetric distribution.
To see this, if F (·) in equation (1) is a symmetric distribution with zero
mean, then T ∗ must equal zero when i = i∗. In other words, the central bank
can freely move its target interest rate and/or adjust the spread of the oper-
9
ating band, without worrying about any potential effects of these changes on
the quantity of demand for settlement balances. Furthermore, by establishing
symmetric opportunity costs around its target interest rate, the central bank
can spare the effort of frequently re-estimating the demand curve that will be
shifted by the constantly changing liquidity uncertainties in the system.
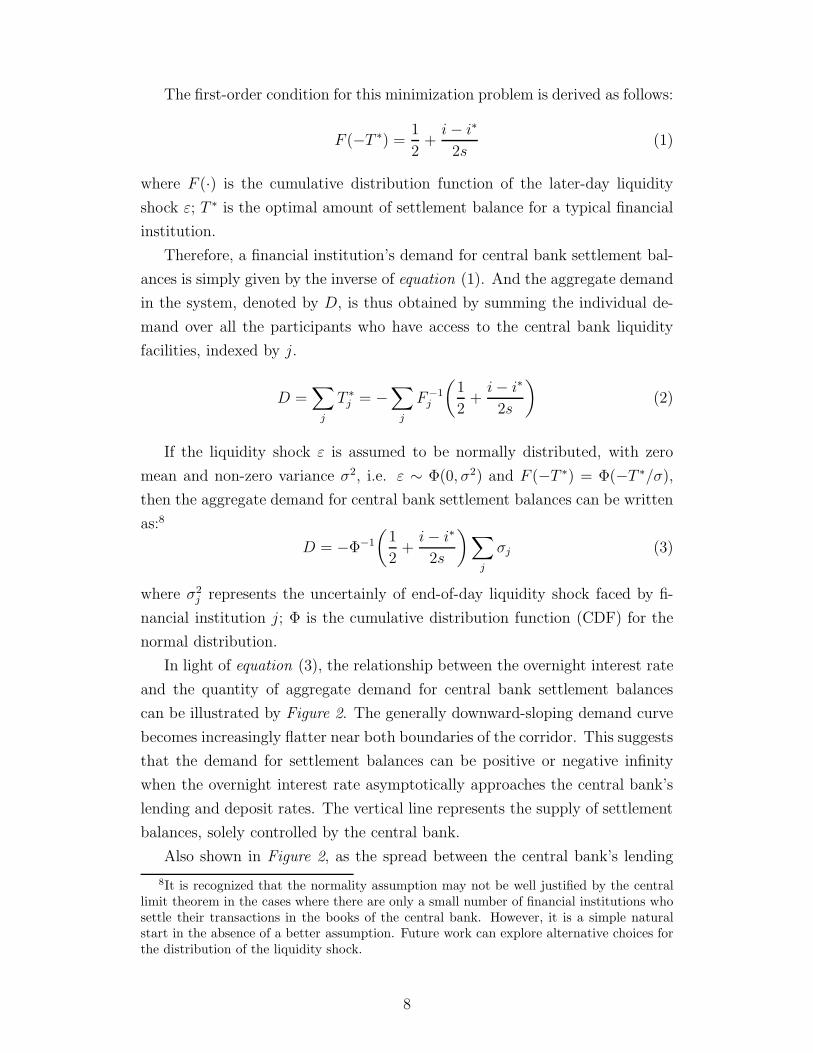
However, one main drawback of an interest-rate corridor system is the in-
tricacy of guaranteeing symmetric opportunity costs around the central bank’s
target rate, which can be attributed to the imperfect substitutability between
central-bank settlement balances and the private supply of broad liquidity,
transaction costs and frictions in the overnight market, etc. Central bank
overnight advances are not completely equal alternatives to market transac-
tions, because interbank loans are in general uncollateralized whereas borrow-
ing from the central bank usually requires good security. Therefore, the actual
market rate may carry a premium reflecting collateral cost and/or credit risk
adjustments. Transaction frictions and costs also weaken the effectiveness of
an interest-rate corridor system. For example, in Canada, central bank liquid-
ity facilities are only accessible to a small number of direct participants in the
LVTS. The majority of financial institutions do not have this option of choos-
ing whether to deal with the central bank in overnight funding or not; hence,
they are more likely to borrow overnight funds from the LVTS participants at
a higher interest rate than the higher-tier interbank lending rate.
One solution for the central bank to overcome this difficulty is to supply
a small positive amount of settlement balances to the financial system, rather
than zero quantity. In fact, the Bank of Canada has been adopting this ap-
proach for many years. Every day, the Bank intentionally leaves a small amount
of excess settlement balances in the LVTS, so that any participant who is in a
net negative funds position at the end of day knows with certainty that there
is at least one other system member holding an offsetting surplus position. It
effectively lowers the possibility of LVTS participants constantly taking small
quantities of overnight advances from the Bank of Canada, when they would
rather absorb the interest-rate differential and other costs than search for trad-
ing partners in the market.
Another limitation of a rate corridor system is the relatively inelastic de-
mand near the central bank target rate, which suggests that a small error in
central bank’s supply of settlement balances can have a great impact on the
overnight interest rate. This is usually the case, but not always. For example,
the target rate can be set at the lower bound of the corridor where the demand
10

curve is almost perfectly elastic.
3.2 Targeting at the Lower Bound
An upsurge in demand for liquidity usually occurs during economic downturns
due to higher investor risk aversion in financial markets. Financial institutions
hoard more liquidity as a precaution and show increasing reluctance to lend.
Individual depositors also tend to hold more central bank bank notes and less
interest-bearing instruments.
High demand drives up the market prices for money. In order to keep
the economy effectively functioning in a low interest rate environment during
difficult times, a central bank could target the overnight interest rate at the
lower bound of the corridor, by supplying a substantially large amount of ex-
cess settlement balances to major financial market participants (also known as
implementation of a “floor system”). In addition to a downward pressure on
the overnight rate, significant holdings of excess central bank balances in the
banking system can help improve market conditions in some other ways. First,
they provide additional stimulus to aggregate demand by encouraging major
financial market participants to purchase financial assets and/or to increase
lending to businesses and households; second, with the overnight funds market
trading near the corridor lower bound, the central bank will be able to take
advantage of the interest-elastic part of the demand curve.
During the most recent global economic recession, The Bank of Canada
adopted such a floor system to help relieve pressures in short-term funding
markets. It narrowed the width of the corridor from 50 to 25 basis points,
lowered the overnight target rate to the deposit rate of 25 basis points, and
tremendously expanded the target supply of LVTS settlement balances from
$25 million to $3 billion dollars. As illustrated in Figure 3, these adjustments
together increased the interest-elasticity of demand for settlement balances.9
According to the Whitesell (2006) model, if the central bank targets the
overnight interest rate at the lower bound of the operating band, a typical
financial institution will face a problem of minimizing two types of costs that
are slightly different from those in the normal setup: (i) (T + ε)× [i− i∗], when
T + ε > 0; (ii) (T + ε) × (i∗ + 2s − i), when T + ε < 0. And the aggregate
9During the financial crisis, the Bank of Canada also took many other actions to mit-igate the substantial stress in the money market, such as conducting multiple rounds ofrepo operations, temporarily expanding the list of eligible collateral for SPRA transactions,launching term PRA operations, and temporarily accepting non-mortgage loan portfolios andUS treasury bills as eligible collateral for SLF advances, etc.
11

Figure 3: Change of Demand for LVTS Settlement Balances in a “FloorSystem” of Canada during the 2007 − 2008 Global Economic Recession
T*=0 T’=3 Billion $
Deposit Rate( (i*)’=0.25 )
Target Rate( i*=0.5 )
Bank Rate’
Bank Rate( 0.75 )
Settlement Balances
i
D
D’
Note: In a floor system, the interest rate paid on deposits at the central bank is pegged at the targetovernight rate.
demand function becomes:
D =∑
j
T ∗
j = −∑
j
F−1j
(i − i∗
2s
)(4)
Note that in equation (2), the demand for settlement balances in a typical
corridor system can be rewritten as:
D =∑
j
T ∗
j = −∑
j
F−1j
(i − (i∗ − s)
2s
)
Recall that s is half of the width of the operating band; therefore, if the central
bank’s target rate i∗ is situated at the mid-point of the band, then i∗ − s is
equal to the deposit rate at the lower bound. In the case of a floor system, by
definition, i∗ itself is the deposit rate.
Let rd denote the interest rate on deposits at the central bank, and rb be
the cost of borrowing from the central bank (e.g. the Bank Rate in Canada).
12
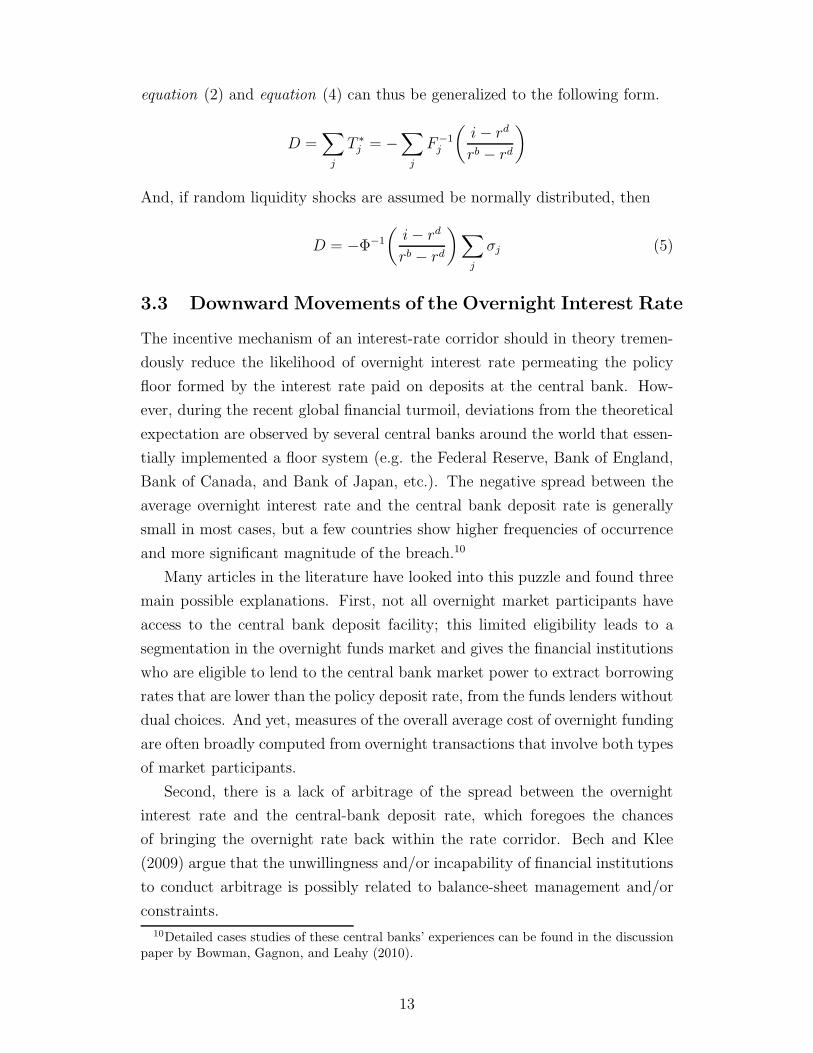
equation (2) and equation (4) can thus be generalized to the following form.
D =∑
j
T ∗
j = −∑
j
F−1j
(i − rd
rb − rd
)
And, if random liquidity shocks are assumed be normally distributed, then
D = −Φ−1
(i − rd
rb − rd
) ∑
j
σj (5)
3.3 Downward Movements of the Overnight Interest Rate
The incentive mechanism of an interest-rate corridor should in theory tremen-
dously reduce the likelihood of overnight interest rate permeating the policy
floor formed by the interest rate paid on deposits at the central bank. How-
ever, during the recent global financial turmoil, deviations from the theoretical
expectation are observed by several central banks around the world that essen-
tially implemented a floor system (e.g. the Federal Reserve, Bank of England,
Bank of Canada, and Bank of Japan, etc.). The negative spread between the
average overnight interest rate and the central bank deposit rate is generally
small in most cases, but a few countries show higher frequencies of occurrence
and more significant magnitude of the breach.10
Many articles in the literature have looked into this puzzle and found three
main possible explanations. First, not all overnight market participants have
access to the central bank deposit facility; this limited eligibility leads to a
segmentation in the overnight funds market and gives the financial institutions
who are eligible to lend to the central bank market power to extract borrowing
rates that are lower than the policy deposit rate, from the funds lenders without
dual choices. And yet, measures of the overall average cost of overnight funding
are often broadly computed from overnight transactions that involve both types
of market participants.
Second, there is a lack of arbitrage of the spread between the overnight
interest rate and the central-bank deposit rate, which foregoes the chances
of bringing the overnight rate back within the rate corridor. Bech and Klee
(2009) argue that the unwillingness and/or incapability of financial institutions
to conduct arbitrage is possibly related to balance-sheet management and/or
constraints.
10Detailed cases studies of these central banks’ experiences can be found in the discussionpaper by Bowman, Gagnon, and Leahy (2010).
13

Third, due to increases in perceived credit risk and concerns about other
market developments during the financial crisis, the frequent lenders in the
overnight funds market may have narrowed down their lists of potential business
partners. This contraction of credit can weaken these lenders’ bargaining power
with the remaining funds borrowers, which results in a lower lending rate than
otherwise.
In a floor system, the interest rate paid on deposits at the central bank is
pegged at the target policy rate. In fact, as the Canadian experience shows,
the downward movements in the overnight interest rate are not exclusive to
the implementation of a floor system. Since the beginning of 2005, the interest
rate in the Canadian overnight market has been consistently drifting below the
Bank of Canada’s target rate, which was always set at the midpoint of the
operating band prior to April 2009. Reid (2007) suggests that the main factor
that drives this persistent downward divergence might be the growing demand
for collateral and the consequent behavioral changes in market participants’
collateral management.
In Canada, two measures of the collateralized overnight interest rate are
used as official estimates of overall conditions in the overnight funds market; and
the Government of Canada marketable debt (collectively referred to as “general
collateral” (GC)) constitutes a major component in the collateral used in the
Canadian overnight market. High demand for the collateral that underlies a
repo transaction generally leads to a lower repo rate. In particular, the market
participants who provide GC (that is in higher demand than other types of
securities) as collateral for an overnight loan of funds are able to obtain lower
borrowing rates. Furthermore, lending excess balances to the central bank is
risk free and thus never collateralized. In the presence of high demand for
collateral, financial institutions are likely willing to loan out their surplus funds
in the overnight market at a lower interest rate (than the central bank deposit
rate), in exchange for holdings of collateral that are much needed in other
financial transactions.11
Repeated incidents of downward movements of the overnight interest rate
suggest that the actual overnight rate i (i.e. not influenced by any downward
11Broadly speaking, the increase in demand for collateral results from more and moreextensive use of it in the past ten years. For instance, collateral management has becomean increasingly important part of risk management; collateral is required to control thecounterparty risks in the emerging financial derivatives markets; the amount of collateralpledged has been fast growing in major settlement and payments systems, e.g. the LVTS,the Canadian Depository for Securities Limited (CDS) and the CLS Bank. For detaileddiscussions, please see Reid (2007).
14

pressure from the factors discussed above) should have been equal to the ob-
served overnight rate i plus the deviations δ between the two, δ = i− i. Rewrite
the function of aggregate demand for settlement balances (under the assump-
tion of normal liquidity shocks, i.e. equation (5)) in terms of the observed
overnight rate.
D = −Φ−1
(i + δ − rd
rb − rd
) ∑
j
σj (6)
An alternative hypothesis leads to the same re-illustration of the model.
That is, due to the consistent downward pressure on the overnight interest rate,
the entire operating band is shifted down by an amount δ, with the effective
cost of borrowing from the central bank being rb−δ and the actual deposit rate
being rd − δ. Thus, the aggregate demand for central bank balances, bounded
by this shifted operating band, is also given by equation (6).
D = −Φ−1
(i − (rd − δ)
(rb − δ) − (rd − δ)
)∑
j
σj
= −Φ−1
(i + δ − rd
rb − rd
) ∑
j
σj
This slightly adjusted demand function provides a feasible solution to over-
coming the difficulty of applying all of the data to the model later in the
regression analysis.
4 Empirical Estimation
4.1 Data Description
The empirical analysis is based on the Canadian experiences of implementing an
interest-rate corridor framework during the period of April 1, 2004 to September
16, 2010. The beginning of the sample is determined by the earliest date from
which the transactional-level LVTS data is available. The payment flows are
needed to compute the actual level of settlement balances in the LVTS. The
end of the sample is the nearest possible date to the time when the analysis
was conducted.
Canada has adopted a pure interest-rate corridor system since the introduc-
tion of the LVTS in 1999. Historical data shows that the Canadian framework
for implementing monetary policy is remarkably effective, compared to other
relatively more complex models, e.g. the reserve-averaging approach. Figure 4
15

shows that the overnight interest rate has been hitting the Bank’s target rate
exactly almost every day, and financial institutions’ demand for settlement bal-
ances is always met by the Bank’s supply.
Figure 4: Histogram of Deviations of the CORRA from the Bank ofCanada Target Rate
Difference between CORRA and the Bank of Canada Target Rate (April 2004 − September 2010)
Fre
quen
cy
−0.4 −0.2 0.0 0.2 0.4
020
040
060
080
010
00
The effectiveness of the Canadian framework for monetary-policy implemen-
tation is the result of interplay of several elements. Most importantly is the
transparency in the LVTS. At the end of every business day, every direct par-
ticipant is aware, with perfect certainty, of every other system member’s funds
position as well as the Bank of Canada’s. The certainty about the quantity
of settlement balances demanded in the system greatly reduces potential er-
rors in supplying the required amount (Recall that the demand curve is mostly
inelastic at the midpoint of the operating band).12
The Canadian Overnight Repo Rate Average (CORRA) is one of the two
measures used by the Bank of Canada as proxies for the overall average cost
of overnight funding, and therefore is used in this analysis as the reference
12To a certain extent, the effective management of settlement balances in LVTS is at-tributed to the fact that there are only a small number of direct participants in the system.
16

overnight interest rate.13 The CORRA is computed as a weighted average of
interest rates on overnight repo transactions involving non-specific Government
of Canada securities, within the time period of 6:00 and 16:00.
Figure 5 presents a picture of movements of the CORRA over the sample
period. It shows that over the course of 2008, the Bank of Canada lowered
its target rate numerous times in response to the tremendous stress in money
markets, until it reaches the lowest possible level in spring 2009. Moreover,
except for the period from April 2009 to June 2010 (the ELB period), the
Bank target interest rate is always set at the midpoint of the operating band.
The graph also shows that, despite the fact that the operating band has been
repeatedly shifted up and down over the course of six years in the sample, the
two limits of the interest-rate corridor move in tandem most of the time; the
spread remains at 50 basis points. The only exception occurs during the time
period when monetary policy was implemented at the effective lower bound.
Figure 5: Bank of Canada Target Rate, Bank Rate, Deposit Rate andthe CORRA
2004 2005 2006 2007 2008 2009 2010
12
34
Date
Ove
rnig
ht In
tere
st R
ate
in C
anad
a (%
)
Bank RateTarget RateDeposit RateCORRA
Note: Between April 2009 and June 2010, the Bank of Canada adopted the Effective Lower Boundframework for monetary policy implementation.
Figure 6 presents a scatter plot of the CORRA (in relation to the lower
13The other measure is the so-called overnight money-market financing rate.
17

bound of the interest-rate corridor) versus the actual level of settlement bal-
ances in the LVTS. It shows two clusters of data points in the sample period:
one is gathered in the intersection area of small amounts of LVTS settlement
balances i.e. between zero and $50 million) and relatively high levels of the
overnight interest rate; the other is located in the region where large quantities
of settlement balances (mostly around $3 billion) crosses very low levels of in-
terest rate. The plot confirms the negative relationship between the quantity
of settlement balances and the overnight interest rate, and an inverted S-shape
demand curve, as proposed by Whitesell (2006), may fit the two clouds of data.
Figure 6: Differences between the CORRA and the Deposit Rate
−2000 −1000 0 1000 2000 3000 4000
0.0
0.1
0.2
0.3
Actual Level of Settlement Balances (Million $)
Dev
iatio
n of
CO
RR
A fr
om th
e Lo
wer
Bou
nd
Note: overall negative relationship between the quantity of settlement balances and the overnightinterest rate.
4.2 Methodology
4.2.1 Generalized Linear Model
Generalized Linear Models (GLMs) are commonly used for modelling binary
outcome variables. In this analysis, GLM provides a simple and convenient
method for capturing the non-linearity of the demand for central bank balances
in an interest-rate corridor system. Specifically, the explanatory variables (xiβ)
18

are mapped to a real number by a linear regression, and this linear predictor
is then used to fit the outcome variable (E[yi]) through a link function. What
makes GLM “generalized” is that the link function can take various forms and
does not have to be linear.14 In the Whitesell (2006) model, the assumption
of normally distributed liquidity shocks gives rise to the choice of probit as the
link function in estimation.
Recall equation (5), the aggregate demand function for settlement balances
under the assumption of normality. And the inverse of this demand function is
given by: (i − rd
rb − rd
)= Φ
(−D∑
j σj
)(7)
Apply GLM to equation (7). The left-hand side corresponds to the response
variable y, i.e. y = i−rd
rb−rd (subscripts i for individual observations being dropped
for simplicity). The dependent variable in this case can be interpreted as stan-
dardized deviations of overnight interest rate from the lower bound of the rate
corridor.
On the right-hand side, the quantity of settlement balances demanded
(adjusted by the aggregate liquidity uncertainties in the system) will be ex-
plained in a linear regression model by a vector of predictor variables, xi i.e.−Di∑
j σj= Φ−1(
ii−rdi
rbi−rd
i
) = −(xiβ + εi) = −ηi. ηi is the so-called linear predictor,
and the probit link function describes the relationship between E[yi] and the
linear predictor.
The persistent downward movements of Canadian overnight interest rate
(discussed in Section 3.3) present a challenge when conducting the GLM esti-
mation on the full set of data. During the period from April 2009 to June 2010,
nearly 84% of the data shows i − rd < 0, whereas the probit function is only
defined within the domain [0, 1].15 However, it does not seem sensible to simply
disregard such a large portion of data, especially when these data of the ELB
framework play a crucial part in identifying the negative relationship between
the overnight interest rate and the quantity of settlement balances (shown in
Figure 6).
14In traditional linear regression models, the link between between E[yi] and xiβ is in-variably identity. The other extension featured by GLMs is that the outcome variable yi isallowed to follow many probability distributions other than the normal distribution, such asthe beta, binomial, multinomial, gamma, Poisson and Dirichlet distributions, etc.
15As previously mentioned, the overnight rate falling below the effective lower bound is aspecial case of their downward divergence from the central bank target rate, because in anELB framework, the target rate is set at the bottom of the operating band. Data shows thatthe total number of such divergence account for 61% of the entire sample.
19

One feasible solution is to base the estimation on the aggregate demand
(for settlement balances) expressed in the function of the observed overnight
rate, i.e. equation (6). Hence, in this analysis the generalized linear model is
specified as the following.
{ηi = xiβ + εi
yi = Φ(−ηi) − ∆i
where
yi =ii − rd
i
rbi − rd
i
and ∆i =δi
rbi − rd
i
The width of the operating band, rb−rd, has only taken two values over the
whole sample period: 0.25 under the ELB framework and 0.5 otherwise. Since
it mainly provides a scaling effect, rb − rd is set equal to 0.25 in the estimation.
It is less straightforward to determine the magnitude of δ, which depends on
the assumptions about the levels at which the overnight rate would have been
in the absence of various sources of downward pressure.
One simple way is to make δ sufficiently large so that all the data points
in the sample will be included in the regression. Or, alternatively, δ can be an
amount such that the majority of observed data will be qualified for estimation,
only with a small fraction excluded and regarded as outliers (even though the
downward pressure on the overnight interest rate has been taken into consid-
eration). Table 1 provides statistics of the negative differences (expressed in
absolute values) between the CORRA and the Bank of Canada target rate,
over the sub-sample period in which an effective lower bound of 25 basis points
was set for the overnight rate. In addition to the average and maximum down-
ward deviations, listed in the table are the percentiles at 50%, 90%, 95%, and
99%. In the GLM estimation, a separate regression is conducted for each of
the percentile values for δ, and the results are then compared based on the
log-likelihood of every estimated model.
In addition, the Gaussian family is specified as the class of GLM, under the
assumption of the error distribution being approximately normal.
4.2.2 Two-stage Estimation with Instrumental Variable
In the linear component of the GLM specification, ηi = xiβ + εi, the vector of
explanatory variables xi includes the observed quantities of settlement balances
SBi and a number of covariates controlling for calendar effects (Ci), open
market buyback operations (Mi), and various stages of the recent 2007− 2008
20

Table 1: Statistics of the Absolute Values of Negative Differencesbetween the CORRA and the Target Rate (in the ELB framework)
50% 90% 95% 99% Mean Maximum
|i − rd| 0.0101 0.0179 0.0207 0.0318 0.0103 0.0476a The interest rate paid on deposits at the Bank rd is pegged at the target rate under theELB framework.b Note: These percentiles are computed over the ELB period (from April 2009 to June2010), and only for the cases where i − rd < 0. i denotes the CORRA.
financial crisis (Fi), i.e. xi = {SBi,Ci,Mi,Fi}.
However, SB is considered to be endogenous, because the overnight interest
rate is jointly determined by the interaction of supply and demand of settlement
balances. Specifically, the Bank of Canada adjusts the supply of settlement
balances to accommodate expected changes in demand, and to prevent the
overnight interest rate from moving too far away from the its target rate. The
observed pairs of the overnight interest rate and the level of settlement balances
represent the equilibria over time in the overnight funds market.
To address the concern of endogeneity, the instrumental variable (IV) method
is applied in the regression analysis which results in a two-stage estimation.
Since demand elasticities are the subjects of interest in this study, a variable
that alters the supply of settlement balances is needed to trace out the demand
curve. A valid supply shifter is required to have no correlation with movements
in demand, but only affecting the changes in supply.
The transaction amount at the daily auctions of the Federal Government of
Canada’s Receiver General (RG) account balances appears to be a natural can-
didate for the supply shifter. Because the Bank of Canada neutralizes the net
impact of public-sector payment flows by transferring the government’s deposits
from/to the government’s account at the Bank of Canada to/from those at the
LVTS participants; and the transfer is made through twice-a-day RG auctions,
at 9 : 15 and 16 : 15 respectively. The degree of neutralization determines
the Bank’s target level of settlement balances in the LVTS. For example, a full
neutralization of public-sector transactions leaves zero settlement balances in
the LVTS. And a positive excess of settlement balances can be generated by
the Bank transferring more government deposits to the participants than the
amount required by a complete neutralization.16
16Public-sector payment flows affect the LVTS settlement balances because when the gov-
21

Specifically, the PM RG auction amount is used in this study as an instru-
ment for the supply of LVTS settlement balances, since all transactions with
regards to government disbursements and receipts are cut off at 15 : 00 each
day; and by the time of PM RG auction, the Bank of Canada knows with cer-
tainly the exact net impact of public-sector payment flows and thus can finalize
its decision about the desired level of settlement balances for that day.17
The two-stage estimation is conducted as follows. In the first stage, us-
ing the ordinary least squares method, regress the actual level of settlement
balances on the instrumental variable and a set of covariates.
SBi = β0 + β1 · RGi +∑11
s=1 βs2 · C
si +
∑3s=1 βs
3 · Msi
+∑5
s=1 βs4 · F
si + εi
(1st stage)
where i denotes an individual data observation; β0 is the intercept to capture
fixed effects. RG is the issue amount at PM RG auctions; C is a set of 12
calendar dummies that captures fluctuations in LVTS payment flows at different
times of a year; it includes days of the week (Mondays, Wednesdays, every
second Thursdays and Fridays), US holidays, the beginning and end of each
month, corporate and fiscal year end, etc. F is a vector of dummy variables for
5 stages of the recent financial crisis, including the ELB period; the duration
of each stage prior to the ELB period is listed in Table 5 in the appendix. M
is a set of 3 indicator variables for open market operations conducted by the
Bank of Canada: SPRAs, SRAs and term PRAs. Definitions of these control
variables and the rationale for including them in the estimation are elaborated
in the appendix.
In the second stage, using GLM, regress the transformed overnight inter-
est rate (measured by the CORRA) on the fitted values from the first-stage
regression (SBi), as well as on the same set of covariates as in the first-stage
ernment makes disbursements from its account at the Bank of Canada, e.g. to pay for theirexpenditures, it increases deposits at financial institutions and adds to the settlement bal-ances; conversely, a net government receipt of payments will withdraw liquidity from thefinancial system and reduce the settlement balances.
17In addition, there are two major differences between AM and PM RG auctions. First,AM auctions are accessible to a broader group of financial institutions, whereas afternoonauctions are restricted to LVTS participants. Second, since 2002, part of the morning auctions(beyond a certain threshold) require collateral, while PM auctions remain uncollateralized;however, no statistics have suggested any link between the repo-like nature of AM auctionsand the movements of the CORRA.
22

equation.
ηi = γ0 + γ1 · SBi +∑11
s=1 γs2 · C
si +
∑3s=1 γs
3 · Msi
+∑5
s=1 γs4 · F
si + ξi
yi = Φ(−ηi) − ∆i
(2nd stage)
4.3 Regression Results
Regression results of both stages are presented in Table 2. The issue amount at
daily PM RG auctions is shown negatively related to the actual level of settle-
ment balances in the LVTS, which is not readily inferable from an operational
point of view. Precisely speaking, the net amount auctioned (i.e. the difference
between the gross amount issued at both AM and PM RG auctions and the to-
tal value maturing on that day) consists of two components: the neutralization
of public-sector transactions in the LVTS and the Bank of Canada’s desired
change in the level of settlement balances for that day.
However, the results show a significantly strong correlation between PM RG
auction issue amount and the actual level of settlement balances. As proposed
by Stock and Yogo (2005), one simple way to test for instrument relevance is
to make use of the first-stage F statistic. Implementations of the F -statistic
approach depend on users’ definitions of weak (or strong) instruments. For
example, an instrumental variable can be deemed as non-weak, if the first-stage
F statistic is sufficiently large such that no more than a certain percentage (e.g.
10%) of the time, a conventional Wald test of the null hypothesis that θ = θ0
(e.g. at significance level of 5%) will be rejected, where θ is the estimate of
the parameter of interest (i.e. the coefficient of the endogenous regressor in the
structural equation) and θ0 is the proposed value under the null hypothesis.18
Stock, Wright, and Yogo (2002) provide critical values of the first-stage F
statistic (in a two-stage least squares (TSLS) regression) for testing the null hy-
pothesis that instruments are weak. In the case of a single endogenous regressor
treated with a single instrumental variable, the weak-instruments critical value
for the F statistic is 16.38, if the desired maximal rate of rejection (of a 5%
Wald test that θ = θ0) is 10%. Specifically, it means that if the first-stage
F statistic exceeds this critical value, then one can reject the null hypothe-
sis of weak instruments. The first-stage estimation in this study shows that
18Alternatively, weak instruments can be detected and tested based on the relative bias
between the ordinary least squares (OLS) and the TSLS estimators. For more details onvarious methods of testing for instrument relevance, please see Stock and Yogo (2005) andStock, Wright, and Yogo (2002).
23
F = 32.49, suggesting no evidence of PM RG auction amount being a weak
instrument.19
The Pregibon goodness-of-link diagnostic test is conducted to examine the
suitability of the probit link function that is used to relate the mean of the
overnight interest rate to the chosen set of explanatory variables. The test
result shows that the p-value is 0.6477, suggesting no evidence against the null
hypothesis that it is a reasonable fit of the regression model with probit link
specification.20
Estimated effects of most control variables in the first-stage regression show
expected signs and many are statistically significant. The beginning and end
of each month, the fiscal year end for financial institutions, the four stages of
the 2007 − 2008 financial crisis, and the ELB time period all show positive
correlation with the amount of settlement balances in LVTS, as they indicate
the days on which there is a higher-than-usual demand for intraday liquidity.
Correlations between several variables and LVTS settlement balances turn
out opposite to the expectations. For instance, the demand for LVTS settlement
balances seems to shrink a little on Wednesdays, despite the anecdotal evidence
that larger transaction volume usually occurs on the third Wednesday of each
quarter-end month. In addition, rather than a catchup effect, the results show a
possible continuation of slowdown in business activity on the first business day
following a Canadian statuary holiday. The corporate year-end effect, which
is expected to be positive, might be offset to a certain degree by the fact that
every year end is also a big holiday season during which LVTS transaction
activities may slow down.
SPRA and SRA operations are the reverse of each other, and as expected,
they show opposite relationship with the level of LVTS settlement balances
in the regression. The operation and announcement dates of term PRA are
both found statistically insignificant in explaining the level of LVTS settlement
balances.
In the second-stage GLM regression, δ = 0.0476, allowing all the data points
to be included in the estimation. The level of LVTS settlement balances is
19In comparison between two linear models where the difference is only in one variable,the test statistic has an F-distribution with only 1 degree of freedom in the numerator; andhence, the value of the F -test statistic is simply the square of the Student’s t statistic forthe variable being tested. In this study, the results of first-stage estimation show that thet statistic for PM RG auction is −5.70; therefore, F = 32.49 for the F -test of the nullhypothesis that θ = θ0.
20An interested reader can refer to Pregibon (1980) for further details of goodness-of-linktests for GLMs.
24

found to be statistically significant only at the 1% level; however, the weak
relationship is not entirely unexpected, because the supply of LVTS settlement
balances does not actually respond to the demand on an intraday basis. The
Bank of Canada typically sets a target level of LVTS settlement balances for
a long period of time and only makes temporary seasonal adjustments. Many
control variables such as the beginning and end of each month, Government
of Canada Treasury Bill (T-Bill) auction settlement dates, different stages of
the financial crisis period and the Bank of Canada intervention operations, etc.
also show significant correlations with the overnight interest rate.
The coefficients in the second-stage results (shown in Table 2) are estimated
effects of right-hand-side (RHS) variables on the scale of the linear predictor
η. Given the probit link used in the GLM, the marginal effect of a continuous
explanatory variable, xk , on the response variable is given by:
∂y
∂xk
= −φ
( K∑
k=1
βkxk
)βk
where K is the total number of independent variables included in estimation.
Recall that the response variable y in the GLM regression is i−rd
rb−rd ; hence,
the marginal effect of xk on the observed overnight interest rate i becomes:
∂i
∂xk
= −
(rb − rd
)φ
( K∑
k=1
βkxk
)βk (8)
As opposed to partial derivatives, the marginal effect of an indicator variable
(i.e. a binary explanatory variable), xj , is derived from the partial difference; i.e.
the change in the response variable when the inverse link function is evaluated
at xij = 1 and xij = 0, respectively, with all other RHS variables held constant
at the same values. Therefore, in this study, the marginal effect of a dummy
control variable on the observed overnight interest rate i is given by:
(rb − rd
)[Φ
(− x1jβ
)− Φ
(− x0jβ
)](9)
where x1jβ is the vector of regressor values with xij = 1, and x0jβ is the same
vector of regressor values with xij = 0; all other regressors take the same fixed
values. Subscripts for observations are dropped for simplicity.
Both Equation (8) and (9) show that marginal effects in probit-link linear
models depend on the values of RHS variables.Table 3 compares the marginal
25

Table 2: Two-stage Regression Results
This table reports coefficient estimates of two-stage regressions. The first stage is the ordinary least
squared (OLS) regression of the actual level of settlement balances (SB) on the instrumental
variable (issue amount at PM RG auctions) and various calendar effects. The second stage is a
GLM regression of the standardized deviations of the overnight interest rate from the lower bound,(i−rd
rb−rd
)on the fitted value from the first stage (SB), as well as on the same set of calendar
dummies. All control variables are defined in the Appendix. Data of daily frequency is used and
robust standard errors are reported in parentheses.
Stage (I)b Stage (II) c Stage (I) Stage (II)
OLS (SB) GLM(
i−rd
rb−rd
)OLS (SB) GLM
(i−rd
rb−rd
)
Constant 101.7477*** -0.4630*** corpYearEnd -8.2293 0.0105
(15.7860) (0.0074) (56.1589) (0.0291)
pmAuction -0.0820***x
fcPeriod0 196.2050*** 0.0658**
(0.0144) (26.0663) (0.0212)
SBx
0.00023* fcPeriod1 130.0574*** -0.0488**
(0.0001)d (29.1223) (0.0185)
Monday -6.6691 0.0044 fcPeriod2 48.7297* -0.0341**
(17.0008) (0.0088) (21.5191) (0.0113)
Wednesday -22.3763 0.0146 · fcPeriod3 32.5250 0.0074
(16.1688) (0.0085) (28.9998) (0.0145)
Thursdaye 6.0926 -0.0288** spra 276.3013*** -0.2350***
(20.6163) (0.0107) (22.6861) (0.0320)
Friday -1.9144 -0.0081 sra -29.3169 0.2500***
(16.4554) (0.0085) (23.8949) (0.0123)
usHoliday 10.8039 -0.0119 fad 43.0984 -0.0308 ·
(38.8492) (0.0209) (33.1906) (0.0177)
canHolPlusOne -61.3611* 0.0158 termPra -17.8439 0.0338**
(30.8493) (0.0171) (22.7967) (0.0131)
monthBegin 55.7435* -0.0395** termPraAnn -33.8998 -0.0150
(27.8875) (0.0148) (45.5183) (0.0249)
monthEnd 12.2823 -0.0277** elbPeriod 2914.9337*** 0.7860**
(20.1837) (0.0106) (16.0265) (0.2700)
fiYearEnd 117.2013* -0.0442
(47.8561) (0.0274)
a Note: (·), (∗), (∗∗) and (∗ ∗ ∗) represent statistical significance at the 5, 1, 0.1 and less than 0.1 percent level, respectively.b For the first-stage OLS regression, residual standard error is 223 on 1596 degrees of freedom (67observations deleted due to missing values); the adjusted R-squared is 0.96; F-statistic is 1840 on 21and 1596 degree of freedom; p-value is < 0.0000.c The GLM regression is based on equation (6), where δ = 0.0476. Dispersion parameter for Gaussianfamily is taken to be 0.0016; Null deviance is 65.2259 on 1613 degrees of freedom; Residual deviance is2.4677 on 1592 degrees of freedom; 71 observations deleted due to missing values and AIC = −5838;the number of Fisher Scoring iterations is 4.d The standard error of the coefficient estimate for LVTS settlement balances, 0.0001, has been correctedto account for the fact that predicted (instead of observed) values of settlement balances are used inthe second-stage estimation. It is obtained from scaling the original unadjusted standard-error estimate(0.00009) by the ratio of two residual standard deviations: one is from the GLM prediction equation thatis based on the actual level of settlement balances (not the fitted value from the first-stage regression),and the other is the residual standard deviation of the second-stage regression itself (0.0394).e The binary variable Thursday indicates the settlement dates for bi-weekly auctions of Government ofCanada Treasury Bills. It takes value of 1 every second Thursday, starting on April 8th, 2004.
effects of certain explanatory variables between two circumstances: (i) normal
economic conditions where the Bank of Canada typically targets its supply of
26

LVTS settlement balances at a small positive quantity of 25 million dollars,
and the spread of the operating band is 50 basis point. (ii) the ELB framework
under which the target level of settlement balances is increased to $3 billion, and
the band width is narrowed down to 25 basis points. The indicator variables
shown in the table are selected based on two criteria: first, they are relevant
in both settings; second, they are statistically significant at the second stage of
estimation.
Table 3: Marginal Effects of Selected Variables on theObserved Overnight Interest rate: normal times versusthe ELB framework
Normal Conditions ELB Framework
SB = $25 million SB = $3 billion
SB -0.00004 -0.000014
Wednesday -0.0026 -0.0009
Thursday 0.0051 0.0017
Month begin 0.0070 0.0024
Month End 0.0049 0.0017
FAD 0.0055 0.0019
SPRA 0.0397 0.0157
SRA -0.0471 -0.0130
Term PRA -0.0061 -0.0020a Note: The marginal effect of LVTS settlement balances, under bothcircumstances, is calculated when none of the control variables (for calendareffects and open market operations) takes value of 1.b However, under the ELB framework, the variable controlling for this timeperiod (“elbPeriod”) is set to 1.c rb
− rd = 0.5% under normal economic conditions; rb− rd = 0.25% in the
ELB framework.
The results suggest that on a typical business day without any calendar
events and intervention operations (i.e. none of the indicator variables takes
value of 1), when the daily level of LVTS settlement balances is targeted at
$25 million, a one-million-dollar increase in the amount of settlement balances
would cause a decrease of overnight interest rate by 0.004 basis points, ceteris
paribus. Likewise, at the beginning (end) of each month, with all other variables
held constant, the overnight interest rate would on average go up by 0.7 (0.49%)
basis points, relative to other times of year. Similar effects show up on every
second Thursday in each calendar year; i.e. the settlement date for T-Bill
27

auctions tends to place an upward pressure on the overnight rate, an increase
of 0.51 basis points on average, while other factors remain fixed.
As expected, Term PRA operations show a statistically significant and neg-
ative impact on the overnight interest rate. However, the control variables for
SPRA and SRA operations seem to vary systemically with the overnight rate.
In these cases, the coefficent estimates do not represent the causal effects of
the two open market buyback operations on the overnight interest rate. This
endogeneity issue is undoubtedly unsatisfactory and future work on improving
the results should look into different estimation methods or finding additional
instruments to eliminate it.
In addition, the second-stage regression results do not show evidence of
mounting pressures in the overnight funding markets during the first stage of
the financial crisis (from the onset of the crisis to mid-December of 2007).
This could imply a transition period for behavioural changes, meaning that it
possibly takes time for liquidity hoarding and precautions in inter-bank lending
to intensify and drive up the cost of overnight funding.
The marginal effects of the variables shown in Table 3 are all smaller in the
ELB framework than those under normal conditions; for example, the overnight
interest rate would drop by only 0.0014 basis points in response to a one-million-
dollar increase of LVTS settlement balances. This is both because the demand
curve becomes flatter when it is close to the lower bound of the corridor, and
because the corridor is narrower in the ELB setting. Hence, the settlement-
balance-elasticity of overnight interest rate might be a more useful measure to
gauge the responsiveness of the overnight rate to a change in the level of LVTS
settlement balances. It is defined as follows:
Ei =
(∂i
∂SB
)(SB
i
)
Data shows that, during the ELB period, the average overnight interest
rate is 0.2416%, and the average actual level of settlement balances in LVTS is
$2967.11 million. Hence, the elasticity of overnight interest rate is estimated to
be −0.1689. It is a common practice to ignore the negative sign when analyzing
elasticities between price and demand. The result suggests that during the
time period when Canadian monetary policy was implemented in the ELB
framework, a one percent change in the amount of LVTS settlement balances
would prompt an approximately 0.17 percent change in the overnight interest
rate. The result supports the theory that when the overnight rate is targeted
28

at the lower bound of the corridor, it is generally settlement-balance inelastic,
i.e. not sensitive to changes in LVTS settlement balances.
Figure 7: Estimated Demand for LVTS Settlement Balances
3.8
4.0
4.2
4.4
4.6
4.8
Standard Interest Rate Corridor
Settlement Balances (Million $)
Ove
rnig
ht In
tere
st R
ate
(%)
−10000 −7000 −4000 −1000 1000 3000 5000 7000 9000 11000
0.1
0.2
0.3
0.4
0.5
0.6
Effective Lower Bound Operating Framework
Settlement Balances (SB) (Million $)
Ove
rnig
ht In
tere
st R
ate
(%)
−10000 −7000 −4000 −1000 1000 3000 5000 7000 9000 11000
Estimated On−target SB = 2405
Note: the black curve portrays the estimated demand for LVTS settlement balances from May 24th
2006 to July 9th 2007, a period prior to the outbreak of the recent global financial crisis; the purplecurve describes the estimated demand during the first stage of financial crisis and the brown curve(in the bottom panel) is the estimated demand for the time period when the ELB framework wasimplemented. The solid vertical blue line marks the Bank of Canada’s daily target supply of $3 billionfor LVTS settlement balances during the ELB period, and the dashed vertical blue line indicates thelevel of LVTS settlement balances at 2.405 billion, the estimated amount that is required to exactlyachieve the overnight target rate at 25 basis points. The black circles represent the CORRA (daily).The dashed curves are 95% confidence intervals for the predictions from the GLM regression model.
29

Figure 7 plots the estimated demand for LVTS settlement balances during
three different time periods (excluding all calendar effects): a representative
pre-financial crisis period (e.g. from May 24th, 2006 to July 9th, 2007), the
first stage of the financial crisis and the time period during which Canadian
monetary policy was implemented in an ELB framework. The black circles
in the figure are a scatter graph of the CORRA at each actual level of LVTS
settlement balances.
The estimated demand curves for the first two periods are shown in the
upper panel of Figure 7, representing the standard corridor system with the
target rate set at the mid-point of the operating band. The black curve portrays
the estimated demand for LVTS settlement balances immediately prior to the
outbreak of the recent global financial crisis, when the Bank Rate was at 4.5%
and the deposit rate equal to 4%. The purple line describes the estimated
demand during the first stage of the financial crisis (as defined in the Appendix),
with the operating band placed between 4.25% and 4.75%.
The lower panel illustrates the estimated demand for LVTS settlement bal-
ances over the period from April 21st, 2009 to May 31th, 2010. In this ELB
framework, the Bank of Canada set its target rate at the lower bound of the
corridor: 0.25%. It shows that, if the consistent downward divergence of the
CORRA from the target rate is taken into account, then $2.405 billion of LVTS
settlement balances would probably have been sufficient to achieve the goal of
keeping the overnight interest rate at or very close to the lower bound of the
corridor.
The dashed curves in the figure are 95% confidence intervals for the esti-
mates of overnight rate from the GLM regression model. In all three cases, the
confidence intervals are most narrow in the areas where observed data is concen-
trated, indicating that the closer the given amount of settlement balances is to
its sample mean, the smaller the estimation error becomes. Figure 8 provides a
close-up view of the lower panel in Figure 7. The plot suggests that if the Bank
of Canada had supplied $2.405 billion daily for LVTS settlement balances over
a fairly large number of days in the ELB framework, then on average 95% of
the overnight interest rates would have fallen within the range between 0.2432%
and 0.2574%. This might not be very desirable, because half of the time the
overnight rate would have been above the Bank’s policy rate 0.25%. However,
if the level of LVTS settlement balances is targeted at a slightly higher level,
e.g. $3 billion as actually implemented, then with a 95% level of confidence,
the Bank could expect that the overnight rate would not exceed its target but
30

be located within the prediction bounds of 0.2399% to 0.2426%.
Figure 8: A Close-up Look at 95% Confidence Intervals for Predictionsof Overnight Interest Rates in the ELB Framework
0.22
0.23
0.24
0.25
0.26
0.27
0.28
Effective Lower Bound Operating Framework
Settlement Balances (SB) (Million $)
Ove
rnig
ht In
tere
st R
ate
(%)
2000 2405 3000 3500 4000
LL= 0.2432
UL= 0.2574
LL= 0.2399
UL= 0.2426
Parameters in a GLM are estimated with maximum likelihood techniques.
The residual deviance and the AIC (a version of Akaike’s An Information Cri-
terion), both computed based on the model’s log-likelihood, are measures of
goodness of fit of the overall model. In a GLM, the difference in deviance be-
tween any two models is the likelihood ratio test statistic and approximately
follows a chi-squared distribution, with degrees of freedom equal to the differ-
ence in degrees of freedom between the two models.21
Table 4 provides a comparison of competing models estimated with different
values for δ (i.e. the percentiles of downward deviations of the CORRA from the
target rate, listed in Table 1). The model specified with δ = 0.0476 (including
every data point in the sample) shows the highest log-likelihood score. The
column of p-value (the probability of obtaining the χ2 test statistic) indicates
21Under usual circumstances, model comparison is conducted between two models withdifferent number of parameters; hence, the null hypothesis in the likelihood ratio test statesthat the model with fewer parameters, relative to the other model, is true. In this paper,model specifications are the same across all the models in comparison, in terms of the numberof parameters; and the only difference lies in the various values taken by δ.
31

whether a model fits data better than the model immediately above. It shows
that model No.1 and No.2 are statistically equivalent, and the same is true of
the last two models; and there is a significant improvement in goodness of fit
when 99%, versus 95%, of data is included in the estimation.
Table 4: Comparison of Regression Models Estimated with Different δ Values
Model Percentiles δ Log-likelihood Deviance p − value1 50% 0.0101 2709.93 2.3247 NA2 Mean 0.0103 2712.04 2.3253 15.72493 90% 0.0179 2902.83 2.4163 0.00004 95% 0.0207 2922.67 2.4409 0.00005 99% 0.0318 2935.39 2.4730 0.00006 Max 0.0476 2938.13 2.4788 0.4985
5 Concluding Remarks
This paper aims to estimate the aggregate demand for LVTS settlement bal-
ances, based on the static model proposed by Whitesell (2006). The regression
analysis controls for a group of calendar events that affect LVTS intraday pay-
ment flows and several time periods of unusually high funding pressures in the
overnight market.
The results suggest that a target of $3 billion for LVTS settlement balances
does not seem excessive during the period when Canadian monetary policy is
operated at the effective lower bound. Specifically, the model projects that, if
the consistent downward divergence of the CORRA from the target rate is taken
into account, then $2.405 billion of LVTS settlement balances would probably
have been sufficient to achieve the goal of keeping the overnight interest rate at
or very close to the lower bound of the corridor. However, by raising the target
to a slightly higher level, e.g. $3 billion, then with a 95% level of confidence,
the Bank could expect that the overnight rate on average would not exceed its
policy rate. Furthermore, when an effective lower bound of 25 basis points was
set on the overnight interest rate and excess settlement balances (targeted at a
daily level of $3 billion) were provided in the LVTS, the point elasticity of the
overnight rate is estimated to be 0.1689.
One main concern in this analysis is the potential problem that two of the
control variables (for SPRA and SRA operations) are likely influenced by the
32

outcome variable. The results shall be interpreted with caution, since the esti-
mation is conditioned on the endogenous variation of the two control variables.
Search for additional instrumental variables is often difficult; other methods
such as nonparametric matching could be possible solutions.
Other steps in future work might include first, expanding on the scope of
this paper by estimating two separate equations for normal economic conditions
and the state of financial stress, respectively. The estimation conducted in
this study currently relies on dummy variables for various stages of the recent
financial crisis; however, in reality, it is often unclear during the course of
events, which phase of new market developments the economy currently resides
in. Therefore, a refined estimation can improve the robustness of the results and
possibly make the demand model for settlement balances a more effective policy
tool;22 second, finding an alternative instrument variable for LVTS settlement
balances, in response to the argument that the issue amount at PM RG auctions
may not be absolutely exogenous to the demand.23
22At present, in the context of LVTS, separate modelling might be challenged by the lack ofdata support. The negative relationship between the overnight interest rate and the quantityof settlement balances may not be easily identified, due to highly limited variation in thequantity of settlement balances.
23Attempts have been made using the forecast error of Government of Canada paymentreceipts and disbursements (i.e. the Bank of Canada internal data on the differences betweenthe actual and predicted government payment flows) as an instrument for LVTS settlementbalances, however, the regression results are substantially identical to what is presented inthis paper.
33

Appendix: Control Variables
In addition to the explanatory variable of interest: the actual level of settlement
balances in LVTS, a group of dummy variables are included in both stages of the
regression as covariates, to control for (i) calendar effects of numerous events
throughout a year on LVTS transaction flows. A larger demand for settlement
balances is usually prompted by a higher level of payment activity in LVTS;24
(ii) the liquidity impact of the Bank of Canada intervention actions (aimed at
reinforcing the target rate and stabilizing the financial markets); and (iii) the
time periods of extraordinarily high funding pressures in the overnight market.
Mondays, Wednesdays and Fridays These week-day dummy variables are
included to capture certain weekly pattern in LVTS transactions. Pay-
ment flows are in general believed to be more concentrated on Mondays
than on Fridays, for example. Historical data also shows larger trans-
action volume in the LVTS on the third Wednesday of each quarter-
end month, though no sensible explanation has been identified yet. The
dummy variable for Wednesday in this analysis, however, indicates the
middle of every week in the sample.
Thursdays A binary variable that indicates the settlement dates for auctions
of Government of Canada Treasury Bills (T-Bills). In the sample period
used in this analysis, the variable takes value of 1 every second Thursday,
starting on April 8th, 2004. Since the fall of year 1997, auctions of T-Bills
take place on Tuesdays and settle on Thursdays, on a bi-weekly basis.
On these auction settlement days, payment flows from LVTS direct par-
ticipants to the Bank of Canada are expectedly larger than usual, which
hence increases the demand for intraday liquidity and puts an upward
pressure on the overnight interest rate.
US holidays and the next day after Canadian statuary holidays An in-
crease in LVTS payment flows is usually expected on the first business
day following a Canadian federal statuary holiday, due to a carryover
of transactions from the break. The regression in this analysis takes into
account the following Canadian statuary holidays: New Year’s Day, Fam-
ily Day, Good Friday, Victoria Day, Canada Day, Civic Holiday, Labour
24A Bank of Canada internal study by Arjani (2004) looked into various calendar events inestablishing a benchmark for LVTS payment activity. The estimates of these calendar effectson intraday payment flows are found to be statistically significant in general.
34

Day, Thanksgiving Day, Remembrance Day and Boxing day. Likewise,
the close trading relationship between Canada and the United States
leads to an expected decrease in LVTS payment activity on a U.S. na-
tional holiday. The indicator variable usHoliday in this paper identifies
eight U.S. national holidays during which LVTS is operational: Martin
Luther King, Jr. Day, President’s Day, Memorial Day, Independence
Day, Columbus Day, Veteran’s Day and Thanksgiving Day.
Month begin and month end The beginning and end of each month indi-
cate the first and last two business days of the month. Many bill payments
become due at the end of each month, e.g. payments for mortgages, rent
and government taxes on income and sales, etc. Hence, the LVTS partic-
ipants in general face an increase of account uncertainty at each month
end, and the Bank of Canada usually temporarily expands the supply of
settlement balances above its normal level. Higher transaction volume
and value also occur at the beginning of each month, largely owing to the
carryover from the previous month end. In addition, the redemption of
the Government of Canada marketable bonds at maturity mostly takes
place on the first business day of March, June, September and December,
and noticeably increase the payment flows in LVTS on those days.
Corporate and financial year end October 31st each year is the fiscal year-
end for Canadian financial institutions. On several days surrounding this
book-closing date, the intense year-end accounting activities tend to in-
crease transaction volume in LVTS and drive up the participants’ demand
for liquidity. Hence, on these days, the Bank of Canada usually raises its
target level for LVTS settlement balances to alleviate the mounting pres-
sures on the overnight interest rate. The dummy variable fiYearEnd in
this analysis indicates four days of each year: October 29th, 30th, 31st and
November 1st. For the same reason as above, the regression also controls
for the fiscal year end for most Canadian corporations (corpYearEnd),
which is defined in this study as the four business days surrounding the
end of each calendar year, i.e. the last two business days in December
and the first two business days in January of the following year.
Financial crisis period{0-3} Liquidity conditions started improving slowly
in early 2009. The period of 2007− 2008 global financial crisis is divided
into four stages (inclusive on both ends) as listed in Table 5. The break-
points correspond to the moments of peaking pressures in the short-term
35

funding market, which were marked by several significant incidents such
as the first joint effort by central banks around the world to inject addi-
tional liquidity into the money markets, the collapse of Bear Stearns, the
bankruptcy of Lehman Brothers and the government bailout of American
International Group, Inc. (AIG), etc.
Table 5: Stages of the 2007 − 2008 Global Financial Crisis
period 0 August 9th, 2007 ∼ December 12th, 2007period 1 December 13th, 2007 ∼ March 16th, 2008period 2 March 17th, 2008 ∼ September 16th, 2008period 3 September 17th, 2008 ∼ December 31st, 2008
SPRA and SRA Two dummy variables are used to indicate the days in the
sample on which the fine-tuning market operations are conducted to re-
inforce the target overnight rate during the course of a day. The Bank of
Canada’s ability to intervene in the overnight funds market with buyback
operations at its target rate is one of the key features of its monetary-
policy implementation framework. Specifically, if the overnight market is
consistently trading above the target rate, then the Bank will inject liq-
uidity with Special Purchase and Resale Agreements (SPRAs); conversely,
Sale and Repurchase Agreements (SRAs) will be invoked to withdraw liq-
uidity, if the overnight rate is constantly trading below the target. During
the recent financial crisis, these fine-tuning facilities were more extensively
used than under normal circumstances, to stabilize the financial system.
Term PRA It indicates the days in the sample on which there are term Pur-
chase and Resale Agreements (term PRA) operations.25 Term PRA is
an important liquidity facility frequently used during the recent global
financial crisis. On December 12th 2007, the Bank of Canada joined in an
international collaboration among many other central banks around the
world (e.g. the Bank of England, the European Central Bank and the
Federal Reserve, etc.), to launch term PRA operations that were aimed to
25Three main characteristics of term PRA operations, in contrast to the Bank’s regularSPRA operations are: (i) funds are lent out for a period longer than overnight; (ii) a widerrange of securities are accepted as collateral than those eligible for SPRA; and (iii) therates on transactions are not fixed at the target overnight rate but determined through acompetitive auction process.
36

alleviate pressures in short-term funding markets.26 It was re-introduced
in March 2008 as part of another international joint program by G10
central banks, and again in September 2008 when the financial market
turmoil reached another peak. More importantly, during the ELB period
when the Bank made a conditional commitment to keeping a low interest
rate environment for the economy, term PRA (with the minimum and
maximum bid rates matched to the Bank rate and the deposit rate, re-
spectively) played a double role, not only as a liquidity facility, but also
as a supplementary tool for monetary policy implementation.
Fixed announcement dates (FAD) It indicates eight “fixed” or pre-specified
dates in the course of a year, on which the Bank of Canada announces
its decisions on any changes to the target for the overnight interest rate
and/or to the operating band. These announcement are made at 9 : 00 in
press releases, and the change in the target rate, if there is any, takes effect
on the same day as announced. FAD was first introduced in November
2002; it replaced the old regime under which financial markets essentially
needed to be prepared for potential changes to the key interest rate on
any business day throughout a year. The fixed-date approach improved
the effectiveness of monetary policy in Canada, by reducing uncertain-
ties in financial markets, better informing the Canadian public of recent
economic developments, and by enhancing the transparancy of monetary
policy.
Term PRA announcement date Enenajor, Sebastian, and Witmer (2010)
show robust evidence of announcement effect of term PRA operations
on reducing inter-bank funding costs in short-term money markets. The
term PRA announcement dates are obtained from the Market Notices
page on the Bank of Canada’s website.27 In this analysis, term PRA an-
nouncements are defined as releases of information regarding new and/or
revised schedules, extensions of the facility and changes to the terms of
the operations.
ELB Period The variable takes 1 over the period from April 21st, 2009 to
May 30th, 2010 (inclusive), 0 otherwise, indicating the time period during
26In this collaboration, the Bank of Canada conducted two operations over the calendaryear, with transaction amount of $2 billion each.
27Specifically, they are available at http://www.bankofcanada.ca/publications-research/market-notices/.
37

which Canadian monetary policy was implemented in an ELB framework.
During this time interval, besides the changes to the operating framework,
the Bank of Canada also increased the target for daily settlement balances
in LVTS from $25 million to $3 billion, to provide additional incentive for
creating a low interest rate environment for economic recovery.
38

References
Arjani, N. (2004): “Understanding Intraday Payment Flows in the LVTS:
An Update,” memio Bank of Canada, Department of Banking Operations.
Arjani, N., and D. McVanel (2006): “A
Primer on Canada’s Large Value Transfer System,”
http://www.bankofcanada.ca/en/financial/lvts neville.pdf.
Bank of Canada (2009): “Annex: Framework for Conducting Monetary
Policy at Low Interest Rates,” Bank of Canada Monetary Policy Report.
Bech, M. L., and E. Klee (2009): “The Mechanics of a Graceful Exit:
Interst on Reserves and Segmentation in the Federal Funds Market,” Federal
Reserve Bank of New York Staff Reports 416.
Berentsen, A., and C. Monnet (2008): “Monetary policy in a channel
system,” Journal of Monetary Economics, 55(6), 1067–1080.
Bowman, D., E. Gagnon, and M. Leahy (2010): “Interest on Excess Re-
serves as a Monetary Policy Instrument: The Experience of Foreign Central
Banks,” Board of Governors of the Federal Reserve System International
Finance Discussion Papers.
Enenajor, E., A. Sebastian, and J. Witmer (2010): “An Assessment of
the Bank of Canada’s Term PRA Facility,” Bank of Canada Working Paper
2010-20.
Engert, W., T. Gravelle, and D. Howard (2008): “The Implementation
of Monetary Policy in Canada,” Bank of Canada Discussion Paper 2008-09.
Hamilton, J. D. (1996): “The Daily Market for Federal Funds,” journal of
political economy, 104(1), 26–56.
(1997): “Measuring the Liquidity Effect,” american economic review,
87(1), 80–97.
Pregibon, D. (1980): “Goodness of Link Tests for Generalized Linear Mod-
els,” Journal of the Royal Statistical Society, Series C (Applied Statistics),
29(1), 15–24.
Reid, C. (2007): “The Canadian Overnight Market: Recent Evolution and
Structual Changes,” Bank of Canada Review, pp. 15–29.
39

Stock, J. H., J. H. Wright, and M. Yogo (2002): “A Survey of Weak
Instruments and Weak Identification in Generalized Method of Moments,”
American Statistical Association, Journal of Business and Economic Statis-
tics, 20(4), 518–529.
Stock, J. H., and M. Yogo (2005): Identification and Inference for Econo-
metric Modelschap. Chapter 5: Testing for Weak Instruments in Linear IV
Regression, pp. 80–108. New York: Cambridge University Press.
Whitesell, W. (2006): “Interest Rate Corridors and Reserves,” Journal of
Monetary Economics, 53(6), 1177–1195.
Zorn, L., C. Wilkins, and W. Engert (2009): “Bank of Canada Liquidity
Actions in Response to the Financial Market Turmoil,” Bank of Canada
Review, pp. 3–22.
40