Estimating Leaf Area Index (LAI) in Vineyards Using the ... · a high level of heterogeneity ......
12
sensors Article Estimating Leaf Area Index (LAI) in Vineyards Using the PocketLAI Smart-App Francesca Orlando 1,2, *, Ermes Movedi 1,2 , Davide Coduto 1 , Simone Parisi 1 , Lucio Brancadoro 1 , Valentina Pagani 2,3 , Tommaso Guarneri 1,2 and Roberto Confalonieri 2,3 1 Department of Agricultural and Environmental Sciences—Production, Land, Agrienergy, Università degli Studi di Milano, via Celoria 2, I-20133 Milan, Italy; [email protected] (E.M.); [email protected] (D.C.); [email protected] (S.P.); [email protected] (L.B.); [email protected] (T.G.) 2 Cassandra Lab, Università degli Studi di Milano, via Celoria 2, I-20133 Milan, Italy; [email protected] (V.P.); [email protected] (R.C.) 3 Department of Economics, Management, and Quantitative Methods, Università degli Studi di Milano, via Celoria 2, I-20133 Milan, Italy * Correspondence: [email protected]; Tel.: +39-025-031-6578 Academic Editor: Lammert Kooistra Received: 13 September 2016; Accepted: 18 November 2016; Published: 26 November 2016 Abstract: Estimating leaf area index (LAI) of Vitis vinifera using indirect methods involves some critical issues, related to its discontinuous and non-homogeneous canopy. This study evaluates the smart app PocketLAI and hemispherical photography in vineyards against destructive LAI measurements. Data were collected during six surveys in an experimental site characterized by a high level of heterogeneity among plants, allowing us to explore a wide range of LAI values. During the last survey, the possibility to combine remote sensing data and in-situ PocketLAI estimates (smart scouting) was evaluated. Results showed a good agreement between PocketLAI data and direct measurements, especially for LAI ranging from 0.13 to 1.41 (R 2 = 0.94, RRMSE = 17.27%), whereas the accuracy decreased when an outlying value (vineyard LAI = 2.84) was included (R 2 = 0.77, RRMSE = 43.00%), due to the saturation effect in case of very dense canopies arising from lack of green pruning. The hemispherical photography showed very high values of R 2 , even in presence of the outlying value (R 2 = 0.94), although it showed a marked and quite constant overestimation error (RRMSE = 99.46%), suggesting the need to introduce a correction factor specific for vineyards. During the smart scouting, PocketLAI showed its reliability to monitor the spatial-temporal variability of vine vigor in cordon-trained systems, and showed a potential for a wide range of applications, also in combination with remote sensing. Keywords: hemispherical photography; leaf area index; plant vigour; smart-app; Vitis vinifera 1. Introduction Leaf area index (LAI, total one-sided area of leaf tissue per unit ground surface; [1]) is a quantitative descriptor of canopy density and it is important index for monitoring vine (Vitis vinifera L.) vigor and for providing precious information to support vineyard management. Leaf area density is significantly correlated with radiation interception and light environment in the fruit zone [2], in turn affecting the canopy microclimate and the plant carbon balance, as well as yield and grape composition [3,4]. For these reasons, attempts have been made to forecast vine yields using remotely sensed vegetation indices (i.e., normalized difference vegetation index, NDVI) related with plant vigor and LAI [5]. Concerning management support, the relationship between LAI and crop coefficient (Kc) was used to quantify water requirements and define irrigation strategies [6]. Sensors 2016, 16, 2004; doi:10.3390/s16122004 www.mdpi.com/journal/sensors
Transcript of Estimating Leaf Area Index (LAI) in Vineyards Using the ... · a high level of heterogeneity ......

sensors
Article
Estimating Leaf Area Index (LAI) in Vineyards Usingthe PocketLAI Smart-App
Francesca Orlando 12 Ermes Movedi 12 Davide Coduto 1 Simone Parisi 1 Lucio Brancadoro 1Valentina Pagani 23 Tommaso Guarneri 12 and Roberto Confalonieri 23
1 Department of Agricultural and Environmental SciencesmdashProduction Land AgrienergyUniversitagrave degli Studi di Milano via Celoria 2 I-20133 Milan Italy ermesmovediunimiit (EM)davidecodutostudentiunimiit (DC) meteoclimahotmailit (SP)luciobrancadorounimiit (LB) tommasoguarneriunimiit (TG)
2 Cassandra Lab Universitagrave degli Studi di Milano via Celoria 2 I-20133 Milan Italyvalentinapaganiunimiit (VP) robertoconfalonieriunimiit (RC)
3 Department of Economics Management and Quantitative Methods Universitagrave degli Studi di Milanovia Celoria 2 I-20133 Milan Italy
Correspondence francescaorlandounimiit Tel +39-025-031-6578
Academic Editor Lammert KooistraReceived 13 September 2016 Accepted 18 November 2016 Published 26 November 2016
Abstract Estimating leaf area index (LAI) of Vitis vinifera using indirect methods involves somecritical issues related to its discontinuous and non-homogeneous canopy This study evaluatesthe smart app PocketLAI and hemispherical photography in vineyards against destructive LAImeasurements Data were collected during six surveys in an experimental site characterized bya high level of heterogeneity among plants allowing us to explore a wide range of LAI valuesDuring the last survey the possibility to combine remote sensing data and in-situ PocketLAI estimates(smart scouting) was evaluated Results showed a good agreement between PocketLAI data and directmeasurements especially for LAI ranging from 013 to 141 (R2 = 094 RRMSE = 1727) whereasthe accuracy decreased when an outlying value (vineyard LAI = 284) was included (R2 = 077RRMSE = 4300) due to the saturation effect in case of very dense canopies arising from lack ofgreen pruning The hemispherical photography showed very high values of R2 even in presence ofthe outlying value (R2 = 094) although it showed a marked and quite constant overestimation error(RRMSE = 9946) suggesting the need to introduce a correction factor specific for vineyards Duringthe smart scouting PocketLAI showed its reliability to monitor the spatial-temporal variability ofvine vigor in cordon-trained systems and showed a potential for a wide range of applications also incombination with remote sensing
Keywords hemispherical photography leaf area index plant vigour smart-app Vitis vinifera
1 Introduction
Leaf area index (LAI total one-sided area of leaf tissue per unit ground surface [1]) isa quantitative descriptor of canopy density and it is important index for monitoring vine(Vitis vinifera L) vigor and for providing precious information to support vineyard managementLeaf area density is significantly correlated with radiation interception and light environment in thefruit zone [2] in turn affecting the canopy microclimate and the plant carbon balance as well as yieldand grape composition [34] For these reasons attempts have been made to forecast vine yieldsusing remotely sensed vegetation indices (ie normalized difference vegetation index NDVI) relatedwith plant vigor and LAI [5] Concerning management support the relationship between LAI andcrop coefficient (Kc) was used to quantify water requirements and define irrigation strategies [6]
Sensors 2016 16 2004 doi103390s16122004 wwwmdpicomjournalsensors
Sensors 2016 16 2004 2 of 12
Moreover recent studies have used the relationship between canopy density and disease incidence [7]to adjust pesticide dose [8] In this context Walklate et al [9] developed a system for supporting theefficient use of pesticides in vineyards based on descriptors of canopy density such as plant LAIrow and vine spacing Experimental evidences pointed out that the practice commonly adopted inviticulture to apply a constant dose of pesticide per unit area leads to foliar deposits that consistentlydecrease when vine LAI increases [9ndash12] Therefore the application of a unique pesticide dose canresults in over- or under- plant protection with the negative economic and environmental impactsIn this context Siegfried et al [13] highlighted the importance of adapting the dosage followinga LAI-based approach
However the LAI determination in vineyards using indirect methods (suitable in operationalcontexts) is constrained by the peculiar canopy structure that is mostly vertically trained with a markedrow structure (ie the cordon-trained system where the cordon is the vines woody framework arisingfrom the top of the trunk trained along horizontal wires and on which arms are borne)
The indirect methods are based on the measurement of light transmission through the canopyand in case of vineyards they can be affected by the discontinuity of the canopy and by the presenceof leaves clumped in walls These aspects violate the main assumption behind the light transmittancemodels used within indirect methods [14] also known as turbid medium assumption [15] Johnson andPierce [16] reported systematic under-estimation of vineyard LAI using LAI-2000 (PCA LI-COR IncLincoln NE USA) Lopez-Lozano and Casterad [17] assessed several measurement protocols forthe SunScan ceptometer (Delta-T Devices Cambridge UK) in vineyards underlining the need ofintroducing information on canopy structure for reliable measurements and the strong impact ofsun position on the uncertainty in LAI estimates Similarly remote sensing techniques demonstratedto be partly unsuitable to derive vine LAI estimates although to a different extent for the differentremote sensing platforms In general the large spatial heterogeneity of a row-structured canopyand variability in the background (eg more or less vegetated bare soil) markedly affects spectralreflectance leading to unstable relationships between vegetation indices such as NDVI and LAI [18ndash20]Therefore vegetation indices need to be related with ground-based LAI measurements to derivespatially distributed LAI maps the latter being useful eg to define the dosage of plant protectionproducts [21ndash24]
For the reasons above the monitoring of vines vigor for operational purposes is mainly carriedout by estimating leaf area with simplified techniques characterized by low accuracy such as thosebased on canopy leaf layer count [4] and on allometric relationships with shoot number and length [20]
An inexpensive alternative to a certain extent unexplored for grapevine could be representedby the digital hemispherical photography (DHP) technique [25] DHP is based on permanent imageacquisition through a fish-eye lens and on the use of specific software for image processing [26]However most of these software packages are based on the interactive (manual) application ofa visually-selected threshold for the whole image introducing a potential source of inconsistencydue to the userrsquos subjectivity moreover they are not resource-efficient when a large number ofimages needs to be processed [27] Therefore DHP is not able to provide data in real-time and thesemi-automatic segmentation of images can be affected by userrsquos skills and subjectivity
An alternative inexpensive solution to get real time LAI data in a fully automatic way forboth research and operational purposes was proposed by Confalonieri et al [28] They developeda smartphone application called PocketLAI based on the inversion of the Warren Wilson [29]light transmittance model and on the gap fraction estimates via unsupervised segmentation ofimage acquired below the canopy at 575 The image acquisition at this particular directionalconfiguration demonstratedmdashboth theoretically and experimentally [30]mdashits independence fromleaf angle distribution and its capability to minimize leaf clumping effect in case of row crops [30]PocketLAI showed good accuracy for rice LAI estimates in comparative evaluations with LAI-2000 andAccuPAR ceptometer (Decagon Pullman WA USA) In further studies the smart app demonstratedits effectiveness also for herbaceous canopies markedly deviating from the ideal assumption (random
Sensors 2016 16 2004 3 of 12
distribution of infinitely small leaves) behind its simplified transmittance model [31] for a variety ofbroad-leaf tree canopies [32] and for seasonal monitoring purposes [33]
The availability of a smart-appmdashcharacterized by low-cost able to provide LAI estimates inabsolute terms in real-time without requiring time consuming post-processing or the definition ofparameterssettingsmdashcould represent an useful and user-friendly tool for operational purposes in theviticulture sector suitable for the agricultural stakeholders (eg producers insurance agents etc)
Recently another smart-app (VitiCanopy) [34] was developed to estimate vine canopy vigor andporosity VitiCanopy is based on the acquisition of images from below the canopy similarly to DHPand on their automatic processing analogously to PocketLAI However the VitiCanopy user needsto specify the gap fraction threshold meaning the percentage of image pixel that corresponds to skybefore taking the measurements VitiCanopy showed good agreement with LAI-2000 [34] although theauthors underlined the influence of the cordon included in the image on the app accuracy The resultingoverestimation depends on intrinsic factors concerning the cordon size (eg vine age and trainingsystem) and on aspects related to the measurement protocol (ie the distance between the cameraand the cordon) The authors highlighted that the assessment of the contribution of the cordon is notnecessary when the aim is to monitor relative differences of vigour in time and space On the otherhand when absolute LAI values are required the authors suggested the calibration of a case-specificcorrection factor using measurements carried out on bare cordons during dormancy to quantify thecordon contribution In this respect the automatic acquisition of images at 575 implemented inPocketLAI should make the latter free from any need of parameterization or calibration since imagesare captured pointing the camera toward the leaves wall and thus excluding the cordon
The aims of this study were to assess the reliability of vineyards LAI values retrieved withPocketLAI and to develop a specific measurement protocol for grapevine The performances ofPocketLAI were assessed against destructive measurements and compared with those of DHPMoreover the possibility of using in-situ PocketLAI measurements and Normalized DifferenceVegetation Index (NDVI) maps for obtaining spatially distributed LAI maps was also explored viasmart scouting
2 Materials and Methods
21 Survey Scheme
The study was carried out during 2015 in the rainfed experimental vineyard of Riccagioia scpa(Pavia Province Italy Lat 4498 N Long 909 E 138 m asl) Vines were planted in 2008 with a rowand vine spacing respectively of 24 m and 10 m cultivated using the Guyot system and unilateralcordon-pruning The vineyard covers an area of about 1 ha and it is characterized by a pronouncedheterogeneity mainly due to the use of different cultivars (Vitis vinifera cv Barbera and Chardonnay)and rootstocks (hybrids of Vitis berlandieri and Vitis riparia) within each row as well as to different vinecare practices (with or without green pruning)
Sampling areas of different vigor were identified during six surveys carried out from theemergence of inflorescence to the beginning of ripening in order to monitor the evolution of vinecanopy during the crop cycle and provide a wide range of LAI values on which testing the indirectmethods against the destructive measurements In particular the surveys were performed at thefollowing growth stages of the BBCH phenological scale 56 57 61 74 77 81 [35]
During each of the first five surveys three sampling areas of different vigor were identified andthree vines were sampled for each area The sampling areas were characterized by cv Barbera vinesall subjected to green pruning The differences of canopy vigor in-space were mainly due to the use ofthree different rootstock hybrids (Table 1) and in-time to the different surveyed growth stages
During the sixth survey five sampling areas of different vigor were identified on the basis of therelative differences of canopy vigor described by a high resolution NDVI map andmdashin each of theseareasmdashtwo vines were sampled The NDVI map was derived using a sensor placed on a four-wheeler
Sensors 2016 16 2004 4 of 12
quad-bike that detected the spectral response of the vines while moving through the rows This lastsurvey had the aim to extend the range of LAI values on which test the performance of indirect methodsand to explore the possibility to combine PocketLAI with remote sensing data In this case the spatialvariability of canopy vigor was due to the presence of different combination of cultivar times rootstocks(Table 1) and to the involvement of vineyard areas not subjected to green pruning
Table 1 Survey scheme
Date BBCH-Stage Row Genotype Number of Sampled Vines
5 May 56cv Barbera (rootstocks AT84 times Kober 5bb) 3
cv Barbera (rootstocks AT84 times SO4) 3cv Barbera (rootstocks AT84 times 420A) 3
12 May 57cv Barbera (rootstocks AT84 times Kober 5bb) 3
cv Barbera (rootstocks AT84 times SO4) 3cv Barbera (rootstocks AT84 times 420A) 3
22 May 61cv Barbera (rootstocks AT84 times Kober 5bb) 3
cv Barbera (rootstocks AT84 times SO4) 3cv Barbera (rootstocks AT84 times 420A) 3
5 June 74cv Barbera (rootstocks AT84 times Kober 5bb) 3
cv Barbera (rootstocks AT84 times SO4) 3cv Barbera (rootstocks AT84 times 420A) 3
23 June 77cv Barbera (rootstocks AT84 times Kober 5bb) 3
cv Barbera (rootstocks AT84 times SO4) 3cv Barbera (rootstocks AT84 times 420A) 3
20 July 81
cv Chardonnay (rootstocks R8 times M3) 2cv Chardonnay (rootstocks R8 times M2) 2
cv Chardonnay (rootstocks AT84 times SO4) 2cv Barbera (rootstocks AT84 times Kober 5bb) 2
cv Barbera (rootstocks AT84 times SO4) 2
On the sampled vines PocketLAI and DHP estimates were first taken followed by the collectionof destructive samples obtained by stripping all leaves from the canopies Moreover during the firstfive surveys the number of shoots per plant was determined and the average number of leaves pershoot was estimated by counting the leaves on a sample of five shoots These two measures weresummarized in a descriptive index (theoretical leaf number TL) given by the shoot number multipliedby the average number of leaves per shoot
22 Indirect LAI Estimates
The method implemented in PocketLAI and the app functioning were described in previouspapers [283132] (documentation available at the httpwwwcassandralabcommobiles1 andlicensing at infocassandralabcom) Using the accelerometer and the device camera PocketLAIautomatically takes images from below the canopy at a view angle of 575 while the user is rotatingthe device along its main axis The gap fraction is derived using a fully automatic segmentationalgorithm expressly developed to detect the sky pixels according to their chromatic values ina Hue- Saturation-Brightness (HSB) color space The LAI value was retrieved according to the lighttransmittance model proposed by Warren-Wilson [29] and recently discussed by Baret et al [30]
For this study PocketLAI was installed on an inexpensive Samsung GT-i9105 Galaxy S II Plussmatphone In the specific case of vineyard measurements were taken by positioning the device atabout 15 cm below the canopy and at a distance of 04 m from the row orienting the device towardthe vines (Figure 1a) This allowed excluding the empty space between the bottom of the canopyand the soil surface (Figure 1b) as well as the sky above the canopy (Figure 1c) For each plantfour measurement replicates were acquired by processing two shots per row side while moving alongthe row at about 20 and 40 cm from the vineyard pole (Figure 1d) Averaging the four replicatesthe LAI of each vine was obtained Then averaging the LAI of the sampled vines the mean plant LAI(LAIp) in each sampling area was calculated
Sensors 2016 16 2004 5 of 12
Sensors 2016 16 2004 5 of 12
of each vine was obtained Then averaging the LAI of the sampled vines the mean plant LAI (LAIp) in each sampling area was calculated
Figure 1 Example of correct image captured with PocketLAI following the protocol (a) and wrong images that include the space below (b) or above (c) the vertical trained canopy of Vitis vinifera Protocols for LAI data acquisition (d) dark triangles and dotted lines = device orientation black points vineyard poles continuous line = vineyard row green leaves = measured vine grey leaves = adjacent vine
The LAIp provided by PocketLAI was converted in vineyard LAI (LAIv) using Equation (1) LAIv = LAIp 2DR (1)
where D (m) is the horizontal distance of the device from the cordon and R (m) is the row-spacing The equation was derived from the assumption that the LAIp obtained from PocketLAI is given
by the ratio between the plant leaf area and the unit ground surface considered by the smart-app (Equation (2)) The latter is the vine-spacing multiplied by the inter-row width considered by the PocketLAI on both sides of the row corresponding to the double of the distance between device and row (08 m)
The value of leaf area per plant assessed by PocketLAI was retrieved (Equation (3)) and referred to the unit of ground surface provided for single vine in the vineyard dividing by vine-spacing times row-spacing [16] (Equation (1)) The result is the conversion of LAIp in LAIv LAIp = LA2D times V (2) LA = LAIp times 2D times V (3)
where LA (m2) is the plant leaf area V (m) is the vine-spacing D (m) is the horizontal distance of the device from the cordon The hemispherical images were collected through fisheye lens using a protocol similar to that used for PocketLAI The camera was positioned below the canopy along the row line with the lens oriented upward acquiring two images from each plant moving horizontally at 20 and 40 cm from the pole The set of fisheye images from each sampling area was processed using the CAN-EYE software (v 6314 httpwwwavignoninrafrcan_eye) [15] since it demonstrated to be one of the best packages in a comparative study performed by Liu et al [36] The segmentation of the images targeted the discrimination of green organs from the sky background and from the brown pixels in order to exclude from the LAI estimate the contribution of the cordon and other minor woody components The lsquotrue LAIrsquo values provided by the software were used as LAIv The lsquotrue LAIrsquo is defined as the LAI value assessed by CAN-EYE taking into account the computation of average leaf inclination angle and clumping parameter
Figure 1 Example of correct image captured with PocketLAI following the protocol (a) andwrong images that include the space below (b) or above (c) the vertical trained canopy ofVitis vinifera Protocols for LAI data acquisition (d) dark triangles and dotted lines = deviceorientation black points vineyard poles continuous line = vineyard row green leaves = measured vinegrey leaves = adjacent vine
The LAIp provided by PocketLAI was converted in vineyard LAI (LAIv) using Equation (1)
LAIv = LAIp2DR
(1)
where D (m) is the horizontal distance of the device from the cordon and R (m) is the row-spacingThe equation was derived from the assumption that the LAIp obtained from PocketLAI is given
by the ratio between the plant leaf area and the unit ground surface considered by the smart-app(Equation (2)) The latter is the vine-spacing multiplied by the inter-row width considered by thePocketLAI on both sides of the row corresponding to the double of the distance between device androw (08 m)
The value of leaf area per plant assessed by PocketLAI was retrieved (Equation (3)) andreferred to the unit of ground surface provided for single vine in the vineyard dividing byvine-spacing times row-spacing [16] (Equation (1)) The result is the conversion of LAIp in LAIv
LAIp =LA
2D times V(2)
LA = LAIp times 2D times V (3)
where LA (m2) is the plant leaf area V (m) is the vine-spacing D (m) is the horizontal distance ofthe device from the cordon The hemispherical images were collected through fisheye lens usinga protocol similar to that used for PocketLAI The camera was positioned below the canopy along therow line with the lens oriented upward acquiring two images from each plant moving horizontallyat 20 and 40 cm from the pole The set of fisheye images from each sampling area was processed usingthe CAN-EYE software (v 6314 httpwwwavignoninrafrcan_eye) [15] since it demonstrated to beone of the best packages in a comparative study performed by Liu et al [36] The segmentation ofthe images targeted the discrimination of green organs from the sky background and from the brownpixels in order to exclude from the LAI estimate the contribution of the cordon and other minor woodycomponents The lsquotrue LAIrsquo values provided by the software were used as LAIv The lsquotrue LAIrsquo isdefined as the LAI value assessed by CAN-EYE taking into account the computation of average leafinclination angle and clumping parameter
Sensors 2016 16 2004 6 of 12
23 Destructive LAI Measurement
The LAI estimates from destructive sampling followed the approach suggested by Breda et al [37]and Johnson and Pierce [16] Destructive LAI measures were collected immediately upon completionof indirect estimates by removing all the leaves at the petiole from each sample plant Then for eachplant the leaf fresh weight (W) was determined and a disc of known area (001 m2) was obtained foreach of the leaves in a 40-leaf subsample including leaves of different ages The 40 discs per plant wereweighed and the specific leaf area (SLA m2middotgminus1 fw) was computed The obtained values of SLAW and plant density were used to derive the vineyard LAI (LAIv) according to Equation (4)
LAIv =WmiddotSLA
RmiddotS (4)
Therefore similarly to Equation (1) in order to compute LAIv the leaf area per plant was referredto the unit of ground surface provided for single vine in the vineyard [16]
24 Data Analysis
For each sampling area the agreement between mean LAIv values determined using destructiveand indirect methods was quantified using the following metrics relative root mean square error(RRMSE 0 to +infin optimum 0) [38] mean absolute error (MAE 0 to +infin optimum 0) [39] modellingefficiency (EF minusinfin to +1 optimum +1) [40] coefficient of residual mass (CRM from minusinfin to +infin optimum 0 if positive means underestimation and vice versa) [41] Moreover parameters of the linearregression equation between LAIv values estimated with direct and indirect methods were calculatedas well as between LAIv values and TL data Moreover for the sixth survey a relationship betweenPocketLAI estimates and NDVI data was computed and used to derive spatially distributed LAI valuesfor the entire vineyard
3 Results
31 Performance of Indirect Methods
The LAIv values obtained from destructive measurements during the campaign rangedfrom 013 to 284 in agreement with those normally reported in commercial vineyards [161725]The results of the comparison between LAIv values from PocketLAI DHP and destructivemeasurements are shown in Table 2 and Figure 2
Table 2 Agreement between LAIv estimated with PocketLAI hemispherical photography (DHP)and direct measurements considering the whole dataset (Dataset-1) and excluding the outlying valueof a very high-vigor sampling area (Dataset-2) and agreement between LAIv measured with differentmethods and the theoretical number of leaves (TL) Legend MAE mean absolute error RRMSErelative root mean square error EF modelling efficiency CRM coefficient of residual mass
Agreement between LAI Measurement Methods
PocketLAI vs Direct Measures DHP vs Direct Measures PocketLAI vs DHP
Dataset-1 Dataset-2 Dataset-1 Dataset-2 Dataset-1 Dataset-2
R2 077 094 094 085 068 084 MAE 015 009 066 060 057 057
RRMSE 4300 1727 9946 10079 5039 5039EF 074 093 minus040 minus129 minus014 minus014
CRM 006 minus004 minus087 minus093 046 046
Agreement between plant vigour descriptors
PocketLAI vs TL DHP vs TL Direct measures vs TL
R2 096 085 092
p lt 0001
Sensors 2016 16 2004 7 of 12Sensors 2016 16 2004 7 of 12
Figure 2 Agreement between LAIv data observed with direct measurement and those estimated with PocketLAI (ac) and hemispherical photography (DHP) (bd) considering the whole dataset (Dataset-1 ab) and excluding the outlier value of a very high-vigour sampling area (Dataset-2 cd)
Considering the whole dataset of surveys (Table 2 Dataset-1 Figure 2a) PocketLAI values were in agreement with those from destructive measurements with a highly significant correlation (p lt 0001) (R2 = 077) and practically without under- or over-estimating behaviors (CRM = 006) However the comparison was largely affected (RRMSE = 43) by a single value (LAIv = 284) corresponding to the sampling area characterized by the highest vigor identified via smart scouting before the last survey using the NDVI map The highest LAI value corresponds to the sampled area of the vineyard untreated by the green pruning and therefore it can be considered an outlying data
The exclusion of this single value from the dataset led to greatly improve the coherence between PocketLAI and destructive LAIv values (Table 2 Dataset-2 Figure 2c) The new values of the agreement metrics decidedly approximated their optimum values R2 was 094 RRMSE reached 17 and EF was 093
Considering the whole dataset (Table 2 Dataset-1 Figure 2b) DHP showed a systematic over-estimation (CRM = minus087) with high RRMSE (9946) and negative value of EF (meaning that the average of destructive measurements is a better estimator of each LAI value compared to the DHP values) On the other hand DHP showed high correlation with destructive LAIv values (R2 = 094) and its performances were not affected by the outlier value (ie no improvements detected repeating the analysis with the exclusion of the outlying value Table 2 Dataset-2 Figure 2d)
Both indirect methods showed highly significant correlations between LAIv estimates and the descriptor of plant vigour represented by TL (Table 2) with values of R2 similar to that achieved using the destructive method However a slightly better agreement between TL and LAIv was obtained for PocketLAI (R2 = 096 it was 085 for DHP)
Figure 3 shows the increasing trend of the mean LAIv during the growing season from the beginning of May to the end of June (ie during the first five surveys) Data confirmed what
Figure 2 Agreement between LAIv data observed with direct measurement and those estimatedwith PocketLAI (ac) and hemispherical photography (DHP) (bd) considering the whole dataset(Dataset-1 ab) and excluding the outlier value of a very high-vigour sampling area (Dataset-2 cd)
Considering the whole dataset of surveys (Table 2 Dataset-1 Figure 2a) PocketLAI values were inagreement with those from destructive measurements with a highly significant correlation (p lt 0001)(R2 = 077) and practically without under- or over-estimating behaviors (CRM = 006) However thecomparison was largely affected (RRMSE = 43) by a single value (LAIv = 284) corresponding tothe sampling area characterized by the highest vigor identified via smart scouting before the lastsurvey using the NDVI map The highest LAI value corresponds to the sampled area of the vineyarduntreated by the green pruning and therefore it can be considered an outlying data
The exclusion of this single value from the dataset led to greatly improve the coherence betweenPocketLAI and destructive LAIv values (Table 2 Dataset-2 Figure 2c) The new values of the agreementmetrics decidedly approximated their optimum values R2 was 094 RRMSE reached 17 and EFwas 093
Considering the whole dataset (Table 2 Dataset-1 Figure 2b) DHP showed a systematicover-estimation (CRM = minus087) with high RRMSE (9946) and negative value of EF (meaningthat the average of destructive measurements is a better estimator of each LAI value compared tothe DHP values) On the other hand DHP showed high correlation with destructive LAIv values(R2 = 094) and its performances were not affected by the outlier value (ie no improvements detectedrepeating the analysis with the exclusion of the outlying value Table 2 Dataset-2 Figure 2d)
Both indirect methods showed highly significant correlations between LAIv estimates and thedescriptor of plant vigour represented by TL (Table 2) with values of R2 similar to that achieved using
Sensors 2016 16 2004 8 of 12
the destructive method However a slightly better agreement between TL and LAIv was obtained forPocketLAI (R2 = 096 it was 085 for DHP)
Figure 3 shows the increasing trend of the mean LAIv during the growing season from thebeginning of May to the end of June (ie during the first five surveys) Data confirmed what discussedabove with the constant over-estimation of LAIv provided by the DHP whereas PocketLAI estimateswere always very close with destructive measurements Moreover at the second survey the DHPdetected an average LAI decrease of 019 not confirmed by the other measurement methods Theinconsistency was due to the sky lighting during the acquisition of hemispherical images Duringthe second survey the conditions (sunny day and survey carried out with sun at the zenith) ledto high level of sunlight affecting the evenness of foliage lighting with resulting uncertainty inimage segmentation This led to underestimation errors as already observed by other authors [2642]The PocketLAI view angle of 575 minimized the effect of those conditions because contrarily tohemispherical photography the device camera was not oriented directly toward the zenith duringimage acquisition
Sensors 2016 16 2004 8 of 12
discussed above with the constant over-estimation of LAIv provided by the DHP whereas PocketLAI estimates were always very close with destructive measurements Moreover at the second survey the DHP detected an average LAI decrease of 019 not confirmed by the other measurement methods The inconsistency was due to the sky lighting during the acquisition of hemispherical images During the second survey the conditions (sunny day and survey carried out with sun at the zenith) led to high level of sunlight affecting the evenness of foliage lighting with resulting uncertainty in image segmentation This led to underestimation errors as already observed by other authors [2642] The PocketLAI view angle of 575deg minimized the effect of those conditions because contrarily to hemispherical photography the device camera was not oriented directly toward the zenith during image acquisition
Figure 3 Average trend of LAIv observed during the monitoring of three rows from the beginning of May to the end of June with direct and indirect methods
32 PocketLAI and NDVI
The pixels of the georeferenced NDVI map of the vineyard were clustered into five classes using the ArcGIS v10 package and PocketLAI estimates were collected at the sixth survey in sampling area representative of each class (Figure 4a) A regression equation (R2 = 090) was then derived between the LAIv obtained from PocketLAI and NDVI values in the sampling areas (indicated by black circles in Figure 4a) The regression equation was then used to convert all the other NDVI pixels of the map into LAIv values using the spatial analysis tool of ArcGIS for raster reclassification to obtain spatially distributed LAI data (Figure 4b) Figure 4b shows the resulting high resolution vineyard LAI map derived from the combination of the vegetation index and only five PocketLAI estimates (smart scouting)
Figure 3 Average trend of LAIv observed during the monitoring of three rows from the beginning ofMay to the end of June with direct and indirect methods
32 PocketLAI and NDVI
The pixels of the georeferenced NDVI map of the vineyard were clustered into five classes usingthe ArcGIS v10 package and PocketLAI estimates were collected at the sixth survey in sampling arearepresentative of each class (Figure 4a) A regression equation (R2 = 090) was then derived betweenthe LAIv obtained from PocketLAI and NDVI values in the sampling areas (indicated by black circlesin Figure 4a) The regression equation was then used to convert all the other NDVI pixels of themap into LAIv values using the spatial analysis tool of ArcGIS for raster reclassification to obtainspatially distributed LAI data (Figure 4b) Figure 4b shows the resulting high resolution vineyardLAI map derived from the combination of the vegetation index and only five PocketLAI estimates(smart scouting)
Sensors 2016 16 2004 9 of 12Sensors 2016 16 2004 9 of 12
Figure 4 NDVI map of the vineyard (a) with pixels clustered in five classes as shown by the legend and indications on where PocketLAI estimates were collected and the corresponding LAIv map (b) derived from the relationship between NDVI and PocketLAI measurements in the five points representative of each NDVI class
4 Discussion
In general the LAI values estimated using PocketLAI and those measured using destructive method were consistent with a coefficient of determination ranging from 077 (Figure 2a) to 094 (Figure 2d) depending on the inclusion or not in the analysis of a vineyard LAI close to 3 (LAIv = 284 with destructive method) observed in a unusually high-vigor sampling area due to the absence of green pruning applications This value converted in vine LAI (Equation (2)) corresponds to an observed plant LAI close to 7 (LAIp = 68)
This value can be considered as outlying in vineyards as confirmed eg by the LAI ranges reported by Pergher and Petris [12] For similar vine training systems this study shows LAI values ranging from 0 to 4 measured across many seasons (from 1993 to 2005) from leaf development (code 13 BBCH scale) to the beginning of ripening (code 81 BBCH scale)
Excluding this value the maximum vineyard LAI observed was below 2 (LAIv = 141 with direct method) corresponding to a vine LAI lower than 4 (LAIp = 34) These results confirmed the tendency of PocketLAI (and of most indirect methods based on the inversion of light transmittance models) to underestimate high LAI values because of a saturation effect [26] In case of PocketLAI the effect was already discussed by Francone et al [31] for dense maize and giant reed canopies In that case the authors obtained pronounced underestimations especially in case of giant reed canopies exceeding 5 The reasons were the saturation effect and the strong deviation of industrial giant reed plants from the ideal assumption behind light transmittance models (randomly distributed infinitely small leaves) The same explanation is valid for the case of vineyard (leaves clumped in walls) However PocketLAI can be considered a suitable tool for monitoring Vitis vinifera LAI development since it showed inaccuracies only in an uncommon case of vine untreated with green pruning This practice is usually adopted in viticulture in order to decrease the shading on the grapes and create microclimatic condition inside the canopy unfavorable to pest infection [43]
Concerning the smart scouting activities the coupling between NDVI map and in-situ LAI data measured with PocketLAI proved to be an interesting approach able to provide a description of the vineyard canopy LAI in absolute terms The possibility to convert an NDVI map able to describe
Figure 4 NDVI map of the vineyard (a) with pixels clustered in five classes as shown by the legend andindications on where PocketLAI estimates were collected and the corresponding LAIv map (b) derivedfrom the relationship between NDVI and PocketLAI measurements in the five points representative ofeach NDVI class
4 Discussion
In general the LAI values estimated using PocketLAI and those measured using destructivemethod were consistent with a coefficient of determination ranging from 077 (Figure 2a) to094 (Figure 2d) depending on the inclusion or not in the analysis of a vineyard LAI closeto 3 (LAIv = 284 with destructive method) observed in a unusually high-vigor sampling area dueto the absence of green pruning applications This value converted in vine LAI (Equation (2))corresponds to an observed plant LAI close to 7 (LAIp = 68)
This value can be considered as outlying in vineyards as confirmed eg by the LAI rangesreported by Pergher and Petris [12] For similar vine training systems this study shows LAI valuesranging from 0 to 4 measured across many seasons (from 1993 to 2005) from leaf development(code 13 BBCH scale) to the beginning of ripening (code 81 BBCH scale)
Excluding this value the maximum vineyard LAI observed was below 2 (LAIv = 141 withdirect method) corresponding to a vine LAI lower than 4 (LAIp = 34) These results confirmed thetendency of PocketLAI (and of most indirect methods based on the inversion of light transmittancemodels) to underestimate high LAI values because of a saturation effect [26] In case of PocketLAIthe effect was already discussed by Francone et al [31] for dense maize and giant reed canopiesIn that case the authors obtained pronounced underestimations especially in case of giant reedcanopies exceeding 5 The reasons were the saturation effect and the strong deviation of industrialgiant reed plants from the ideal assumption behind light transmittance models (randomly distributedinfinitely small leaves) The same explanation is valid for the case of vineyard (leaves clumpedin walls) However PocketLAI can be considered a suitable tool for monitoring Vitis vinifera LAIdevelopment since it showed inaccuracies only in an uncommon case of vine untreated with greenpruning This practice is usually adopted in viticulture in order to decrease the shading on the grapesand create microclimatic condition inside the canopy unfavorable to pest infection [43]
Sensors 2016 16 2004 10 of 12
Concerning the smart scouting activities the coupling between NDVI map and in-situ LAIdata measured with PocketLAI proved to be an interesting approach able to provide a descriptionof the vineyard canopy LAI in absolute terms The possibility to convert an NDVI map able todescribe differences in space only in relative terms to a LAI map acquires a special relevance whenthe optimization of farming practices requires a description of the vineyard based on absolute valueslike in the case of pesticide dose adjustment
In case of DHP the correlation between indirect estimates and destructive measurements wasfully satisfactory (R2 = 094) and the method did not show saturation effect although estimates wereconsistently affected by a relevant overestimation error The overestimation was quite constant andindependent from absolute LAI values since it was observed throughout the season Similar resultswere found by Lopez-Lozano et al [25] who compared different tools for LAI estimation in vineyardsincluding DHP The authors discussed that the lsquotrue LAIrsquo values provided by the same software weused (CAN-EYE) led to overestimating destructive LAI values by a factor around 16 (the value weobtained here was around 26) These results suggested the possibility to apply a specific correctionfactor for DHP improving the performance of the method for the vineyard case
Neither PocketLAI nor DHP showed changes in reliability for different phenological stagesExcluding the outlying value discussed above differences in mean absolute error never exceeded 017and 044 for PocketLAI and DHP respectively and no trends were observed for the evaluation metricsas a function of development stage
5 Conclusions
Both indirect methods based on digital image processing ie the PocketLAI smart-app andhemispherical photography proved their reliability for monitoring the spatial and temporal variabilityof vine vigor in cordon-trained system and to provide LAI values However DHP highlighted theneed to assess a correction factor because of overestimation errors already discussed for vineyards [25]whereas PocketLAI showed a certain saturation effect for vine LAI approaching or exceeding 5 or 6However the latter is an uncommon condition with respect to the most widespread vine trainingsystems because the green pruning lead to lower LAI values
Moreover with respect to DHP PocketLAI entails the advantages of automatic (completelyunsupervised) and real-time provision of LAI data and the suitability for operational purposesin addition to its low-cost and user-friendliness In this context PocketLAI shows a potential for a widerange of applications such as the spatial-temporal optimization of the agronomic inputs especially incombination with remote sensing products
Author Contributions FO performed the data analysis set the equations to convert plant-LAI into vineyard-LAIestablished the protocol for indirect measurements comparing different tests LB and RC conceived anddesigned the experiments FO and RC wrote the paper EM performed the hemispherical images processingexploring the best options setting with CanEye EM and DC carried out the indirect measurements SP andTG carried out the destructive LAI measurements SP set the figures VP performed the elaboration concerningthe remote sensing data
Conflicts of Interest The authors declare no conflict of interest
References
1 Watson DJ Comparative physiological studies on the growth of field crops I Variation in net assimilationrate and leaf area between species and varieties and within and between years Ann Bot Lond 1947 1141ndash76 [CrossRef]
2 Dokoozlian N Kliewer W The light environment within grapevine canopies II Influence of leaf areadensity on fruit zone light environment and some canopy assessment Am J Enol Vitic 1995 46 219ndash226
3 Winkler AJ The relation of leaf area and climate to vine performance and grape quality Am J Enol Vitic1958 9 10ndash23
4 Smart RE Principles of grapevine canopy microclimate manipulation with implications for yield andquality A review Am J Enol Vitic 1985 36 230ndash239
Sensors 2016 16 2004 11 of 12
5 Cunha M Marccedilal ARS Silva L Very early prediction of wine yield based on satellite data fromVEGETATION Int J Remote Sens 2010 31 3125ndash3142 [CrossRef]
6 Williams LE Ayars JE Grapevine water use and the crop coefficient are linear functions of the shadedarea measured beneath the canopy Agric For Meteorol 2005 132 201ndash211 [CrossRef]
7 English J Thomas C Marois J Gubler W Microclimates of grapevine canopies associated with leafremoval and control of Botrytis bunch rot Phytopathology 1989 79 395ndash401 [CrossRef]
8 Gil E Escola A Rosell JR Planas S Val L Variable rate application of plant protection products invineyard using ultrasonic sensors Crop Prot 2007 26 1287ndash1297 [CrossRef]
9 Walklate PJ Cross JV Pergher G Support system for efficient dosage of orchard and vineyard sprayingproducts Comput Electron Agric 2011 75 355ndash362 [CrossRef]
10 Viret O Dubuis PH Bloesch B Fabre AL Dupuis D Dosage des fongicides adapteacute agrave la surface foliaireen viticulture Efficaciteacute de la lutte Rev Suisse Vitic Arboric Hortic 2010 42 226ndash233 (In Italian)
11 Pergher G Metodi per adeguare la dose di agrofarmaco alle caratteristiche della chioma nei trattamenti allecolture arboree In Proceedings of the Problemi Sanitari Delle Colture Ortoflorovivaistiche ed EvoluzioneDelle Strategie di Difesa Turin Italy 28 Februaryndash2 March 2007 pp 15ndash19 (In Italian)
12 Pergher G Petris R Pesticide Dose Adjustment in Vineyard Spraying and Potential for Dose ReductionAgric Eng Int CIGR J 2008 X Available online httpscigrjournalorgindexphpEjounralarticleviewFile12541111 (accessed on 10 October 2016)
13 Siegfried W Viret O Huber B Wohlhauser R Dosage of plant protection products adapted to leaf areaindex in viticulture Crop Prot 2007 26 73ndash82 [CrossRef]
14 Campbell GS Norman JM An Introduction to Environmental Biophysics 2nd ed Springer New York NYUSA 1998
15 Weiss M Baret F Smith GJ Jonckheere I Coppin P Review of methods for in situ leaf area index(LAI) determination Part II Estimation of LAI errors and sampling Agric For Meteorol 2004 121 37ndash53[CrossRef]
16 Johnson LF Pierce LL Indirect measurement of Leaf Area Index in California North Coast vineyardsHortScience 2004 39 236ndash238
17 Lopez-Lozano R Casterad MA Comparison of different protocols for indirect measurement of leaf areaindex with ceptometers in vertically trained vineyards Aust J Grape Wine Res 2013 19 116ndash122 [CrossRef]
18 Bronge BL Vegetation indices for estimation of LAI FPAR and primary productionmdashParameters influencingthe relationships In Satellite Remote Sensing for Estimating Leaf Area Index FPAR and Primary ProductionA Literature Review No SKB-Rndash04-24 Swedish Nuclear Fuel and Waste Management Co StockholmSweden 2004
19 Zarco-Tejada PJ Berjoacuten A Loacutepez-Lozano R Miller JR Martiacuten P Cachorro V Gonzaacutelez MR deFrutos A Assessing vineyard condition with hyperspectral indices Leaf and canopy reflectance simulationin a row-structured discontinuous canopy Remote Sens Environ 2005 99 271ndash287 [CrossRef]
20 Fuentes S Poblete-Echeverriacutea C Ortega-Farias S Tyerman S De Bei R Automated estimation of leafarea index from grapevine canopies using cover photography video and computational analysis methodsAust J Grape Wine Res 2014 20 465ndash473 [CrossRef]
21 Hall A Lamb DW Holzapfel B Louis J Optical remote sensing applications in viticulturemdashA reviewAust J Grape Wine Res 2002 8 36ndash47 [CrossRef]
22 Drissi R Goutouly JP Forget D Gaudillere JP Nondestructive Measurement of Grapevine Leaf Area byGround Normalized Difference Vegetation Index Agron J 2009 101 226ndash231 [CrossRef]
23 Johnson LF Roczen DE Youkhana SK Nemani RR Bosch DF Mapping vineyard leaf area withmultispectral satellite imagery Comput Electron Agric 2003 38 33ndash44 [CrossRef]
24 Dobrowski SZ Ustin SL Wolpert JA Remote estimation of vine canopy density in verticallyshoot-positioned vineyards Determining optimal vegetation indices Aust J Grape Wine Res 2002 8117ndash125 [CrossRef]
25 Lopez-Lozano R Baret F de Cortazar-Atauri IG Bertrand N Casterad MA Optimal geometricconfiguration and algorithms for LAI indirect estimates under row canopies The case of vineyardsAgric For Meteorol 2009 149 1307ndash1316 [CrossRef]
Sensors 2016 16 2004 12 of 12
26 Jonckheere I Fleck S Nackaerts K Muys B Coppin P Weiss M Baret F Review of methods for in situleaf area index determination Part I Theories sensors and hemi-spherical photography Agric For Meteorol2004 121 19ndash35 [CrossRef]
27 Englund SR OrsquoBrien JJ Clark DB Evaluation of digital and film hemispherical photography forpredicting understorey light in a Bornean tropical rain forest Agric For Meteorol 2000 97 129ndash139
28 Confalonieri R Foi M Casa R Aquaro S Tona E Peterle M Boldini A De Carli G Ferrari AFinotto G et al Development of an app for estimating leaf area index using a smartphone Trueness andprecision determination and comparison with other indirect methods Comput Electron Agric 2013 9667ndash74 [CrossRef]
29 Warren-Wilson J Estimation of foliage denseness and foliage angle by inclined point quadrats Aust J Bot1963 11 95ndash105 [CrossRef]
30 Baret F de Solan B Lopez-Lozano R Ma K Weiss M GAI estimates of row crops from downwardlooking digital photos taken perpendicular to rows at 575 zenith angle Theoretical considerations based on3D architecture models and application to wheat crops Agric For Meteorol 2010 150 1393ndash1401 [CrossRef]
31 Francone C Pagani V Foi M Cappelli G Confalonieri R Comparison of leaf area index estimates byceptometerand PocketLAI smart app in canopies with different structures Field Crop Res 2014 155 38ndash41[CrossRef]
32 Orlando F Movedi E Paleari L Gilardelli C Foi M DellrsquoOro M Confalonieri R Estimating leaf areaindex in tree species using the PocketLAI smart app Appl Veg Sci 2015 18 716ndash723 [CrossRef]
33 Campos-Taberner M Garciacutea-Haro J Confalonieri R Martiacutenez B Moreno Aacute Saacutenchez-Ruiz SGilabert MA Camacho F Boschetti M Busetto L Multitemporal monitoring of plant area indexin the Valencia rice district with PocketLAI Remote Sens 2016 8 202ndash217 [CrossRef]
34 De Bei R Fuentes S Gilliham M Tyerman S Edwards E Bianchini N Smith J Collins C VitiCanopyA free computer App to estimate canopy vigor and porosity for grapevine Sensors 2016 16 585 [CrossRef][PubMed]
35 Lorenz DH Eichhorn KW Bleiholder H Klose R Meier U Weber E Growth Stages of the GrapevinePhenological growth stages of the grapevine (Vitis vinifera L ssp vinifera)mdashCodes and descriptionsaccording to the extended BBCH scale Aust J Grape Wine Res 1995 1 100ndash103 [CrossRef]
36 Liu C Kang S Li F Li S Du T Canopy leaf area index for apple tree using hemispherical photographyin arid region Sci Hortic 2013 164 610ndash615 [CrossRef]
37 Breda N Ground-based measurements of leaf area index A review of methods instruments and currentcontroversies J Exp Bot 2003 54 2403ndash2417 [CrossRef] [PubMed]
38 Joslashrgensen SE Kamp-Nielsen L Christensen T Windolf-Nielsen J Westergaard B Validation of aprognosis based upon a eutrophication model Ecol Model 1986 32 165ndash182 [CrossRef]
39 Schaeffer DL A model evaluation methodology applicable to environmental assessment models Ecol Model1980 8 275ndash295 [CrossRef]
40 Nash JE Sutcliffe JV River flow forecasting through conceptual models part I A discussion of principlesJ Hydrol 1970 10 282ndash290 [CrossRef]
41 Loague K Green RE Statistical and graphical methods for evaluating solute transport models Overviewand application J Contam Hydrol 1991 7 51ndash73 [CrossRef]
42 Jonckheere I Nackaerts K Muys B Coppin P Assessment of automatic gap fraction estimation of forestsfrom digital hemispherical photography Agric For Meteorol 2005 132 96ndash114 [CrossRef]
43 Smart RE Dick JK Gravett IM Fisher BM Canopy Management to Improve Grape Yield and WineQuality Principles and Practices S Afr J Enol Vitic 1990 11 3ndash17 Available online httpwwwsawislibrarycozadbtextimagesSmartR11pdf (accessed on 10 September 2016)
copy 2016 by the authors licensee MDPI Basel Switzerland This article is an open accessarticle distributed under the terms and conditions of the Creative Commons Attribution(CC-BY) license (httpcreativecommonsorglicensesby40)
- Introduction
- Materials and Methods
-
- Survey Scheme
- Indirect LAI Estimates
- Destructive LAI Measurement
- Data Analysis
-
- Results
-
- Performance of Indirect Methods
- PocketLAI and NDVI
-
- Discussion
- Conclusions
-

Sensors 2016 16 2004 5 of 12
Sensors 2016 16 2004 5 of 12
of each vine was obtained Then averaging the LAI of the sampled vines the mean plant LAI (LAIp) in each sampling area was calculated
Figure 1 Example of correct image captured with PocketLAI following the protocol (a) and wrong images that include the space below (b) or above (c) the vertical trained canopy of Vitis vinifera Protocols for LAI data acquisition (d) dark triangles and dotted lines = device orientation black points vineyard poles continuous line = vineyard row green leaves = measured vine grey leaves = adjacent vine
The LAIp provided by PocketLAI was converted in vineyard LAI (LAIv) using Equation (1) LAIv = LAIp 2DR (1)
where D (m) is the horizontal distance of the device from the cordon and R (m) is the row-spacing The equation was derived from the assumption that the LAIp obtained from PocketLAI is given
by the ratio between the plant leaf area and the unit ground surface considered by the smart-app (Equation (2)) The latter is the vine-spacing multiplied by the inter-row width considered by the PocketLAI on both sides of the row corresponding to the double of the distance between device and row (08 m)
The value of leaf area per plant assessed by PocketLAI was retrieved (Equation (3)) and referred to the unit of ground surface provided for single vine in the vineyard dividing by vine-spacing times row-spacing [16] (Equation (1)) The result is the conversion of LAIp in LAIv LAIp = LA2D times V (2) LA = LAIp times 2D times V (3)
where LA (m2) is the plant leaf area V (m) is the vine-spacing D (m) is the horizontal distance of the device from the cordon The hemispherical images were collected through fisheye lens using a protocol similar to that used for PocketLAI The camera was positioned below the canopy along the row line with the lens oriented upward acquiring two images from each plant moving horizontally at 20 and 40 cm from the pole The set of fisheye images from each sampling area was processed using the CAN-EYE software (v 6314 httpwwwavignoninrafrcan_eye) [15] since it demonstrated to be one of the best packages in a comparative study performed by Liu et al [36] The segmentation of the images targeted the discrimination of green organs from the sky background and from the brown pixels in order to exclude from the LAI estimate the contribution of the cordon and other minor woody components The lsquotrue LAIrsquo values provided by the software were used as LAIv The lsquotrue LAIrsquo is defined as the LAI value assessed by CAN-EYE taking into account the computation of average leaf inclination angle and clumping parameter
Figure 1 Example of correct image captured with PocketLAI following the protocol (a) andwrong images that include the space below (b) or above (c) the vertical trained canopy ofVitis vinifera Protocols for LAI data acquisition (d) dark triangles and dotted lines = deviceorientation black points vineyard poles continuous line = vineyard row green leaves = measured vinegrey leaves = adjacent vine
The LAIp provided by PocketLAI was converted in vineyard LAI (LAIv) using Equation (1)
LAIv = LAIp2DR
(1)
where D (m) is the horizontal distance of the device from the cordon and R (m) is the row-spacingThe equation was derived from the assumption that the LAIp obtained from PocketLAI is given
by the ratio between the plant leaf area and the unit ground surface considered by the smart-app(Equation (2)) The latter is the vine-spacing multiplied by the inter-row width considered by thePocketLAI on both sides of the row corresponding to the double of the distance between device androw (08 m)
The value of leaf area per plant assessed by PocketLAI was retrieved (Equation (3)) andreferred to the unit of ground surface provided for single vine in the vineyard dividing byvine-spacing times row-spacing [16] (Equation (1)) The result is the conversion of LAIp in LAIv
LAIp =LA
2D times V(2)
LA = LAIp times 2D times V (3)
where LA (m2) is the plant leaf area V (m) is the vine-spacing D (m) is the horizontal distance ofthe device from the cordon The hemispherical images were collected through fisheye lens usinga protocol similar to that used for PocketLAI The camera was positioned below the canopy along therow line with the lens oriented upward acquiring two images from each plant moving horizontallyat 20 and 40 cm from the pole The set of fisheye images from each sampling area was processed usingthe CAN-EYE software (v 6314 httpwwwavignoninrafrcan_eye) [15] since it demonstrated to beone of the best packages in a comparative study performed by Liu et al [36] The segmentation ofthe images targeted the discrimination of green organs from the sky background and from the brownpixels in order to exclude from the LAI estimate the contribution of the cordon and other minor woodycomponents The lsquotrue LAIrsquo values provided by the software were used as LAIv The lsquotrue LAIrsquo isdefined as the LAI value assessed by CAN-EYE taking into account the computation of average leafinclination angle and clumping parameter
Sensors 2016 16 2004 6 of 12
23 Destructive LAI Measurement
The LAI estimates from destructive sampling followed the approach suggested by Breda et al [37]and Johnson and Pierce [16] Destructive LAI measures were collected immediately upon completionof indirect estimates by removing all the leaves at the petiole from each sample plant Then for eachplant the leaf fresh weight (W) was determined and a disc of known area (001 m2) was obtained foreach of the leaves in a 40-leaf subsample including leaves of different ages The 40 discs per plant wereweighed and the specific leaf area (SLA m2middotgminus1 fw) was computed The obtained values of SLAW and plant density were used to derive the vineyard LAI (LAIv) according to Equation (4)
LAIv =WmiddotSLA
RmiddotS (4)
Therefore similarly to Equation (1) in order to compute LAIv the leaf area per plant was referredto the unit of ground surface provided for single vine in the vineyard [16]
24 Data Analysis
For each sampling area the agreement between mean LAIv values determined using destructiveand indirect methods was quantified using the following metrics relative root mean square error(RRMSE 0 to +infin optimum 0) [38] mean absolute error (MAE 0 to +infin optimum 0) [39] modellingefficiency (EF minusinfin to +1 optimum +1) [40] coefficient of residual mass (CRM from minusinfin to +infin optimum 0 if positive means underestimation and vice versa) [41] Moreover parameters of the linearregression equation between LAIv values estimated with direct and indirect methods were calculatedas well as between LAIv values and TL data Moreover for the sixth survey a relationship betweenPocketLAI estimates and NDVI data was computed and used to derive spatially distributed LAI valuesfor the entire vineyard
3 Results
31 Performance of Indirect Methods
The LAIv values obtained from destructive measurements during the campaign rangedfrom 013 to 284 in agreement with those normally reported in commercial vineyards [161725]The results of the comparison between LAIv values from PocketLAI DHP and destructivemeasurements are shown in Table 2 and Figure 2
Table 2 Agreement between LAIv estimated with PocketLAI hemispherical photography (DHP)and direct measurements considering the whole dataset (Dataset-1) and excluding the outlying valueof a very high-vigor sampling area (Dataset-2) and agreement between LAIv measured with differentmethods and the theoretical number of leaves (TL) Legend MAE mean absolute error RRMSErelative root mean square error EF modelling efficiency CRM coefficient of residual mass
Agreement between LAI Measurement Methods
PocketLAI vs Direct Measures DHP vs Direct Measures PocketLAI vs DHP
Dataset-1 Dataset-2 Dataset-1 Dataset-2 Dataset-1 Dataset-2
R2 077 094 094 085 068 084 MAE 015 009 066 060 057 057
RRMSE 4300 1727 9946 10079 5039 5039EF 074 093 minus040 minus129 minus014 minus014
CRM 006 minus004 minus087 minus093 046 046
Agreement between plant vigour descriptors
PocketLAI vs TL DHP vs TL Direct measures vs TL
R2 096 085 092
p lt 0001
Sensors 2016 16 2004 7 of 12Sensors 2016 16 2004 7 of 12
Figure 2 Agreement between LAIv data observed with direct measurement and those estimated with PocketLAI (ac) and hemispherical photography (DHP) (bd) considering the whole dataset (Dataset-1 ab) and excluding the outlier value of a very high-vigour sampling area (Dataset-2 cd)
Considering the whole dataset of surveys (Table 2 Dataset-1 Figure 2a) PocketLAI values were in agreement with those from destructive measurements with a highly significant correlation (p lt 0001) (R2 = 077) and practically without under- or over-estimating behaviors (CRM = 006) However the comparison was largely affected (RRMSE = 43) by a single value (LAIv = 284) corresponding to the sampling area characterized by the highest vigor identified via smart scouting before the last survey using the NDVI map The highest LAI value corresponds to the sampled area of the vineyard untreated by the green pruning and therefore it can be considered an outlying data
The exclusion of this single value from the dataset led to greatly improve the coherence between PocketLAI and destructive LAIv values (Table 2 Dataset-2 Figure 2c) The new values of the agreement metrics decidedly approximated their optimum values R2 was 094 RRMSE reached 17 and EF was 093
Considering the whole dataset (Table 2 Dataset-1 Figure 2b) DHP showed a systematic over-estimation (CRM = minus087) with high RRMSE (9946) and negative value of EF (meaning that the average of destructive measurements is a better estimator of each LAI value compared to the DHP values) On the other hand DHP showed high correlation with destructive LAIv values (R2 = 094) and its performances were not affected by the outlier value (ie no improvements detected repeating the analysis with the exclusion of the outlying value Table 2 Dataset-2 Figure 2d)
Both indirect methods showed highly significant correlations between LAIv estimates and the descriptor of plant vigour represented by TL (Table 2) with values of R2 similar to that achieved using the destructive method However a slightly better agreement between TL and LAIv was obtained for PocketLAI (R2 = 096 it was 085 for DHP)
Figure 3 shows the increasing trend of the mean LAIv during the growing season from the beginning of May to the end of June (ie during the first five surveys) Data confirmed what
Figure 2 Agreement between LAIv data observed with direct measurement and those estimatedwith PocketLAI (ac) and hemispherical photography (DHP) (bd) considering the whole dataset(Dataset-1 ab) and excluding the outlier value of a very high-vigour sampling area (Dataset-2 cd)
Considering the whole dataset of surveys (Table 2 Dataset-1 Figure 2a) PocketLAI values were inagreement with those from destructive measurements with a highly significant correlation (p lt 0001)(R2 = 077) and practically without under- or over-estimating behaviors (CRM = 006) However thecomparison was largely affected (RRMSE = 43) by a single value (LAIv = 284) corresponding tothe sampling area characterized by the highest vigor identified via smart scouting before the lastsurvey using the NDVI map The highest LAI value corresponds to the sampled area of the vineyarduntreated by the green pruning and therefore it can be considered an outlying data
The exclusion of this single value from the dataset led to greatly improve the coherence betweenPocketLAI and destructive LAIv values (Table 2 Dataset-2 Figure 2c) The new values of the agreementmetrics decidedly approximated their optimum values R2 was 094 RRMSE reached 17 and EFwas 093
Considering the whole dataset (Table 2 Dataset-1 Figure 2b) DHP showed a systematicover-estimation (CRM = minus087) with high RRMSE (9946) and negative value of EF (meaningthat the average of destructive measurements is a better estimator of each LAI value compared tothe DHP values) On the other hand DHP showed high correlation with destructive LAIv values(R2 = 094) and its performances were not affected by the outlier value (ie no improvements detectedrepeating the analysis with the exclusion of the outlying value Table 2 Dataset-2 Figure 2d)
Both indirect methods showed highly significant correlations between LAIv estimates and thedescriptor of plant vigour represented by TL (Table 2) with values of R2 similar to that achieved using
Sensors 2016 16 2004 8 of 12
the destructive method However a slightly better agreement between TL and LAIv was obtained forPocketLAI (R2 = 096 it was 085 for DHP)
Figure 3 shows the increasing trend of the mean LAIv during the growing season from thebeginning of May to the end of June (ie during the first five surveys) Data confirmed what discussedabove with the constant over-estimation of LAIv provided by the DHP whereas PocketLAI estimateswere always very close with destructive measurements Moreover at the second survey the DHPdetected an average LAI decrease of 019 not confirmed by the other measurement methods Theinconsistency was due to the sky lighting during the acquisition of hemispherical images Duringthe second survey the conditions (sunny day and survey carried out with sun at the zenith) ledto high level of sunlight affecting the evenness of foliage lighting with resulting uncertainty inimage segmentation This led to underestimation errors as already observed by other authors [2642]The PocketLAI view angle of 575 minimized the effect of those conditions because contrarily tohemispherical photography the device camera was not oriented directly toward the zenith duringimage acquisition
Sensors 2016 16 2004 8 of 12
discussed above with the constant over-estimation of LAIv provided by the DHP whereas PocketLAI estimates were always very close with destructive measurements Moreover at the second survey the DHP detected an average LAI decrease of 019 not confirmed by the other measurement methods The inconsistency was due to the sky lighting during the acquisition of hemispherical images During the second survey the conditions (sunny day and survey carried out with sun at the zenith) led to high level of sunlight affecting the evenness of foliage lighting with resulting uncertainty in image segmentation This led to underestimation errors as already observed by other authors [2642] The PocketLAI view angle of 575deg minimized the effect of those conditions because contrarily to hemispherical photography the device camera was not oriented directly toward the zenith during image acquisition
Figure 3 Average trend of LAIv observed during the monitoring of three rows from the beginning of May to the end of June with direct and indirect methods
32 PocketLAI and NDVI
The pixels of the georeferenced NDVI map of the vineyard were clustered into five classes using the ArcGIS v10 package and PocketLAI estimates were collected at the sixth survey in sampling area representative of each class (Figure 4a) A regression equation (R2 = 090) was then derived between the LAIv obtained from PocketLAI and NDVI values in the sampling areas (indicated by black circles in Figure 4a) The regression equation was then used to convert all the other NDVI pixels of the map into LAIv values using the spatial analysis tool of ArcGIS for raster reclassification to obtain spatially distributed LAI data (Figure 4b) Figure 4b shows the resulting high resolution vineyard LAI map derived from the combination of the vegetation index and only five PocketLAI estimates (smart scouting)
Figure 3 Average trend of LAIv observed during the monitoring of three rows from the beginning ofMay to the end of June with direct and indirect methods
32 PocketLAI and NDVI
The pixels of the georeferenced NDVI map of the vineyard were clustered into five classes usingthe ArcGIS v10 package and PocketLAI estimates were collected at the sixth survey in sampling arearepresentative of each class (Figure 4a) A regression equation (R2 = 090) was then derived betweenthe LAIv obtained from PocketLAI and NDVI values in the sampling areas (indicated by black circlesin Figure 4a) The regression equation was then used to convert all the other NDVI pixels of themap into LAIv values using the spatial analysis tool of ArcGIS for raster reclassification to obtainspatially distributed LAI data (Figure 4b) Figure 4b shows the resulting high resolution vineyardLAI map derived from the combination of the vegetation index and only five PocketLAI estimates(smart scouting)
Sensors 2016 16 2004 9 of 12Sensors 2016 16 2004 9 of 12
Figure 4 NDVI map of the vineyard (a) with pixels clustered in five classes as shown by the legend and indications on where PocketLAI estimates were collected and the corresponding LAIv map (b) derived from the relationship between NDVI and PocketLAI measurements in the five points representative of each NDVI class
4 Discussion
In general the LAI values estimated using PocketLAI and those measured using destructive method were consistent with a coefficient of determination ranging from 077 (Figure 2a) to 094 (Figure 2d) depending on the inclusion or not in the analysis of a vineyard LAI close to 3 (LAIv = 284 with destructive method) observed in a unusually high-vigor sampling area due to the absence of green pruning applications This value converted in vine LAI (Equation (2)) corresponds to an observed plant LAI close to 7 (LAIp = 68)
This value can be considered as outlying in vineyards as confirmed eg by the LAI ranges reported by Pergher and Petris [12] For similar vine training systems this study shows LAI values ranging from 0 to 4 measured across many seasons (from 1993 to 2005) from leaf development (code 13 BBCH scale) to the beginning of ripening (code 81 BBCH scale)
Excluding this value the maximum vineyard LAI observed was below 2 (LAIv = 141 with direct method) corresponding to a vine LAI lower than 4 (LAIp = 34) These results confirmed the tendency of PocketLAI (and of most indirect methods based on the inversion of light transmittance models) to underestimate high LAI values because of a saturation effect [26] In case of PocketLAI the effect was already discussed by Francone et al [31] for dense maize and giant reed canopies In that case the authors obtained pronounced underestimations especially in case of giant reed canopies exceeding 5 The reasons were the saturation effect and the strong deviation of industrial giant reed plants from the ideal assumption behind light transmittance models (randomly distributed infinitely small leaves) The same explanation is valid for the case of vineyard (leaves clumped in walls) However PocketLAI can be considered a suitable tool for monitoring Vitis vinifera LAI development since it showed inaccuracies only in an uncommon case of vine untreated with green pruning This practice is usually adopted in viticulture in order to decrease the shading on the grapes and create microclimatic condition inside the canopy unfavorable to pest infection [43]
Concerning the smart scouting activities the coupling between NDVI map and in-situ LAI data measured with PocketLAI proved to be an interesting approach able to provide a description of the vineyard canopy LAI in absolute terms The possibility to convert an NDVI map able to describe
Figure 4 NDVI map of the vineyard (a) with pixels clustered in five classes as shown by the legend andindications on where PocketLAI estimates were collected and the corresponding LAIv map (b) derivedfrom the relationship between NDVI and PocketLAI measurements in the five points representative ofeach NDVI class
4 Discussion
In general the LAI values estimated using PocketLAI and those measured using destructivemethod were consistent with a coefficient of determination ranging from 077 (Figure 2a) to094 (Figure 2d) depending on the inclusion or not in the analysis of a vineyard LAI closeto 3 (LAIv = 284 with destructive method) observed in a unusually high-vigor sampling area dueto the absence of green pruning applications This value converted in vine LAI (Equation (2))corresponds to an observed plant LAI close to 7 (LAIp = 68)
This value can be considered as outlying in vineyards as confirmed eg by the LAI rangesreported by Pergher and Petris [12] For similar vine training systems this study shows LAI valuesranging from 0 to 4 measured across many seasons (from 1993 to 2005) from leaf development(code 13 BBCH scale) to the beginning of ripening (code 81 BBCH scale)
Excluding this value the maximum vineyard LAI observed was below 2 (LAIv = 141 withdirect method) corresponding to a vine LAI lower than 4 (LAIp = 34) These results confirmed thetendency of PocketLAI (and of most indirect methods based on the inversion of light transmittancemodels) to underestimate high LAI values because of a saturation effect [26] In case of PocketLAIthe effect was already discussed by Francone et al [31] for dense maize and giant reed canopiesIn that case the authors obtained pronounced underestimations especially in case of giant reedcanopies exceeding 5 The reasons were the saturation effect and the strong deviation of industrialgiant reed plants from the ideal assumption behind light transmittance models (randomly distributedinfinitely small leaves) The same explanation is valid for the case of vineyard (leaves clumpedin walls) However PocketLAI can be considered a suitable tool for monitoring Vitis vinifera LAIdevelopment since it showed inaccuracies only in an uncommon case of vine untreated with greenpruning This practice is usually adopted in viticulture in order to decrease the shading on the grapesand create microclimatic condition inside the canopy unfavorable to pest infection [43]
Sensors 2016 16 2004 10 of 12
Concerning the smart scouting activities the coupling between NDVI map and in-situ LAIdata measured with PocketLAI proved to be an interesting approach able to provide a descriptionof the vineyard canopy LAI in absolute terms The possibility to convert an NDVI map able todescribe differences in space only in relative terms to a LAI map acquires a special relevance whenthe optimization of farming practices requires a description of the vineyard based on absolute valueslike in the case of pesticide dose adjustment
In case of DHP the correlation between indirect estimates and destructive measurements wasfully satisfactory (R2 = 094) and the method did not show saturation effect although estimates wereconsistently affected by a relevant overestimation error The overestimation was quite constant andindependent from absolute LAI values since it was observed throughout the season Similar resultswere found by Lopez-Lozano et al [25] who compared different tools for LAI estimation in vineyardsincluding DHP The authors discussed that the lsquotrue LAIrsquo values provided by the same software weused (CAN-EYE) led to overestimating destructive LAI values by a factor around 16 (the value weobtained here was around 26) These results suggested the possibility to apply a specific correctionfactor for DHP improving the performance of the method for the vineyard case
Neither PocketLAI nor DHP showed changes in reliability for different phenological stagesExcluding the outlying value discussed above differences in mean absolute error never exceeded 017and 044 for PocketLAI and DHP respectively and no trends were observed for the evaluation metricsas a function of development stage
5 Conclusions
Both indirect methods based on digital image processing ie the PocketLAI smart-app andhemispherical photography proved their reliability for monitoring the spatial and temporal variabilityof vine vigor in cordon-trained system and to provide LAI values However DHP highlighted theneed to assess a correction factor because of overestimation errors already discussed for vineyards [25]whereas PocketLAI showed a certain saturation effect for vine LAI approaching or exceeding 5 or 6However the latter is an uncommon condition with respect to the most widespread vine trainingsystems because the green pruning lead to lower LAI values
Moreover with respect to DHP PocketLAI entails the advantages of automatic (completelyunsupervised) and real-time provision of LAI data and the suitability for operational purposesin addition to its low-cost and user-friendliness In this context PocketLAI shows a potential for a widerange of applications such as the spatial-temporal optimization of the agronomic inputs especially incombination with remote sensing products
Author Contributions FO performed the data analysis set the equations to convert plant-LAI into vineyard-LAIestablished the protocol for indirect measurements comparing different tests LB and RC conceived anddesigned the experiments FO and RC wrote the paper EM performed the hemispherical images processingexploring the best options setting with CanEye EM and DC carried out the indirect measurements SP andTG carried out the destructive LAI measurements SP set the figures VP performed the elaboration concerningthe remote sensing data
Conflicts of Interest The authors declare no conflict of interest
References
1 Watson DJ Comparative physiological studies on the growth of field crops I Variation in net assimilationrate and leaf area between species and varieties and within and between years Ann Bot Lond 1947 1141ndash76 [CrossRef]
2 Dokoozlian N Kliewer W The light environment within grapevine canopies II Influence of leaf areadensity on fruit zone light environment and some canopy assessment Am J Enol Vitic 1995 46 219ndash226
3 Winkler AJ The relation of leaf area and climate to vine performance and grape quality Am J Enol Vitic1958 9 10ndash23
4 Smart RE Principles of grapevine canopy microclimate manipulation with implications for yield andquality A review Am J Enol Vitic 1985 36 230ndash239
Sensors 2016 16 2004 11 of 12
5 Cunha M Marccedilal ARS Silva L Very early prediction of wine yield based on satellite data fromVEGETATION Int J Remote Sens 2010 31 3125ndash3142 [CrossRef]
6 Williams LE Ayars JE Grapevine water use and the crop coefficient are linear functions of the shadedarea measured beneath the canopy Agric For Meteorol 2005 132 201ndash211 [CrossRef]
7 English J Thomas C Marois J Gubler W Microclimates of grapevine canopies associated with leafremoval and control of Botrytis bunch rot Phytopathology 1989 79 395ndash401 [CrossRef]
8 Gil E Escola A Rosell JR Planas S Val L Variable rate application of plant protection products invineyard using ultrasonic sensors Crop Prot 2007 26 1287ndash1297 [CrossRef]
9 Walklate PJ Cross JV Pergher G Support system for efficient dosage of orchard and vineyard sprayingproducts Comput Electron Agric 2011 75 355ndash362 [CrossRef]
10 Viret O Dubuis PH Bloesch B Fabre AL Dupuis D Dosage des fongicides adapteacute agrave la surface foliaireen viticulture Efficaciteacute de la lutte Rev Suisse Vitic Arboric Hortic 2010 42 226ndash233 (In Italian)
11 Pergher G Metodi per adeguare la dose di agrofarmaco alle caratteristiche della chioma nei trattamenti allecolture arboree In Proceedings of the Problemi Sanitari Delle Colture Ortoflorovivaistiche ed EvoluzioneDelle Strategie di Difesa Turin Italy 28 Februaryndash2 March 2007 pp 15ndash19 (In Italian)
12 Pergher G Petris R Pesticide Dose Adjustment in Vineyard Spraying and Potential for Dose ReductionAgric Eng Int CIGR J 2008 X Available online httpscigrjournalorgindexphpEjounralarticleviewFile12541111 (accessed on 10 October 2016)
13 Siegfried W Viret O Huber B Wohlhauser R Dosage of plant protection products adapted to leaf areaindex in viticulture Crop Prot 2007 26 73ndash82 [CrossRef]
14 Campbell GS Norman JM An Introduction to Environmental Biophysics 2nd ed Springer New York NYUSA 1998
15 Weiss M Baret F Smith GJ Jonckheere I Coppin P Review of methods for in situ leaf area index(LAI) determination Part II Estimation of LAI errors and sampling Agric For Meteorol 2004 121 37ndash53[CrossRef]
16 Johnson LF Pierce LL Indirect measurement of Leaf Area Index in California North Coast vineyardsHortScience 2004 39 236ndash238
17 Lopez-Lozano R Casterad MA Comparison of different protocols for indirect measurement of leaf areaindex with ceptometers in vertically trained vineyards Aust J Grape Wine Res 2013 19 116ndash122 [CrossRef]
18 Bronge BL Vegetation indices for estimation of LAI FPAR and primary productionmdashParameters influencingthe relationships In Satellite Remote Sensing for Estimating Leaf Area Index FPAR and Primary ProductionA Literature Review No SKB-Rndash04-24 Swedish Nuclear Fuel and Waste Management Co StockholmSweden 2004
19 Zarco-Tejada PJ Berjoacuten A Loacutepez-Lozano R Miller JR Martiacuten P Cachorro V Gonzaacutelez MR deFrutos A Assessing vineyard condition with hyperspectral indices Leaf and canopy reflectance simulationin a row-structured discontinuous canopy Remote Sens Environ 2005 99 271ndash287 [CrossRef]
20 Fuentes S Poblete-Echeverriacutea C Ortega-Farias S Tyerman S De Bei R Automated estimation of leafarea index from grapevine canopies using cover photography video and computational analysis methodsAust J Grape Wine Res 2014 20 465ndash473 [CrossRef]
21 Hall A Lamb DW Holzapfel B Louis J Optical remote sensing applications in viticulturemdashA reviewAust J Grape Wine Res 2002 8 36ndash47 [CrossRef]
22 Drissi R Goutouly JP Forget D Gaudillere JP Nondestructive Measurement of Grapevine Leaf Area byGround Normalized Difference Vegetation Index Agron J 2009 101 226ndash231 [CrossRef]
23 Johnson LF Roczen DE Youkhana SK Nemani RR Bosch DF Mapping vineyard leaf area withmultispectral satellite imagery Comput Electron Agric 2003 38 33ndash44 [CrossRef]
24 Dobrowski SZ Ustin SL Wolpert JA Remote estimation of vine canopy density in verticallyshoot-positioned vineyards Determining optimal vegetation indices Aust J Grape Wine Res 2002 8117ndash125 [CrossRef]
25 Lopez-Lozano R Baret F de Cortazar-Atauri IG Bertrand N Casterad MA Optimal geometricconfiguration and algorithms for LAI indirect estimates under row canopies The case of vineyardsAgric For Meteorol 2009 149 1307ndash1316 [CrossRef]
Sensors 2016 16 2004 12 of 12
26 Jonckheere I Fleck S Nackaerts K Muys B Coppin P Weiss M Baret F Review of methods for in situleaf area index determination Part I Theories sensors and hemi-spherical photography Agric For Meteorol2004 121 19ndash35 [CrossRef]
27 Englund SR OrsquoBrien JJ Clark DB Evaluation of digital and film hemispherical photography forpredicting understorey light in a Bornean tropical rain forest Agric For Meteorol 2000 97 129ndash139
28 Confalonieri R Foi M Casa R Aquaro S Tona E Peterle M Boldini A De Carli G Ferrari AFinotto G et al Development of an app for estimating leaf area index using a smartphone Trueness andprecision determination and comparison with other indirect methods Comput Electron Agric 2013 9667ndash74 [CrossRef]
29 Warren-Wilson J Estimation of foliage denseness and foliage angle by inclined point quadrats Aust J Bot1963 11 95ndash105 [CrossRef]
30 Baret F de Solan B Lopez-Lozano R Ma K Weiss M GAI estimates of row crops from downwardlooking digital photos taken perpendicular to rows at 575 zenith angle Theoretical considerations based on3D architecture models and application to wheat crops Agric For Meteorol 2010 150 1393ndash1401 [CrossRef]
31 Francone C Pagani V Foi M Cappelli G Confalonieri R Comparison of leaf area index estimates byceptometerand PocketLAI smart app in canopies with different structures Field Crop Res 2014 155 38ndash41[CrossRef]
32 Orlando F Movedi E Paleari L Gilardelli C Foi M DellrsquoOro M Confalonieri R Estimating leaf areaindex in tree species using the PocketLAI smart app Appl Veg Sci 2015 18 716ndash723 [CrossRef]
33 Campos-Taberner M Garciacutea-Haro J Confalonieri R Martiacutenez B Moreno Aacute Saacutenchez-Ruiz SGilabert MA Camacho F Boschetti M Busetto L Multitemporal monitoring of plant area indexin the Valencia rice district with PocketLAI Remote Sens 2016 8 202ndash217 [CrossRef]
34 De Bei R Fuentes S Gilliham M Tyerman S Edwards E Bianchini N Smith J Collins C VitiCanopyA free computer App to estimate canopy vigor and porosity for grapevine Sensors 2016 16 585 [CrossRef][PubMed]
35 Lorenz DH Eichhorn KW Bleiholder H Klose R Meier U Weber E Growth Stages of the GrapevinePhenological growth stages of the grapevine (Vitis vinifera L ssp vinifera)mdashCodes and descriptionsaccording to the extended BBCH scale Aust J Grape Wine Res 1995 1 100ndash103 [CrossRef]
36 Liu C Kang S Li F Li S Du T Canopy leaf area index for apple tree using hemispherical photographyin arid region Sci Hortic 2013 164 610ndash615 [CrossRef]
37 Breda N Ground-based measurements of leaf area index A review of methods instruments and currentcontroversies J Exp Bot 2003 54 2403ndash2417 [CrossRef] [PubMed]
38 Joslashrgensen SE Kamp-Nielsen L Christensen T Windolf-Nielsen J Westergaard B Validation of aprognosis based upon a eutrophication model Ecol Model 1986 32 165ndash182 [CrossRef]
39 Schaeffer DL A model evaluation methodology applicable to environmental assessment models Ecol Model1980 8 275ndash295 [CrossRef]
40 Nash JE Sutcliffe JV River flow forecasting through conceptual models part I A discussion of principlesJ Hydrol 1970 10 282ndash290 [CrossRef]
41 Loague K Green RE Statistical and graphical methods for evaluating solute transport models Overviewand application J Contam Hydrol 1991 7 51ndash73 [CrossRef]
42 Jonckheere I Nackaerts K Muys B Coppin P Assessment of automatic gap fraction estimation of forestsfrom digital hemispherical photography Agric For Meteorol 2005 132 96ndash114 [CrossRef]
43 Smart RE Dick JK Gravett IM Fisher BM Canopy Management to Improve Grape Yield and WineQuality Principles and Practices S Afr J Enol Vitic 1990 11 3ndash17 Available online httpwwwsawislibrarycozadbtextimagesSmartR11pdf (accessed on 10 September 2016)
copy 2016 by the authors licensee MDPI Basel Switzerland This article is an open accessarticle distributed under the terms and conditions of the Creative Commons Attribution(CC-BY) license (httpcreativecommonsorglicensesby40)
- Introduction
- Materials and Methods
-
- Survey Scheme
- Indirect LAI Estimates
- Destructive LAI Measurement
- Data Analysis
-
- Results
-
- Performance of Indirect Methods
- PocketLAI and NDVI
-
- Discussion
- Conclusions
-
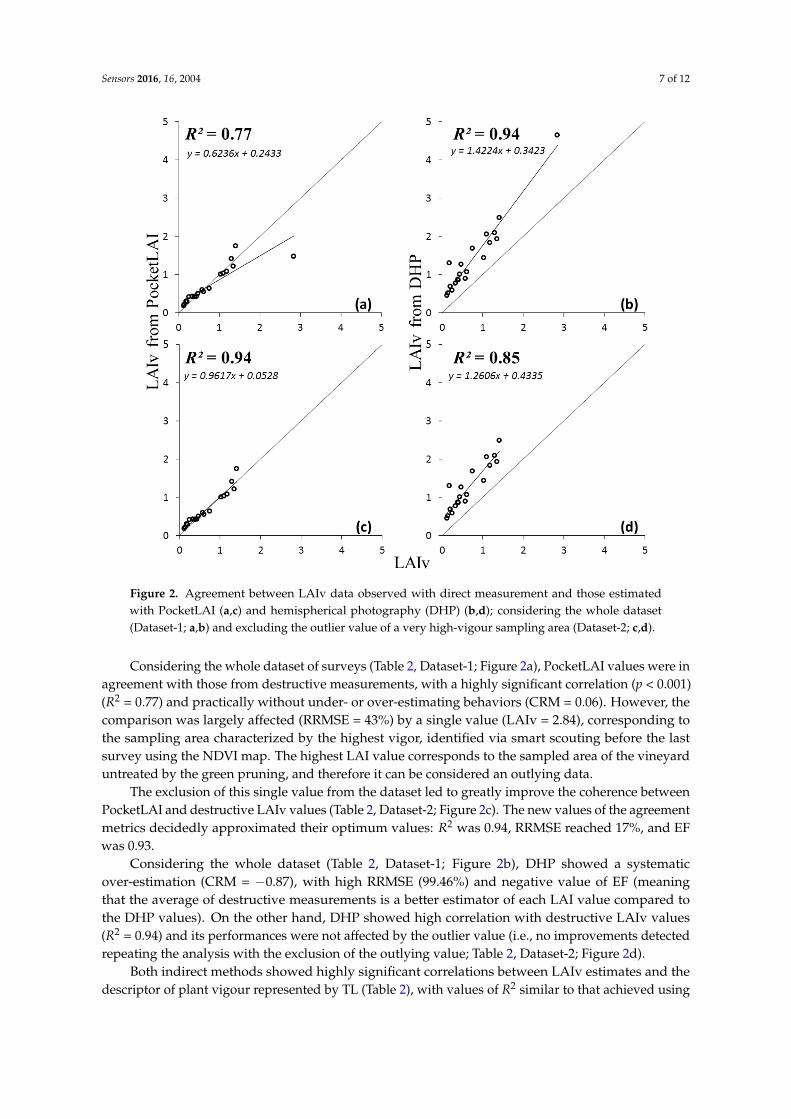

Sensors 2016 16 2004 8 of 12
the destructive method However a slightly better agreement between TL and LAIv was obtained forPocketLAI (R2 = 096 it was 085 for DHP)
Figure 3 shows the increasing trend of the mean LAIv during the growing season from thebeginning of May to the end of June (ie during the first five surveys) Data confirmed what discussedabove with the constant over-estimation of LAIv provided by the DHP whereas PocketLAI estimateswere always very close with destructive measurements Moreover at the second survey the DHPdetected an average LAI decrease of 019 not confirmed by the other measurement methods Theinconsistency was due to the sky lighting during the acquisition of hemispherical images Duringthe second survey the conditions (sunny day and survey carried out with sun at the zenith) ledto high level of sunlight affecting the evenness of foliage lighting with resulting uncertainty inimage segmentation This led to underestimation errors as already observed by other authors [2642]The PocketLAI view angle of 575 minimized the effect of those conditions because contrarily tohemispherical photography the device camera was not oriented directly toward the zenith duringimage acquisition
Sensors 2016 16 2004 8 of 12
discussed above with the constant over-estimation of LAIv provided by the DHP whereas PocketLAI estimates were always very close with destructive measurements Moreover at the second survey the DHP detected an average LAI decrease of 019 not confirmed by the other measurement methods The inconsistency was due to the sky lighting during the acquisition of hemispherical images During the second survey the conditions (sunny day and survey carried out with sun at the zenith) led to high level of sunlight affecting the evenness of foliage lighting with resulting uncertainty in image segmentation This led to underestimation errors as already observed by other authors [2642] The PocketLAI view angle of 575deg minimized the effect of those conditions because contrarily to hemispherical photography the device camera was not oriented directly toward the zenith during image acquisition
Figure 3 Average trend of LAIv observed during the monitoring of three rows from the beginning of May to the end of June with direct and indirect methods
32 PocketLAI and NDVI
The pixels of the georeferenced NDVI map of the vineyard were clustered into five classes using the ArcGIS v10 package and PocketLAI estimates were collected at the sixth survey in sampling area representative of each class (Figure 4a) A regression equation (R2 = 090) was then derived between the LAIv obtained from PocketLAI and NDVI values in the sampling areas (indicated by black circles in Figure 4a) The regression equation was then used to convert all the other NDVI pixels of the map into LAIv values using the spatial analysis tool of ArcGIS for raster reclassification to obtain spatially distributed LAI data (Figure 4b) Figure 4b shows the resulting high resolution vineyard LAI map derived from the combination of the vegetation index and only five PocketLAI estimates (smart scouting)
Figure 3 Average trend of LAIv observed during the monitoring of three rows from the beginning ofMay to the end of June with direct and indirect methods
32 PocketLAI and NDVI
The pixels of the georeferenced NDVI map of the vineyard were clustered into five classes usingthe ArcGIS v10 package and PocketLAI estimates were collected at the sixth survey in sampling arearepresentative of each class (Figure 4a) A regression equation (R2 = 090) was then derived betweenthe LAIv obtained from PocketLAI and NDVI values in the sampling areas (indicated by black circlesin Figure 4a) The regression equation was then used to convert all the other NDVI pixels of themap into LAIv values using the spatial analysis tool of ArcGIS for raster reclassification to obtainspatially distributed LAI data (Figure 4b) Figure 4b shows the resulting high resolution vineyardLAI map derived from the combination of the vegetation index and only five PocketLAI estimates(smart scouting)
Sensors 2016 16 2004 9 of 12Sensors 2016 16 2004 9 of 12
Figure 4 NDVI map of the vineyard (a) with pixels clustered in five classes as shown by the legend and indications on where PocketLAI estimates were collected and the corresponding LAIv map (b) derived from the relationship between NDVI and PocketLAI measurements in the five points representative of each NDVI class
4 Discussion
In general the LAI values estimated using PocketLAI and those measured using destructive method were consistent with a coefficient of determination ranging from 077 (Figure 2a) to 094 (Figure 2d) depending on the inclusion or not in the analysis of a vineyard LAI close to 3 (LAIv = 284 with destructive method) observed in a unusually high-vigor sampling area due to the absence of green pruning applications This value converted in vine LAI (Equation (2)) corresponds to an observed plant LAI close to 7 (LAIp = 68)
This value can be considered as outlying in vineyards as confirmed eg by the LAI ranges reported by Pergher and Petris [12] For similar vine training systems this study shows LAI values ranging from 0 to 4 measured across many seasons (from 1993 to 2005) from leaf development (code 13 BBCH scale) to the beginning of ripening (code 81 BBCH scale)
Excluding this value the maximum vineyard LAI observed was below 2 (LAIv = 141 with direct method) corresponding to a vine LAI lower than 4 (LAIp = 34) These results confirmed the tendency of PocketLAI (and of most indirect methods based on the inversion of light transmittance models) to underestimate high LAI values because of a saturation effect [26] In case of PocketLAI the effect was already discussed by Francone et al [31] for dense maize and giant reed canopies In that case the authors obtained pronounced underestimations especially in case of giant reed canopies exceeding 5 The reasons were the saturation effect and the strong deviation of industrial giant reed plants from the ideal assumption behind light transmittance models (randomly distributed infinitely small leaves) The same explanation is valid for the case of vineyard (leaves clumped in walls) However PocketLAI can be considered a suitable tool for monitoring Vitis vinifera LAI development since it showed inaccuracies only in an uncommon case of vine untreated with green pruning This practice is usually adopted in viticulture in order to decrease the shading on the grapes and create microclimatic condition inside the canopy unfavorable to pest infection [43]
Concerning the smart scouting activities the coupling between NDVI map and in-situ LAI data measured with PocketLAI proved to be an interesting approach able to provide a description of the vineyard canopy LAI in absolute terms The possibility to convert an NDVI map able to describe
Figure 4 NDVI map of the vineyard (a) with pixels clustered in five classes as shown by the legend andindications on where PocketLAI estimates were collected and the corresponding LAIv map (b) derivedfrom the relationship between NDVI and PocketLAI measurements in the five points representative ofeach NDVI class
4 Discussion
In general the LAI values estimated using PocketLAI and those measured using destructivemethod were consistent with a coefficient of determination ranging from 077 (Figure 2a) to094 (Figure 2d) depending on the inclusion or not in the analysis of a vineyard LAI closeto 3 (LAIv = 284 with destructive method) observed in a unusually high-vigor sampling area dueto the absence of green pruning applications This value converted in vine LAI (Equation (2))corresponds to an observed plant LAI close to 7 (LAIp = 68)
This value can be considered as outlying in vineyards as confirmed eg by the LAI rangesreported by Pergher and Petris [12] For similar vine training systems this study shows LAI valuesranging from 0 to 4 measured across many seasons (from 1993 to 2005) from leaf development(code 13 BBCH scale) to the beginning of ripening (code 81 BBCH scale)
Excluding this value the maximum vineyard LAI observed was below 2 (LAIv = 141 withdirect method) corresponding to a vine LAI lower than 4 (LAIp = 34) These results confirmed thetendency of PocketLAI (and of most indirect methods based on the inversion of light transmittancemodels) to underestimate high LAI values because of a saturation effect [26] In case of PocketLAIthe effect was already discussed by Francone et al [31] for dense maize and giant reed canopiesIn that case the authors obtained pronounced underestimations especially in case of giant reedcanopies exceeding 5 The reasons were the saturation effect and the strong deviation of industrialgiant reed plants from the ideal assumption behind light transmittance models (randomly distributedinfinitely small leaves) The same explanation is valid for the case of vineyard (leaves clumpedin walls) However PocketLAI can be considered a suitable tool for monitoring Vitis vinifera LAIdevelopment since it showed inaccuracies only in an uncommon case of vine untreated with greenpruning This practice is usually adopted in viticulture in order to decrease the shading on the grapesand create microclimatic condition inside the canopy unfavorable to pest infection [43]
Sensors 2016 16 2004 10 of 12
Concerning the smart scouting activities the coupling between NDVI map and in-situ LAIdata measured with PocketLAI proved to be an interesting approach able to provide a descriptionof the vineyard canopy LAI in absolute terms The possibility to convert an NDVI map able todescribe differences in space only in relative terms to a LAI map acquires a special relevance whenthe optimization of farming practices requires a description of the vineyard based on absolute valueslike in the case of pesticide dose adjustment
In case of DHP the correlation between indirect estimates and destructive measurements wasfully satisfactory (R2 = 094) and the method did not show saturation effect although estimates wereconsistently affected by a relevant overestimation error The overestimation was quite constant andindependent from absolute LAI values since it was observed throughout the season Similar resultswere found by Lopez-Lozano et al [25] who compared different tools for LAI estimation in vineyardsincluding DHP The authors discussed that the lsquotrue LAIrsquo values provided by the same software weused (CAN-EYE) led to overestimating destructive LAI values by a factor around 16 (the value weobtained here was around 26) These results suggested the possibility to apply a specific correctionfactor for DHP improving the performance of the method for the vineyard case
Neither PocketLAI nor DHP showed changes in reliability for different phenological stagesExcluding the outlying value discussed above differences in mean absolute error never exceeded 017and 044 for PocketLAI and DHP respectively and no trends were observed for the evaluation metricsas a function of development stage
5 Conclusions
Both indirect methods based on digital image processing ie the PocketLAI smart-app andhemispherical photography proved their reliability for monitoring the spatial and temporal variabilityof vine vigor in cordon-trained system and to provide LAI values However DHP highlighted theneed to assess a correction factor because of overestimation errors already discussed for vineyards [25]whereas PocketLAI showed a certain saturation effect for vine LAI approaching or exceeding 5 or 6However the latter is an uncommon condition with respect to the most widespread vine trainingsystems because the green pruning lead to lower LAI values
Moreover with respect to DHP PocketLAI entails the advantages of automatic (completelyunsupervised) and real-time provision of LAI data and the suitability for operational purposesin addition to its low-cost and user-friendliness In this context PocketLAI shows a potential for a widerange of applications such as the spatial-temporal optimization of the agronomic inputs especially incombination with remote sensing products
Author Contributions FO performed the data analysis set the equations to convert plant-LAI into vineyard-LAIestablished the protocol for indirect measurements comparing different tests LB and RC conceived anddesigned the experiments FO and RC wrote the paper EM performed the hemispherical images processingexploring the best options setting with CanEye EM and DC carried out the indirect measurements SP andTG carried out the destructive LAI measurements SP set the figures VP performed the elaboration concerningthe remote sensing data
Conflicts of Interest The authors declare no conflict of interest
References
1 Watson DJ Comparative physiological studies on the growth of field crops I Variation in net assimilationrate and leaf area between species and varieties and within and between years Ann Bot Lond 1947 1141ndash76 [CrossRef]
2 Dokoozlian N Kliewer W The light environment within grapevine canopies II Influence of leaf areadensity on fruit zone light environment and some canopy assessment Am J Enol Vitic 1995 46 219ndash226
3 Winkler AJ The relation of leaf area and climate to vine performance and grape quality Am J Enol Vitic1958 9 10ndash23
4 Smart RE Principles of grapevine canopy microclimate manipulation with implications for yield andquality A review Am J Enol Vitic 1985 36 230ndash239
Sensors 2016 16 2004 11 of 12
5 Cunha M Marccedilal ARS Silva L Very early prediction of wine yield based on satellite data fromVEGETATION Int J Remote Sens 2010 31 3125ndash3142 [CrossRef]
6 Williams LE Ayars JE Grapevine water use and the crop coefficient are linear functions of the shadedarea measured beneath the canopy Agric For Meteorol 2005 132 201ndash211 [CrossRef]
7 English J Thomas C Marois J Gubler W Microclimates of grapevine canopies associated with leafremoval and control of Botrytis bunch rot Phytopathology 1989 79 395ndash401 [CrossRef]
8 Gil E Escola A Rosell JR Planas S Val L Variable rate application of plant protection products invineyard using ultrasonic sensors Crop Prot 2007 26 1287ndash1297 [CrossRef]
9 Walklate PJ Cross JV Pergher G Support system for efficient dosage of orchard and vineyard sprayingproducts Comput Electron Agric 2011 75 355ndash362 [CrossRef]
10 Viret O Dubuis PH Bloesch B Fabre AL Dupuis D Dosage des fongicides adapteacute agrave la surface foliaireen viticulture Efficaciteacute de la lutte Rev Suisse Vitic Arboric Hortic 2010 42 226ndash233 (In Italian)
11 Pergher G Metodi per adeguare la dose di agrofarmaco alle caratteristiche della chioma nei trattamenti allecolture arboree In Proceedings of the Problemi Sanitari Delle Colture Ortoflorovivaistiche ed EvoluzioneDelle Strategie di Difesa Turin Italy 28 Februaryndash2 March 2007 pp 15ndash19 (In Italian)
12 Pergher G Petris R Pesticide Dose Adjustment in Vineyard Spraying and Potential for Dose ReductionAgric Eng Int CIGR J 2008 X Available online httpscigrjournalorgindexphpEjounralarticleviewFile12541111 (accessed on 10 October 2016)
13 Siegfried W Viret O Huber B Wohlhauser R Dosage of plant protection products adapted to leaf areaindex in viticulture Crop Prot 2007 26 73ndash82 [CrossRef]
14 Campbell GS Norman JM An Introduction to Environmental Biophysics 2nd ed Springer New York NYUSA 1998
15 Weiss M Baret F Smith GJ Jonckheere I Coppin P Review of methods for in situ leaf area index(LAI) determination Part II Estimation of LAI errors and sampling Agric For Meteorol 2004 121 37ndash53[CrossRef]
16 Johnson LF Pierce LL Indirect measurement of Leaf Area Index in California North Coast vineyardsHortScience 2004 39 236ndash238
17 Lopez-Lozano R Casterad MA Comparison of different protocols for indirect measurement of leaf areaindex with ceptometers in vertically trained vineyards Aust J Grape Wine Res 2013 19 116ndash122 [CrossRef]
18 Bronge BL Vegetation indices for estimation of LAI FPAR and primary productionmdashParameters influencingthe relationships In Satellite Remote Sensing for Estimating Leaf Area Index FPAR and Primary ProductionA Literature Review No SKB-Rndash04-24 Swedish Nuclear Fuel and Waste Management Co StockholmSweden 2004
19 Zarco-Tejada PJ Berjoacuten A Loacutepez-Lozano R Miller JR Martiacuten P Cachorro V Gonzaacutelez MR deFrutos A Assessing vineyard condition with hyperspectral indices Leaf and canopy reflectance simulationin a row-structured discontinuous canopy Remote Sens Environ 2005 99 271ndash287 [CrossRef]
20 Fuentes S Poblete-Echeverriacutea C Ortega-Farias S Tyerman S De Bei R Automated estimation of leafarea index from grapevine canopies using cover photography video and computational analysis methodsAust J Grape Wine Res 2014 20 465ndash473 [CrossRef]
21 Hall A Lamb DW Holzapfel B Louis J Optical remote sensing applications in viticulturemdashA reviewAust J Grape Wine Res 2002 8 36ndash47 [CrossRef]
22 Drissi R Goutouly JP Forget D Gaudillere JP Nondestructive Measurement of Grapevine Leaf Area byGround Normalized Difference Vegetation Index Agron J 2009 101 226ndash231 [CrossRef]
23 Johnson LF Roczen DE Youkhana SK Nemani RR Bosch DF Mapping vineyard leaf area withmultispectral satellite imagery Comput Electron Agric 2003 38 33ndash44 [CrossRef]
24 Dobrowski SZ Ustin SL Wolpert JA Remote estimation of vine canopy density in verticallyshoot-positioned vineyards Determining optimal vegetation indices Aust J Grape Wine Res 2002 8117ndash125 [CrossRef]
25 Lopez-Lozano R Baret F de Cortazar-Atauri IG Bertrand N Casterad MA Optimal geometricconfiguration and algorithms for LAI indirect estimates under row canopies The case of vineyardsAgric For Meteorol 2009 149 1307ndash1316 [CrossRef]
Sensors 2016 16 2004 12 of 12
26 Jonckheere I Fleck S Nackaerts K Muys B Coppin P Weiss M Baret F Review of methods for in situleaf area index determination Part I Theories sensors and hemi-spherical photography Agric For Meteorol2004 121 19ndash35 [CrossRef]
27 Englund SR OrsquoBrien JJ Clark DB Evaluation of digital and film hemispherical photography forpredicting understorey light in a Bornean tropical rain forest Agric For Meteorol 2000 97 129ndash139
28 Confalonieri R Foi M Casa R Aquaro S Tona E Peterle M Boldini A De Carli G Ferrari AFinotto G et al Development of an app for estimating leaf area index using a smartphone Trueness andprecision determination and comparison with other indirect methods Comput Electron Agric 2013 9667ndash74 [CrossRef]
29 Warren-Wilson J Estimation of foliage denseness and foliage angle by inclined point quadrats Aust J Bot1963 11 95ndash105 [CrossRef]
30 Baret F de Solan B Lopez-Lozano R Ma K Weiss M GAI estimates of row crops from downwardlooking digital photos taken perpendicular to rows at 575 zenith angle Theoretical considerations based on3D architecture models and application to wheat crops Agric For Meteorol 2010 150 1393ndash1401 [CrossRef]
31 Francone C Pagani V Foi M Cappelli G Confalonieri R Comparison of leaf area index estimates byceptometerand PocketLAI smart app in canopies with different structures Field Crop Res 2014 155 38ndash41[CrossRef]
32 Orlando F Movedi E Paleari L Gilardelli C Foi M DellrsquoOro M Confalonieri R Estimating leaf areaindex in tree species using the PocketLAI smart app Appl Veg Sci 2015 18 716ndash723 [CrossRef]
33 Campos-Taberner M Garciacutea-Haro J Confalonieri R Martiacutenez B Moreno Aacute Saacutenchez-Ruiz SGilabert MA Camacho F Boschetti M Busetto L Multitemporal monitoring of plant area indexin the Valencia rice district with PocketLAI Remote Sens 2016 8 202ndash217 [CrossRef]
34 De Bei R Fuentes S Gilliham M Tyerman S Edwards E Bianchini N Smith J Collins C VitiCanopyA free computer App to estimate canopy vigor and porosity for grapevine Sensors 2016 16 585 [CrossRef][PubMed]
35 Lorenz DH Eichhorn KW Bleiholder H Klose R Meier U Weber E Growth Stages of the GrapevinePhenological growth stages of the grapevine (Vitis vinifera L ssp vinifera)mdashCodes and descriptionsaccording to the extended BBCH scale Aust J Grape Wine Res 1995 1 100ndash103 [CrossRef]
36 Liu C Kang S Li F Li S Du T Canopy leaf area index for apple tree using hemispherical photographyin arid region Sci Hortic 2013 164 610ndash615 [CrossRef]
37 Breda N Ground-based measurements of leaf area index A review of methods instruments and currentcontroversies J Exp Bot 2003 54 2403ndash2417 [CrossRef] [PubMed]
38 Joslashrgensen SE Kamp-Nielsen L Christensen T Windolf-Nielsen J Westergaard B Validation of aprognosis based upon a eutrophication model Ecol Model 1986 32 165ndash182 [CrossRef]
39 Schaeffer DL A model evaluation methodology applicable to environmental assessment models Ecol Model1980 8 275ndash295 [CrossRef]
40 Nash JE Sutcliffe JV River flow forecasting through conceptual models part I A discussion of principlesJ Hydrol 1970 10 282ndash290 [CrossRef]
41 Loague K Green RE Statistical and graphical methods for evaluating solute transport models Overviewand application J Contam Hydrol 1991 7 51ndash73 [CrossRef]
42 Jonckheere I Nackaerts K Muys B Coppin P Assessment of automatic gap fraction estimation of forestsfrom digital hemispherical photography Agric For Meteorol 2005 132 96ndash114 [CrossRef]
43 Smart RE Dick JK Gravett IM Fisher BM Canopy Management to Improve Grape Yield and WineQuality Principles and Practices S Afr J Enol Vitic 1990 11 3ndash17 Available online httpwwwsawislibrarycozadbtextimagesSmartR11pdf (accessed on 10 September 2016)
copy 2016 by the authors licensee MDPI Basel Switzerland This article is an open accessarticle distributed under the terms and conditions of the Creative Commons Attribution(CC-BY) license (httpcreativecommonsorglicensesby40)
- Introduction
- Materials and Methods
-
- Survey Scheme
- Indirect LAI Estimates
- Destructive LAI Measurement
- Data Analysis
-
- Results
-
- Performance of Indirect Methods
- PocketLAI and NDVI
-
- Discussion
- Conclusions
-
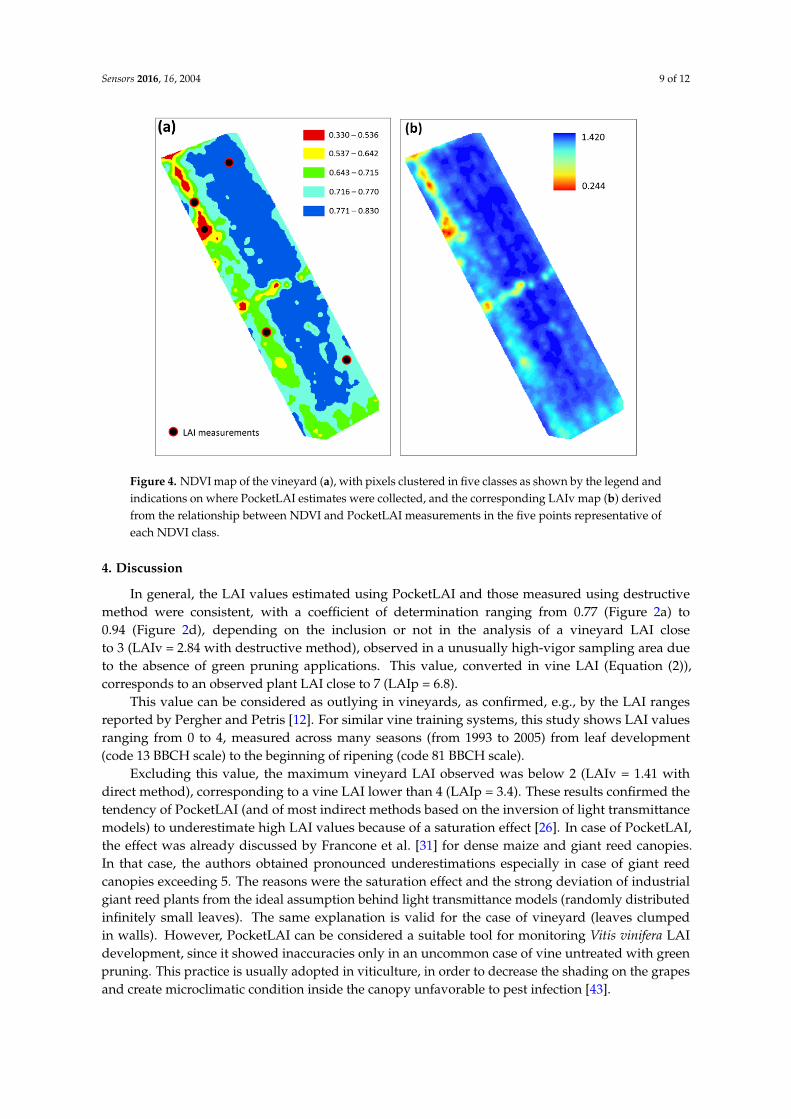
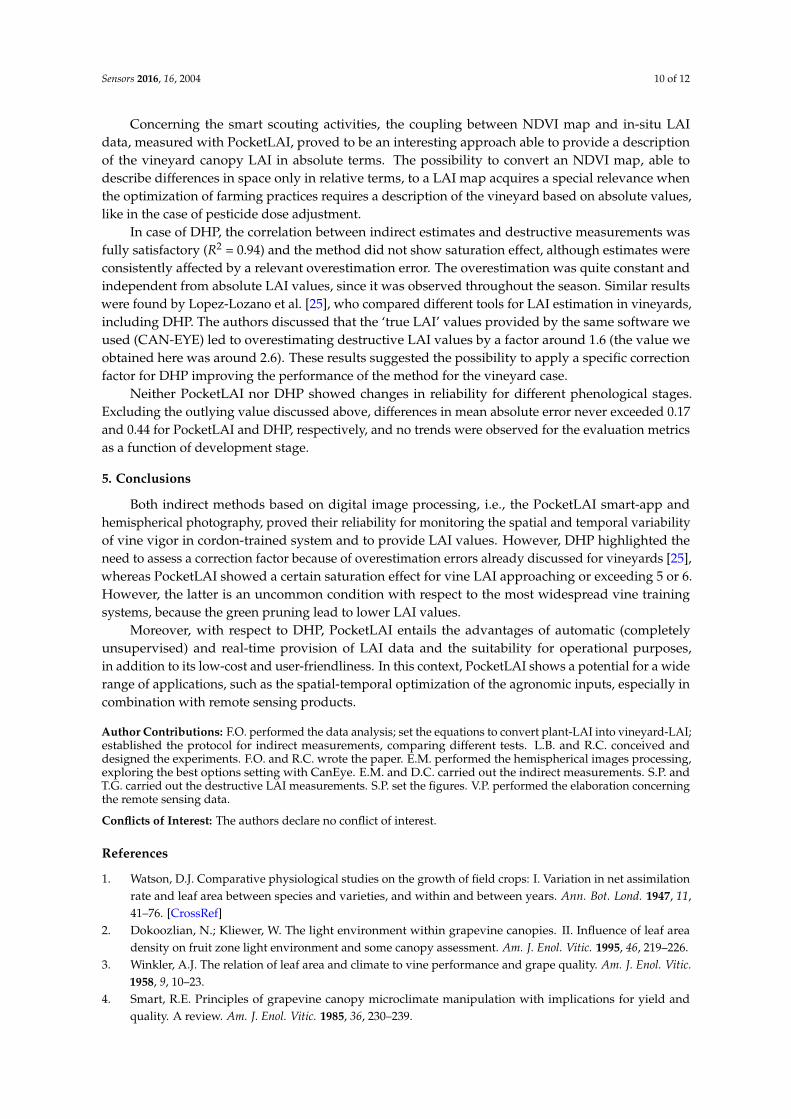