Advancing REDD+ in the Kolo Hills Forests, Tanzania The Kondoa ...

MINISTRY OF NATURAL RESOURCES AND TOURISM
Estimating Cost Elements of REDD+
in Tanzania
Prepared by LTS International & UNIQUE forestry and land use for the Ministry of Natural
Resources and Tourism (MNRT) and the UN-REDD National Programme in Tanzania
June 2012

MINISTRY OF NATURAL RESOURCES AND TOURISM
Estimating Cost Elements of REDD+ in Tanzania
Prepared by:
Pentlands Science Park, Bush Loan, Penicuik, EH26 0PL, United Kingdom
Tel. +44 (0)131 440 5500 | Fax. +44 (0)131 440 5501 | www.ltsi.co.uk
Registered in Scotland Number 100833
Schnewlinstraße 10, 79098 Freiburg, Germany
Tel.: + 49 (0761) 20 85 34-0 | Fax: + 49 (0761) 20 85 34-0 | www.unique-forst.de


Contents
1. EXECUTIVE SUMMARY ................................................................................................................... 1
2. OBJECTIVE OF STUDY .................................................................................................................... 4
3. EXISTING CONCEPTS ...................................................................................................................... 6
4. METHODOLOGY ............................................................................................................................. 9
4.1 PILOT PROJECT SELECTION ............................................................................................................ 10
4.2 COST ELEMENTS OF REDD+ ........................................................................................................ 11
4.3 OPPORTUNITY COSTS .................................................................................................................... 12
4.4 IMPLEMENTATION COSTS .............................................................................................................. 16
4.5 TRANSACTION COSTS .................................................................................................................... 18
4.6 INSTITUTIONAL COSTS................................................................................................................... 20
5. REDD+ COSTS TOOL .................................................................................................................. 36
6. COSTS OF REDD+ PILOT PROJECTS ........................................................................................ 39
6.1 SELECTED REDD+ PILOT PROJECTS ............................................................................................. 39
6.2 CARBON STOCKS OF PILOT PROJECTS ......................................................................................... 40
6.3 LAND USE ECONOMICS OF PILOT PROJECTS ................................................................................ 41
6.4 OPPORTUNITY COSTS CURVE FOR REDD+ PILOT PROJECTS ..................................................... 43
6.5 REDD+ COST ELEMENTS OF PILOT PROJECTS ............................................................................. 45
7. TOWARDS A NATIONAL REDD+ COST CURVE .................................................................... 48
8. CONCLUSIONS ............................................................................................................................. 50
8.1 OVERALL CONCLUSION ................................................................................................................. 50
8.2 TECHNICAL CONCLUSIONS ........................................................................................................... 51
9. REFERENCES .................................................................................................................................. 54
ANNEX 1 – INPUT PARAMETERS ....................................................................................................... 56
PROJECT KEY DATA ...................................................................................................................................... 56
LAND USE ECONOMICS ................................................................................................................................ 57
OPPORTUNITY COSTS ANALYSIS ................................................................................................................. 60
IMPLEMENTATION COSTS ............................................................................................................................ 62
TRANSACTION COSTS .................................................................................................................................. 63
INSTITUTIONAL COST ................................................................................................................................... 65
PROJECT SUMMARY ..................................................................................................................................... 66
ANNEX 2 – JANE GOODALL KIGOMA PROJECT ............................................................................ 67

MODELING APPROACH AND KEY ASSUMPTIONS........................................................................................ 67
PROJECT KEY AREA AND CARBON STOCK ASSUMPTIONS .......................................................................... 68
1-HA MODELS FOR EXISTING LAND USE TYPES ........................................................................................... 70
LAND USE CHANGE MATRIX ......................................................................................................................... 70
OPPORTUNITY COSTS .................................................................................................................................. 72
BUILDING THE REDD+ PROJECT CASE ....................................................................................................... 74
REDD+ COSTS PER SAVED TCO2 ............................................................................................................... 77
KEY ASSUMPTION OF 1-HA BASED LAND USE ECONOMICS ...................................................................... 79
ANNEX 3 – MPINGO CONSERVATION AND DEVELOPMENT INITIATIVE ................................ 93
MODELING APPROACH AND KEY ASSUMPTIONS........................................................................................ 93
PROJECT KEY AREA AND CARBON STOCK ASSUMPTIONS .......................................................................... 94
1-HA MODELS FOR EXISTING LAND USE TYPES ........................................................................................... 96
OPPORTUNITY COSTS .................................................................................................................................. 97
BUILDING THE REDD+ SFM PROJECT CASE .............................................................................................. 97
REDD+ SFM COSTS PER SAVED TCO2 ..................................................................................................... 99
KEY ASSUMPTIONS OF 1-HA BASED LAND USE ECONOMICS .................................................................. 101
ANNEX 4 – TFCG MJUMITA – KILOSA PROJECT........................................................................... 103
MODELING APPROACH AND KEY ASSUMPTIONS...................................................................................... 103
PROJECT KEY AREA AND CARBON STOCK ASSUMPTIONS ........................................................................ 104
1-HA MODELS FOR EXISTING LAND USE TYPES ......................................................................................... 105
LAND USE CHANGE MATRIX ....................................................................................................................... 106
OPPORTUNITY COSTS ................................................................................................................................ 108
BUILDING THE REDD+ PROJECT CASE ..................................................................................................... 110
REDD+ COSTS PER SAVED TCO2 ............................................................................................................. 113
KEY ASSUMPTION OF 1-HA BASED LAND USE ECONOMICS .................................................................... 115
ANNEX 5 – TFCG MJUMITA – LINDI PROJECT .............................................................................. 120
MODELING APPROACH AND KEY ASSUMPTIONS...................................................................................... 120
PROJECT KEY AREA AND CARBON STOCK ASSUMPTIONS ........................................................................ 121
1-HA MODELS FOR EXISTING LAND USE TYPES ......................................................................................... 122
LAND USE CHANGE MATRIX ....................................................................................................................... 123
OPPORTUNITY COSTS ................................................................................................................................ 124
BUILDING THE REDD+ PROJECT CASE ..................................................................................................... 127
REDD+ COSTS PER SAVED TCO2 ............................................................................................................. 130
KEY ASSUMPTION OF 1-HA BASED LAND USE ECONOMICS .................................................................... 132

Figures
Figure 1: REDD+ costs per tCO2 ................................................................................................................. 2
Figure 2: Opportunity cost curve for three pilot projects..................................................................... 2
Figure 3: Overall study approach ................................................................................................................ 4
Figure 4: Map of the nine REDD+ pilot projects in Tanzania ............................................................. 9
Figure 5: Cost elements of REDD+ .......................................................................................................... 11
Figure 6: Drivers of deforestation and degradation ........................................................................... 14
Figure 7: Correlation of NPV and carbon stock ................................................................................... 15
Figure 8: Analytical steps to develop an opportunity cost curve .................................................... 37
Figure 9: Excel-tool conceptual framework to estimate REDD+ cost elements ......................... 38
Figure 10: Opportunity costs of land uses in the selected pilot projects ...................................... 42
Figure 11: Opportunity cost curve for three pilot projects ............................................................... 44
Figure 12: Annual average project costs/ha ......................................................................................... 45
Figure 13: Total annual average costs .................................................................................................... 46
Figure 14: Costs to avoid 1 tCO2 .............................................................................................................. 47
Figure 15: Example of a national marginal abatement cost curve ................................................. 49
Figure 16: Revenue streams and increasing opportunity costs ....................................................... 51
Figure 17: Methodology to estimate REDD+ cost elements ............................................................ 68
Figure 18: NPVs for the Jane Goodall Kigoma project ...................................................................... 70
Figure 19: GHG emissions (tCO2/ha) from conversion of natural forest to other land use
types in the Jane Goodall Kigoma project area ................................................................................... 72
Figure 20: Opportunity costs (US$/tCO2) from conversion of natural forest to other land use
types in the Jane Goodall Kigoma project ............................................................................................. 73
Figure 21: Opportunity cost curve Jane Goodall Kigoma project ................................................... 74
Figure 22: Avoided deforestation area and GHG benefits in project scenario ........................... 76
Figure 23: Annual implementation, transaction and institutional cost estimates (US$) ............ 77
Figure 24: REDD+ costs per saved tCO2 (US$) ................................................................................... 78
Figure 25: Total project costs Jane Goodall Kigoma (US$) ............................................................... 78
Figure 26: Methodology to estimate REDD+ cost elements ............................................................ 94
Figure 27: NPV for the Mpingo Conservation and Development Initiative ................................. 96
Figure 28: Annual implementation, transaction and institutional cost estimates (US$) ............ 99
Figure 29: SFM costs per tCO2 removal (US$) ................................................................................... 100
Figure 30: Total project costs Mpingo Conservation and Development Initiative (US$) ........ 100
Figure 31: Methodology to estimate REDD+ cost elements .......................................................... 104
Figure 32: NPVs for the TFCG Mjumita – Kilosa project .................................................................. 106
Figure 33: GHG emissions (tCO2/ha) from conversion of natural forest to other land use
types in the TFCG – Mjumita Kilosa project area ............................................................................... 108
Figure 34: Opportunity costs (US$/tCO2) from conversion of natural forest to other land use
types in the TFCG Mjumita Kilosa project ............................................................................................ 109

Figure 35: Opportunity cost curve TFCG Mjumita - Kilosa project ............................................... 110
Figure 36: Avoided deforestation area and GHG benefits in project scenario ......................... 112
Figure 37: Annual implementation, transaction and institutional cost estimates (US$) .......... 113
Figure 38: REDD+ costs per saved tCO2 (US$) ................................................................................. 114
Figure 39: Total project costs TFCG Mjumita Kilosa (US$) .............................................................. 114
Figure 40: Methodology to estimate REDD+ cost elements .......................................................... 121
Figure 41: NPVs for the TFCG Mjumita – Lindi project .................................................................... 123
Figure 42: GHG emissions (tCO2/ha) from conversion of natural forest to other land use
types in the TFCG – Mjumita Lindi project area................................................................................. 125
Figure 43: Opportunity costs (US$/tCO2) from conversion of natural forest to other land use
types in the TFCG Mjumita Lindi project .............................................................................................. 126
Figure 44: Opportunity cost curve TFCG Mjumita - Lindi project ................................................. 127
Figure 45: Avoided deforestation area and GHG benefits in project scenario ......................... 129
Tables
Table 1: Pilot project selection .................................................................................................................. 10
Table 2: Transaction cost relevant REDD+ process ............................................................................ 19
Table 3: Cost indicators of transaction costs for carbon finance projects under the Verified
Carbon Standard (VCS) ............................................................................................................................... 19
Table 4: Profile of DoE technical staff by section ................................................................................. 28
Table 5: DoE’s revenues break down ...................................................................................................... 29
Table 6: Budgets of selected districts ...................................................................................................... 30
Table 7: Forest revenues in selected districts ........................................................................................ 31
Table 8: Institutional costs associated with establishing participatory forest management .... 32
Table 9: Recurrent costs of forest management and protection .................................................... 34
Table 10: Law enforcement and surveillance costs ............................................................................. 35
Table 11: Characteristics of selected pilot projects ............................................................................. 40
Table 12: Carbon stocks estimates for opportunity cost analysis (tCO2/ha) ............................... 41
Table 13: Data entry sheet for land use type areas (ha) .................................................................... 56
Table 14: Data entry sheet for land use type carbon stocks ............................................................ 57
Table 15: Natural forest data entry sheet .............................................................................................. 58
Table 16: Data entry sheet for agriculture mix ..................................................................................... 58
Table 17: Data entry sheets for agricultural land use ......................................................................... 59
Table 18: Economic output table and NPV for 1 ha maize farming (US$) .................................. 60
Table 19: Economic output table and NPV for mixed cropping systems (US$) ......................... 60
Table 20: Land use change matrix (ha) .................................................................................................. 61
Table 21: Opportunity costs matrix ......................................................................................................... 62
Table 22: Data entry sheet for implementation costs (US$) ............................................................. 63
Table 23: Estimation of transaction cost categories ........................................................................... 64
Table 24: Data entry sheet for transaction costs (US$) ...................................................................... 64
Table 25: Estimation of institutional costs categories (US$) ............................................................. 65
Table 26: Projection of avoided deforestation area and GHG emission reductions ................. 66
Table 27: Project cost summary (US$) .................................................................................................... 66
Table 28: Project area assumptions ......................................................................................................... 69
Table 29: Carbon stock assumptions ...................................................................................................... 69
Table 30: Land use change matrix for project (2001-2011) (ha) ..................................................... 71
Table 31: Natural forest assumptions (1 ha) ......................................................................................... 79
Table 32: Unsustainable timber extraction assumptions (1 ha) ....................................................... 80
Table 33: Unsustainable fuel wood collection assumptions (1 ha) ................................................. 82
Table 34: Mix of cropping systems (agriculture shifting cultivation) .............................................. 83
Table 35: Maize production system key assumptions (1-ha) ........................................................... 84
Table 36: Beans production system key assumptions (1-ha) ........................................................... 85
Table 37: Cassava production system key assumptions (1-ha) ....................................................... 86
Table 38: Groundnuts production system key assumptions (1-ha) ................................................ 88
Table 39: Rice production system key assumptions (1-ha)............................................................... 89
Table 40: Pasture (cattle) key assumptions (1-ha) ............................................................................... 90
Table 41: Project area assumptions ......................................................................................................... 95
Table 42: Carbon stock assumptions ...................................................................................................... 95
Table 43: Unsustainable timber extraction assumptions (1 ha) ..................................................... 101
Table 44: Project area assumptions ....................................................................................................... 105
Table 45: Carbon stock assumptions .................................................................................................... 105
Table 46: Land use change matrix for project (2001-2011) (ha) ................................................... 107
Table 47: Natural forest assumptions (1 ha) ....................................................................................... 115
Table 48: Unsustainable charcoal productions assumptions (1 ha) ............................................. 116
Table 49: Mix of cropping systems (agriculture shifting cultivation) ............................................ 118
Table 50: Beans production system key assumptions (1-ha) ......................................................... 118
Table 51: Project area assumptions ....................................................................................................... 122
Table 52: Carbon stock assumptions .................................................................................................... 122
Table 53: Land use change matrix for project (2001 – 2011) (ha) ................................................ 124
Table 54: Natural forest assumptions (1 ha) ....................................................................................... 133
Table 55: Unsustainable charcoal production assumptions (1 ha) ............................................... 134
Table 56: Mix of cropping systems (agriculture shifting cultivation) ............................................ 135
Table 57: Sesame production system key assumptions (1-ha) ...................................................... 136
Boxes
Box 1: The Net Present Value (NPV) ....................................................................................................... 13
Box 2: The “true” value of forest in Tanzania ........................................................................................ 16
Box 3: How to read the opportunity cost curve ................................................................................... 43
Acronyms
CBO Community-based Organization
CCBS Climate, Community and Biodiversity Standard
CFM Community Forest Management
DCF Discounted Cash Flow
EMA Environmental Management Act
FAO Food and Agriculture Organization of the United Nations
FBD Forestry and Beekeeping Division
FCPF Forest Carbon Partnership Facility
FSC Forest Stewardship Council
FSU Forest Support Unit
FTI Forestry Training Institute
GHG Greenhouse Gas
FLEGT Forest Law Enforcement Governance and Trade
ha hectare
IRA Institute of Resources Assessment
JFM Joint Forest Management
JGI Jane Goodall Institute
LGA Local Government Authorities
MCDI Mpingo Conservation and Development Initiative
MNRT Ministry for Natural Resources and Tourism
MRV Measurement, Reporting and Verification
NEMC National Environmental Management Council
NLUPC National Land Use Planning Commission
NPV Net Present Value
PFM Participatory Forest Management
PDD Project Design Document
PMO-RALG Prime Minister’s Office – Regional Administration and Local
Government
REDD Reduced Emissions from Deforestation and Degradation
R-PP Readiness Preparation Proposal
SEA Strategic Environmental Assessment
SFM Sustainable Forest Management
SUA Sokoine University of Agriculture
TAFORI Tanzania Forestry Research Institute
TANAPA Tanzania National Parks
TaTEDO Tanzania Traditional Energy Development and Environment
Organization
tCO2 Tons Carbon Dioxide
TEV Total Economic Value
TFCG Tanzania Forest Conservation Group
TFF Tanzania Forest Fund
TFS Tanzania Forest Service
TNRF Tanzania Natural Resource Forum
UNDP United Nations Development Programme
VCS Verified Carbon Standard
VPO-DoE Vice President’s Office – Division of Environment
UNFCCC United Nations Framework Convention on Climate Change
WD Wildlife Division
WMA Wildlife Management Area

Estimating Cost Elements of REDD+ in Tanzania P a g e | 1
1. Executive Summary
The study on cost elements of REDD+ in Tanzania is based on data of four REDD+ and
Sustainable Forest Management (SFM) projects in Tanzania in addition to an assessment of
institutional costs of REDD+ at central government and district level.
Project level data comprised cost-benefit information for the drivers of deforestation and
forest degradation in the respective project areas (opportunity costs), data on implementation
costs of project activities and data on the costs for getting REDD+ projects certified according
to carbon accounting standards (transaction costs).
Opportunity costs, implementation costs, transaction costs and institutional costs were
calculated with regard to pilot project areas (in hectares) and targeted emission reductions (in
tonnes of carbon dioxide (tCO2)).
Opportunity costs were calculated based on 1-hectare models of deforestation driving land
uses, applying discounted cash flow analysis. The comparative indicator (output of discounted
cash flow analysis) for the opportunity costs is the Net Present Value of these land uses.
The results of the study show a heterogeneous picture regarding REDD+ cost elements in the
pilot projects. The figure below summarizes the total REDD+ costs per tCO2. They range
between 4.9 and 13.8 US$/tCO2 (see Figure 1).
To obtain a broader picture of opportunity costs at national level, the results of the individual
pilot project analyses were nested and processed with the REDD ABACUS software (see
Figure 1 showing the output of this exercise). The graph visualizes the costs of emission
reductions potentials for three REDD+ pilot projects and it becomes obvious that land use
changes and related opportunity costs vary over the project regions. For example,
opportunity costs of avoiding land use change from forest to shifting cultivation are twice as
high in the Jane Goodall Institute project as in the Tanzania Forest Conservation Group
(TFCG) in Mjumita/Lindi.
The main product of the cost elements study is a comprehensive Excel-based calculation tool,
which enables project managers to estimate all four cost elements of REDD+ within their
project context. This report introduces the tool and explains its functions and possibilities.

Estimating Cost Elements of REDD+ in Tanzania P a g e | 2
Figure 1: REDD+ costs per tCO2
Figure 2: Opportunity cost curve for three pilot projects

Estimating Cost Elements of REDD+ in Tanzania P a g e | 3
In general, data availability for opportunity costs varied significantly between the pilot
projects. Not all of the pilot projects have established a land use change matrix, which is the
essential input information to elaborate REDD+ cost curves, thus estimates were drawn with
the respective project staff. Transaction costs were only considered by certain projects and
most have budgeted for implementation costs only over the initial three to five years of the
project lifetime. Institutional costs were assessed at central government and district level
based on studies and interviews.
Due to these restrictions of data availability, assumptions and default values were used to
complement missing information and elaborate comparable results. These assumptions are
explained in detail in the respective chapters of the report. Thus, all results presented in this
report should be considered as preliminary and dynamic, considering improving data
availability in the near future – e.g. by completion of the National Forestry Resources
Monitoring and Assessment (NAFORMA).

Estimating Cost Elements of REDD+ in Tanzania P a g e | 4
2. Objective of Study
The presented study aimed to identify and estimate cost elements of REDD+ in Tanzania as
well as elaborate REDD+ opportunity cost curves at project and at national level. The focus
was on the nine REDD+ pilot projects in Tanzania, which have been established across the
country over the past few years through funding from the Royal Norwegian Embassy. The
study consisted of six main tasks:
1. Define the REDD+ cost elements in Tanzania;
2. Analyze the cost elements (i.e. opportunity costs, implementation costs, transaction
costs and institutional costs) for selected REDD+ pilot projects;
3. Analyze available pilot project data and derive REDD+ costs curves at project level;
4. Ensure stakeholder participation during all phases of the study;
5. Develop an analyses tool to estimate REDD+ costs; and
6. Use the REDD ABACUS software to generate REDD+ cost curves.
Figure 3: Overall study approach
Defining preliminary set of cost categories and selection
of pilot projects
Analysis of pilot project baseline and project documents, and
collection of missing and incomplete cost data
Developing project opportunity cost curves
(Excel-Tool integrable in REDD Abacus )
Developing Excel-Tool for
projects to estimate REDD+
cost elements
Estimating all cost elements
of REDD+ projects
Phase 1
Phase 2
Phase 3
Phase 4 Phase 5
Estimating Cost Elements of REDD+ in Tanzania P a g e | 5
The overall approach of the study considered a high level of stakeholder participation and
targeted focus on the beneficiaries of the outcomes, namely the REDD+ pilot projects and the
Ministry for Natural Resources and Tourism (MNRT). Stakeholder involvement has been
considered by conducting three stakeholder workshops during the decisive phases of the
study (inception phase, feedback on preliminary results, completion and dissemination).
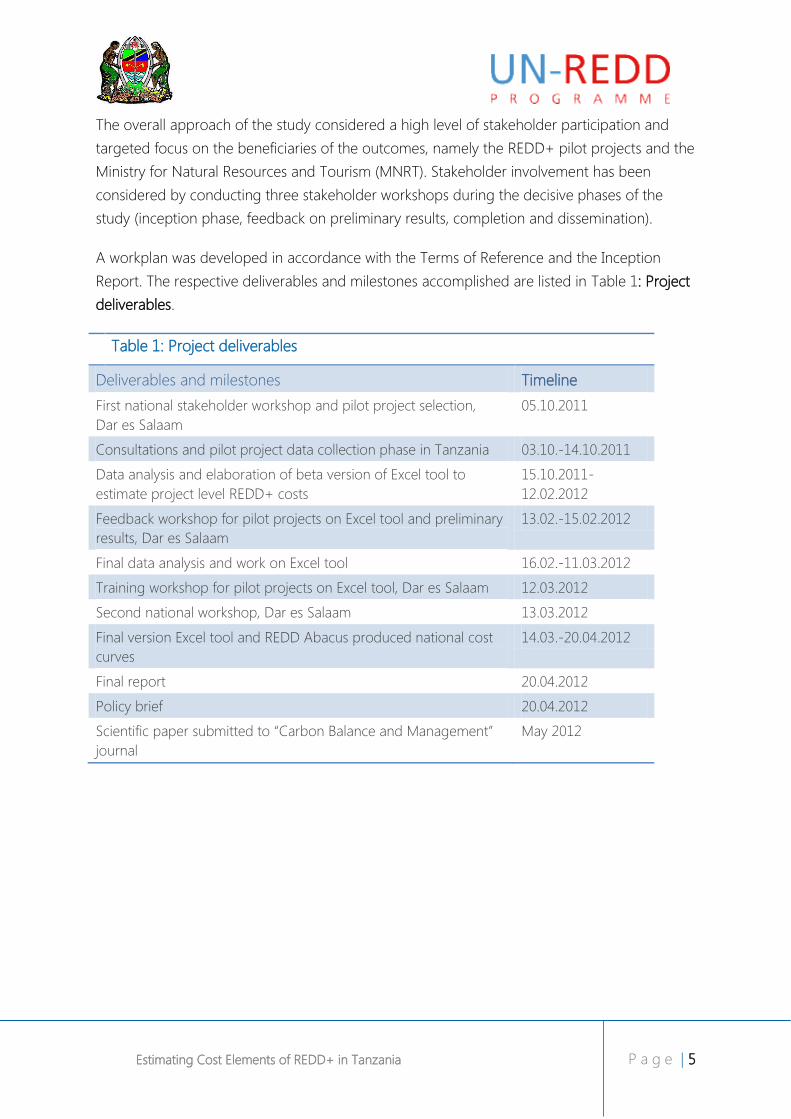
A workplan was developed in accordance with the Terms of Reference and the Inception
Report. The respective deliverables and milestones accomplished are listed in Table 1: Project
deliverables.
Table 1: Project deliverables
Deliverables and milestones Timeline
First national stakeholder workshop and pilot project selection,
Dar es Salaam
05.10.2011
Consultations and pilot project data collection phase in Tanzania 03.10.-14.10.2011
Data analysis and elaboration of beta version of Excel tool to
estimate project level REDD+ costs
15.10.2011-
12.02.2012
Feedback workshop for pilot projects on Excel tool and preliminary
results, Dar es Salaam
13.02.-15.02.2012
Final data analysis and work on Excel tool 16.02.-11.03.2012
Training workshop for pilot projects on Excel tool, Dar es Salaam 12.03.2012
Second national workshop, Dar es Salaam 13.03.2012
Final version Excel tool and REDD Abacus produced national cost
curves
14.03.-20.04.2012
Final report 20.04.2012
Policy brief 20.04.2012
Scientific paper submitted to “Carbon Balance and Management”
journal
May 2012

Estimating Cost Elements of REDD+ in Tanzania P a g e | 6
3. Existing Concepts
The Tanzania REDD+ cost study in the
light of existing concepts
In the process of developing the national REDD+ framework, investors, donors and policy-
makers have been highly interested in cost information in order to develop strategies, allocate
budgets, and to assess the effectiveness of reducing emissions from avoiding deforestation
and forest degradation. Several global REDD+ cost elements studies were conducted in the
past (Eliasch Review, 2008; Boucher, 2008; Grieg-Gran, 2008; Kindermann et al, 2008)
predicting that payments for maintaining forest carbon stocks have a great potential to be a
cost-effective climate change mitigation and human development measure.
In general there are three different approaches to estimate cost elements of REDD+: i) local-
empirical models; ii) global-empirical approaches; and iii) global simulation models.
Local-empirical Models
The local-empirical estimates are based on local survey and information, estimating per-area
cost estimates ($/ha) and carbon density (tCO2/ha) of a respective REDD+ activity location.
Boucher’s (2008) review of 29 empirical studies estimated opportunity costs of REDD+ at a
range of US$ 0.84 – 4.18/tCO2 with a mean of US$ 2.51/tCO2 and 28 out 29 studies at less
than US$ 10 /tCO2 and mean cost for Africa of US$ 2.22/tCO2. However, only opportunity
costs are quantified; these do not sufficiently take into account other cost elements associated
with implementation, monitoring, reporting and verification and institutional set-up of REDD+
framework.
Global-empirical Models
Global-empirical models use local empirical data and combine these to global per-area costs
of deforestation and use uniform estimates on the carbon density (tCO2/ha), which results in a
global estimate of opportunity costs (US$/tCO2) (Boucher, 2008). This method was used for
the Stern Review (2006), undertaken by Grieg-Gran (2008), using a mean carbon density of
390 tCO2/ha resulted in a global REDD+ costs of US$ 2.76 – 8.28/tCO2 with a midpoint of
US$ 5.52/tCO2) considering opportunity costs and administration costs of REDD. This
approach ignored the significant variations of carbon densities from region to region and led
to highly aggregated estimates with a large level of uncertainty.

Estimating Cost Elements of REDD+ in Tanzania P a g e | 7
Global Simulation Models
The global simulation models such as GTM, DIMA and GCOMAP (Kindermann et al, 2008),
estimate REDD+ costs by simulating the development of the world economy taking into
account the forestry, agricultural, fossil fuel using energy sectors. As a result the simulations
provide supply curves of REDD+ (price vs. quantity for emissions reductions in tCO2).
However, these models also mainly focus on the estimation of opportunity costs, and do not
take into account other cost elements of REDD+. Kindermann et al (2008) estimated that a
50 % reduction of deforestation by 2030 globally would cost in the range of US$ 9.27 –
20.57/tCO2 while African forestry related emissions reduction would range between US$ 5.20
- 12.3 /tCO2.
Additional REDD+ Costs
Apart from opportunity costs, there are additional costs to be considered in REDD+ such as
implementation costs, transaction costs and institutional costs. However, data on robust
estimates hardly exists (Boucher, 2008). Grieg-Gran (2008) estimates that implementation and
transaction costs in the range of 15-20 % of the total REDD+ cost in the largest tropical forest
countries such as Brazil, Indonesia, and Democratic Republic of Congo among others.
Nepstad et al (2007) estimated implementation costs in the Amazon region at about
US$ 0.58/tCO2 based on experience from existing Payments for Ecosystem Services (PES)
schemes. Anitonori and Sathaye (2007) estimated transaction costs based on 11 forest carbon
projects that averaged US$ 0.38 /tCO2 (in a range of US$ 0.03 – 1.23/tCO2). Grieg-Gran
(2008) estimated administration costs in 8 tropical forest countries of existing PES schemes to
average US$ 0.04/tCO2 and in total (implementation, transaction and administrative costs)
US$ 1/tCO2.
However, most of these studies were conducted prior to 2008 at a time where practical
REDD+ pilot projects had hardly developed and national REDD+ frameworks were at a very
early stage of development, thus the estimates are all based on project and schemes not
directly related to REDD+. In addition, top-down REDD+ cost curves do not sufficiently reflect
the full spectrum of REDD+ costs, thus underestimating the real costs of REDD+ and
misleading decision-makers and policy-makers (Boucher, 2008) because transaction and
implementation and institutional costs are omitted from the estimates. Moreover, top-down
opportunity cost estimates often do not consider economic activities that are not integrated
into formal markets such as subsistence farming and ignore variations among regions in
countries. Therefore, participatory bottom-up approaches are considered more appropriate
to estimate the real costs of REDD+ and to take into account regional variations and
economic conditions.

Estimating Cost Elements of REDD+ in Tanzania P a g e | 8
As a robust bottom-up approach to estimate REDD+ opportunity and implementation costs,
Fisher et al (2011), conducted a study in Tanzania by taking into consideration the regional
variations and economic conditions. The estimates were conducted for the two major
Tanzania drivers of deforestation including agricultural expansion and charcoal production by
using regional district-scale carbon losses from deforestation and land use rents. Therefore
the opportunity costs for the 53 districts for avoiding charcoal and agricultural expansion
varied significantly ranging between US$ 1.90 – 13.40/tCO2 (median US$ 3.90/tCO2)
indicating the high variability of opportunity costs on national scale and showing the
importance to use bottom-up approaches to robustly estimate REDD+ costs on national
scale.
The implementation costs for avoiding GHG emissions through investments in doubling
agricultural production and more efficient charcoal exceed the opportunity costs and ranged
between US$ 1.63 – 17.05/tCO2 (median US$ 6.52/tCO2); these also included monitoring
costs of about US$ 2.95/ha/yr. The study concludes that opportunity and implementation
costs of avoiding GHG emission from REDD+ are likely to cost more than global top-down
models suggested by Fisher et al (2011).
As part of the national REDD+ strategy, nine REDD+ pilot projects have been initiated with
the objective to inform the development of the national REDD+ framework and over the past
years practical experiences have been made to undertake REDD+ activities with the availability
of robust cost data on REDD+ pilot activities. Building upon the work done by Fisher et al
(2011) and data collected from three Tanzanian REDD+ pilot projects, the study seeks to
estimate the full spectrum of REDD+ costs based on a bottom-up approach using existing
cost data, which makes a comparison with existing REDD+ cost studies possible. In addition,
this study serves as a practical methodological framework example to consistently assess
REDD+ cost elements that takes into account regional forest carbon, land use economics and
land use change pattern variations providing decision-makers a robust economic decision
making basis to strategize and prioritize REDD+ activities and investments in their countries.

Estimating Cost Elements of REDD+ in Tanzania P a g e | 9
4. Methodology
How to estimate cost elements of REDD+
The major source of data and information for the elaboration of REDD+ cost elements and
related cost curves were the nine REDD+ pilot projects supported by the Royal Norwegian
Embassy in Tanzania (see map below). The projects are being implemented in various
ecosystems, under various land tenure types and apply a wide variety of REDD+ strategies. An
important source of information for the assessment of REDD+ costs elements was the socio-
economic baseline studies of these pilot projects and the project documents within the
project designs and related project budget breakdown. Further, close cooperation and
exchange of information and experience with the implementing NGOs of these pilot projects
was sought for the identification of a comprehensive set of cost elements and for the
verification of expert assumptions.
Figure 4: Map of the nine REDD+ pilot projects in Tanzania
Source: Tanzania REDD Initiative 2011

Estimating Cost Elements of REDD+ in Tanzania P a g e | 10
4.1 Pilot project selection Considering that the nine REDD+ pilot projects in Tanzania reflect highly heterogeneous
project conditions and project designs, and that data availability in the projects was a decisive
factor for the accomplishment of the study, four of the most advanced REDD+ pilot projects
were selected for in-depth analysis. The pilot projects have been preselected during the first
national stakeholder workshop (05.10.2011 in Dar es Salaam) and a final decision was taken
based on data availability and geographic distribution. The projects are characterised in the
table below.
Additionally, the Angai Forest Reserve was analyzed to obtain information on opportunity
costs in this historical PFM area. However, its rather unique history of decades of support from
a range of different donors and projects, coupled with the corresponding poor progress
made in progressing with formalisation of community based forest management mean that
data relating to implementation costs is fragmented and atypically high. Following extensive
discussion of the preliminary results at the final workshop held in Dar es Salaam on
13.03.2012, it was decided to remove this site from the analysis to avoid distorting overall
findings.
Table 2: Pilot project selection
Pilot project
(Acronym)
Project characteristics
Jane Goodall
Institute REDD
Program (JGI)
Project location: Kigoma
Affected forest type: Guinea-Congolean
Data availability: all baselines available
Drivers of deforestation: Agriculture, logging, charcoal/fuelwood,
pasture
Project design: Conservation, alternative income generation
Tanzania Forest
Conservation Group
(TFCG)/Mjumita
Two project locations: Kilosa and Lindi
Affected forest types: Coastal forest and Eastern Arc
Data availability: all baselines available
Drivers of deforestation: Agriculture, charcoal/fuelwood
Project design: Conservation, alternative income generation
Mpingo
Conservation and
Development
Initiative (MCDI)
Project location: Kilwa
Affected forest type: Costal forest
Data availability: all baselines available
Drivers of deforestation: fire; no direct economic drivers
Project design: PFM based sustainable logging

Estimating Cost Elements of REDD+ in Tanzania P a g e | 11
4.2 Cost elements of REDD+
Establishing and implementing REDD+ activities generates costs. These costs can be grouped
into four general categories (see Figure 5):
1. opportunity costs resulting from the forgone benefits that deforestation would have
generated;
2. implementation costs of efforts needed to reduce deforestation and forest
degradation;
3. transaction costs of establishing and operating a REDD+ project; and
4. institutional costs to enable the REDD+ environment and set the technical and
institutional stage at national level.
In the subsequent chapters, each of the four cost elements of REDD+ is explained in more
detail, thereby putting emphasis on the conditions and realities found in the Tanzanian
REDD+ pilot projects` context.
Figure 5: Cost elements of REDD+
Opportunity Costs:Economics of drivers of deforestation and
degradation
Implementationcosts: Costs to
implement projectdesign addressingdeforestation and
degradation
Transaction costs: Climate benefit
related measurement, reporting and
verification costs
Institutional costs: Enable the REDD environment at national and district level
Project level
National level

Estimating Cost Elements of REDD+ in Tanzania P a g e | 12
4.3 Opportunity costs With regard to opportunity costs the authors refer to the excellent World Bank publication
“Estimating the Opportunity Costs of REDD+: A training manual” (2011). The World Bank
conducted a stakeholder workshop to introduce the concept of opportunity costs in Dar es
Salaam in 2010.
The World Bank publication explains in details the theory and methodology of opportunity
cost estimation, including implementation and transaction costs, in the context of REDD+.
Thus, for this report we focus on the definition of opportunity costs and the economic
assumptions behind it.
Our analytical framework is consistent with the World Bank’s definition and understanding of
opportunity costs; basic terms and assumptions are adopted. Where this study deviates from
these assumptions and definitions it is clearly stated – e.g. in the present study opportunity
cost analysis was undertaken from the perspective of the land user.
It is important to note that opportunity cost analysis is based on land use changes. Therefore,
in addition to the land use legend, information on current land uses and land use changes
and the related carbon stocks at the project level are required. The necessary input
information is explained in more detail in the chapter on using the Excel-tool (Annex I).
Opportunity cost analysis is an economic approach to monetize profits from these land uses,
based on the calculation of the Net Present Value (see box on NPV calculation). The NPV is
the result of a Discounted Cash Flow analysis (DCF) of the costs and benefits for a certain land
use over a defined period of time. Comparing the NPV ($ / ha) of various land uses indicate
the most profitable land use (e.g. profits from forest, agriculture, pasture). The difference
between the higher NPV and the lower NPV is the opportunity cost, indicating the foregone
monetized value the land user has to incur when opting for the land use with the lower NPV.

Estimating Cost Elements of REDD+ in Tanzania P a g e | 13
Box 1: The Net Present Value (NPV)
Net present value (NPV), or sometimes called present value, is used to estimate the profitability
of a land use over many years. NPV takes into account the time-value of money. Since waiting
for profits is less desirable than obtaining profits now, the “value” of future profits is discounted
by a specific percentage rate, often ranging from 2- 20%.
With multi-year analysis, NPV is a discounted stream of profits (revenues minus costs of capital,
land and labour inputs).
Where t = year, T = length of time horizon, Π = annual profits of the LU ($/ha), r = discount
rate. The major assumptions introduced at the stage of NPV calculation are the discount rate
(r) and the time horizon (T).
For discount rates, NPV analyses typically use loan interest rates, which are set by a national
bank or the government. Such rates can range from 10-30%. Although agricultural loans are
rarely available, especially in remote areas, bank interest rates do serve as a good indicator of
the time value of money. The interest rate reflects the opportunity cost of obtaining profits -
not now - but in the future.
High discount rates can dramatically reduce the viability and attractiveness of long-term
investments. These include enterprises such as forestry, agroforestry, and cattle systems where
initial years require up-front investments and payoffs occur 5-20 years later. Costs are scarcely
discounted, whereas the value of future earnings can be significantly lower.
Source: World Bank (2011)
4.3.1 Economics of drivers of deforestation and degradation
Land use changes are caused by drivers that may originate from various sources and
intentions. Each REDD+ project requires a coherent analysis of these drivers, in order to
define project interventions that can effectively lower emission rates and achieve permanent
success. Moreover, the analysis of drivers contributes to all essential aspects of project
feasibility and designing project interventions. It is also necessary for the definition of the
reference areas and leakage belt as well as for baseline modelling and monitoring baseline

Estimating Cost Elements of REDD+ in Tanzania P a g e | 14
assumptions. Figure 6 shows the great variety of direct and indirect drivers of deforestation
and forest degradation. Major direct drivers include infrastructure expansion, agriculture and
wood extraction for various end uses (timber, fuelwood, charcoal, etc.). Behind these drivers
that can be measured in terms of area deforested or degraded are a set of interlinked
motivations of the driving agents that are explained in respective publications. Again, these
agents are driven by demographic, economic, technological, political or cultural intentions.
Opportunity costs analysis, theoretically, could give a monetary value to any of these drivers
and underlying causes. Precondition to do so is that these drivers are adequately assessed
and quantified. For the purpose of the present study, focus was put on economically
motivated direct drivers. For these drivers, data and information was available at project level.
Nonetheless, other drivers could be easily included in the developed calculation tool at a
point when quantified information for the projects will be available.
Figure 6: Drivers of deforestation and degradation
Source: Forest Trends (2011)
Each driver or a combination of drivers is responsible for paths of land use change patterns in
the past and in the future. Forest areas converted to other land uses may be attributed to
these drivers. These spatial patterns of land use change are typically documented in a land
use change matrix. Knowing these land use change patterns, the related spatial information
and the underlying drivers of the land use change, this information can be correlated to the
carbon stock information and the NPV for the respective land uses. With this input
information opportunity cost estimation can be processed for projects, jurisdictions or at

Estimating Cost Elements of REDD+ in Tanzania P a g e | 15
national level. How to use the land use change matrix and related opportunity cost estimation
is explained using REDD+ pilot projects as examples in Annexes 3-5 of this report.
4.3.2 Linking opportunity costs with carbon stock changes
Each land use is characterized by a “typical” carbon stock (tCO2/ha). Since each land use type
is also characterized by a typical NPV ($/ha), both parameters can be linked, resulting in
opportunity cost per ha.
Figure 7 illustrates a simple example of this correlation:
The carbon stock of natural forest is 250 tC/ha which equals 917 tCO2/ha.
The carbon stock of agricultural use is about 10 tC/ha or 37tCO2/ha.
The NPV of forest is 50 $/ha, the NPV for agriculture is 400 $/ha.
Conserving the forest at its current state instead of converting it to agriculture would result in
opportunity costs of 350 $/ha (difference between 400$/ha and 50$/ha), while the carbon
conserved amounts to 880 tCO2/ha (difference between 917 tCO2/ha and 37 tCO2/ha).
Hence, the opportunity cost per tCO2 due to forest conservation amounts to 0.40 $/tCO2.
Based on this calculation cost curves can be developed at project and national level. Since this
is explained best with a real example, the reader is referred to chapter 6.4 for more
information.
Figure 7: Correlation of NPV and carbon stock
Source: World Bank (2011)

Estimating Cost Elements of REDD+ in Tanzania P a g e | 16
Box 2: The “true” value of forest in Tanzania
Knowing that the estimation of opportunity costs only partly reveal the macro-economic value
of forests in Tanzania, the authors would like to emphasise that to date non-monetized forest
values, such as biodiversity, water supply and soil conservation constitute significant benefits to
the economy and the society.
The Resource Economic Analysis of Catchment Forest Reserves in Tanzania in the year 2003
has investigated the full set of possible forest benefits and monetized their values. The results
show a significant higher value of natural forests than the results of the opportunity costs
analysis in this study. The average actual total economic value (TEV) established added up to a
total of 17,250 US$/ha.
A direct comparison of this value against the values estimated within the present opportunity
costs exercise is not possible because different assessment approaches are used. Calculation of
the TEV was based on an infinite cash flow analysis, while the NPV calculation considered
maximum project duration of 30 years. The TEV implied non-monetary revenue streams (e.g.
for biodiversity and water) by applying surrogate values, while the opportunity costs` NPV only
considered marketable products within the respective pilot project context. In both cases a
discount rate of 10% was applied. Nonetheless, the TEV illustrates the economic potential
natural forests in Tanzania host, although this potential has not been recognized economically
and acknowledged so far.
The developed Excel tool provides the possibility to consider and monetize co-benefits.
However, in the selected pilot project case studies no quantification of these benefits has been
conducted so far. Thus, no input information could be processed and factored in the NPV
calculation of forest opportunity costs.
4.4 Implementation costs
The implementation costs of REDD+ at project level are closely related to the respective
project design. The project design should explicitly address the identified drivers of
deforestation (see also section 4.3 on opportunity costs), leakage and project management.
Thus, implementing activities typically are:
Setting up project infrastructure
Establishing PFM structures
Demarcating project area
Patrolling forest

Estimating Cost Elements of REDD+ in Tanzania P a g e | 17
Planting and tending of trees
Training of sustainable forest management practices
Intensifying agriculture and livestock management outside the project area
Improving energy supply and energy efficiency
All types of alternative income generating activities.
For the purpose of this study all costs that enable the project to pursue the project’s design
targets and are incurred by the project (directly or indirectly through REDD+ project funding)
have been considered as implementation costs. This includes, for example, office costs and
personnel. In parts these overhead costs also constitute part of the transaction costs since
they enable the project to certify and market their carbon benefits. In the long run
establishing and maintaining implementation activities will be the major costs.
For the present study implementation costs were derived from the pilot project budgets and
implementation plans. Since the project funding periods are limited (3 to 5 years), no
information on implementation costs over the full duration of the project life was available.
Thus, implementation costs have been extrapolated together with pilot project team members
based on cost estimates from the current project phase. These assumptions considered:
Initial costs in the starting phase of the project
o Setting up project infrastructure
o Conducting basic assessments and studies
o PFM establishment (if not a regular activity over the full project duration)
o Initial trainings and capacity building
o Other initial costs
Periodically returning costs
o Regular trainings for communities (e.g. fire management, SFM training,
agricultural trainings)
o Other periodical costs according to project designs
Annually returning costs
o Staff costs, costs for permanent project offices, communication and transport
o Patrolling
o Any kind of permanent foreseen project activities according to the project
design
In typical REDD+ project designs at least a portion of the expected revenues from carbon
finance schemes are allocated to cover implementation costs over time. Since the use of
returns through carbon finance schemes for future implementation in the pilot projects has
only partly been quantified, this possibility was not factored in. Thus, the projected

Estimating Cost Elements of REDD+ in Tanzania P a g e | 18
implementation costs are gross implementation costs. The projected implementation costs in
the pilot projects could be significantly reduced through re-investments of carbon revenues
into the project.
Results of this study can be compared to the results of Fisher et al (2011). The authors have
established implementation costs in Tanzania, addressing the main deforestation drivers –
agriculture and charcoal – at medians of US$ 6.50 versus US$ 3.90 per tCO2. Therefore, it is
important to note that the present study aimed at using readily available project data to
establish an estimation tool, rather than calculating the implementation costs necessary to
effectively address the drivers of deforestation.
4.5 Transaction costs Transaction costs are incurred throughout the process and relate to climate performance and
benefit measurement costs related to REDD+ activities. Transactions costs are typically
considered separate from implementation costs, since by themselves they do not reduce
deforestation or forest degradation. Typical transaction costs are: i) REDD+ project
development, including baseline survey and Project Design Document preparation costs; ii)
negotiating contracts with buyers; and iii) measurement, reporting, and verification of carbon
stock changes. Transactions costs are incurred by the REDD+ project and third parties such as
verifiers, certifiers, and lawyers.
There is certainly an overlap between transaction costs and institutional costs. For this study,
we distinguished project level costs and national level REDD+ program costs. The Excel tool
developed enables the projects and users to decide where to factor in these costs.
While some of the transaction costs occur only once – typically at the beginning of the project
– others are periodical. The table below illustrates the transaction cost related processes of
REDD+ projects.

Estimating Cost Elements of REDD+ in Tanzania P a g e | 19
Table 3: Transaction cost relevant REDD+ process
Source: Forest Trends (2011)
Table 4: Cost indicators of transaction costs for carbon finance projects under the
Verified Carbon Standard (VCS)
Activity Cost range
Feasibility study US$ 20,000 – 35,000
Project documentation US$ 70,000 – 150,000
Data collection US$ 7,000 – 35,000
Validation US$ 20,000 – 35,000
Registration fee 750 US$ per year
Initial verification US$ 25,000 – 35,000
Ongoing monitoring US$ 5,000 – 35,000
Ongoing verification US$ 15,000 – 25,000
Issuance fee US$200 for up to 1,000 tCO2; US$ 0,05 per tCO2 beyond that
Source: FAO, 2010 modified

Estimating Cost Elements of REDD+ in Tanzania P a g e | 20
4.6 Institutional Costs Institutional costs of REDD+ are defined in the context of this study as costs incurred at the
political-administrative level to develop, manage and enforce REDD+. These are typically
costs incurred by government to ensure a positive legal and regulatory environment, address
governance and reduce unregulated and/or illegal forest use. Furthermore in the context of
REDD+, institutional costs are additional costs incurred by government institutions that are
needed to reduce emissions from deforestation and forest degradation. Clearly, the term
“additional” is somewhat difficult to define within this context. In an ideal world, where
national and local government institutions fulfilled their legal mandates efficiently and
effectively and were sufficiently well resourced to perform these tasks, there would be no
“additional” costs, as deforestation and forest degradation rates would be close to zero.
However, in a ‘real-world context’, government budgets are constrained, capacity is weak and
failures in forest governance signify that illegalities are commonplace. Given the above,
institutional costs in the context of REDD+ are largely concerned with strengthening measures
designed to improve law enforcement, improve local forest management and strengthen
forest governance.
4.6.1 Study approach to institutional costs
In this study we assume that institutional costs are partly covered by the projects and partly by
the government. One part of the institutional costs are comprised of a national average value
of US$ 0.011/ha/yr, which is based on the budgets of the Forest Carbon Partnership Facility’s
(FCPF) Readiness Preparation Proposal (R-PP) for Tanzania (R-PP, 2010). Data was used from
the first four years of the REDD+ readiness and implementation phase equivalent to US$ 2.1
million over 4 years and extrapolated this budget over 30 years. The budget was divided by
the total national forest area of 35.3 million ha. Optionally, only the forest area of REDD+
projects could have been used as reference. However, REDD+ is to be rolled out over suitable
areas in the entire country. The REDD+ institutional framework should be an integral part of
national forest policy and REDD+ contributes to a holistic concept and understanding of
sustainable forest management at national level. Hence, we have opted to allocate costs to
the whole forest area in Tanaznia.
The other part of the institutional costs are covered by the projects that assigned budgets to
institutional capacity building of district level governmental staff and knowledge dissemination
of lessons learned, which is an additional activity to build and strengthen REDD+ relevant
institutions and capacity in Tanzania. The institutional costs did not differ significantly among
project and amounted at US$ 0.06/ha/year for the Jane Goodall, US$0.07 for the TFCG
Mjumita - Lindi project and US$0.05/ha/year for TFCG Mjumita – Kilosa.

Estimating Cost Elements of REDD+ in Tanzania P a g e | 21
4.6.2 Institutional analysis and involvement in REDD+
Forestry and Beekeeping Division & Tanzania Forest Service
The Forestry and Beekeeping Division (FBD) is a division within the MNRT. It has the overall
mandate to protect, manage and conserve forest resources across mainland Tanzania and
support beekeeping and trade in bee products. The forest sector is currently guided by the
Forest Policy of 1998, which set the framework for a reorientation of forestry in Tanzania,
away from a traditional top-down approach to one that facilitates local involvement in the
management of forest resources. The National Forest Programme (2001 – 2010) provides the
strategic framework for implementation of the Forest Policy through a series of “development
programmes”. The Forest Act (2002) provides the legal mandate for the FBD as well as
legislating for the establishment of an autonomous forest management body (Tanzania Forest
Service) and the creation of a Tanzania Forest Fund, through retention of 5% of all forest
royalties and revenues. FBD is currently in a transition phase, following the official launch of
the Tanzania Forest Service (TFS) in August 2011. It is expected that TFS will become fully
operational by the start of the next financial year (2012/2013).
FBD/TFS oversees a national program of PFM – which covers two main approaches to
engaging communities in forest management. Joint Forest Management (JFM) takes place
within government forest reserves, and is legalized by the signing of a Joint Management
Agreement, that defines the roles and responsibilities of the two parties regarding forest
management. Community Based Forest Management (CBFM) takes place on village lands
(outside forest reserves managed by central government).
FBD/TFS manages and directly supervises both forest production and forest protection in
National Forest Reserves (covering about 12 million hectares or around 37 of the total forest
estate). Forest law enforcement and the collection of forest revenues are also under the direct
responsibility of TFS / FBD.
With regard to REDD+ FBD/TFS have been the most engaged national government institution
in Tanzania, given their priority of forest management and protection. The current REDD Task
Force draws members from 11 sectors / institutions, a. o. VPO, MNRT, PMO-RALG, other
ministries, departments and civil society organisations. FBD / TFS is currently implementing a
National Forestry Resources Monitoring and Assessment (NAFORMA) process, with support
from the government of Finland and FAO. This has been expanded in scope to include a
carbon baseline assessment, which will feed into and inform the process of MRV being
established. Given their strong focus on forest management, FBD / TFS has been closely
involved in the planning and execution of these projects.

Estimating Cost Elements of REDD+ in Tanzania P a g e | 22
The Wildlife Division
The Wildlife Division (WD) is the sister institution to FBD, being a division within MNRT. The
Wildlife Division operates under the overall guidance of the Wildlife Policy (2007) and the
Wildlife Conservation Act (2009). The Wildlife Division has the overall responsibility for the
management of wildlife resources outside National Parks, (which fall under Tanzania National
Parks Authority - see below). As with forestry, recent global moves towards a community-
based approach to management of natural resources has resulted in Tanzania in changes in
recent years and moves towards the creation of Wildlife Management Areas (WMAs). WMAs,
located on village land, are established for the co-management of wildlife resources and to
facilitate the sharing of benefits from sport hunting between the state and local communities.
A small secretariat established within the Wildlife Division, called the Wetlands Unit has overall
responsibility for management of wetland resources in Tanzania and overseeing the
implementation of the National Wetlands Strategy.
Despite the importance of the Wildlife Division with regard to management of carbon
resources (and the relatively rapid depletion of carbon stocks in some areas under their
responsibility), the involvement of the WD in discussions over REDD+ has been minimal to
date.
Tanzania National Parks Authority (TANAPA)
The Tanganyika National Parks Ordinance [412] of 1959 established the organization now
known as Tanzania National Parks (TANAPA), and Serengeti became the first National Park.
Conservation in Tanzania is governed by the Tanzania National Parks Act (1970) and the
Wildlife Conservation Act of 1974, which collectively allow the Government to establish
protected areas and outlines how these are to be organized and managed. National Parks
represent the highest level of resource protection that can be provided. TANAPA now
manages 15 National Parks across a wide range of ecosystems in Tanzania. Nature-based or
wildlife tourism is the main source of income that is ploughed back for management,
regulation, and fulfilment of all organisational mandates in the National Parks.
Deforestation and forest degradation rates within National Parks are low relative to other
areas of the country and as such, TANAPA have little to gain from a national REDD+ process.
Furthermore, their significant level of income generated from tourism and relatively strong
donor base means that their financial resource base is relatively secure, particularly when
compared to other government institutions.

Estimating Cost Elements of REDD+ in Tanzania P a g e | 23
Division of Environment (Vice Presidents Office)
The Tanzania Environmental Management Act (EMA), which was passed in 2004 and became
effective in 2005, provides the basic legal and institutional framework for the government of
Tanzania’s sustainable management of the environment. The EMA was developed following
the passing of the Environmental Policy in 1997.
The EMA outlines principles for environmental management and the requirements for this -
namely: impact and risk assessments, prevention and control of pollution, waste management,
environmental quality standards, public participation, environmental compliance, and
enforcement.
As defined in the EMA, two organisations share the institutional responsibilities for
environmental management in Tanzania: The Vice President’s Office/Division of Environment
(VPO/DoE) is responsible for environmental policy making and government environmental
management, while the National Environment Management Council (NEMC) is the technical
entity responsible for enforcement environmental law, compliance, education and research.
Both organisations are overseeing and coordinating the implementation of the EMA.
The EMA empowers VPO/DoE to take overall governmental responsibility for all matters
relating to climate change and to act as the focal point (Designated National Authority) with
regard to the UNFCCC. As such, VPO DoE is the apex body for both climate adaptation and
mitigation efforts, and chairs the National Climate Change Steering Committee and National
Climate Change Technical Committee.
National Environment Management Council
The NEMC was created in 1983 with a broad mandate in the area of environmental
management. One of the most significant milestones in NEMC’s history was the enactment of
the EMA, which clarified the administrative and institutional responsibilities for environmental
management in Tanzania. As a result of the EMA 2004, NEMC’s mandate now encompasses
several new important responsibilities and powers including environmental enforcement,
compliance, environmental monitoring, research, managing of special areas awareness, and
audits. Some of its previous responsibilities (related to policy formulation and coordination)
were handed over to the DoE. Environmental impact assessment (including Strategic
Environmental Assessment) is an important and growing area of work for NEMC
Following the clarification over division of responsibilities following the enactment of EMA,
NEMC’s role in the national REDD+ process to date has been very limited. However as the
debate over potential positive or negative impacts of REDD+at local and national level
develops, it is possible that NEMC may become more involved, given their involvement and

Estimating Cost Elements of REDD+ in Tanzania P a g e | 24
mandate for overseeing Strategic Environmental Assessments (SEA). SEA is a central part of
the World Bank’s approved methodology for impact assessment and mitigation with regard
to national programmes of this nature.
Institute of Resource Assessment (University of Dar es Salaam)
While the Institute of Resource Assessment (IRA) has no formal mandate with regard to
REDD+, its role over the past 24 months has been central, in large part due to linkage with
the Norwegian-funded national REDD+ process. IRA has been engaged as a national
facilitator of the REDD+ readiness process and currently have a small REDD+ secretariat
within the institute. A two-year funding support phase came to an end earlier in 2011 and a
second two-year support grant was agreed in October 2011. Their main involvement to the
national REDD+ readiness process has been to facilitate the work of the National REDD+ Task
Force and to act as a secretariat to this group. They have convened task force meetings,
commissioned consultants on behalf of the Task Force, and supported a series of consultative
meetings, studies and reviews as well as facilitating international study tours. Traditionally IRA
has played an important role within Tanzania with regard to remote sensing, GIS and aerial
surveys. However, to date, MRV development has been focused within FBD and the
involvement of IRA in this process has been minimal.
Prime Minister’s Office – Regional Administration and Local Government (PMO-RALG)
The Prime Minister’s Office – Regional Administration and Local Government (PMO-RALG)
has overall responsibility for coordinating the activities and functions of local government
authorities as well as supporting a national program of decentralization reforms. Based in
Dodoma, PMO-RALG works primarily with district and municipal councils (which total 153)
and regional administrative secretariats. Following the Local Government Act (1982), local
governments became autonomous agencies and were no longer accountable to central
government line ministries and agencies. This means that central government bodies such as
FBD/TFS may only advise local governments by offering technical guidance and ensure
compliance with national legislation, but are not in a position to provide direct instructions or
orders to local government staff.
Given the importance of ensuring that REDD+benefits trickle down to the local level and that
local level actors (such as farmers and villagers involved in PFM) are engaged in REDD,
engaging local government authorities in the REDD+debate has been central. To date, there
have been a series of consultative meetings during the preparation of the draft
REDD+strategy. These have been held with district councils and local CBOs / NGOs.
REDD+pilot projects are in general closely co-ordinated with the activities of local
government staff such as District Forest Officers and District Lands Officers. Furthermore, the

Estimating Cost Elements of REDD+ in Tanzania P a g e | 25
Norwegian Embassy commissioned a short study to assess the feasibility of undertaking
“district level climate change partnerships” which would demonstrate potential roles of district
councils in benefit sharing mechanisms and their involvement and support to REDD+
processes at the local level. To date, these district level climate change partnerships have not
materialized, although they are envisaged in the second phase of Norwegian support through
IRA (see above).
National Land Use Planning Commission (NLUPC)
Since the mid-1990s, Tanzania has witnessed a series of reforms with regard to its land laws
and policies. The National Lands Policy of 1995 provided the overall vision for the lands
sector, and which was followed by the Lands Act (1999) and the Village Lands Act (1999). The
Village Lands Act provides the legal basis for village governments to manage and adjudicate
lands within the “village area”. This includes land for agriculture, settlement, but also lands
endowed with natural resources such as forests, grazing areas and rangelands. A key aspect
of ensuring that village lands are used both rationally, productively and sustainably is village
land use planning – a role which is under the NLUPC mandate and which was reinforced by
the passing of the 2007 National Land Use Planning Act.
Village land use planning is seen as a central aspect of community based natural resource
management on village lands, and is used when planning for community based forest
management, sustainable wetlands management and wildlife management areas. Given
recent concerns under REDD+ regarding possible “leakage” from forest areas under improved
management, village land use planning has become even more important, and is central to all
ongoing REDD+ pilot projects.
Given the rather narrow institutional focus of the REDD+ Task Force to date, NLUPC has not
played any significant role in REDD+ readiness, other than consultations and advisory inputs
with regard to land use planning tools and methods.
Ministry of Agriculture, Food and Co-operatives
Agricultural expansion is seen as one of the biggest drivers of forest loss in Tanzania and as a
result, national and site-level REDD+ strategies will inevitably need to take account of current
agricultural strategies as well support sustainable agricultural approaches in ways that
minimize deforestation. Accordingly, the Ministry of Agriculture, Food and Co-operatives
(MAFC) has been allocated a seat within the national REDD+ Task Force in 2012. The current
national strategy for agriculture (Kilimo Kwanza), which has high level political support,
emphasizes a transformation of the sector, away from non-productive subsistence level
agriculture to a more modernized, commercially oriented sector. This will require expansion

Estimating Cost Elements of REDD+ in Tanzania P a g e | 26
of commercial agriculture to non-farmed lands, an investment in mechanization and a heavy
investment in infrastructure. All of these represent potential hot-spots for deforestation.
Ministry of Finance
The Ministry of Finance and Economic Affairs manages the overall revenue, expenditure and
financing of the Government of the United Republic of Tanzania and provides the
Government with advice on the broad financial and economic affairs of Tanzania in support
of the Government’s economic and social objectives. The Tanzania Revenue Authority is
under the overall supervision of the Ministry of Finance and has responsibility for tax policies
and collection.
Given that REDD+ is in effect an instrument that facilitates the transfer of funds internationally
as well as internally within a given country, the involvement of the Ministry of Finance is critical
in discussions around the emerging REDD+ architecture and in particular with regard to the
establishment of a national REDD+ Trust Fund and benefit sharing modalities and procedures.
To date, Ministry of Finance involvement in the REDD+ debate has been limited. It is
anticipated that as proposals in these key areas become increasingly concrete, their
involvement will grow.
International and National NGOs
The natural resource and environmental sector in Tanzania has historically been well
supported by both national and international NGOs, in large part due to the biodiversity and
conservation importance of the country as a whole, but also due to the pressing and growing
environmental challenges that the country faces as it develops.
A number of national and international NGOs are currently engaged in the implementation of
pilot projects in different parts of the country, with the objective of testing and piloting
approaches to making REDD+ operational on the ground. Other NGOs are more directly
involved in advocacy efforts such as Tanzania Natural Resource Forum (TNRF) and Tanzania
Forest Conservation Group (TFCG). These advocacy processes are largely directed towards a
domestic audience, but are also being undertaken within international forums such as
UNFCCC meetings and other climate change platforms.
4.6.3 Capacity, staffing and budgetary allocations
Forestry Beekeeping Division / Tanzania Forest Service
As indicated earlier, the forest sector is in transition at present, with TFS formally launched but
currently not operational. It is anticipated that TFS will become operational by the start of the
FY 2012/13 (July 2012). One of the key changes resulting from a transition from a division to
Estimating Cost Elements of REDD+ in Tanzania P a g e | 27
an executive agency is the ability to retain and reinvest forest funding. Under current
arrangements, while FBD is a major income earner for Treasury, it is not able to retain any of
these funds. Instead it operates a “retention fund”, which officially allows FBD to retain 66% of
all forest royalties. This is, however, a fund in name only, as all revenues are remitted to
Treasury, and very limited funds are sent back to FBD for recurrent costs.
Under the TFS model, all revenues from forest utilization, licensing and royalties will be
retained. Current levels of revenue collection are in the order of TSh 35 billion / year
(approximately US$ 21 million). Retaining even half of these funds would transform forestry
administration and allow significant levels of investment in forest development, protection and
conservation.
At present, a relatively small forest fund – known as the Tanzania Forest Fund (TFF) – has
been established, as mandated by the 2002 Forest Act. This allows 5% of forest revenues to
be retained at source and allocated to forest development across Tanzania. The projected
budget for this fund for the current financial year is approximately TSh 5 billion (approximately
US$ 3 million), which represents a significant level of support. The fund has only recently
become operational and allocates grants primarily to Tanzania Forest Service / FBD, but
potentially could also allocate funds to local governments and NGOs working in the forest
sector. Operational guidelines have yet to be developed for this and as such, allocations are
currently only made to FBD / TFS. The TFF is overseen by a board, most of whom are drawn
from government agencies (such as MNRT, SUA and Ministry of Finance). Plans are being
made to expand membership from NGOs and civil society. During this financial year, 46% of
the total budget has been allocated in support of law enforcement and forest protection. This
will include support to forest check points, removing human settlements from within forest
reserves, support to Forest Support Units (FSUs) and participation in Forest Law Enforcement
Governance and Trade (FLEGT) processes.
The current financial year budget for TFS is TSh 26.498 billion (around US$ 16.06 million). This
represents a significant growth in budget from the previous FY before TFS had been
launched. It is not clear what the actual allocation to TFS will be during this FY, as the
institution has yet to obtain full financial autonomy and is still dependent on Ministry of
Finance. A review of the budget indicates a significant investment in support to law
enforcement activities (including a proposed expansion of the capacity and operations of the
FSUs, checkpoints and forest management at the reserve level. The current budget has a
provision of TSh 1.6 billion for payment of staff salary and payroll liability for 1800 staff.
However, it is rather unclear whether these staff have yet to be formally transferred to TFS, or
whether they operate under the former system where all staff were paid by the Public Sector
Commission (as with all civil servants).

Estimating Cost Elements of REDD+ in Tanzania P a g e | 28
Following the operationalisation of TFS, FBD will continue to exist in some form or other,
although it has yet to be fully established. It is most likely that any remaining or residual staff
will be absorbed into the MNRT, within the Department of Policy and Planning. The role of
these staff will be one of oversight, ensuring policy compliance, monitoring and regulation. All
operational roles (including forest law enforcement and protection) will be transferred to TFS.
Given this reduction in functions, the number of FBD staff is expected to shrink down to
around 15. The approved budget for FY 2011/12 for FBD totals TSh 6.6 billion (US$ 3.5
million). The bulk of these funds have been allocated to support other forest institutions such
as the Tanzania Forest Research Institute (TAFORI), Forest Training Institute (FTI), Beekeeping
Training Institute, Tanzania Tree Seed Agency and others.
Vice President’s Office – Division of Environment
In 1995, the DoE had eight staff members. In April 2008, this had increased to 57 (including
38 technical staff and 19 support staff), all based in Dar es Salaam. In 2007, DoE submitted a
proposal to the President’s Office – Public Service Management for the Division’s expansion
and organisational restructuring. The request for restructuring was declined, but fifteen new
positions were approved and have been filled. All 38 technical staff are university graduates
(29 have Masters degrees; three have PhDs) and have formal academic training in a wide
variety of areas including environmental sciences, town planning, education, livestock, law,
agriculture, fisheries, economic, mining, engineering and forestry. Approximately one-third of
all DoE staff members are women: 9 technical staff (24%) and 6 support staff (32%).
A profile of DoE’s technical staff in 2005 and 2008, provided in the table below, shows how
DoE has grown since EMA became operational.
Table 5: Profile of DoE technical staff by section
Section Number of Technical Staff
(2005)
Number of Technical Staff
(2008)
Environmental Natural
Habitats Conservation
12 ( 4 women) 13 (4 women)
Environmental Management
of Pollution
10 (3 women) 12 (3 women)
Environmental Impact
Assessment
13 (2 women) 13 (2 women)
Source: Universalia. 2009. Institutional assessment of the Division of Environment
As shown in the following table, DoE’s revenues have increased significantly since 2004, rising
from a budget of around TSh 5.1 billion to almost TSh 16 billion in 2008/09. An increasing
share of the budget is being sourced from the Government of Tanzania.

Estimating Cost Elements of REDD+ in Tanzania P a g e | 29
Table 6: DoE’s revenues break down
Sources of Revenue 2004/05 2007/08 2008/09
TSh (000) % of Total
Budget
TSh (000) % of Total
Budget
TSh (000) % of Total
Budget for
Tanzania
Government 306,400 5.9 4,195,019 30 6,390,282 37.6
Fees and Taxes 0.00 0.0 2,133 0.01 3,653 0.02
Donors 4,879,300 94.09 9,781,700 70 10,599,180 62.4
Total 5,185,700 100 13,978,842 100 16,993,115 100
Source: Universalia. 2009. Institutional assessment of the Division of Environment
Local Government Authorities (LGAs)
Staffing numbers and capacity
There are 106 rural districts in Tanzania and staffing numbers, capacity and budgets vary
enormously across the country. The figures provided in this section are derived from a series
of studies undertaken over the past 10 years, which have aimed to provide insights into
staffing levels and budgets at district level within the arena of natural resources management.
The Eastern Arc Mountains Conservation and Environment Project (funded by UNDP-GEF)
undertook a baseline assessment1 of staffing capacity in 2004, where they assessed the total
amount of staffing and revenues available at district level across 14 Eastern Arc districts in
eastern Tanzania and southern Tanzania.
This review established that there were 79 district-employed foresters (making an average of
5.6 foresters / district) and 69 catchments forest staff (central government staff operating at
local level to protect central-government administered catchment forests) making an average
of 4.9 foresters /district. It may be inadvisable to extrapolate these figures across the whole of
Tanzania – mainly because the study is outdated and the presence of central government
staff (catchment foresters) is known to be higher in this region due to the presence of
catchment forests. Other parts of the country with less important forest resources may have
fewer or no central government staff working on forest conservation locally.
1 Burgess. N and Kilihama, F. 2004. Is enough being invested in Tanzania’s Eastern Arc Mountains? Arc Journal.
Issue 17. Tanzania Forest Conservation Group. Tanzania

Estimating Cost Elements of REDD+ in Tanzania P a g e | 30
The same review found that staffing levels and capacity were much higher within TANAPA-
administered National Parks (such as Mikumi and Udzungwa National Parks).
Districts within the Eastern Arc landscape had 1.75 vehicles / district, 3.5 motorbikes/ district,
1.1 computers / district and 0.3 photocopiers per district. It is likely that these figures have
increased since this review was done in 2004, given additional support provided by PFM and
others.
Local government budgets
A study carried out by WWF’s Coastal Forest Management Programme2 undertook a review
of budgets and revenues in three coastal districts – namely Rufiji, Kilwa and Lindi. They
established financing sources from the following three areas: Central government funding to
local governments, local government internal funding and donor / NGO support.
Central and local government allocations to districts varied as seen in the table below and
have been calculated based on per ha cost (reserved and unreserved forests – figures from
FBD).
Table 7: Budgets of selected districts
Funding source
Rufiji Kilwa Lindi
US$ US$ / ha US$ US$ / ha US$ US$ / ha
Central government
support
13,300 0.010 22,000 0.017 12,328 0.016
Local government
internal support
12,000 0.009 18,687 0.014 14,667 0.018
Source: WWF’s Coastal Forest Management Programme
In the Eastern Arc study (mentioned above), the total revenue provided across all Eastern Arc
districts was found to be about 54,000 US$. It would seem that even in US$ terms this figure
has increased, when compared to those given from coastal areas in 2011.
Local government revenues from forests and forestry activities
Revenues are collected by local governments based on harvesting and transport of forest
products from central government forest reserves and un-reserved forests on village lands.
WWF undertook a study of revenues in the same three districts and the figures are presented
2 Shemdoe, RS and Abdallah, JM. 2011. Socio-economic baseline surveys for selected coastal forest landscapes in
Tanzania. WWF Tanzania

Estimating Cost Elements of REDD+ in Tanzania P a g e | 31
below. The figures have been adjusted to show revenue generation per hectare of forest
within the district (FBD figures)
Table 8: Forest revenues in selected districts
Forest Revenues
generated
Rufiji Kilwa Lindi
US$ US$ / ha US$ US$ / ha US$ US$ / ha
733,000 0.58 82,000 0.064 47,162 0.060
A study conducted on behalf of the Danida PFM programme established that Kilosa district
generated 317 Million TSh from charcoal royalties alone (not including other potential
revenues from timber etc). This comes to around US$ 192,000 and represents about 0.83
US$/hectare generated from forests.
4.6.4 Institutional costs associated with REDD+
The following table provides data gathered by the authors covering the two main types of
costs. Firstly, data is presented on the institutional costs required to support participatory
forest management. This does not include staffing costs or other recurrent costs associated
with these staff, but the direct costs associated with bringing trained facilitators to the field to
support communities in the development of forest management plans, bylaws and local
institutions. Data is provided for processes facilitated by local and national government
agencies, as well as NGOs.
The source of this data presented below is largely from government, NGO and donor-funded
projects. Data is generally derived from budgets, rather than actual spend, as in general this
information is more readily available. In the instance of the Danida-supported PFM program,
however, figures are presented based on actual costs following a detailed analysis conducted
towards the end of the previous phase of program support.
The data for government-led processes shows that costs per hectare vary widely across
different districts. This was due to a number of factors. On one hand, districts worked at very
different levels of scale. Some districts concentrated on a limited number of smaller forest
sites, while others chose larger forest blocks. Furthermore, some districts had greater areas of
forest within their administrative boundaries and had a wider choice of options when selecting
areas to work. Finally, some districts invested significantly in capacity building and awareness
raising before embarking on PFM, as existing capacity and understanding was low.

Estimating Cost Elements of REDD+ in Tanzania P a g e | 32
For the purpose of this study, we used a simplified approach, as outlined in chapter 4.6.1.
Nonetheless, the following tables shall give an overview over all costs project implementers
and REDD+ framework designers could consider when planning and implementing REDD+.
Whether these costs should be allocated to REDD+ in a full cost estimate depends on the
individual REDD+ projects conditions. E. g. PFM (see Table 9: Institutional costs associated
with establishing participatory forest management) is officially a national programme in
Tanzania, independently implemented from REDD+. However, it has only been implemented
in parts of the country. Thus, REDD+ projects in areas where PFM has been implemented
(either by government or NGOs) can draw on already existing community structures, while
other projects have to develop these structures under their own budget.
Ongoing enforcement of forest law and national forest management programs are crucial for
successful implementation of REDD+. Again, in areas where these activities are not
implemented, REDD+ projects have to consider these activities under their own project design
(thus, these costs are project implementation costs). In areas, where the state is successfully
implementing these activities, project can draw on a existing structures. The costs calculated in
the following tables are presented to enable comparability projects with varying pre-
conditions, although these costs are incurred independently form REDD+ and are not
additional.
Table 9: Institutional costs associated with establishing participatory forest
management
Item Initial cost in
US$/ha until PFM
structures are
established
Source Notes and assumptions
PFM Establishment
Costs – at district
level (when
implemented by
local governments)
13.3 US$/Ha Financial data
(actual spend)
from Danida-
supported PFM
programme
Cost per hectare of legally
establishing PFM (both CBFM
and JFM) up to final stage of
legalization. Reflects costing of
PFM establishment costs across
18 districts supported by Danida
between 2003 and 2009.
Establishment costs cover costs
of setting up PFM – but not
maintaining it in medium term.
These costs drop. Exchange is
BoT rate of 5 Dec. 2011 equal to
1,651.7 TSh = 1 US$
PFM Establishment
costs – national
level management
costs and
1.77 US$/ha Financial budget
figures provided
by Danida
supported PFM
Actual costs of supporting
national enabling framework
(including technical assistance)
and then divided by the total

Estimating Cost Elements of REDD+ in Tanzania P a g e | 33
overheads programme actual PFM area (1,996,053 Ha)
including both CBFM and JFM.
Exchange is BoT rate of 5 Dec.
2011 equal to 1,651.7 TSh = $1
US
PFM Establishment
Costs at local level
when implemented
by International
NGO
22.5 US$/ha Financial budget
worksheets from
JGI and Mpingo
Conservation
Project
Average cost of US$ 22.5 US
masks the variation between
US$ 10.65/Ha for MCI and US$
34.3/Ha for TFCG
The average cost/ha of the government program in Danida-supported districts was 13.3
USD/ha. For those districts that were able to “complete” PFM process in > 75% of sites, the
cost rises to US$22.9. The costs of NGO-facilitated PFM within REDD+ pilots sites varied
significantly from US$ 10.6 – 34.3, but with an average of US$ 22.5/hectare. Consequently the
costs of district-facilitated PFM processes compared favourably with those of NGO-facilitated
processes and on average prices were largely similar.
When costs were analysed on a “per village” rather than “per hectare” basis a greater degree
of similarity occurred across institutional types. When facilitated by local governments (under
Danida support), the average cost per village US$ 3,928/Village. This figure rose to US$ 5,374,
when selecting districts that had completed PFM establishment in at least two thirds of the
villages selected for support. One potential explanation for the relatively low variation in costs
between districts when analysed per village is due to the fact that many of the costs of PFM
establishment are focused on the village government (supporting the establishment and
training of village natural resource management committees, preparing management plans
and bylaws) and are less determined by considerations of area.
There were significant differences in costs between district-facilitated and NGO-facilitated
PFM processes. The average cost per village for NGO supported processes was US$ 20,886 /
Village, again, with relatively low levels of variation (figures ranged US$ 22,498 / Village to
US$ 19,294 / Village).
When the implementation costs of introducing PFM are combined with additional costs of
supporting a broader process of rural development, through for example, sustainable
agricultural intensification and reducing demands for charcoal the cost per hectare rises
significantly, up to an average cost of US$ 84/hectare. This combination of PFM plus
integrated rural development is likely to be a common characteristic of REDD+ projects in
Tanzania, so costs in this area are likely to be typical.

Estimating Cost Elements of REDD+ in Tanzania P a g e | 34
Additional data is provided for institutional costs related to general forest management
(recurrent costs) strengthening forest law enforcement, improving the management of
government-administered forest reserves and introducing independent forest monitoring. All
of these are costs that are essential costs required to ensure effective forest management at
the national level.
Table 10: Recurrent costs of forest management and protection
Item Annual cost in US$/Ha
Source Notes and assumptions
PFM Recurrent costs
(patrolling) as seen
from village level
2.39 US$/ha Financial budget
figures from Jane
Goodall International
REDD+ proposal
Training of
Community Monitors
budget from detailed
budget for 70,000 ha
of forest as expressed
in JGI REDD+
Proposal
PFM Recurrent costs
(from district
perspective)
0.0134 US$/ha Kilwa Financial
Scorecard
Data compiled in June
2011 by DFO Kilwa.
TSh 10,000,000
required patrolling
450,000 ha forests on
public lands in Kilwa.
Forest Reserve
Management Costs
(actual)
2.3 US$/ha Jonathon Green
Paper3
This figure represents
actual spend across
Eastern Arc Mountain
forest reserves
managed by central
government
National Park
Management Costs
(actual)
7.7 US$/ha See above Actual costs/ha for
management of
national parks
Forest Reserve
Management Costs
(required)
8.3 US$/ha See above Estimated cost of
effective forest
management, as
expressed by forest
reserve managers
Amount needed to
manage forests and
3.64 US$/ha Moore et al, 2004 Figure provided for
generic African
3 Jonathan M. H. Green, Neil D. Burgess, Rhys E. Green, Seif S. Madoffe, Pantaleo K. T. Munishi, Evarist Nashanda,
R. Kerry Turner, Andrew Balmford. Estimating management costs of protected areas: a novel approach from the
Eastern Arc Mountains, Tanzania. Paper submitted to Biological Conservation (under review)

Estimating Cost Elements of REDD+ in Tanzania P a g e | 35
protect them
adequately
Montane forest
habitats – not
Tanzania specific
The figures above provide a number of important findings. The costs of effective forest
management, as estimated by Tanzania Forest Service (TFS) is US$ 8.3 per hectare, but
current budget constraints mean that current expenditure is around US$ 2.3 per hectare. This
compares with US$ 7.7 per hectare, being the actual revenue spent by Tanzania National
Parks Authority (TANAPA) to manage forest areas under their jurisdiction. The estimate of
recurrent forest management costs by communities for areas under PFM is $2.3, which is just
over a quarter of the estimated costs of effective management defined by TFS.
Table 11: Law enforcement and surveillance costs
Item Annual cost in US$/Ha
Source Notes and assumptions
Total law enforcement
costs from FBD/ TFS
0.043 US$/ha Tanzania Forest
Service, National
Forest Programme
and Tanzania Forest
Fund Budgets
Figure derived from total law
enforcement budget of FBD /
TFS divided by the total
estimated area of forest
Exchange is BoT rate of 5 Dec.
2011 equal to TSh 1,651.7 = 1
US$.
Cost of running Forest
Surveillance Units
0.001 US$/ha Tanzania Forest
Service, National
Forest Programme
and Tanzania Forest
Fund Budgets
Figure derived from Forest
Surveillance Units budgets of
FBD / TFS divided by the total
estimated area of forest.
Exchange is BoT rate of 5 Dec.
2011 equal to TSh 1,651.7 = 1
US$.
Required costs of
running Forest
Surveillance Units
effectively
0.002 US$/ha Tanzania Forest
Service Budgets
TFS budget for 50%
effectiveness is TSh
577,479,400 for 35.3 million
hectares of Tanzania’s forests
(equal to TSh 16.36/Ha or $
0.001/ha). Assumed double the
budget would suffice for 100%
effectiveness. Hence TSh
0.002/Ha
Costs of Independent
Forest Monitoring (to
increase law
enforcement and
improve forest
governance)
0.029 US$/ha Data from feasibility
study on Independent
Forest Monitoring
(IFM) carried out by
REM (UK)
Initial costs are highest (over 1
M / year) and dropping off
1 Million US$ / year – covering
all of Tanzania
Divided by 35.3 million Ha of
forests in Tanzania

Estimating Cost Elements of REDD+ in Tanzania P a g e | 36
The figures above suggest that forest law enforcement and improved governance may
represent significant costs when seen from the national level, but when expressed as per
hectare costs are relatively minor, when compared with other institutional costs.
5. REDD+ Costs Tool
An Introduction to the Excel-based Tool
Conceptually the REDD+ costs analysis is based on the World Bank training manual
Estimating the Opportunity Costs of REDD+ (2011). The analysis in this study used a bottom-
up approach to estimate REDD+ cost elements whereby project specific secondary data on
land use changes, carbon stocks and costs / benefits of existing land uses was collected from
three Tanzanian REDD+ pilot projects and one PFM area (in total four project locations). For
the estimation of REDD+ cost elements we developed an Excel-based tool that allows
estimating cost elements in a consistent manner and provides input data masks that can be
linked with the REDD ABACUS software4, a visualisation tool for opportunity cost curves that
was developed by the World Agroforestry Centre.
In general the design of an opportunity cost curve includes the analytical steps as shown in
Figure 8 below. The development of the opportunity costs requires four major steps:
i. the classification of the current land use types at the project start and an analysis of
the historical land use changes that relates to a detailed analysis of the drivers of
deforestation in the respective project area;
ii. analyzing the long-term average carbon stocks of the identified land uses;
iii. estimation of the annual cash flow and the net present value of the identified existing
land uses; and
iv. the generation of an opportunity cost curve with ABACUS.
Detailed explanation of input parameters and interpretation of output data is given in Annex I.
4 http://www.worldagroforestry.org/sea/abacus

Estimating Cost Elements of REDD+ in Tanzania P a g e | 37
Figure 8: Analytical steps to develop an opportunity cost curve
Source: Adapted from World Bank (2011)
After the establishment of opportunity cost curves other REDD+ cost elements are estimated,
including implementation costs, transaction costs and institutional costs. The data for the
implementation and transaction costs is used from budgets of the respective REDD+ pilot
projects. For the estimates of institutional costs that are not incurred by the project developers
but are reflected in the national budgets to build institutions, design and implement a national
REDD+ framework, we used the national budgets of the national REDD+ readiness and
implementation budgets to estimate institutional costs.
For the presented analytical steps we developed an Excel-based tool that provides key input
data for ABACUS to design opportunity costs curves. The tool is based on five major
components as illustrated in Figure 9 following the analytical steps mentioned above. In the
next sections each step is elaborated in detail with examples from the REDD+ cost element
Excel tool.

Estimating Cost Elements of REDD+ in Tanzania P a g e | 38
Figure 9: Excel-tool conceptual framework to estimate REDD+ cost elements

Estimating Cost Elements of REDD+ in Tanzania P a g e | 39
6. Costs of REDD+ Pilot Projects
A Summary of the Results
This section summarizes the results of the comparative study on the five REDD+ and SFM
project cases as shown in Table 12: Characteristics of selected pilot projects, representing a
total area of over 358,000 ha. Following the analytical stepwise approach, as described in the
previous chapters we present the key input data on the four project cases that were used to
estimate the costs of REDD+ pilot project, followed by the carbon stock assumptions and the
economics of the project specific land use systems.
We present and interpret the opportunity costs curves for three projects that were subject to
historical deforestation and forest degradation and comparatively estimate cost elements of
the project. All assumptions are based on a project lifetime of 30 years, as proposed in most
project cases. Cost elements of projects with a shorter project lifetime were extrapolated to a
period of 30 years aiming to maintain consistent comparability of the projects.
6.1 Selected REDD+ pilot projects After identification of the four pilot projects that will be considered in the analysis it appeared
that only three projects can be classified as REDD+ projects: the Jane Goodall Kigoma project,
as well as the two TFCG projects in Mjumita Kilosa and Lindi. The Mpingo Conservation and
Development Initiative (MCDI) can be classified as a carbon stock enhancement project
without significant historical deforestation pressure that will enhance carbon stocks, as shown
in Table 12: Characteristics of selected pilot projects.

Estimating Cost Elements of REDD+ in Tanzania P a g e | 40
Table 12: Characteristics of selected pilot projects
Jane Goodall
Kigoma project
TFCG Mjumita
project -
Kilosa
TFCG-Mjumita
project - Lindi
Mpingo
Conservation and
Development
Initiative
Project type/activities REDD REDD REDD SFM
Total project area (ha) 85,200 ha 148,825 ha 93,800 ha 30,000 ha
Major drivers of deforestation Unsustainable
timber
extraction;
Unsustainable
fuel wood
collection;
Shifting
cultivation;
Pasture
(grazing
cattle)
Unsustainable
charcoal
production;
Shifting
cultivation
Unsustainable
charcoal
production;
Shifting
cultivation
No significant
drivers of
deforestation,
regular fire may
be driving force,
but, reference
emissions level
not assessed, yet.
6.2 Carbon Stocks of Pilot Projects For the five project cases we used project-specific carbon stock estimates. For the analysis of
the opportunity costs all identified land use systems including natural forest and all drivers of
deforestation and forest degradation are assigned a long-term average carbon stock value
(30 years). Unsustainable land use such as timber extraction, charcoal and fuelwood collection
is assumed to be converted to shifting cultivation over a certain period of time, depending on
the project. The table below presents the carbon stocks for all four project cases.

Estimating Cost Elements of REDD+ in Tanzania P a g e | 41
Table 13: Carbon stocks estimates for opportunity cost analysis (tCO2/ha)
Jane Goodall
Kigoma project
TFCG Mjumita
project - Kilosa
TFCG-Mjumita
project - Lindi
Mpingo
Conservation and
Development
Initiative
Natural forest 80.6 145.3 158.6 73
Unsustainable timber extraction 30.2
Sustainable timber extraction 110
Unsustainable charcoal production 16.1 53.8
Unsustainable fuel wood production 30.2
Agriculture (Shifting cultivation) 15.4 16.1 53.8
Pasture (Cattle) 22.2
Note: Projects are planning to use different carbon pools to account for potential GHG emissions reduction and removals: Jane Goodall
Kigoma project: Accounting of above-ground and below-ground biomass based on the average carbon stock as identified in the
Ground Forest Carbon assessment of the Masito Ugalla Ecosystem Pilot area (Zahabu, 2011) and Fisher et al, (2011); TFCG Mjumita –
Kilosa: Long-term average aboveground carbon stocks are based on a weighted average carbon stock from 17 forest plots randomly
distributed across the project area. Belowground carbon stocks are based on IPCC default root-to-shoot ratio for dry tropical forest;
TFCG Mjumita – Lindi: The long-term average is based on the average aboveground and belowground carbon stock from TFCG
Mjumita project staff derived from field surveys; Mpingo Conservation and Development Initiative: The project accounts only for
aboveground carbon stocks and the long-term average carbon stocks are based on data from Mpingo project staff and the
assumption that the conversion of natural forest to sustainable timber extraction will result in an increase of 37 tCO2/ha over a period
of 30 years.
6.3 Land use economics of pilot projects The land use economics were based on the calculation of the average annual cost and
revenues of the identified land use types existent in the project areas. All costs and prices are
based on the farm-gate level. For the determination of the Net present value we used a
discount rate of 10% and calculated the NPV for a period of 30 years. The figure below
presents the NPVs for all projects and existent land use types. Each color indicates one
project. The key input data for all land uses are presented in the project specific summary
reports.

Estimating Cost Elements of REDD+ in Tanzania P a g e | 42
Figure 10: Opportunity costs of land uses in the selected pilot projects
Compared to the other projects the Jane Goodall Kigoma Project has the highest NPV for all
land use types. The NPV for natural forest amounts at US$ 924/ha, while shifting cultivation is
the most profitable business in this region with a NPV of US$ 2,806/ha. This indicates that the
avoidance of converting natural forest to shifting cultivation will comprise the highest
opportunity costs. Only unsustainable fuel wood collection (US$ 533/ha) is less profitable than
natural forest use that will result in long-term net GHG benefits and economic benefits when
avoiding this land use type.
In contrast the Mpingo Conservation and Development Initiative, where historically no
deforestation pressure and no forest use has taken place, has a NPV of US$ 0/ha for natural
forest. With the implementation of the sustainable forest management activities the NPV will
increase to US$ 9/ha resulting in net GHG benefits and economic gains in the long-term. In
the TFCG Mjumita Lindi and Kilosa projects, the NPVs indicate relatively high opportunity
costs to avoid the conversion of natural forest (US$ 95/ha) to unsustainable charcoal
(US$ 1,290 for Kilosa and US$ 1,662/ha for Lindi); and shifting cultivation (US$ 1,023/ha for
Kilosa and US$ 1,232/ha for Lindi).
0 9
924
1687
533
2806
1348
95
12901023
95
1662
1232
0
500
1000
1500
2000
2500
3000
Natural forest Unsustainable
timber extraction
Sustainable
timber extraction
Unsustainable
fuelwood collection
Unsustainable
charcoal production
Agriculture
(Shifting cultivation)
Pasture (Cattle
grazing)
MCDI REDD Jane Goodall Kigoma project Mjumita TFCG project Lindi Mjumita TFCG project Kilosa
US$/ha

Estimating Cost Elements of REDD+ in Tanzania P a g e | 43
6.4 Opportunity costs curve for REDD+ pilot
projects Using the carbon stock data, the NPVs for the respective land uses and the deforestation
rates over the past 10 years of each project we constructed an opportunity cost curve using
the ABACUS software. The opportunity costs curve allows us to view and compare the
foregone benefits of the analyzed projects and land uses if avoiding the conversion of natural
forest to other land use types.
Box 3: How to read the opportunity cost curve
Each bar represents an option of avoiding GHG emissions from converting
natural forest to another land use type.
The width of each bar shows the GHG emission reduction/carbon removal
potential (in tCO2 over a period of 10 years taking into account the current
economic conditions and assuming that the deforestation will occur in the
same manner as in the past 10 years.
The sum of all bars cumulates the total GHG emission reduction potential over
a period of 10 years (tCO2) from all projects.
The height of each bar shows the opportunity cost for avoiding the conversion
of one land use to another (US$/tCO2).
The bars on the left hand side represent the cheapest emission reduction
options, while the bars on the right hand side comprise the most expensive
GHG emission reduction options. Thus, avoidance of land use changes on the
left hand side provide relatively cheap GHG emission reduction potential and
serve as a crucial basis to prioritize cost-effective measures to avoid
deforestation.
Each colored bar represent one distinct REDD+ project.

Estimating Cost Elements of REDD+ in Tanzania P a g e | 44
Figure 11: Opportunity cost curve for three pilot projects
The opportunity costs curve was developed based on three REDD+ projects that have
experienced historical deforestation. The three projects represent a total area of 328,000 ha.
The cost curve depicted in Figure 11 above shows all land use changes that occurred over the
past 10 years in the project areas. It shows that the Jane Goodall project in Kigoma has four
major drivers of which two can be avoided at low opportunity costs and two are relatively
expensive. The avoidance of unsustainable fuel wood collection has negative opportunity
costs (US$ -7.8/tCO2) and avoiding the conversion of natural forest to pastoral land would
cost (US$ 7.3 tCO2). Both measures could avoid about 0.32 MtCO2 over 10 years. In contrast,
the avoidance of land use shift towards unsustainable charcoal production and unsustainable
timber extraction are the most expensive measures creating opportunity costs of
US$ 28.8/tCO2 and US$ 15.1/tCO2 respectively, and could avoid emissions of about 0.49
MtCO2. In the TFCG Mjumita Lindi project the avoidance of land use change towards shifting
cultivation and unsustainable charcoal production comprises opportunity costs of
US$ 8.9/tCO2 and US$ 11.4/tCO2 respectively and could reduce emissions by 1.76 MtCO2 over
a period of 10 years. In the TFCG Mjumita Kilosa project opportunity costs for shifting
cultivation would amount US$ 8.8/tCO2 and for unsustainable charcoal production
US$ 12.1/tCO2. In total, the avoidance of converting natural forest to these land uses has the
potential to reduce emissions by 1.2 MtCO2 over 10 year.

Estimating Cost Elements of REDD+ in Tanzania P a g e | 45
6.5 REDD+ cost elements of pilot projects In this sub-section we present the REDD+ cost elements namely implementation, transaction
and institutional costs. Moreover, institutional costs will arise that are not paid by the project
developers, but are included in the national budgets of the REDD+ readiness and
implementation plans under the framework of the FCPF with a budget of US$ 2.1 million
between 2010 and 2013. For the implementation and transaction costs we used the annual
budgets of the projects and calculated the annual average costs per ha for each project,
ranging between US$ 2.4/ha to US$ 8.9/ha as shown in Figure 12 below. The bulk of all cost is
comprised by implementation costs in each project, while institutional costs and transaction
costs have a relatively insignificant share ranging between 5 % (TFCG / Mjumita - Lindi) and
11 % (Jane Goodall Kigoma) of total annual costs/ha. Only the Mpingo Conservation and
Development Initiative Conservation and Development Initiative has a larger share of
transaction and institutional costs, amounting at 32 % of total costs/ha. The latter reflects the
overall low project costs and benefits.
Figure 12: Annual average project costs/ha
Taking into account the different scales of the project, the annual average costs for each
project are shown in Figure 13 below, ranging between US $0.18 million for the 30,000 ha
Mpingo Conservation and Development Initiative and US$ 0.75 million for the 85,200 ha large
Jane Goodall Kigoma project. At current costs without taking into account inflation, the
0
2
4
6
8
10
12
MCDI REDD Jane Goodall Masito pilot project
TFCG / Mjumita project - Lindi
TFCG / Mjumita project - Kilosa
Implementation costs Transaction costs Institutional costs
US$/ha/year
$6.2
$3.9
$8.9
$5.9

Estimating Cost Elements of REDD+ in Tanzania P a g e | 46
Mpingo Conservation and Development Initiative will cost US$ 5.4 million over 30 years; Jane
Goodall Kigoma US$ 22.7 million; TFCG Mjumita Lind and Kilosa each US$ 17.4 million.
Figure 13: Total annual average costs
6.5.1 Total costs per avoided tCO2
Taking into account all four cost elements of the project and using the GHG emission
reduction/removal estimates, we calculated the cost for each avoided tCO2 emission or
removal.
The total costs range between US$ 4.8/tCO2 for the TFCG Mjumita Lindi project and
US$ 13.8/tCO2 for the Jane Goodall project. In our calculation we did not add the opportunity
costs to the total project costs as we assume that with project implementation opportunity
costs will be reduced through alternative income generating activities.

Estimating Cost Elements of REDD+ in Tanzania P a g e | 47
Figure 14: Costs to avoid 1 tCO2
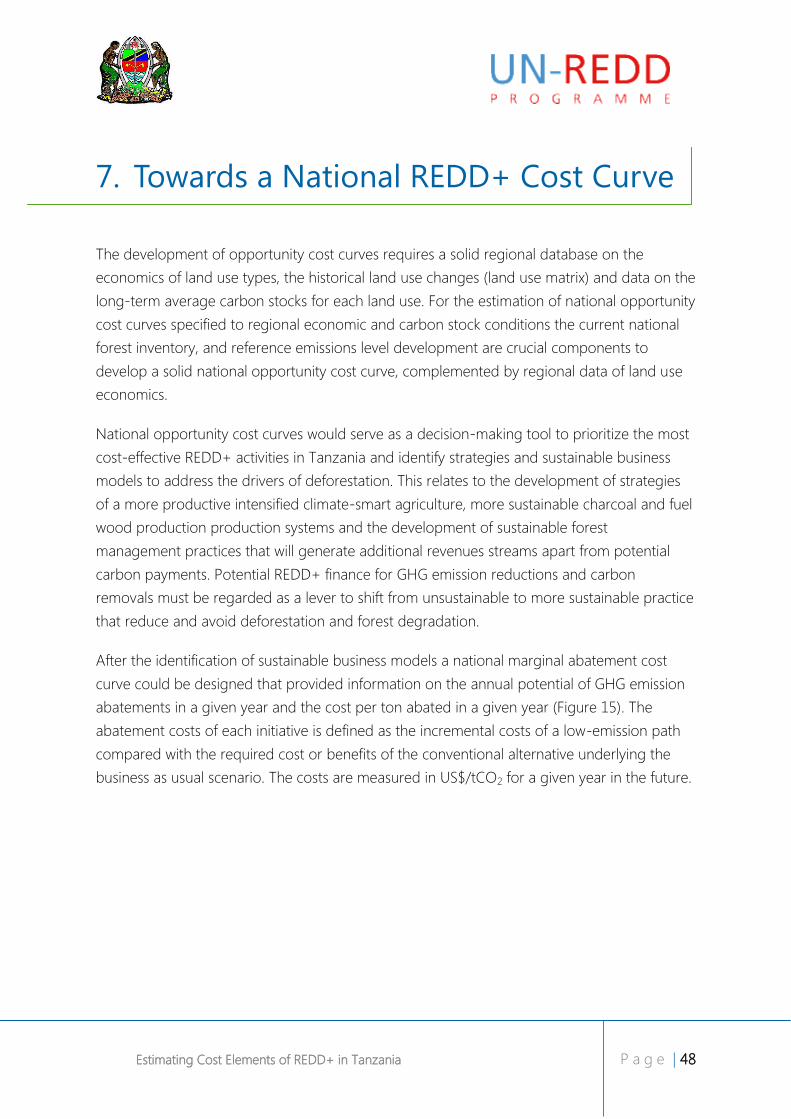
Estimating Cost Elements of REDD+ in Tanzania P a g e | 48
7. Towards a National REDD+ Cost Curve
The development of opportunity cost curves requires a solid regional database on the
economics of land use types, the historical land use changes (land use matrix) and data on the
long-term average carbon stocks for each land use. For the estimation of national opportunity
cost curves specified to regional economic and carbon stock conditions the current national
forest inventory, and reference emissions level development are crucial components to
develop a solid national opportunity cost curve, complemented by regional data of land use
economics.
National opportunity cost curves would serve as a decision-making tool to prioritize the most
cost-effective REDD+ activities in Tanzania and identify strategies and sustainable business
models to address the drivers of deforestation. This relates to the development of strategies
of a more productive intensified climate-smart agriculture, more sustainable charcoal and fuel
wood production production systems and the development of sustainable forest
management practices that will generate additional revenues streams apart from potential
carbon payments. Potential REDD+ finance for GHG emission reductions and carbon
removals must be regarded as a lever to shift from unsustainable to more sustainable practice
that reduce and avoid deforestation and forest degradation.
After the identification of sustainable business models a national marginal abatement cost
curve could be designed that provided information on the annual potential of GHG emission
abatements in a given year and the cost per ton abated in a given year (Figure 15). The
abatement costs of each initiative is defined as the incremental costs of a low-emission path
compared with the required cost or benefits of the conventional alternative underlying the
business as usual scenario. The costs are measured in US$/tCO2 for a given year in the future.

Estimating Cost Elements of REDD+ in Tanzania P a g e | 49
Figure 15: Example of a national marginal abatement cost curve
Source: Ethiopia’s Climate-Resilient Green Economy, (2012)

Estimating Cost Elements of REDD+ in Tanzania P a g e | 50
8. Conclusions
8.1 Overall conclusion The REDD+ cost curve is a useful and flexible tool well suited to the Tanzanian context where
REDD+ projects continue to be designed and real data continues to become available. The
cost curves allow project developers to determine the carbon price that would be required to
meet the opportunity cost of selected land use practices, and the total amount of emission
reduction that could be obtained for each land-use type. The tool allows for forecasting the
impact of policy changes, such as improved forest law enforcement or agricultural subsidy
programs, on the total REDD+ costs within any given project. The tool also allows for national
cost curves to be generated from individual project data inputs over time.
The anticipated revenues from REDD+ cannot be expected to cover all REDD+ costs for
projects aiming to address deforestation drivers such as agricultural expansion or charcoal
production. As such, REDD+ initiatives need to be closely integrated with other sectoral
investment plans (such as agriculture and energy) to ensure harmonization of plans, and to
offset implementation costs
Current REDD-readiness planning in Tanzania is being undertaken, in anticipation of a future
REDD+ compliance market. While REDD+ revenues may be significant initially, they are
certain to decline as deforestation rates drop. It will be important to channel a significant
share of revenues into raising the value and productivity of both forests and surrounding
landscapes to provide alternative (and sustainable) revenue streams in the future. This is
illustrated in the figure below.
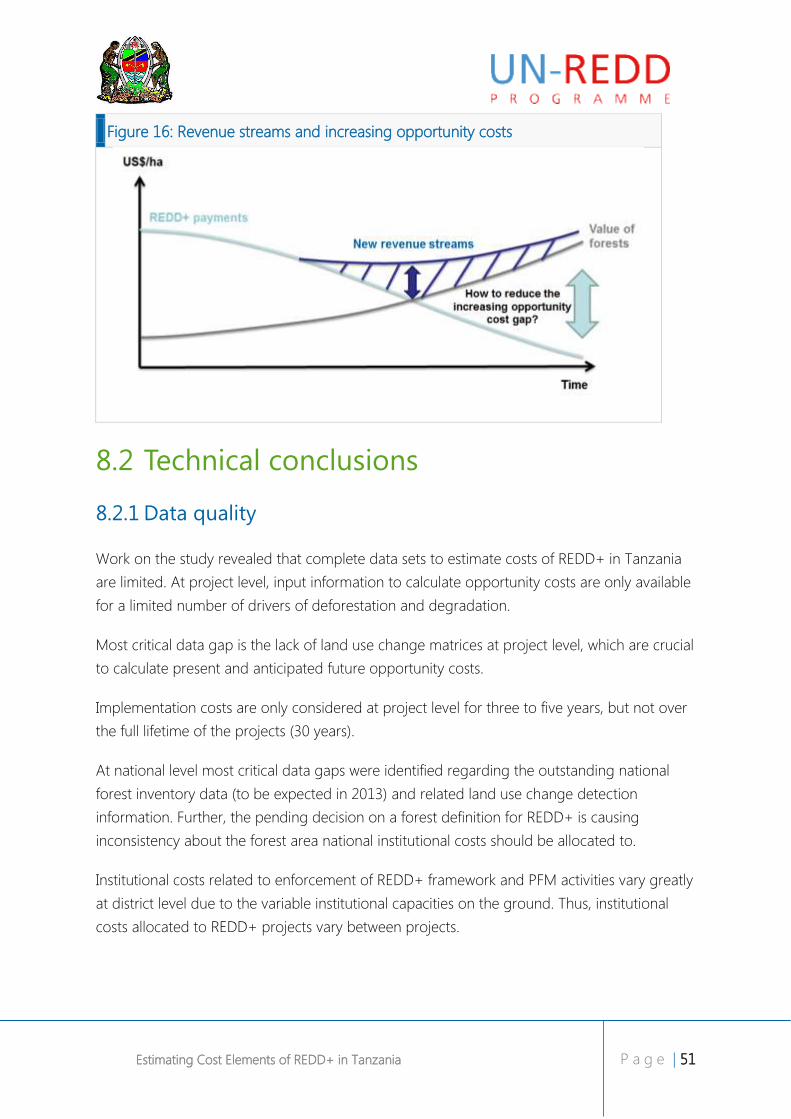
Estimating Cost Elements of REDD+ in Tanzania P a g e | 51
Figure 16: Revenue streams and increasing opportunity costs
8.2 Technical conclusions
8.2.1 Data quality
Work on the study revealed that complete data sets to estimate costs of REDD+ in Tanzania
are limited. At project level, input information to calculate opportunity costs are only available
for a limited number of drivers of deforestation and degradation.
Most critical data gap is the lack of land use change matrices at project level, which are crucial
to calculate present and anticipated future opportunity costs.
Implementation costs are only considered at project level for three to five years, but not over
the full lifetime of the projects (30 years).
At national level most critical data gaps were identified regarding the outstanding national
forest inventory data (to be expected in 2013) and related land use change detection
information. Further, the pending decision on a forest definition for REDD+ is causing
inconsistency about the forest area national institutional costs should be allocated to.
Institutional costs related to enforcement of REDD+ framework and PFM activities vary greatly
at district level due to the variable institutional capacities on the ground. Thus, institutional
costs allocated to REDD+ projects vary between projects.

Estimating Cost Elements of REDD+ in Tanzania P a g e | 52
8.2.2 Opportunity Cost
Considering the restrictions related to data quality and availability, the elaborated opportunity
cost curve provides information on the quantity of potential emission reductions and their
cost (per tonne of CO2). The opportunity cost curve represents data from three pilot project
sites, in total covering an area of 358,000 hectares of forest in western, central and southern
Tanzania.
8.2.3 Institutional Costs
Districts receiving funds from central government to support the introduction of PFM perform
at very different levels of effectiveness and efficiency. For those districts that were able to
complete the PFM process in more than 75% of the sites supported, the cost / hectare was
US$22.9. When the same process was implemented by NGOs, the costs varied from US$ 10.6
– 34.3 / hectare, with an average of US$22.5 / hectare. These figures suggest that there are
no significant differences in costs of a PFM process facilitated by district authorities when
compared to a similar process facilitated by an NGO.
When the implementation costs of introducing PFM are combined with additional costs of
supporting a broader process of rural development, through for example, sustainable
agricultural intensification and reducing demands for charcoal the cost per hectare rises
significantly, up to an average cost of US$ 84/hectare. This combination of PFM plus
integrated rural development is likely to be a common characteristic of REDD+ projects in
Tanzania, so costs in this area are likely to be typical.
Costs per village provide a much more uniform cost-estimate than costs per hectare for
supporting the introduction of PFM, although there are significant differences between NGO
costs and those of government. This is perhaps unsurprising as many of the costs tend to be
directed at the village government, and are less determined by area. The average cost per
village of supporting PFM establishment is $3,298 when implemented by local governments
compared to US$20,866 / village when implemented by NGOs.
The costs of effective forest management, as estimated by TFS is US$8.3/hectare, but current
budget constraints mean that current expenditure is around US$ 2.3/hectare. This compares
with US$ 7.7/hectare, being the actual revenue spent by TANAPA to manage forest areas
under their jurisdiction. The estimate of recurrent forest management costs by communities
for areas under PFM is $2.3/hectare – just over a quarter of the estimated costs of effective
management defined by TFS.

Estimating Cost Elements of REDD+ in Tanzania P a g e | 53
8.2.4 Implementation costs
In addition to the opportunity costs, all REDD+ projects will face implementation costs and
transaction costs. As presented above, institutional costs will arise that are only partly paid by
the project developers, and will have to be included in the national budgets of the REDD+
readiness and implementation plans. Of these three costs, implementation costs are by far the
biggest portion. The results show a high variation of implementation costs between pilot
projects.
Care must be taken when comparing these costs and drawing conclusions regarding the
relative costs of different NGO-implemented projects. The JGI and TFCG pilot projects address
a range of deforestation drivers (including supporting agricultural development to address
slash and burn), whereas the MCDI project is effectively supporting the introduction of
sustainable forest management through community based forest management, and is not
addressing other (more costly) drivers such as agriculture.
8.2.5 Total REDD+ Costs / tCO2
The findings indicate significant differences between projects in terms of the total costs of
avoiding carbon emissions. The MCDI project has the lowest total cost (at US$ 4.9 /tCO2 while
the JGI project has the highest total REDD+ costs at US$ 13.8/tCO2.
Care must be taken in drawing conclusions about efficiency levels of different pilot projects –
the MCDI project experiences no opportunity costs (due to lack of deforestation pressure) and
does not face heavy implementation costs to address these drivers. The JGI project appears to
be more expensive, due to both significant opportunity as well as implementation costs faced
in this zone.
The figures above might be brought down to a more realistic perspective if:
• other sources of income are taken into consideration (such as anticipated incomes to
farmers from improvements in agricultural production, or income from forest
harvesting)
• some of the costs, such as those relating to agricultural improvements and addressing
charcoal production and sale were included under other budgets (such as those of the
Ministry of Agriculture, or Ministry of Energy)

Estimating Cost Elements of REDD+ in Tanzania P a g e | 54
9. References
Antinori, C. and J. Sathaye (2007): Assessing transaction costs of project-based greenhouse
gas emissions trading. Lawrence Berkeley National Laboratory. Berkeley, C.A., USA.
Boucher, D. (2008): What REDD can do: The Economics and Development of Reducing
Emissions from Deforestation and Forest Degradation. Draft for external review (June).
Tropical Forest and Climate Initiative – Union of Concerned Scientists. Washington
D.C., USA.
Burgess. N and Kilihama, F. (2004): Is enough being invested in Tanzania’s Eastern Arc
Mountains? Arc Journal. Issue 17. Tanzania Forest Conservation Group. Tanzania
Camco Advisory Services , (2009). Feasibility Study to Assess the Potential of the Angai Village
Land Forest Reserve to become a Community REDD Project. Report presented to the
Clinton Foundation – Clinton Climate Initiative.
Eliasch, J. (2008): The Eliasch Review – Climate Change: Financing Global Forests. UK Office of
Climate Change. Available online at: http://www.occ.gov.uk/activities/eliasch.htm.
Ethiopia’s Climate-Resilient Green Economy – Green Economy Strategy, (2012). FEDERAL
DEMOCRATIC REPUBLIC OF ETHIOPIA.
FAO (2010): Carbon Finance possibilities for agriculture, forestry and other land use projects
in a smallholder context. FAO, Rome
Fisher, B. et al (2011): Implementation and opportunity costs of reducing deforestation and
forest degradation in Tanzania. Nature Climate Change, published online: 29 May
2011
Forest Trends (2011): REDD Guidance. Technical Project Design. Washington D.C
Grieg-Gran, M. (2008): The cost of avoiding deforestation: Update of the report prepared for
the Stern Review of the Economics of Climate Change. Paper commissioned by the

Estimating Cost Elements of REDD+ in Tanzania P a g e | 55
Office of Climate Change as background work to its report Climate Change: Financing
Global Forests (The Eliasch Review). IIED, London, UK.
IUCN (2009): The Financial Costs of REDD: Evidence from Brazil and Indonesia
Kindermann, G., M. Obersteiner, B. Sohngen, J. Sathaye, K. Andrakso, E. Rametsteiner, B.
Schlamadinger, S. Wunder and R. Beach (2008): Global cost estimates for reducing
carbon emissions through avoided deforestation’ in Proceedings of the National
Academy of Science of the Unites States of America. Available online at:
http://www.pnas.org/content/105/30/10302.full
MNRT (2003): Resource Economic Analysis of Catchment Forest Reserves in Tanzania. Ministry
of Natural Resources and Tourism, Dar es Salaam
Nepstad, D., B. Soares-Filho, F. Merry, P. Moutinho, H. Oliveira-Rodriguez, M. Bowman, S.
Schwartzman, O. Almeida and S. Rivero (2007): The costs and benefits of reducing
carbon emissions from deforestation and forest degradation in the Brazilian Amazon.
WHRC-IPAM-UFMG.
World Bank (2011): Estimating the Opportunity Costs of REDD+: A training manual. Version
1.3. The World Bank, Washington. Available at:
http://wbi.worldbank.org/wbi/Data/wbi/wbicms/files/drupal-
acquia/wbi/OppCostsREDD+manual.pdf
Zahabu, E. (2011) Ground Forest Carbon Assessment of the Masito Ugalla Ecosystem Pilot
Area. Faculty of Forestry and Nature Conservation, Sokoine University of Agriculture.
Prepared for the The Jane Goodall Institute

Estimating Cost Elements of REDD+ in Tanzania P a g e | 56
Annex 1 – Input Parameters
Project key data In the project key data input sheet the user has to classify the existing land use types in the
project and estimate the area covered by the project and select the project lifetime (as shown
in table below). Thereby, the user may choose among land use types (see Table 14: Data
entry sheet for land use type areas (ha)) for which a separate 1-ha based model sheet is
constructed (see Land use economics section). The Excel-tool is constructed in a manner that
allows the user to input data only in yellow cells, while the remaining fields are protected and
not changeable.
Table 14: Data entry sheet for land use type areas (ha)
For the purpose of a REDD+ opportunity cost analysis, a value of a time-averaged carbon
stock must be estimated for each identified land use system (World Bank, 2011). A typical
carbon stock value integrates the gains and losses over a life-cycle of a land use. This single
value is used for carbon accounting purposes and is compared with an economic indicator in

Estimating Cost Elements of REDD+ in Tanzania P a g e | 57
form of Net Present Value (NPV in US$/ha). The table below shows the data entry masks in
the REDD+ cost elements tool.
Table 15: Data entry sheet for land use type carbon stocks
Land use economics Following the step-wise approach, each identified land use type requires an economic
indicator in form of a NPV (US$/ha) as a comparable economic parameter for different land
use types.
Data input sheets have been developed for each land use that requires the user analyzing the
existing land use costs and benefits on a per ha basis in order to realistically reflect the NPV
of each land use. Also natural forest receives an NPV e.g. for extensive fuel wood collection,
or other non-timber forest products.

Estimating Cost Elements of REDD+ in Tanzania P a g e | 58
Table 16: Natural forest data entry sheet
As an example for other land use types, agricultural land use is presented below. Initially the
user has to select between permanent cropping systems or shifting cultivation and afterwards
the most common crops being grown on farms, e.g. maize, beans, rice etc. Thereby the user
must estimate a percentage of each crop in the typical agricultural system that reflects the
project conditions (Table 17: Data entry sheet for agriculture mix):
Table 17: Data entry sheet for agriculture mix

Estimating Cost Elements of REDD+ in Tanzania P a g e | 59
Afterwards the economics of each selected crop have to be estimated, using the following
data sheets. All known inputs, costs, yields and revenues can be entered into the model;
estimates can also be used if exact information is missing.
Table 18: Data entry sheets for agricultural land use
The tool automatically generates an NPV for each land use type (over 10, 20 and 30 years
period) separately for a maximum period of 30 years (Table 19: Economic output table and
NPV for 1 ha maize farming (US$)) and based on the selected mix (%) of the identified crops
a mixed cropping system NPV is generated (Table 20: Economic output table and NPV for
mixed cropping systems (US$) below).

Estimating Cost Elements of REDD+ in Tanzania P a g e | 60
Table 19: Economic output table and NPV for 1 ha maize farming (US$)
Table 20: Economic output table and NPV for mixed cropping systems (US$)
Having determined the 1-ha economics of each identified land use system in the project area,
the next step leads to the analysis of the opportunity costs.
Opportunity costs analysis The last remaining component of the opportunity costs analysis is the development of a land
use change matrix. This relates to the identification of the land use change patterns based on
an analysis of the drivers of deforestation. Table 21: Land use change matrix (ha) below
presents the estimated land use change matrix for a project case. The vertical column
indicates the year of the initial land cover. The change to another land use is shown on the
horizontal row (in green font). The diagonal of the table indicates unchanged land area
between two time series (in orange font). The figures in green font indicate the conversion of
natural forest at an historical point in time to different other land use types, identified as the
drivers of deforestation at the current point of time (e.g. at project start).

Estimating Cost Elements of REDD+ in Tanzania P a g e | 61
Table 21: Land use change matrix (ha)
Based on the aforementioned components that are entered into the REDD+ cost elements
tool, the users will receive an analysis of the opportunity costs. The tool is designed in a
manner that summarizes all required data input values for ABACUS in one sheet that can be
copied and pasted in ABACUS5 data entry sheets. The required data includes input values on
the project area and land use classification data, carbon stock data, land use change matrix
and the calculated NPV.
Based on this data the REDD+ cost element tool produces a GHG emissions matrix using data
from the land use change matrix and carbon stock of each land use and an opportunity cost
matrix (see table below) based on the NPVs and carbon stock data. Using these outputs the
user may construct graphs that visualize the generated outputs.
5 For the use of ABACUS, see the explanations in the manual available at:
http://www.worldagroforestry.org/sea/abacus
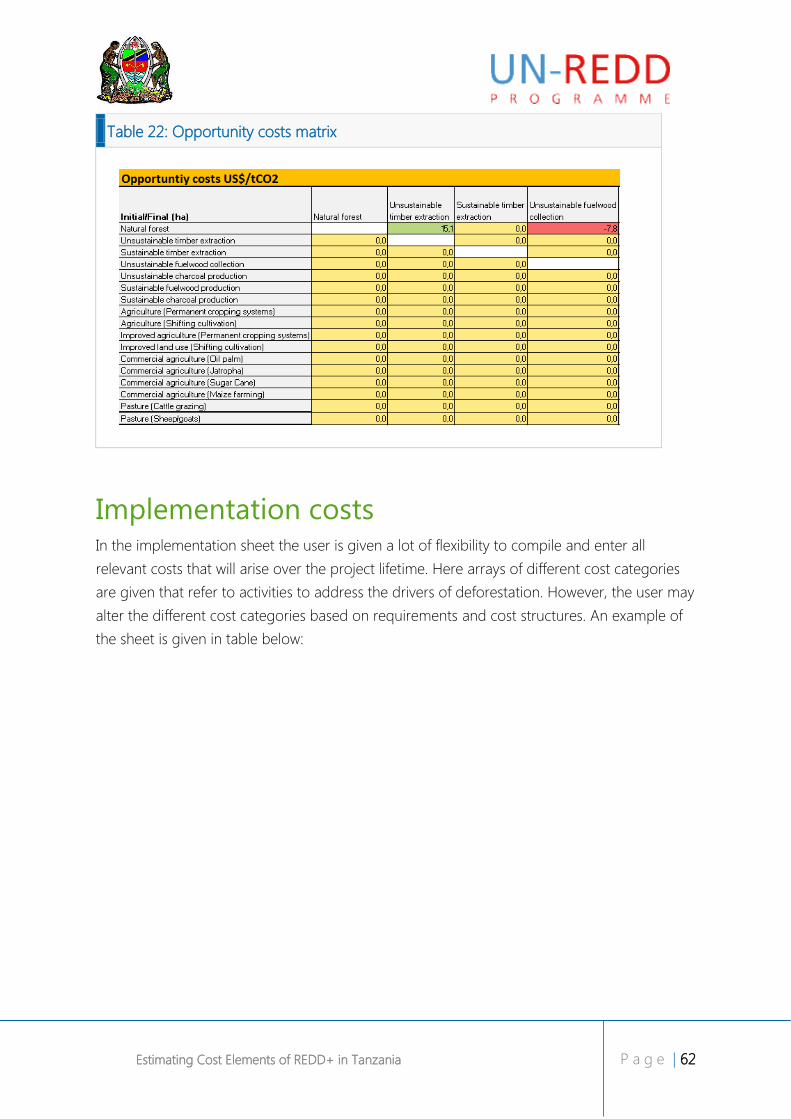
Estimating Cost Elements of REDD+ in Tanzania P a g e | 62
Table 22: Opportunity costs matrix
Implementation costs In the implementation sheet the user is given a lot of flexibility to compile and enter all
relevant costs that will arise over the project lifetime. Here arrays of different cost categories
are given that refer to activities to address the drivers of deforestation. However, the user may
alter the different cost categories based on requirements and cost structures. An example of
the sheet is given in table below:

Estimating Cost Elements of REDD+ in Tanzania P a g e | 63
Table 23: Data entry sheet for implementation costs (US$)
Transaction costs The transaction cost sheet is constructed in a similar manner to the implementation costs
sheet, which flexibly allows the user to estimate transaction costs. Initially, several key
assumptions fields are provided that can be modified as shown in the table below:

Estimating Cost Elements of REDD+ in Tanzania P a g e | 64
Table 24: Estimation of transaction cost categories
Based on this key input data, Excel generates an automatic costing of transaction costs over
the project lifetime. However, transaction cost may differ significantly among projects and
countries. Thus the formulas within the transaction costs may be changed allowing for a
higher flexibility. In addition, the user may add additional cost categories to the data sheet.
Table 25: Data entry sheet for transaction costs (US$)

Estimating Cost Elements of REDD+ in Tanzania P a g e | 65
Institutional cost Similar to the implementation and transaction cost estimates, the institutional data input sheet
allows estimating institutional cost on the national and district level. Also here the cost
categories are pre-defined, but can be changed based on country-specific conditions in the
yellow fields (see table below). For the Tanzanian case we used the budgets of the REDD-
Readiness and REDD+ implementation process, equivalent to US$ 2.1 million between 2010
and 2013 broken down to the national forest area, resulting in an US$ 0.01/ha/yr.This value
has then been up-scaled to the project area estimating the institutional costs and
complemented by the project specific budgets that assigned a portion to district level
institutional capacity building and knowledge dissemination.
However, we have used the values in our calculation tool to address the issue of institutional
costs in general. Still, the users of the tool are free to change the costs according to their
knowledge and perception.
Same for institutional costs at district level: Here in districts with strong enforcement by the
state the projects could apply the figures explained in chapter 0, while in districts with weak
enforcement, the projects themselves have to implement such activities. Thus, they should be
considered as implementation costs.
Table 26: Estimation of institutional costs categories (US$)

Estimating Cost Elements of REDD+ in Tanzania P a g e | 66
Project summary The final “project cost summary” sheet summarizes the total costs of a REDD+ project on a
project scale, and per hectare. It calculates the required price per saved tCO2, assuming that
no other revenue streams would be generated (Table 27: Projection of avoided deforestation
area and GHG emission reductions).
The user has to enter the expected GHG emissions reductions or carbon benefits and the total
area of avoided deforestation over the project lifetime in order calculate the total costs for
each avoided tCO2 emission.
Table 27: Projection of avoided deforestation area and GHG emission reductions
Table 28: Project cost summary (US$)
While this tool is constructed to estimate the REDD+ cost element, the next step would be to
develop marginal abatement costs curves. This would require estimates of potential revenues
from the implementation of a REDD+ project and compare it to total costs.

Estimating Cost Elements of REDD+ in Tanzania P a g e | 67
Annex 2 – Jane Goodall Kigoma Project
Summary Report
Modeling approach and key assumptions In the framework of the assignment Estimating Cost elements of REDD+ in Tanzania funded
by the UN-REDD Programme, a methodology was developed to estimate opportunity costs,
implementation costs, institutional costs and transaction costs of REDD+ projects, specified to
Tanzanian circumstances. The Excel-based model is designed in a manner allowing to use the
Excel data as input data for the REDD ABACUS software (Beta Version: 1.1.1 beta1 (13 Dec
20116)) that automatically generates opportunity cost curves.
The Excel-based model is designed in an iterative manner and requires the user to initially
identify the persistent land use types at a historical point in time and at the project start and
undertake a land use classification and assessment of the carbon stock data for the identified
land use types.
Following this step, 1-ha based land use economics are calculated to generate a NPV value
for all identified land use types. In the opportunity cost analysis stage a land use change
matrix has to be developed that reflect the historical land use change patterns and to which
land use types forest have been converted. If there is no historical conversion of forest to
other land uses opportunity costs do not appear and no opportunity cost curves can be
generated.
Main outputs of processing the 1-ha economic models are net present values as explained in
the main report and land use related carbon stock changes. Based on this output all required
input data for REDD ABACUS is generated and opportunity cost curves can be processed with
ABACUS.
In the subsequent phase other REDD+ cost elements, namely institutional, implementation
and transaction costs are estimated. While the transaction costs and implementation costs are
derived from the project documents, institutional costs are calculated from a national average.
6 http://www.worldagroforestry.org/sea/abacus

Estimating Cost Elements of REDD+ in Tanzania P a g e | 68
The model allows estimating all four REDD+ cost elements. Hence, indicating REDD+ costs for
the envisaged emission savings by the project.
Figure 17: Methodology to estimate REDD+ cost elements
Project key area and carbon stock
assumptions For the Jane Goodall Kigoma project model we used input data from the project documents
provided to the consultants and a project specific workshop in Dar es Salaam on the 14th
February 2012.
With regards to the drivers of deforestation, we used unsustainable timber extraction,
unsustainable fuelwood collection, shifting cultivation and cattle grazing as the most
important driver as shown in Table 29: Project area assumptions.
For the Jane Goodall Kigoma project the following assumptions were made based on the
analysis of the project documents and inputs from Jane Goodall project staff.

Estimating Cost Elements of REDD+ in Tanzania P a g e | 69
Table 29: Project area assumptions
Land use types of the project area (ha):
Historical land use on
project area (ha) At project start (ha)
Natural forest 85,200 71,037
Unsustainable timber extraction 0 3,000
Unsustainable fuelwood collection 0 4,000
Agriculture (Shifting cultivation) 0 5,163
Pasture (cattle) 0 2,000
Total 85,200 85,200
Carbon stock data of land use types
For the carbon stock data the long-term average carbon stocks shall be used. Based on
provided data and our own estimates, the following carbon information was generated and
used in our further calculations:
Table 30: Carbon stock assumptions
Land use types Carbon stocks (ABG, BGB)
(tCO2/ha) Carbon stocks (ABG,
BGB) (tC/ha)
Natural forest 80.6 22
Unsustainable timber extraction 30.2 8.2
Unsustainable fuelwood collection 30.2 8.2
Agriculture (Shifting cultivation) 15.3 4.2
Pasture (cattle) 22.2 6.1
Note: The long-term average is based on the average carbon stock as identified in the Ground Forest
Carbon assessment of the Masito Ugalla Ecosystem Pilot area (Zahabu, 2011) and Fisher et al, 2011.

Estimating Cost Elements of REDD+ in Tanzania P a g e | 70
1-ha models for existing land use types For the establishment of opportunity costs curves each identified land use type requires the
establishment of a Net Present Value (NPV), an economic performance indicator that shows
the profitability of a land use in US$/ha. For the NPV calculation we used a discount rate of
10 % and discounted the annual cost and revenues over a period of 30 years, equivalent to
the project lifetime.
Figure 18 present the NPVs for the identified land uses. All key assumptions made in these 1-
ha models are detailed in Annex 1.
Figure 18: NPVs for the Jane Goodall Kigoma project
Land use change matrix The land use change matrix is a key input for the opportunity cost analysis spreadsheet which
is also used as an input table for ABACUS. It provides information about the land use change
dynamics in the project area. In addition to providing data needed for the opportunity cost
analysis, the land use change matrix can be used to assess the driving forces of deforestation
and land use trajectories over time. The land use change matrix is normally based on the
historical remote sensing analysis that compares land uses at two different points in time, e.g.
2001 and 2011.
924
1,687
533
2,806
1,348
0500
1,0001,5002,0002,5003,000
Natural forest Unsustainabletimber
extraction
Unsustainablefuelwoodcollection
Agriculture(Shifting
cultivation)
Pasture(Cattle
grazing)
NPV (at 10 % discount rate) 30 years US$/ha

Estimating Cost Elements of REDD+ in Tanzania P a g e | 71
Table 31: Land use change matrix for project (2001-2011) (ha) presents the estimated land
use change matrix for the project case. The vertical column indicates the year of the initial
land cover. The change to another land use is shown on the horizontal row. The diagonal of
the table indicates unchanged land area units between two time series (in orange font). The
figures in green font indicate the conversion of natural forest at an historical point in time to
different other land use types, identified as the drivers of deforestation at the current point of
time (e.g. at project start).
The total value at the end of the first row is the area in natural forest at the historical point of
time (85,200 ha). The total value at the bottom of the second column is the total area in
natural forest at project start (71,037 ha). Therefore the study area lost 14,163 ha of forest
between the two points of time.
Table 31: Land use change matrix for project (2001-2011) (ha)
Initial (change
from initial land
cover) / Final
(change to final
stage/latest land
cover
classification) (ha)
Natural forest
Unsustainable timber extraction
Unsustainable fuel wood collection)
Agriculture (Shifting
cultivation)
Pasture (Cattle
grazing)
Total
Natural forest 71,037 3,000 4,000 5,163 2,000 85,200
Unsustainable timber extraction)
0
0
Unsustainable fuel wood collection
0
0
Agriculture (Shifting cultivation)
0
0
Pasture (Cattle grazing)
0
0
Total 71,037 3,000 4,000 5,163 2,000 85,200

Estimating Cost Elements of REDD+ in Tanzania P a g e | 72
Opportunity costs The opportunity costs were calculated based on the following carbon stock losses (tCO2/ha)
from the conversion of natural forest to the respective land use types.
Figure 19: GHG emissions (tCO2/ha) from conversion of natural forest to other
land use types in the Jane Goodall Kigoma project area
Using the NPV – and the respective carbon stock data, for each land use – the following
opportunity costs (US$/tCO2) were calculated by dividing the opportunity cost NPV (Figure
18) for the land use change by the related carbon stock change (Table 30) per ha.
In the Jane Goodall Kigoma project case the opportunity costs would range between
US$ 28.8/tCO2 for agriculture (shifting cultivation) and US$ -7.8/tCO2 for unsustainable fuel
wood collection. Thus, avoiding land use conversion from natural forest to fuel wood
collection would result in net GHG benefits at negative costs because the NPV for this land
use is lower than that of natural forests. For shifting agriculture, the NPV is higher than that of
natural forest. Thus, opportunity costs are positive. The costs indicate which monetary value
will forego the user when not converting the forest.

Estimating Cost Elements of REDD+ in Tanzania P a g e | 73
Figure 20: Opportunity costs (US$/tCO2) from conversion of natural forest to other
land use types in the Jane Goodall Kigoma project
The described data – i.e. NPV and land use change matrix based carbon stock changes –
constitute the key input data for the ABACUS software to generate the project’s opportunity
cost curves.
An opportunity cost curve compares the quantity of potential emission reductions with their
opportunity costs. The vertical y-axis represents the opportunity cost of the emissions
reduction option (in US$ per tCO2), while the horizontal axis depicts the corresponding
quantity of reduction (in million tCO2) at the respective price.
For the described land use change scenario (land use matrix, Table 21: Land use change
matrix (ha)) emissions of about 0.81 million tCO2 would occur over a period of 10 years.

Estimating Cost Elements of REDD+ in Tanzania P a g e | 74
Figure 21: Opportunity cost curve Jane Goodall Kigoma project
Note: The GHG emissions in the cost curve occurred over a period of the last 10 years, as based on historical land
use change indicated in the land use change matrix.
Building the REDD+ project case The opportunity cost curves are based on historical data and land use dynamics. In order to
estimate the complete REDD+ project cost elements, implementation costs, transaction costs
and institutional costs need to be estimated. In our calculation we assume that opportunity
costs will be compensated by the implementation activities, thus opportunity costs are not
added up to total costs. For detailed explanation, refer to the main report.
Implementation costs are directly associated with actions to reduce deforestation and forest
degradation. Examples include the costs of guarding a forest to prevent unsustainable timber
extraction, replanting trees in degraded or logged forests, or intensifying agriculture or cattle
ranching. Implementation may also comprise the training and capacity-building activities at
the project level that are necessary to make the REDD+ programs happen.
For the implementation and transaction costs we used the annual project budget of the Jane
Goodall Kigoma project and assigned the respective cost the implementation and transaction
cost categories.

Estimating Cost Elements of REDD+ in Tanzania P a g e | 75
Transactions costs are incurred throughout the process: certifying the project according to a
carbon standard, transaction negotiation, monitoring, reporting, and verifying GHG emission
reductions. Transaction costs are incurred by the implementers of a REDD+ program and
third parties such as verifiers, certifiers, and lawyers.
Institutional costs are related to public expenditures to build institutions and realize REDD+ at
national scale. That includes governance structures, clarifications on land tenure issues,
capacity building and extension services; policy formulation and law enforcement. The
estimation of the institutional costs is based on a country wide average in US$/ha based on
the total forested area in Tanzania and the budgets to build a national REDD+ framework.
In the following section, we initially provide estimates on the projected GHG benefits due to
REDD+ activities and subsequently provide cost estimates on implementation costs,
transaction costs and institutional costs.
REDD+ related GHG benefits projections
Based on the project documents we estimated that the project will annually prevent 667 ha
equivalent to 55,000 tCO2/yr of natural forest of being converted to other land uses, as shown
in the figure below.

Estimating Cost Elements of REDD+ in Tanzania P a g e | 76
Figure 22: Avoided deforestation area and GHG benefits in project scenario
Implementation, Institutional and Transaction costs estimates
When implementing a REDD+ project, significant investments are required in order to cover
the costs associated with actions to reduce deforestation, and hence emissions. All of these
and similar measures incur up-front investment and perhaps recurring costs for public and/or
the private sectors, which need to be adequately assessed and financed.
Based on the budget for the “Masito Ugalla Ecosystem pilot area in support of Tanzania’s
national REDD+ strategy” cost estimates were provided for the initial 3 years of the project
lifetime. Based on these estimates we extrapolated the costs of the project for the subsequent
30 years.
In total, implementation costs are estimated at an annual average of US$ 0.67 million for the
project area (US$ 20.2 million over 30 years)7; transaction cost are estimated at an average of
US$ 80,500 annually (US$ 2.4 million over 30 years); and institutional costs will amount at
US$ 5,300 (US$ 159,000 over 30 years). For a detailed cost breakdown, see the Excel-based
tool to estimate REDD+ cost elements.
7 Not taking into account inflation.
0
10,000
20,000
30,000
40,000
50,000
60,000
0
100
200
300
400
500
600
700
800
1 2 3 4 5 6 7 8 9 101112131415161718192021222324252627282930
Annual net area avoided from conversion (ha) Annual net emission reduction (tCO2)
ha tCO2
Years

Estimating Cost Elements of REDD+ in Tanzania P a g e | 77
Figure 23: Annual implementation, transaction and institutional cost estimates
(US$)
REDD+ costs per saved tCO2 In the Jane Goodall Kigoma project a total a price of US$ 13.8 per conserved tCO2 would be
required in order to cover, implementation US$ 12.2/tCO2), transaction (US$ 1.5/tCO2) and
institutional costs (US$ 0.1/tCO2).

Estimating Cost Elements of REDD+ in Tanzania P a g e | 78
Figure 24: REDD+ costs per saved tCO2 (US$)
On the entire project scale and in order to avoid 1.65 million tCO2 emissions, the costs would
add up to about US$ 22.7 million over a project lifetime of 30 years.
Figure 25: Total project costs Jane Goodall Kigoma (US$)

Estimating Cost Elements of REDD+ in Tanzania P a g e | 79
Key assumption of 1-ha based land use
economics
Natural forest
For the natural forest we assume that forest is used extensively for the collection of fuel wood
and non-timber forest products in a sustainable manner.
Table 32: Natural forest assumptions (1 ha)
Annual costs Quantity Unit Price
per Unit Quantity Unit
Annual labor costs fuelwood collection 0 days/ha/yr US$
Annual labor costs NTFP collection 30 days/ha/yr 3 90 US$
Annual cost small-scale timber extraction
Harvesting 0 US$/m³ 0 US$
Timber transportation 0 US$/m³ 0 US$
Milling 0 US$/m³ 0 US$
Total costs 100 US$
Yields and Prices Quantity Unit Price
per Unit Quantity Unit
Annual fuel wood collection m³ US$
Annual NTFP collection 15 kg/ha 12.5 187.5 US$
Annual small-holder timber extraction revenues
Annual timber extraction volume 0 m³/ha/yr
Waste 0%
Quantity sold 0,0 m³/ha/yr
Price 0 US$/m³ 0 US$

Estimating Cost Elements of REDD+ in Tanzania P a g e | 80
Total revenues 187.5 US$
Source: Authors estimates
Unsustainable timber extraction
In this scenario we assume that unsustainable timber extraction takes place over a period of 7
years. The land is subsequently converted to shifting cultivation for the remaining 23 years.
Table 33: Unsustainable timber extraction assumptions (1 ha)
Key parameters Value
Years of timber extraction until land use change 7
Please select
Alternative land use after clearance
Conventional
agriculture
(Shifting
cultivation)
Investment costs in year 0 Quantity Unit
Price
per
Unit
Quantity Unit
Land purchase 1 ha 0 US$
Land lease 1 ha 0 US$
Road network investments 1 m/ha 0 0 US$
Harvesting 0 US$/m³ 0 US$
Timber transportation 7 US$/m³ 6 US$
Milling 0 US$/m³ 0 US$
Stumpage fee 0 US$/m³ 0 US$
Labour days/ha/yr 6 US$/ha 3 18 US$

Estimating Cost Elements of REDD+ in Tanzania P a g e | 81
Total costs 24 US$
Annual costs from year 1 onwards Quantity Unit
Price
per
Unit
Quantity Unit
Land lease 1 ha 0 0 US$
Annual road network investments 1 m/ha 0 0 US$
Harvesting 0 US$/m³ 0 US$
Timber transportation 0 US$/m³ 6 US$
Milling 0 US$/m³ 0 US$
Stumpage fee 0 US$/m³ 0 US$
Labour days/ha/yr 6 US$//ha 3 18 US$
Total costs 24 US$
Yields and Prices Quantity Unit
Annual timber extraction volume 0,8 m³/ha/yr
Waste 0%
Quantity sold 0,8 m³/ha/yr
Price 112,5 US$/m³
Total revenues 95 US$/ha

Estimating Cost Elements of REDD+ in Tanzania P a g e | 82
Unsustainable fuel wood collection
In this scenario we assume that on one ha of forest, fuel wood extraction takes place in an
unsustainable manner.
Table 34: Unsustainable fuel wood collection assumptions (1 ha)
Key parameters Value Unit Source
Years of fuel wood collection on a
ha until clearance 30 Years
Authors
estimates
Alternative land use after
clearance
No use after
clearance
Average aboveground biomass in
year 0 36,8 tdm/ha
WWF, Malimbwi,
Zahabu 2007
Annual average biomass
increment 2,4 tdm/ha/yr
WWF, Malimbwi,
Zahabu 2007
Total available fuelwood over
collection period until clearance 108,8 tdm/ha
Total annual commercial available
fuelwood 3,6 tdm/ha/yr
Inputs for firewood
collection Quantity Unit
Price per
unit Costs Unit Source:
Labour input/yr 5,44 days 3 16,32 US$
Estimates
from
Masito
Ugalla
Kigoma
Total cost fuel wood collection 16,32 US$
Income Quantity Unit Price per
unit
Reve
nues Unit Source:
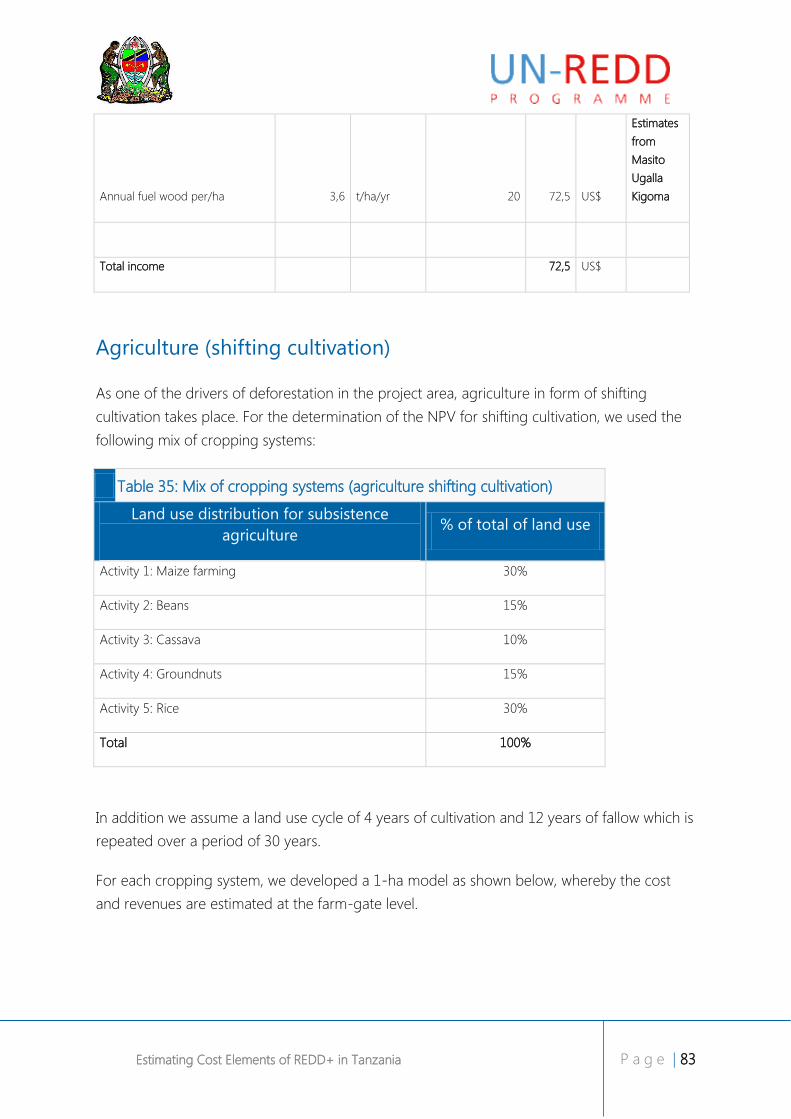
Estimating Cost Elements of REDD+ in Tanzania P a g e | 83
Annual fuel wood per/ha 3,6 t/ha/yr 20 72,5 US$
Estimates
from
Masito
Ugalla
Kigoma
Total income 72,5 US$
Agriculture (shifting cultivation)
As one of the drivers of deforestation in the project area, agriculture in form of shifting
cultivation takes place. For the determination of the NPV for shifting cultivation, we used the
following mix of cropping systems:
Table 35: Mix of cropping systems (agriculture shifting cultivation)
Land use distribution for subsistence
agriculture % of total of land use
Activity 1: Maize farming 30%
Activity 2: Beans 15%
Activity 3: Cassava 10%
Activity 4: Groundnuts 15%
Activity 5: Rice 30%
Total 100%
In addition we assume a land use cycle of 4 years of cultivation and 12 years of fallow which is
repeated over a period of 30 years.
For each cropping system, we developed a 1-ha model as shown below, whereby the cost
and revenues are estimated at the farm-gate level.

Estimating Cost Elements of REDD+ in Tanzania P a g e | 84
Table 36: Maize production system key assumptions (1-ha)
Inputs at establishment
(year 0) Quantity Unit
Price
per
unit
Costs Unit Source:
Seed 10 kg 2,5 25 US$
Estimates from
project staff
Fertilizer 0 kg 0 0 US$
Herbicides 0 liters 0 0 US$
Insecticides 0 liters 0 0 US$
Tools 0 Units 0 0 US$
Machinery 0 days 0 0 US$
Labour input/yr/ha 76 days 3 228 US$
Total cost establishment 253,0
Inputs at management
(from year 1 onwards) Quantity Unit
Price
per
unit
Costs Unit
Seed 10 kg 2,5 25 US$
Fertilizer 0 kg 0 0 US$
Herbicides 0 liters 0 0 US$
Insecticides 0 liter 0 0 US$
Tools 0 Units 0 0 US$
Machinery 0 days 0 0 US$
Labour input/yr 46 days 3 138 US$
Total cost management 163 US$
Estimates from
project staff

Estimating Cost Elements of REDD+ in Tanzania P a g e | 85
Income Quantity Unit
Price
per
unit
Reve
nues Unit Source:
Yields /ha/yr 2500 kg/ha/yr 0,18 450 US$
Estimates from
project staff
Yield start after establishment: 1 Year
Total income 450 US$
Table 37: Beans production system key assumptions (1-ha)
Inputs at establishment
(year 0) Quantity Unit
Price
per
unit
Costs Unit Source
Seed 0 kg 0 0 US$
Fertilizer 0 kg 0 0 US$
Herbicides 0 liters 0 0 US$
Insecticides 0 liters 0 0 US$
Tools (hoes) 0,2 Units 3,1 0,62 US$
Machinery 0 days 0 0 US$
Labour input/yr/ha 180 days 3 540 US$
Total cost establishment 541
Estimates from
project staff
Inputs at management
(from year 1 onwards) Quantity Unit
Price
per
unit
Costs Unit Source:
Seed 0 kg 0 0 US$
Fertilizer 0 kg 0 0 US$
Herbicides 0 liters 0 0 US$
Insecticides 0 liter 0 0 US$

Estimating Cost Elements of REDD+ in Tanzania P a g e | 86
Tools 0,2 Units 3,1 0,62 US$
Machinery 0 days 0 0 US$
Labour input/yr 180 days 3 540 US$
Total cost management 541 US$
Estimates from
project staff
Income Quantity Unit
Price
per
unit
Reven
ues Unit Source
Yields /ha/yr 1200
kg/ha/y
r 0,875 1050 US$
Estimates from
project staff
Yield start after establishment 1 year
Total income 1050 US$
Table 38: Cassava production system key assumptions (1-ha)
Inputs at establishment
(year 0) Quantity Unit
Price
per
unit
Costs Unit Source
Seed 0 kg 0 0 US$
Fertilizer 0 kg 0 0 US$
Herbicides 0 liters 0 0 US$
Insecticides 0 liters 0 0 US$
Tools 0 Units 0 0 US$
Machinery 0 days 0 0 US$
Labour input/yr/ha 154 days 3 462 US$

Estimating Cost Elements of REDD+ in Tanzania P a g e | 87
Total cost establishment 462
Agriculture and
Forestry: The
Masito-Ugalla
Ecosystem (MUE),
2008
Inputs at management
(from year 1 onwards) Quantity Unit
Price
per
unit
Costs Unit Source
Seed 0 kg 0 0 US$
Fertilizer 0 kg 0 0 US$
Herbicides 0 liters 0 0 US$
Insecticides 0 liter 0 0 US$
Tools 0 Units 0 0 US$
Machinery 0 days 0 0 US$
Labour input/yr 20 days 3 60 US$
Total cost management 60 US$
Agriculture and
Forestry: The
Masito-Ugalla
Ecosystem (MUE),
2008
Income Quantity Unit
Price
per
unit
Reven
ues Unit Source
Yields /ha/yr 1 acre 375 375 US$
Estimates from
project staff
Yield start after establishment: 1 Years
Estimates from
project staff
Total income 375 US$

Estimating Cost Elements of REDD+ in Tanzania P a g e | 88
Table 39: Groundnuts production system key assumptions (1-ha)
Inputs at establishment
(year 0) Quantity Unit
Price
per
unit
Costs Unit Source
Seed 0 kg 0 0 US$
Fertilizer 0 kg 0 0 US$
Herbicides 0 liters 0 0 US$
Insecticides 0 liters 0 0 US$
Tools 0 Units 0 0 US$
Machinery 0 days 0 0 US$
Labour input/yr/ha 48 days 3 144 US$
Total cost establishment 144
Agriculture and
Forestry: The
Masito-Ugalla
Ecosystem (MUE),
2008
Inputs at management
(from year 1 onwards) Quantity Unit
Price
per
unit
Costs Unit Source
Seed 0 kg 0 0 US$
Fertilizer 0 kg 0 0 US$
Herbicides 0 liters 0 0 US$
Insecticides 0 liter 0 0 US$
Tools 0 Units 0 0 US$
Machinery 0 days 0 0 US$
Labour input/yr 48 days 3 144 US$
Total cost management 144 US$
Estimates from
project staff

Estimating Cost Elements of REDD+ in Tanzania P a g e | 89
Income Quantity Unit
Price
per
unit
Reven
ues Unit Source
Yields /ha/yr 250 kg/ha/yr 2,5 625 US$
Estimates from
project staff
Yield start after establishment: 1 Year
Total income 625 US$
Table 40: Rice production system key assumptions (1-ha)
Inputs at establishment
(year 0) Quantity Unit
Price
per
unit
Costs Unit Source
Seedling 400 plants 0,125 50 US$
Fertilizer 0 kg 0 0 US$
Herbicides 0 liters 0 0 US$
Insecticides 0 liters 0 0 US$
Tools 0 XXX 0 0 US$
Machinery 0 days 0 0 US$
Labour input/yr/ha 90 days 2,5 225 US$
Total cost establishment 275
Estimates from
project staff
Inputs at management
(from year 1 onwards) Quantity Unit
Price
per
unit
Costs Unit Source
Seedlings 0 kg 0 0 US$
Fertilizer 0 kg 0 0 US$

Estimating Cost Elements of REDD+ in Tanzania P a g e | 90
Herbicides 0 liters 0 0 US$
Insecticides 0 liter 0 0 US$
Tools 0 XXX 0 0 US$
Machinery 0 days 0 0 US$
Labour input/yr 110 days 2,5 275 US$
Total cost management 275 US$
Estimates from
project staff
Income Quantity Unit
Price
per
unit
Reven
ues Unit Source
Yields /ha/yr 3000 kg/ha/yr 0,625 1875 US$
Estimates from
project staff
Yield start after establishment: 1 Year
Total income 1875 US$
Pasture (Cattle grazing)
In this scenario, we assume that cattle grazing is one driver deforestation on the project area.
Thereby we make the following assumptions:
Table 41: Pasture (cattle) key assumptions (1-ha)
CATTLE Quantity Units Sourc
e
Average livestock/ha 2 Units/ha
Authors
estimates
Annual average milk production
(liters/animal) 2555
liters/cow/y
r
Annual average meat production/animal 18 kg/yr
Ratio of dairy cattle 70% %

Estimating Cost Elements of REDD+ in Tanzania P a g e | 91
Ratio of meat production cattle 30% %
Annual organic fertiliser production/use 0 kg/ha/yr
Inputs at establishment
(year 0) Quantity Unit
Price
per
unit
Costs Unit Source
Purchase livestock/ha (Cattle) 2 Animals/ha 0 0 US$
Shed, corral, equipment 0 US$/ha/yr 0 US$
Land preparation 20
days/labou
r 3 60 US$
Pasture seeding 0 US$/ha/yr 0 US$
Fences 0 Meters 0 0 US$
Land rental 0 US$/ha/yr 0
Labour input/yr 100 days 3 300 US$
Total cost establishment 360
Inputs at management
(from year 1 onwards) Quantity Unit
Price
per
unit
Costs Unit
Supplements 0 kg 0 0 US$
Animal health 0 US$/ha/yr 0 US$
Maintenance 0 US$/ha/yr 0 US$
Land rental 0 US$/ha/yr 0 US$
Labour input/yr 100 days 3 300 US$
Total cost management 300

Estimating Cost Elements of REDD+ in Tanzania P a g e | 92
Income seeling/Value of self-
consumption Quantity Unit
Price
per
unit
Reven
ue Unit
Milk/ha/yr 3577 liters/year 0,125 447,125 US$
Animal value when sold 0,5
Annual
animal
production
/ha 1,6875 0,84375 US$
Value of organic fertilizer 0 kg/ha/yr 0 0 US$
Total income 448

Estimating Cost Elements of REDD+ in Tanzania P a g e | 93
Annex 3 – Mpingo Conservation and
Development Initiative
Summary Report
Modeling approach and key assumptions In the framework of the assignment Estimating Cost elements of REDD+ in Tanzania funded
by the UN-REDD Programme, the consultants team developed a methodology to estimate
opportunity costs, implementation costs, institutional costs and transaction costs of REDD+
projects, specified to Tanzanian circumstances. The Excel-based model is designed in a
manner allowing to use the Excel data as input data for the REDD ABACUS software (Beta
Version: 1.1.1 beta1 (13 Dec 20118)) that automatically generates opportunity cost curves.
The Excel-based model is designed in an iterative manner and requires the user to initially
identify the persistent land use types at a historical point in time and at the project start and
undertake a land use classification and assessment of the carbon stock data for the identified
land use types.
Afterwards 1-ha based land use economics are calculated to generate a NPV value for all
identified land use types. In the opportunity cost analysis stage a land use change matrix has
to be developed that reflect the historical land use change patterns and to which land use
types forest have been converted. If there is no historical conversion of forest to other land
uses opportunity costs do not appear and no opportunity cost curves can be generated.
Main outputs of processing the 1-ha economic models are Net Present Values (NPVs) as
explained in the main report and land use related carbon stock changes. Based on this output
all required input data for REDD ABACUS is generated and opportunity cost curves can be
processed with ABACUS.
In the subsequent phase other REDD+ cost elements, namely institutional, implementation
and transaction costs are estimated. While the transaction costs and implementation costs are
derived from the project documents, institutional costs are calculated from a national average.
8 http://www.worldagroforestry.org/sea/abacus

Estimating Cost Elements of REDD+ in Tanzania P a g e | 94
The model allows estimating all four REDD+ cost elements. Hence, indicating REDD+ costs for
the envisaged GHG emission savings/GHG removals by the project.
Figure 26: Methodology to estimate REDD+ cost elements
Project key area and carbon stock
assumptions The Mpingo Conservation and Development Initiative is a project without historical
deforestation pressures and is seeking to convert natural forest use (under regular fire) to
sustainable forest production certified according to the FSC and to the VCS as an improved
forest management project (IFM) that enhances carbon stocks .
For the project model we used input data from the project documents provided to the
consultants and a project specific workshop in Dar es Salaam on 13 February 2012.
During the discussion with project staff it appeared that historically there has not been
deforestation due to human-induced activities, thus no opportunity costs had arisen
historically. The project team mentioned that the natural forest has been regularly under fire,
but a reference emissions level has not been determined and the area affected by fire has not
been determined, yet.
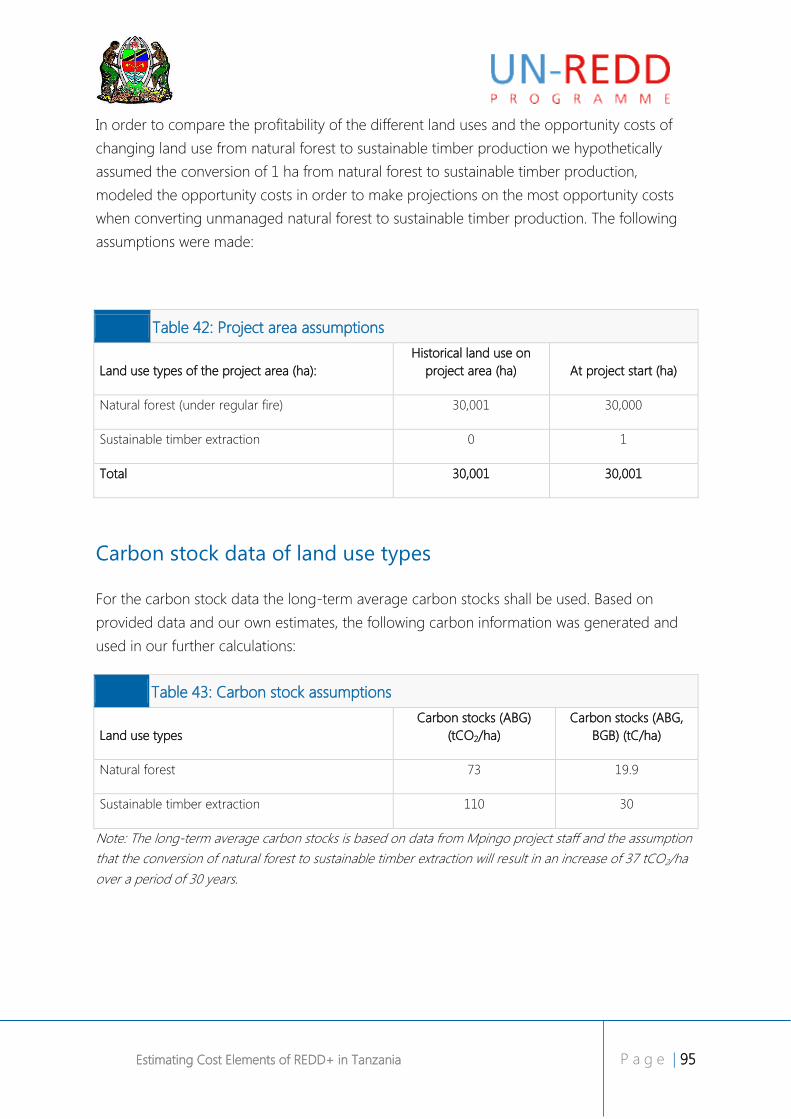
Estimating Cost Elements of REDD+ in Tanzania P a g e | 95
In order to compare the profitability of the different land uses and the opportunity costs of
changing land use from natural forest to sustainable timber production we hypothetically
assumed the conversion of 1 ha from natural forest to sustainable timber production,
modeled the opportunity costs in order to make projections on the most opportunity costs
when converting unmanaged natural forest to sustainable timber production. The following
assumptions were made:
Table 42: Project area assumptions
Land use types of the project area (ha):
Historical land use on
project area (ha) At project start (ha)
Natural forest (under regular fire) 30,001 30,000
Sustainable timber extraction 0 1
Total 30,001 30,001
Carbon stock data of land use types
For the carbon stock data the long-term average carbon stocks shall be used. Based on
provided data and our own estimates, the following carbon information was generated and
used in our further calculations:
Table 43: Carbon stock assumptions
Land use types
Carbon stocks (ABG)
(tCO2/ha)
Carbon stocks (ABG,
BGB) (tC/ha)
Natural forest 73 19.9
Sustainable timber extraction 110 30
Note: The long-term average carbon stocks is based on data from Mpingo project staff and the assumption
that the conversion of natural forest to sustainable timber extraction will result in an increase of 37 tCO2/ha
over a period of 30 years.

Estimating Cost Elements of REDD+ in Tanzania P a g e | 96
1-ha models for existing land use types For the establishment of opportunity costs each identified land use type requires the
establishment of a Net Present Value (NPV), an economic performance indicator that shows
the profitability of a land use in US$/ha. For the NPV calculation we used a discount rate of
10 % and discounted the annual cost and revenues over a period of 30 years, equivalent to
the project lifetime.
The figure below presents the NPVs for the identified land uses. According to the Mpingo
project staff there has not been a forest use, due to its distance to populated areas, thus it
was recommended to set the NPV of natural forest at US$ 0/ha. It the project scenario the
management of 1 ha sustainable timber production would result in a NPV of US$ 9/ha over a
period of 30 years (discount rate 10 %). All key assumptions made in these 1-ha models are
detailed in Annex 1.
Figure 27: NPV for the Mpingo Conservation and Development Initiative
0
9
0
2
4
6
8
10
Natural forest (underregular fire)
Unsustainable logging
Net present values (at 10 % discount rate) 30 years US$/ha

Estimating Cost Elements of REDD+ in Tanzania P a g e | 97
Opportunity costs The opportunity cost were calculated based on carbon stock changes (tCO2/ha) from the
conversion of natural forest (under regular fire) to sustainable timber production which would
result in a net gain of 37 tCO2/ha over 30 years.
Using the NPV (and the respective carbon stock data, for each land use, we calculated
negative opportunity costs of US$ -0.2/tCO2. In other words, each additional tCO2 that will be
sequestered in sustainable timber extraction land use will result in a net gain of US$ 0.2. In
total, this would lead to an increase the NPV from US$ 0/ha (natural forest under regular fire)
to US$ 9/ha (sustainable timber extraction).
Building the REDD+ SFM project case The previous sections identified the potential carbon stock changes and NPVs for the natural
forest and sustainable forest management on 1 ha. In the project case, the entire project area
will be subject to sustainable management, thus comprising, implementation costs,
transaction costs and institutional costs. For detailed explanation, refer to the main report.
Implementation costs are directly associated with actions to reduce deforestation and forest
degradation. Examples include the costs of guarding a forest to prevent unsustainable timber
extraction, replanting trees in degraded or logged forests, or intensifying agriculture or cattle
ranching. Implementation may also comprise the training and capacity-building activities at
the project level that are necessary to make the REDD+ programs happen.
For the implementation and transaction costs we used the annual project budget of the
Mpingo Conservation and Carbon project documents , also taking into account the funding
provided by the Royal Norwegian Embassy between 2009 and 2013 (US$ 1.9 million).
Transactions costs are incurred throughout the process: certifying the project according to a
carbon standard, transaction negotiation, monitoring, reporting, and verifying GHG emission
reductions. Transaction costs are incurred by the implementers of a REDD+ program and
third parties such as verifiers, certifiers, and lawyers.
Institutional costs are related to public expenditures to build institutions and realize REDD+ at
national scale. That includes governance structures, clarifications on land tenure issues,
capacity building and extension services; policy formulation and law enforcement. The
estimation of the institutional costs is based on a country wide average in US$/ha based on
the total forested area in Tanzania and the budgets to build a national REDD+ framework.

Estimating Cost Elements of REDD+ in Tanzania P a g e | 98
In the following, we initially provide estimates on the projected GHG benefits due to REDD+
activities and subsequently provide cost estimates on implementation costs, transaction costs
and institutional costs.
REDD+ related GHG benefits projections
Based on the project documents we estimated that the project will annually enhance carbon
stocks on the 30,000 ha area by about 37,000 tCO2/yr, equivalent to 1.23 tCO2/ha/yr9.
Implementation, Institutional and Transaction costs estimates
When implementing a REDD+ project, significant investments are required in order to cover
the costs associated with actions develop the project and establish the capacity to implement
the project. All of these and similar measures incur up-front investment and perhaps recurring
costs for public and/or the private sectors, which need to be adequately assessed and
financed.
Based on the budget for the submitted to the Norwegian Royal Embassy and further future
cost projection by the project staff, we estimated implementation costs at an annual average
of US$ 0.12 million for the project area (US$ 3.7 million over 30 years)10
; transaction cost are
estimated at an average of US$ 56,000 annually (US$ 1.69 million over 30 years); and
institutional costs will amount at US$ 1,000 (US$ 30,000 over 30 years).
9 Assumption is made that carbon stocks will change from 73 tCO2/ha in natural forest stage and 110 tCO2/ha in
the sustainable forest management stage, over a period of 30 years.
10 Not taking into account inflation.

Estimating Cost Elements of REDD+ in Tanzania P a g e | 99
Figure 28: Annual implementation, transaction and institutional cost estimates
(US$)
Note: Implementation cost: For the first three years we used the budgets as submitted to the Royal Norwegian
Embassy. Subsequently we used estimates from the Mpingo project staff.
REDD+ SFM costs per saved tCO2 In this section we assume that no opportunity costs will arise due net benefits of converting
unmanaged natural forest to sustainable timber management. With regards to the
implementation, transaction and institutional costs, we sum up all these cost elements that will
appear over the project lifetime and divide these by the expected GHG removals due to SFM
project activities. The potential revenues apart from carbon are not included in the calculation.
A total price of US$ 4.9 per removed tCO2 would be required in order to cover the
implementation (US$ 3.3/tCO2), transaction (US$ 1.5/tCO2) and institutional costs
(US$ 0.03/tCO2).
0
100,000
200,000
300,000
400,000
500,000
600,000
1 3 5 7 9 11 13 15 17 19 21 23 25 27 29
Total project implementation costs Total transaction costs Total institutional costs
US$
Years

Estimating Cost Elements of REDD+ in Tanzania P a g e | 100
Figure 29: SFM costs per tCO2 removal (US$)
On the entire project scale the enhancement of 1.1 million tCO2, would add up to about
US$ 5.4 million over a project lifetime of 30 years.
Figure 30: Total project costs Mpingo Conservation and Development Initiative
(US$)
3.3
1.5
0.03
0
1
2
3
4
5
6
Costs per saved tCO2
Institutional costs
Transaction costs
Project implementation costs
US$/tCO2
3,712,123
1,688,618
31,500
0
1,000,000
2,000,000
3,000,000
4,000,000
5,000,000
6,000,000
Total project costs
Institutional costs
Transaction costs
Project implementationcosts
US$
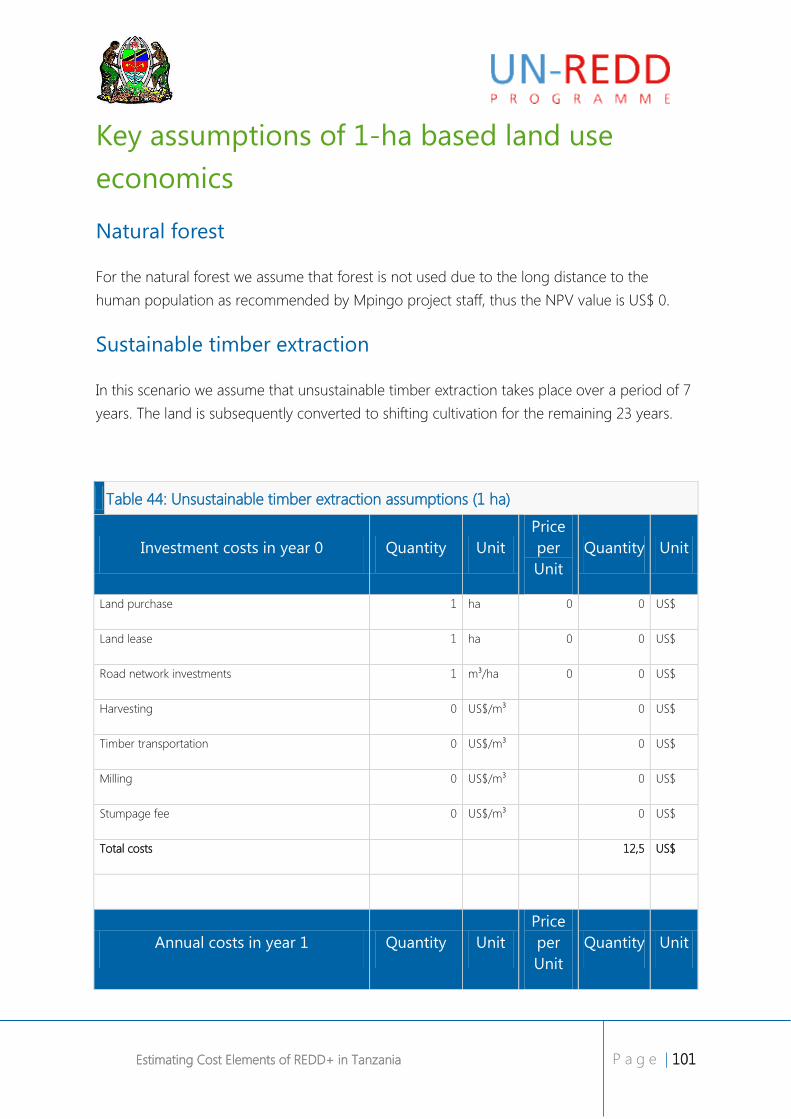
Estimating Cost Elements of REDD+ in Tanzania P a g e | 101
Key assumptions of 1-ha based land use
economics
Natural forest
For the natural forest we assume that forest is not used due to the long distance to the
human population as recommended by Mpingo project staff, thus the NPV value is US$ 0.
Sustainable timber extraction
In this scenario we assume that unsustainable timber extraction takes place over a period of 7
years. The land is subsequently converted to shifting cultivation for the remaining 23 years.
Table 44: Unsustainable timber extraction assumptions (1 ha)
Investment costs in year 0 Quantity Unit
Price
per
Unit
Quantity Unit
Land purchase 1 ha 0 0 US$
Land lease 1 ha 0 0 US$
Road network investments 1 m³/ha 0 0 US$
Harvesting 0 US$/m³ 0 US$
Timber transportation 0 US$/m³ 0 US$
Milling 0 US$/m³ 0 US$
Stumpage fee 0 US$/m³ 0 US$
Total costs 12,5 US$
Annual costs in year 1 Quantity Unit
Price
per
Unit
Quantity Unit

Estimating Cost Elements of REDD+ in Tanzania P a g e | 102
Land lease 1 ha 0 0 US$
Annual road network investments 1 m³/ha 0 0 US$
Harvesting 23 US$/m³ 0 US$
Timber transportation 20 US$/m³ 0 US$
Milling 0 US$/m³ 0 US$
Stumpage fee 0 US$/m³ 0 US$
Total costs 1 US$
Yields and Prices Quantity Unit Source
Annual timber extraction volume 0 m³/ha/yr
Waste 35%
Quantity sold 0,0
Price 0 US$/m³
Authors
estimate
Total revenues 3,0 US$/ha

Estimating Cost Elements of REDD+ in Tanzania P a g e | 103
Annex 4 – TFCG Mjumita – Kilosa Project
Summary Report
Modeling approach and key assumptions In the framework of the assignment Estimating Cost elements of REDD+ in Tanzania funded
by the UN-REDD Programme, the consultants team developed a methodology to estimate
opportunity costs, implementation costs, institutional costs and transaction costs of REDD+
projects, specified to Tanzanian circumstances. The Excel-based REDD+ cost element model
is designed in a manner allowing to use the Excel data as input data for the REDD ABACUS
software (Beta Version: 1.1.1 beta1 (13Dec201111
)) that automatically generates opportunity
cost curves.
The Excel-based tool is designed in an iterative manner and requires the user to initially
identify the persistent land use types at a historical point in time and at the project start and
undertake a land use classification and assessment of the carbon stock data for the identified
land use types.
Afterwards 1-ha based land use economics are calculated to generate a NPV value for all
identified land use types. In the opportunity cost analysis stage a land use change matrix has
to be developed that reflect the historical land use change patterns and to which land use
types forest have been converted. If there is no historical conversion of forest to other land
uses opportunity costs do not appear and no opportunity cost curves can be generated.
Main outputs of processing the 1-ha economic models are Net Present Values (NPVs) as
explained in the main report and land use related carbon stock changes. Based on this output
all required input data for REDD ABACUS is generated and opportunity cost curves can be
processed with ABACUS.
In the subsequent phase other REDD+ cost elements, namely institutional, implementation
and transaction costs are estimated. While the transaction costs and implementation costs are
derived from the project documents, institutional costs are calculated from a national average.
11 http://www.worldagroforestry.org/sea/abacus

Estimating Cost Elements of REDD+ in Tanzania P a g e | 104
The model allows estimating all four REDD+ cost elements. Hence, indicating REDD+ costs for
the envisaged emission savings by the project.
Figure 31: Methodology to estimate REDD+ cost elements
Project key area and carbon stock
assumptions For the TFCG Mjumita – Kilosa project model we used input data from the project documents
provided to the consultants and a project specific workshop in Dar es Salaam on the 13th
February, 2012.
With regards to the drivers of deforestation, we used unsustainable charcoal production and
shifting cultivation as the major drivers.

Estimating Cost Elements of REDD+ in Tanzania P a g e | 105
Table 45: Project area assumptions
Land use types of the project area (ha):
Historical land use on
project area (ha) At project start (ha)
Natural forest 148,825 139,617
Unsustainable charcoal production 0 4,236
Agriculture (Shifting cultivation) 0 4,972
Total 148,825 148,825
Carbon stock data of land use types
For the carbon stock data the long-term average carbon stocks shall be used. Based on
provided data and our own estimates, the following carbon information was generated and
used in our further calculations:
Table 46: Carbon stock assumptions
Land use types
Carbon stocks (ABG, BGB)
(tCO2/ha)
Carbon stocks (ABG,
BGB) (tC/ha)
Natural forest 145.3 39.6
Unsustainable charcoal production 16.1 4.4
Agriculture (Shifting cultivation) 16.1 4.4
Note: The long-term average is based on the average aboveground carbon stock carbon stock is based on
a weighted average carbon stock from 17 forest plots randomly distributed across the project area.
Belowground carbon stocks are based on IPCC default root-to-shoot ratio for dry tropical forests.
1-ha models for existing land use types For the establishment of opportunity costs curves each identified land use type requires the
establishment of a Net Present Value (NPV), an economic performance indicator that shows
the profitability of a land use in US$/ha. For the NPV calculation we used a discount rate of
10 % and discounted the annual cost and revenues over a period of 30 years, equivalent to
the project lifetime.

Estimating Cost Elements of REDD+ in Tanzania P a g e | 106
The figure below presents the NPVs for the identified land uses. All key assumptions made in
these 1-ha models are detailed in Annex 1.
Figure 32: NPVs for the TFCG Mjumita – Kilosa project
Land use change matrix The land use change matrix is a key input for the opportunity cost analysis spreadsheet which
is also used as an input table for ABACUS. It provides information about the land use change
dynamics in the project area. In addition to providing data needed for the opportunity cost
analysis, the land use change matrix can be used to assess the driving forces of deforestation
and land use trajectories over time. The land use change matrix is normally based on the
historical remote sensing analysis that compares land uses at two different points in time, e.g.
2001 and 2011.
Table 47: Land use change matrix for project (2001-2011) (ha) presents the estimated land
use change matrix for the project case. The vertical column indicates the year of the initial
land cover. The change to another land use is shown on the horizontal row. The diagonal of
the table indicates unchanged land area units between two time series (in orange font). The
figures in green font indicate the conversion of natural forest at an historical point in time to
different other land use types, identified as the drivers of deforestation at the current point of
time (e.g. at project start).
95
1,662
1,232
0200400600800
1,0001,2001,4001,6001,800
Natural forest Unsustainable charcoalproduction
Agriculture (Shiftingcultivation)
NPV (at discount rate 10 %) 30 years
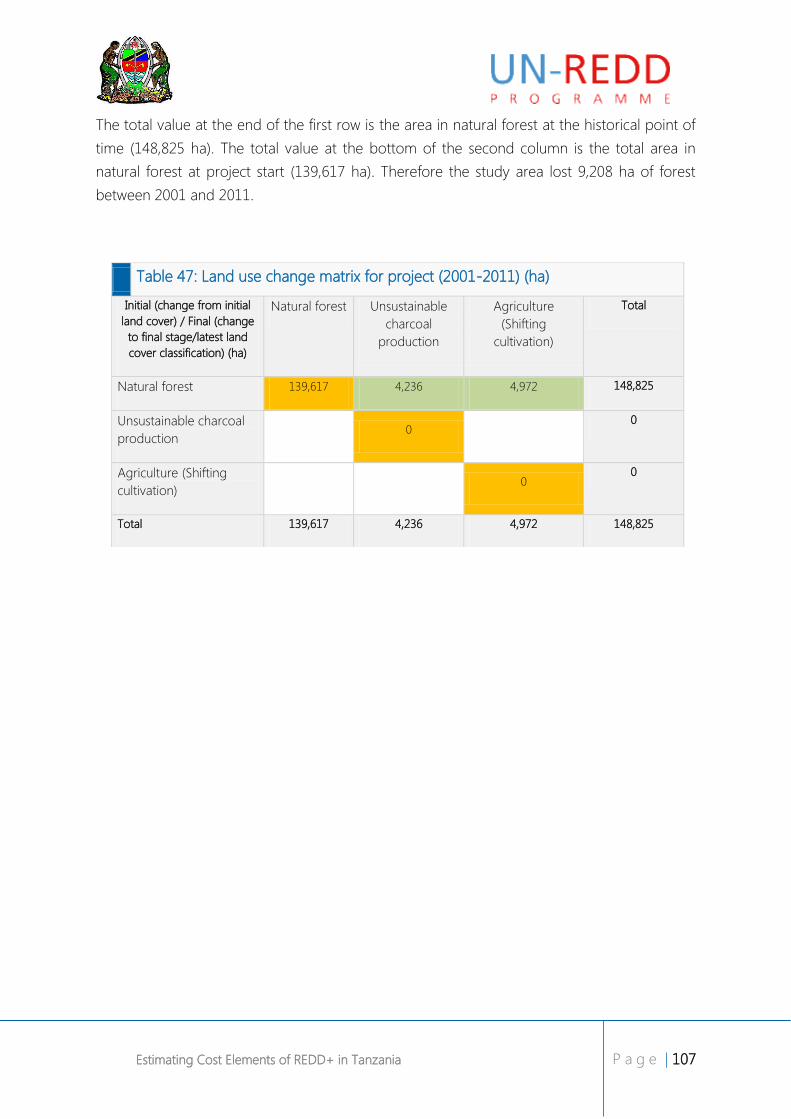
Estimating Cost Elements of REDD+ in Tanzania P a g e | 107
The total value at the end of the first row is the area in natural forest at the historical point of
time (148,825 ha). The total value at the bottom of the second column is the total area in
natural forest at project start (139,617 ha). Therefore the study area lost 9,208 ha of forest
between 2001 and 2011.
Table 47: Land use change matrix for project (2001-2011) (ha)
Initial (change from initial
land cover) / Final (change
to final stage/latest land
cover classification) (ha)
Natural forest Unsustainable
charcoal
production
Agriculture
(Shifting
cultivation)
Total
Natural forest 139,617 4,236 4,972 148,825
Unsustainable charcoal
production 0
0
Agriculture (Shifting
cultivation) 0
0
Total 139,617 4,236 4,972 148,825

Estimating Cost Elements of REDD+ in Tanzania P a g e | 108
Opportunity costs The opportunity cost were calculated based on the following carbon stock losses (tCO2/ha)
from the conversion of natural forest to the respective land use types.
Figure 33: GHG emissions (tCO2/ha) from conversion of natural forest to other
land use types in the TFCG – Mjumita Kilosa project area
Using the NPV and the respective carbon stock data, for each land use, the following
opportunity costs (US$/tCO2) were calculated by dividing the opportunity cost NPV (Figure
32) for the land use change by the related carbon stock change (Table 46) per ha.
In the TFCG Kilosa project case the opportunity costs would range between US$ 12.1/tCO2 for
unsustainable charcoal production and subsequent shifting cultivation and US$ 8.8/tCO2 for
agriculture (shifting cultivation). Thus, avoiding land use conversion from natural forest to
unsustainable charcoal production and shifting cultivation would comprise a higher NPV than
of the natural forest. These opportunity costs indicate which monetary value will forgo the
user, when not converting the forest.
129 129
020406080
100120140
Unsustainable charcoalproduction
Agriculture (Shiftingcultivation)
GHG emission (tCO2) per ha due to conversion
tCO2/ha

Estimating Cost Elements of REDD+ in Tanzania P a g e | 109
Figure 34: Opportunity costs (US$/tCO2) from conversion of natural forest to other
land use types in the TFCG Mjumita Kilosa project
The described data (NPV and land use change matrix based carbon stock changes) constitute
the key input data for the ABACUS software to generate the project`s opportunity cost curves.
An opportunity cost curve compares the quantity of potential emission reductions with their
opportunity costs. The vertical y-axis represents the opportunity cost of the emissions
reduction option (in US$ per tCO2), while the horizontal axis depicts the corresponding
quantity of reduction (in million tCO2) at the respective price.
For the described land use change scenario (land use matrix) emissions of about 1.2 million
tCO2 would occur over a period of 10 years.
12.1
8.8
02468
101214
Unsustainable charcoalproduction
Agriculture (Shiftingcultivation)
Opportuntiy costs US$/tCO2
US$/tCO2

Estimating Cost Elements of REDD+ in Tanzania P a g e | 110
Figure 35: Opportunity cost curve TFCG Mjumita - Kilosa project
Note: The GHG emissions in the cost curve occurred over a period of the last 10 years, as based on historical land
use change indicated in the land use change matrix.
Building the REDD+ project case The opportunity cost curves is based on historical data and land use dynamics. In order to
estimate the complete REDD+ project cost elements, implementation costs, transaction costs
and institutional costs need to be estimated. In our calculation we assume that opportunity
costs will be compensated by the implementation activities, thus opportunity costs are not
added up to total costs. For detailed explanation, refer to the main report.
Implementation costs are directly associated with actions to reduce deforestation and forest
degradation. Examples include the costs of guarding a forest to prevent unsustainable
charcoal production, replanting trees in degraded or logged forests, or intensifying
agricultural land. Implementation may also comprise the training and capacity-building
activities at the project level that are necessary to make the REDD+ programs happen.

Estimating Cost Elements of REDD+ in Tanzania P a g e | 111
For the implementation and transaction costs we used the annual project budget of the TFCG
Mjumita project proposal financed by the Royal Norwegian Embassy Norway and assigned
the respective cost the implementation and transaction cost categories.
Transactions costs are incurred throughout the process: certifying the project according to a
carbon standard, transaction negotiation, monitoring, reporting, and verifying GHG emission
reductions. Transaction costs are incurred by the implementers of a REDD+ program and
third parties such as verifiers, certifiers, and lawyers.
Institutional costs are related to public expenditures to build institutions and realize REDD+ at
national scale. That includes governance structures, clarifications on land tenure issues,
capacity building and extension services; policy formulation and law enforcement. The
estimation of the institutional costs is based on a country wide average in US$/ha based on
the total forested area in Tanzania and the budgets to build a national REDD+ framework.
In the following, we initially provide estimates on the projected GHG benefits due to REDD+
activities and subsequently provide cost estimates on implementation costs, transaction costs
and institutional costs.
REDD+ related GHG benefits projections
Based on inputs from TFCG Mjumita project staff we estimated that the project will on
average prevent 790 ha/yr of natural forest of being converted to other land uses equivalent
to 102,000 tCO2/yr, as shown in the figure below.

Estimating Cost Elements of REDD+ in Tanzania P a g e | 112
Figure 36: Avoided deforestation area and GHG benefits in project scenario
Implementation, Institutional and Transaction costs estimates
When implementing a REDD+ project, significant investments are required in order to cover
the costs associated with actions to reduce deforestation, and hence emissions. All of these
and similar measures incur up-front investment and perhaps recurring costs for public and/or
the private sectors, which need to be adequately assessed and financed.
Based on the budget for the TFCG Mjumita Lindi and Kilosa project budget area cost
estimates were provided for the initial 5 years of the project lifetime. Based on these estimates
we extrapolated the costs of the project for the subsequent 25 years.
In total, implementation costs are estimated at an annual average of US$ 0.55 million for the
project area (US$ 16.35 million over 30 years)12
; transaction cost are estimated at an average
of US$ 25,000 annually (US$ 0.75 million over 30 years); and institutional costs will amount at
US$ 10,500 (US$ 0,32 over 30 years). For a detailed cost breakdown, see the Excel-based tool
to estimate REDD+ cost elements.
12 Not taking into account inflation.
0
20,000
40,000
60,000
80,000
100,000
120,000
140,000
0100200300400500600700800900
1,000
1 6 11 16 21 26
Annual net area avoding from conversion (ha) Annual net emission reduction (tCO2)
tCO2
Years

Estimating Cost Elements of REDD+ in Tanzania P a g e | 113
Figure 37: Annual implementation, transaction and institutional cost estimates
(US$)
REDD+ costs per saved tCO2 In the TFCG Mjumita Kilosa project a total a price of US$ 5.6 per conserved tCO2 would be
required in order to cover implementation US$ 5.3/tCO2), transaction (US$ 0.2/tCO2) and
institutional costs (US$ 0.1/tCO2).
0
100,000
200,000
300,000
400,000
500,000
600,000
700,000
1 6 11 16 21 26
Total project implementation costs (US$) Total transaction costs (US$) Total institutional costs (US$)
US$

Estimating Cost Elements of REDD+ in Tanzania P a g e | 114
Figure 38: REDD+ costs per saved tCO2 (US$)
On the entire project scale and in order to avoid 3.1 million tCO2 emissions, the costs would
add up to about US$ 17.3 million over a project lifetime of 30 years.
Figure 39: Total project costs TFCG Mjumita Kilosa (US$)
5.3
0.2
0.1
3
3.5
4
4.5
5
5.5
6
Costs per saved tCO2
Institutional costs
Transaction costs
Project implementation costs
US$/tCO2
16,349,262
743,500
216,662
15,800,000
16,000,000
16,200,000
16,400,000
16,600,000
16,800,000
17,000,000
17,200,000
17,400,000
Total project costs
Institutional costs
Transaction costs
Project implementation costs
US$

Estimating Cost Elements of REDD+ in Tanzania P a g e | 115
Key assumption of 1-ha based land use
economics
Natural forest
For the natural forest we assume that forest is used extensively for the collection of fuel wood
and non-timber forest products in a sustainable manner.
Table 48: Natural forest assumptions (1 ha)
Annual costs Quantity Unit
Price
per
Unit
Quantity Unit
Annual labour costs fuelwood collection 15 days/ha/yr 2 30 US$
Annual labour costs NTFP collection 15 days/ha/yr 2 30 US$
Annual cost small-scale timber extraction
Harvesting 0 US$/m³ 0 US$
Timber transportation 0 US$/m³ 0 US$
Milling 0 US$/m³ 0 US$
Total costs 60 US$
Yields and Prices Quantity Unit
Price
per
Unit
Quantity Unit
Annual fuel wood collection 1,5 m³ 20 30 US$
Annual NTFP collection 10 Units 4 40 US$
Annual small-holder timber extraction revenues
Annual timber extraction volume 0 m³/ha/yr

Estimating Cost Elements of REDD+ in Tanzania P a g e | 116
Waste 0%
Quantity sold 0,0 m³/ha/yr
Price 0 US$/m³ 0 US$
Total revenues 70 US$
Source: Authors estimates
Unsustainable charcoal production
In this scenario we assume that unsustainable charcoal production takes place over a period
of 1 year, and subsequently converted to shifting cultivation for the remaining 29 years.
Table 49: Unsustainable charcoal productions assumptions (1 ha)
Key parameters Value Unit Source
Years of charcoal production
on a ha until clearance 1 Years Authors estimates
Alternative land use after
clearance
Conventional
agriculture
(Shifting
cultivation)
Average aboveground biomass
in year 0 28 tdm/ha TFCG estimates
Annual average biomass
increment 2,4 tdm/ha
WWF, Malimbwi,
Zahabu 2007
Total commercially available
biomass 30,4 tdm/ha
Total annual commercially
available biomass 30,4 tdm/ha/yr
Average kiln efficiency 20%
Drivers of
Deforestation in Kilwa
Excel sheet

Estimating Cost Elements of REDD+ in Tanzania P a g e | 117
Total annual commercially
available charcoal 6,1
Inputs for charcoal
production Quantity Unit Price per unit Costs Unit Source
Labour input (harvesting and
charcoal making) 112 days/ha/yr 2 224 US$
Calculated
from data in
WWF,
Malimbwi,
Zahabu
2007
Tools and equipment 0 Units 0 0 US$
Total cost charcoal production 224 US$
Income Quantity Unit Price per unit Reven
ues Unit Source
Annual charcoal production 6,1 t/ha/yr 100 608 US$
Calculated
from data in
WWF,
Malimbwi,
Zahabu
2007
Total income charcoal 608 US$
Agriculture (shifting cultivation)
As one of the major drivers of deforestation in the project area shifting cultivation is
commonly practiced. For the determination of the NPV shifting cultivation, we used beans as
the sole crop which is the most profitable cropping system in the project region. This is due to
the lack of data on the mix of cropping systems. Thus the opportunity costs are likely to be
overestimated as other less profitable crops are grown.

Estimating Cost Elements of REDD+ in Tanzania P a g e | 118
Table 50: Mix of cropping systems (agriculture shifting cultivation)
Land use distribution for subsistence agriculture % of total of land use
Activity 1: Beans 100%
In addition we assume a land use cycle of 5 years of cultivation and 8 years of fallow which is
consistently repeated over a period of 30 years. For beans cropping system, we developed a
1-ha model as shown below, that estimates the cost and revenues at the farm-gate level.
Table 51: Beans production system key assumptions (1-ha)
Inputs at establishment
(year 0) Quantity Unit
Price
per
unit Costs Unit
Seed 0 kg 0 0 US$
Business outlook
Mjumita TFCG
REDD Kilosa
Fertilizer 0 kg 0 0 US$
Herbicides 0 liters 0 0 US$
Insecticides 0 liters 0 0 US$
Tools 0 Units 0 0 US$
Machinery 0 days 0 0 US$
Labour input/yr/ha 210 days 2 420 US$
Total cost establishment 420
Inputs at management
(from year 1 onwards) Quantity Unit
Price
per
unit
Costs Unit Source
Seed 0 kg 0 0 US$
Fertilizer 0 kg 0 0 US$
Herbicides 0 liters 0 0 US$
Insecticides 0 liter 0 0 US$

Estimating Cost Elements of REDD+ in Tanzania P a g e | 119
Tools 0 Units 0 0 US$
Machinery 0 days 0 0 US$
Labour input/yr 168 days 2 336 US$
Business outlook
Mjumita TFCG
REDD Kilosa
Total cost management 336 US$
Income Quantity Unit
Price
per
unit
Reve
nues Unit Source
Yields /ha/yr 1482 kg/ha/yr 0,4 593 US$
Business outlook
Mjumita TFCG
REDD
Yield start after establishment 1 year
Total income 593 US$

Estimating Cost Elements of REDD+ in Tanzania P a g e | 120
Annex 5 – TFCG Mjumita – Lindi Project
Summary Report
Modeling approach and key assumptions In the framework of the assignment Estimating Cost elements of REDD+ in Tanzania funded
by the UN-REDD Programme, the consultants team developed a methodology to estimate
opportunity costs, implementation costs, institutional costs and transaction costs of REDD+
projects, specified to Tanzanian circumstances. The Excel-based REDD+ cost element model
is designed in a manner allowing to use the Excel data as input data for the REDD ABACUS
software (Beta Version: 1.1.1 beta1 (13 Dec 201113
)) that automatically generates opportunity
cost curves.
The Excel-based tool is designed in an iterative manner and requires the user to initially
identify the persistent land use types at a historical point in time and at the project start and
undertake a land use classification and assessment of the carbon stock data for the identified
land use types.
Afterwards 1-ha based land use economics are calculated to generate a NPV value for all
identified land use types. In the opportunity cost analysis stage a land use change matrix has
to be developed that reflect the historical land use change patterns and to which land use
types forest have been converted. If there is no historical conversion of forest to other land
uses opportunity costs do not appear and no opportunity cost curves can be generated.
Main outputs of processing the 1-ha economic models are Net Present Values (NPVs) as
explained in the main report and land use related carbon stock changes. Based on this output
all required input data for REDD ABACUS is generated and opportunity cost curves can be
processed with ABACUS.
In the subsequent phase other REDD+ cost elements, namely institutional, implementation
and transaction costs are estimated. While the transaction costs and implementation costs are
derived from the project documents, institutional costs are calculated from a national average.
13 http://www.worldagroforestry.org/sea/abacus

Estimating Cost Elements of REDD+ in Tanzania P a g e | 121
The model allows estimating all four REDD+ cost elements. Hence, indicating REDD+ costs for
the envisaged emission savings by the project.
Figure 40: Methodology to estimate REDD+ cost elements
Project key area and carbon stock
assumptions For the TFCG Mjumita – Lindi project model we used input data from the project documents
provided to the consultants and a project specific workshop in Dar es Salaam on 13 February
2012.
With regards to the drivers of deforestation, we used unsustainable charcoal production and
shifting cultivation as the major drivers.
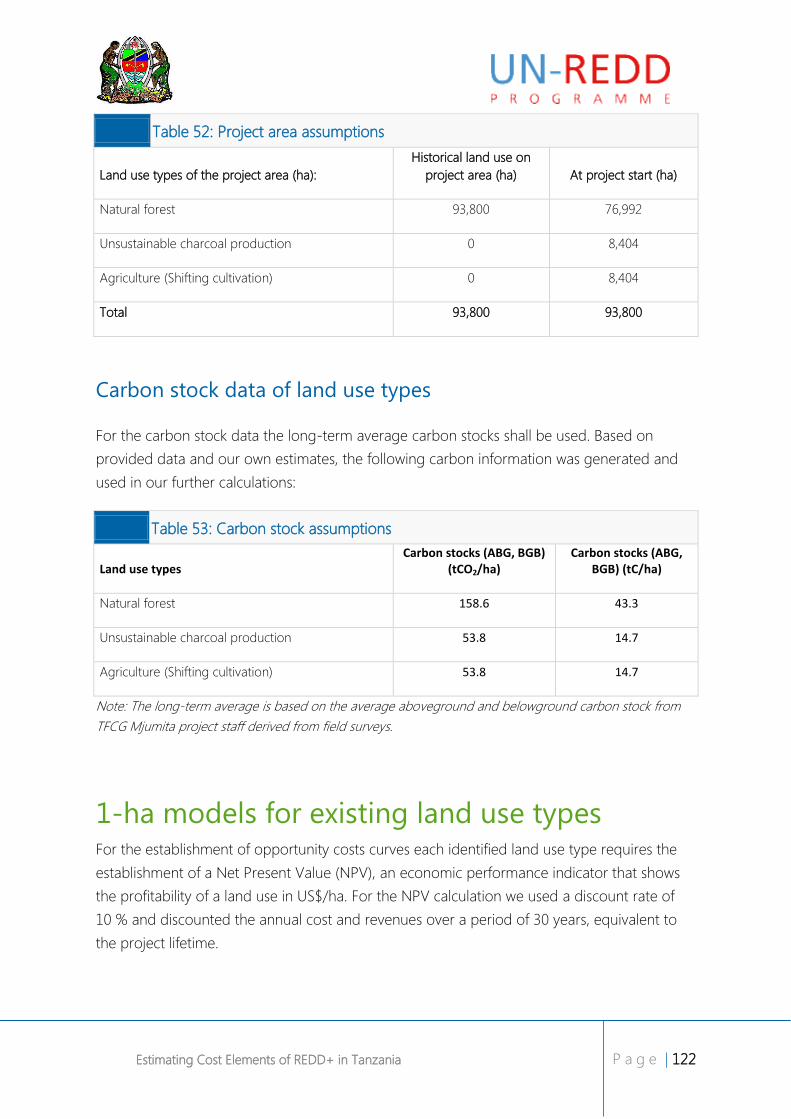
Estimating Cost Elements of REDD+ in Tanzania P a g e | 122
Table 52: Project area assumptions
Land use types of the project area (ha):
Historical land use on
project area (ha) At project start (ha)
Natural forest 93,800 76,992
Unsustainable charcoal production 0 8,404
Agriculture (Shifting cultivation) 0 8,404
Total 93,800 93,800
Carbon stock data of land use types
For the carbon stock data the long-term average carbon stocks shall be used. Based on
provided data and our own estimates, the following carbon information was generated and
used in our further calculations:
Table 53: Carbon stock assumptions
Land use types Carbon stocks (ABG, BGB)
(tCO2/ha) Carbon stocks (ABG,
BGB) (tC/ha)
Natural forest 158.6 43.3
Unsustainable charcoal production 53.8 14.7
Agriculture (Shifting cultivation) 53.8 14.7
Note: The long-term average is based on the average aboveground and belowground carbon stock from
TFCG Mjumita project staff derived from field surveys.
1-ha models for existing land use types For the establishment of opportunity costs curves each identified land use type requires the
establishment of a Net Present Value (NPV), an economic performance indicator that shows
the profitability of a land use in US$/ha. For the NPV calculation we used a discount rate of
10 % and discounted the annual cost and revenues over a period of 30 years, equivalent to
the project lifetime.
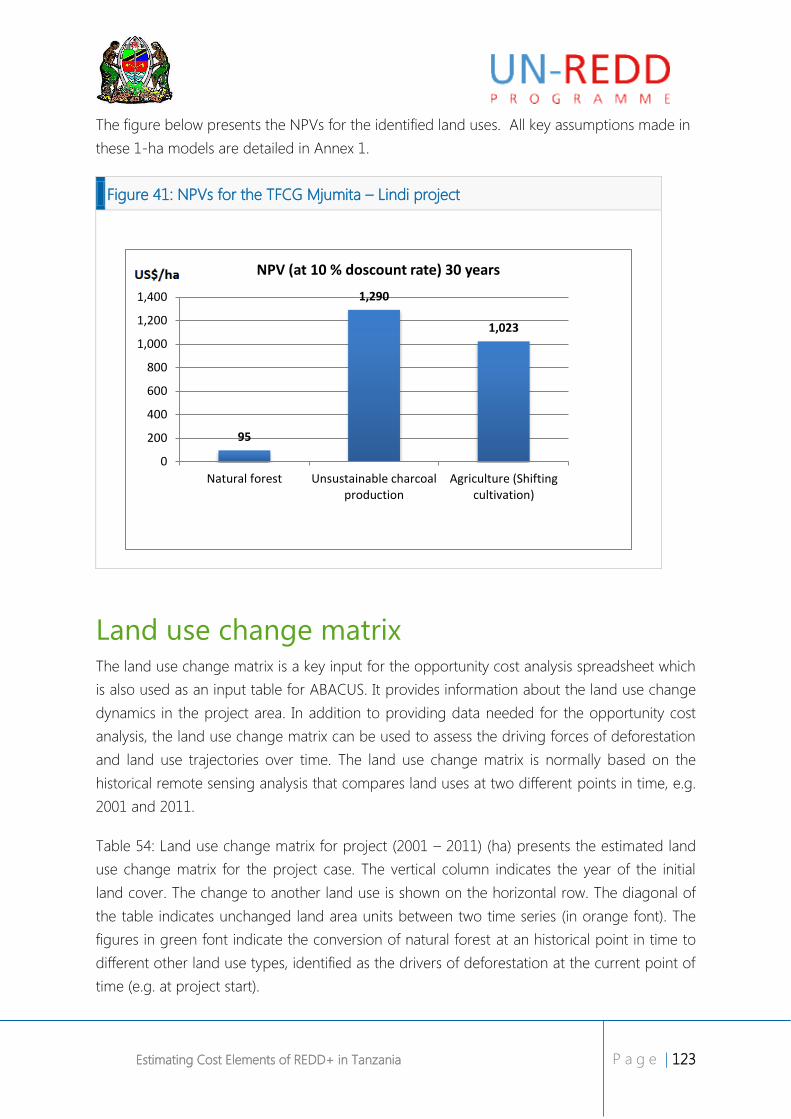
Estimating Cost Elements of REDD+ in Tanzania P a g e | 123
The figure below presents the NPVs for the identified land uses. All key assumptions made in
these 1-ha models are detailed in Annex 1.
Figure 41: NPVs for the TFCG Mjumita – Lindi project
Land use change matrix The land use change matrix is a key input for the opportunity cost analysis spreadsheet which
is also used as an input table for ABACUS. It provides information about the land use change
dynamics in the project area. In addition to providing data needed for the opportunity cost
analysis, the land use change matrix can be used to assess the driving forces of deforestation
and land use trajectories over time. The land use change matrix is normally based on the
historical remote sensing analysis that compares land uses at two different points in time, e.g.
2001 and 2011.
Table 54: Land use change matrix for project (2001 – 2011) (ha) presents the estimated land
use change matrix for the project case. The vertical column indicates the year of the initial
land cover. The change to another land use is shown on the horizontal row. The diagonal of
the table indicates unchanged land area units between two time series (in orange font). The
figures in green font indicate the conversion of natural forest at an historical point in time to
different other land use types, identified as the drivers of deforestation at the current point of
time (e.g. at project start).
95
1,290
1,023
0
200
400
600
800
1,000
1,200
1,400
Natural forest Unsustainable charcoalproduction
Agriculture (Shiftingcultivation)
NPV (at 10 % doscount rate) 30 years

Estimating Cost Elements of REDD+ in Tanzania P a g e | 124
The total value at the end of the first row is the area in natural forest at the historical point of
time (93,800 ha). The total value at the bottom of the second column is the total area in
natural forest at project start (76,992 ha). Therefore the study area lost 16,808 ha of forest
between 2001 and 2011.
Opportunity costs The opportunity cost were calculated based on the following carbon stock losses (tCO2/ha)
from the conversion of natural forest to the respective land use types.
Table 54: Land use change matrix for project (2001 – 2011) (ha)
Initial (change from initial
land cover) / Final (change
to final stage/latest land
cover classification) (ha)
Natural forest Unsustainable charcoal
production
Agriculture (Shifting cultivation)
Total
Natural forest 76,992 8,404 8,404 93,800
Unsustainable charcoal production
0 0
Agriculture (Shifting cultivation)
0 0
Total 76,992 8,404 8,404 93,800

Estimating Cost Elements of REDD+ in Tanzania P a g e | 125
Figure 42: GHG emissions (tCO2/ha) from conversion of natural forest to other
land use types in the TFCG – Mjumita Lindi project area
Using the NPV (and the respective carbon stock data, for each land use, the following
opportunity costs (US$/tCO2) were calculated by dividing the opportunity cost NPV (Figure
41) for the land use change by the related carbon stock change (Table 53) per ha.
In the TFCG Lindi project case the opportunity costs would range between US$ 11.4/tCO2 for
unsustainable charcoal production and subsequent shifting cultivation and US$ 8.9/tCO2 for
agriculture (shifting cultivation).Thus for shifting agriculture and unsustainable charcoal
production, the NPV is higher than that of natural forest. Thus, opportunity costs are positive.
The costs indicate, which monetary value will forgo the user, when not converting the forest.
105 105
0
20
40
60
80
100
120
Unsustainable charcoalproduction
Agriculture (Shiftingcultivation)
GHG emission (tCO2) per ha due to conversion
tCO2/ha

Estimating Cost Elements of REDD+ in Tanzania P a g e | 126
Figure 43: Opportunity costs (US$/tCO2) from conversion of natural forest to other
land use types in the TFCG Mjumita Lindi project
The described data (NPV and land use change matrix based carbon stock changes) constitute
the key input data for the ABACUS software to generate the project`s opportunity cost curves.
An opportunity cost curve compares the quantity of potential emission reductions with their
opportunity costs. The vertical y-axis represents the opportunity cost of the emissions
reduction option (in US$ per tCO2), while the horizontal axis depicts the corresponding
quantity of reduction (in million tCO2) at the respective price.
For the described land use change scenario (land use matrix) emissions of about 1.76 million
tCO2 would occur over a period of 10 years.
11.4
8.9
0
2
4
6
8
10
12
Unsustainable charcoal production Agriculture (Shifting cultivation)
Opportuntiy costs US$/tCO2
US$/tCO2

Estimating Cost Elements of REDD+ in Tanzania P a g e | 127
Figure 44: Opportunity cost curve TFCG Mjumita - Lindi project
Note: The GHG emissions in the cost curve occurred over a period of the last 10 years, as based on historical land
use change indicated in the land use change matrix.
Building the REDD+ project case The opportunity cost curves is based on historical data and land use dynamics. In order to
estimate the complete REDD+ project cost elements, implementation costs, transaction costs
and institutional costs need to be estimated. In our calculation we assume that opportunity
costs will be compensated by the implementation activities, thus opportunity costs are not
added up to total costs. For detailed explanation, refer to the main report.
Implementation costs are directly associated with actions to reduce deforestation and forest
degradation. Examples include the costs of guarding a forest to prevent unsustainable
charcoal production, replanting trees in degraded or logged forests, or intensifying
agricultural land. Implementation may also comprise the training and capacity-building
activities at the project level that are necessary to make the REDD+ programs happen.
For the implementation and transaction costs we used the annual project budget of the TFCG
Mjumita project proposal financed by the Royal Norwegian Embassy Norway and assigned
the respective cost the implementation and transaction cost categories.

Estimating Cost Elements of REDD+ in Tanzania P a g e | 128
Transactions costs are incurred throughout the process: certifying the project according to a
carbon standard, transaction negotiation, monitoring, reporting, and verifying GHG emission
reductions. Transaction costs are incurred by the implementers of a REDD+ program and
third parties such as verifiers, certifiers, and lawyers.
Institutional costs are related to public expenditures to build institutions and realize REDD+ at
national scale. That includes governance structures, clarifications on land tenure issues,
capacity building and extension services; policy formulation and law enforcement. The
estimation of the institutional costs is based on a country wide average in US$/ha based on
the total forested area in Tanzania and the budgets to build a national REDD+ framework.
In the following, we initially provide estimates on the projected GHG benefits due to REDD+
activities and subsequently provide cost estimates on implementation costs, transaction costs
and institutional costs.
REDD+ related GHG benefits projections
Based on inputs from TFCG Mjumita project staff we estimated that the project will on
average prevent 1,150 ha/yr of natural forest of being converted to other land uses
equivalent to 120,000 tCO2/yr, as shown in the figure below.

Estimating Cost Elements of REDD+ in Tanzania P a g e | 129
Figure 45: Avoided deforestation area and GHG benefits in project scenario
Implementation, Institutional and Transaction costs estimates
When implementing a REDD+ project, significant investments are required in order to cover
the costs associated with actions to reduce deforestation, and hence emissions. All of these
and similar measures incur up-front investment and perhaps recurring costs for public and/or
the private sectors, which need to be adequately assessed and financed.
Based on the budget for the TFCG Mjumita Lindi and Kilosa project budget area cost
estimates were provided for the initial 5 years of the project lifetime. Based on these estimates
we extrapolated the costs of the project for the subsequent 25 years.
In total, implementation costs are estimated at an annual average of US$ 0.55 million for the
project area (US$ 16.35 million over 30 years)14
; transaction cost are estimated at an average
of US$ 25,000 annually (US$ 0.75 million over 30 years); and institutional costs will amount at
US$ 8,500 (US$ 0.27 million over 30 years). For a detailed cost breakdown, see the Excel-
based tool to estimate REDD+ cost elements.
14 Not taking into account inflation.
0
20,000
40,000
60,000
80,000
100,000
120,000
140,000
160,000
180,000
0
200
400
600
800
1,000
1,200
1,400
1,600
1,800
1 6 11 16 21 26
Annual net area avoding from conversion (ha)
Annual net emission reduction (tCO2)
tCO2
Years
ha

Estimating Cost Elements of REDD+ in Tanzania P a g e | 130
Figure 46: Annual implementation, transaction and institutional cost estimates
(US$)
REDD+ costs per saved tCO2 In the TFCG Mjumita Lindi project a total a price of US$ 4.8 per conserved tCO2 would be
required in order to cover, implementation (US$ 4.5/tCO2), transaction (US$ 0.2/tCO2) and
institutional costs (US$ 0.1/tCO2).
0
100,000
200,000
300,000
400,000
500,000
600,000
700,000
1 6 11 16 21 26
Total project implementation costs (US$)
Total transaction costs (US$)
Total institutional costs (US$)
US$

Estimating Cost Elements of REDD+ in Tanzania P a g e | 131
Figure 47: REDD+ costs per saved tCO2 (US$)
On the entire project scale and in order to avoid 3.6 million tCO2 emissions, the costs would
add up to about US$ 17.3 million over a project lifetime of 30 years.
4.54
0.21 0.06
3
3.2
3.4
3.6
3.8
4
4.2
4.4
4.6
4.8
5
Costs per saved tCO2
Institutional costs
Transaction costs
Project implementation costs
US$/tCO2

Estimating Cost Elements of REDD+ in Tanzania P a g e | 132
Figure 48: Total project costs TFCG Mjumita Lindi (US$)
Key assumption of 1-ha based land use
economics
Natural forest
For the natural forest we assume that forest is used extensively for the collection of fuel wood
and non-timber forest products in a sustainable manner.
16,349,262
743,500
198,504
15,800,000
16,000,000
16,200,000
16,400,000
16,600,000
16,800,000
17,000,000
17,200,000
17,400,000
Total project costs
Institutional costs
Transaction costs
Project implementation costs
US$

Estimating Cost Elements of REDD+ in Tanzania P a g e | 133
Table 55: Natural forest assumptions (1 ha)
Annual costs Quantity Unit
Price
per
Unit
Quantity Unit
Annual labour costs fuelwood collection 15 days/ha/yr 2 30 US$
Annual labour costs NTFP collection 15 days/ha/yr 2 30 US$
Annual cost small-scale timber extraction
Harvesting 0 US$/m³ 0 US$
Timber transportation 0 US$/m³ 0 US$
Milling 0 US$/m³ 0 US$
Total costs 60 US$
Yields and Prices Quantity Unit
Price
per
Unit
Quantity Unit
Annual fuel wood collection 1,5 m³ 20 30 US$
Annual NTFP collection 10 Units 4 40 US$
Annual small-holder timber extraction revenues
Annual timber extraction volume 0 m³/ha/yr
Waste 0%
Quantity sold 0,0 m³/ha/yr
Price 0 US$/m³ 0 US$
Total revenues 70 US$
Source: Authors estimates

Estimating Cost Elements of REDD+ in Tanzania P a g e | 134
Unsustainable charcoal production
In this scenario we assume that unsustainable charcoal production takes place over a period
of 1 year, and subsequently converted to shifting cultivation for the remaining 29 years.
Table 56: Unsustainable charcoal production assumptions (1 ha)
Key parameters Value Unit Source
Years of charcoal
production on a ha until
clearance 3 Years Authors estimates
Alternative land use after
clearance
Conventional
agriculture (Shifting
cultivation)
Average aboveground
biomass in year 0 36,8 tdm/ha
WWF, Malimbwi,
Zahabu 2007
Annual average biomass
increment 2,4 tdm/ha
WWF, Malimbwi,
Zahabu 2007
Total commercially available
biomass 44 tdm/ha
Total annual commercially
available biomass 14,7 tdm/ha/yr
Average kiln efficiency 28%
Drivers of
Deforestation in
Kilwa Excel sheet
Total annual commercially
available charcoal 4,1
Inputs for charcoal
production Quantity Unit Price per unit Costs Unit Source
Labour input (harvesting
and charcoal making) 112 days/ha/yr 2 224 US$
Calculated
from data
in WWF,
Malimbwi,
Zahabu
2007

Estimating Cost Elements of REDD+ in Tanzania P a g e | 135
Tools and equipment 0 Units 0 0 US$
Total cost charcoal
production 224 US$
Income Quantity Unit Price per unit Reven
ues Unit Source
Annual charcoal production 4,1 t/ha/yr 100 411 US$
Calculated
from data
in WWF,
Malimbwi,
Zahabu
2007
Total income charcoal 411 US$
Agriculture (shifting cultivation)
As one of the major drivers of deforestation in the project area shifting cultivation is
commonly practiced. For the determination of the NPV shifting cultivation, we used sesame as
the sole crop which is the most profitable cropping system in the project region. This is due to
the lack of data on the mix of cropping systems. Thus the opportunity costs are likely to be
overestimated as other less profitable crops are grown.
Table 57: Mix of cropping systems (agriculture shifting cultivation)
Land use distribution for subsistence
agriculture % of total of land use
Activity 1: Sesame 100%
In addition we assume a land use cycle of 2 years of cultivation and 10 years of fallow which is
consistently repeated over a period of 30 years. For the sesame cropping system, we
developed a 1-ha model as shown below, that estimates the cost and revenues at the farm-
gate level.

Estimating Cost Elements of REDD+ in Tanzania P a g e | 136
Table 58: Sesame production system key assumptions (1-ha)
Inputs at establishment
(year 0) Quantity Unit
Price
per
unit
Costs Unit
Seed 0 kg 0 0 US$
Business outlook
Mjumita TFCG
REDD
Fertilizer 0 kg 0 0 US$
Herbicides 0 liters 0 0 US$
Insecticides 0 liters 0 0 US$
Tools 0 Units 0 0 US$
Machinery 0 days 0 0 US$
Labour input/yr/ha 94 days 1,5 141 US$
Total cost establishment 141
Inputs at management
(from year 1 onwards) Quantity Unit
Price
per
unit
Costs Unit Source
Seed 0 kg 0 0 US$
Fertilizer 0 kg 0 0 US$
Herbicides 0 liters 0 0 US$
Insecticides 0 liter 0 0 US$
Tools 0 Units 0 0 US$
Machinery 0 days 0 0 US$
Labour input/yr 94 days 1,5 141 US$
Business outlook
Mjumita TFCG
REDD
Total cost management 141 US$
Income Quantity Unit
Price
per
unit
Reve
nues Unit Source

Estimating Cost Elements of REDD+ in Tanzania P a g e | 137
Yields /ha/yr 741 kg/ha/yr 0,75 556 US$
Business outlook
Mjumita TFCG
REDD
Yield start after establishment: 1 Years
Total income 556 US$