Estimating Burden of Work on Health ILO & WHO Methods
37
Estimating Burden of Work on Health ILO & WHO Methods For Discussion 13 Oct 2014 27-Oct-14 Visiting Expert Week – Tim Driscoll 1
Transcript of Estimating Burden of Work on Health ILO & WHO Methods

Estimating Burden of Work on Health
ILO & WHO Methods For Discussion
13 Oct 2014
27-Oct-14 Visiting Expert Week – Tim Driscoll
1

Work-related Burden of Disease
• Wellbeing of workers are diminished
due to work
– Fall sick diseases and conditions
– Get injured major and minor
– Die
• Quantified by number of persons
and persons-time
Visiting Expert Week – Tim Driscoll 2 27-Oct-14
What Outcomes
are we estimating
?
Who are we
including?

How do we calculate ‘Burden’?
• Mortality
– No. of persons died from work-related causes
– No. of years of lives lost , YLL
• Morbidity
– No. of persons who got sick or injured from work-related causes
– No. of healthy years of lives lost, Disability Adjusted Life Years,
DALYs
Therefore, total no. of healthy years of lives lost provides a numerical value
to the “burden” of a risk factor (i.e.: work or specific occupation
exposure) to populations.
Visiting Expert Week – Tim Driscoll 3 27-Oct-14
Not so straight forward as information is usually missing or under-reported, especially for diseases, and from developing countries


Visiting Expert Week – Tim Driscoll 6 27-Oct-14
Results of Fatalities from Work
ILO’s Estimate
2.3 million deaths
Fatal Injuries
Fatalities due to Illnesses
WHO’s Estimate
850,000 deaths
Fatalities due to: 1. Workplace carcinogens 2. Airborne particulates 3. Ergo stressors of the back 4. Noise 5. Hazards for injuries

2.5%
53.0%
5.7%
28.0%
6.0%
0.8% 1.0%
2.4%
Communicable Diseases
Malignant neoplasms
Neuropsychiatric conditions
Circulatory diseases
Respiratory diseases
Digestive diseases
Genitourinary diseases
Accidents & violence
Circulatory
Diseases
Cancers
In EU28, cardiovascular and circulatory diseases accounts for 28%
and cancers at 53%. They were the top illnesses responsible for 4/5
of deaths from work-related diseases. Occupational injuries and
infectious diseases together amount accounts for less than 5%.
% Work-related Deaths caused by Illness in EU28

8% (2.5%)
46% (53%)
6 % (6%)
32% (28%)
0.3% (5.7%) 0.3% (0.8%)
4% (1%) 4% (2.4%)
Communicable diseases Cancers
Respiratory Diseases Circulatory diseases
Mental Disorders Digestive systems diseases
Genitourinary system Accidents and violence
Deaths attributed to work, Singapore (Resid.) 834, EU: 192,000 (new!)
Work-related Annual Deaths – EU-27
Sources: WSH Institute Singapore 2014, Hämäläinen P, Takala J, Saarela KL; TUT,
ILO, WHO, EU-OSHA, WSH Institute Singapore, JOEH May 2014, ref. data:
MOH/MOM and WHO A region
Work-related Annual Deaths – Singapore and EU distribution of fatal injuries
and illnesses, EU in brackets

10 leading causes of Deaths in East Asia
Murray et al. Lancet 2012,
http://www.healthmetricsandevaluation.org/gbd/visualizations/regional

10 leading causes of Deaths in East Asia
Murray et al. Lancet 2012,
http://www.healthmetricsandevaluation.org/gbd/visualizations/regional
WORK-related


27-Oct-14 Visiting Expert Week – Tim Driscoll 13
846 DALYs re occ. cancer
2,757 DALYs re
occ. injuries
3,979 DALYs re occ.
low back pain


No
disability Sickness
absence Retirement on
health grounds
chronic disease
Premature
death
Basic associations
Psychosocial
factors
Kivimäki 2013 Source:
27-Oct-14 Visiting Expert Week – Tim Driscoll 16
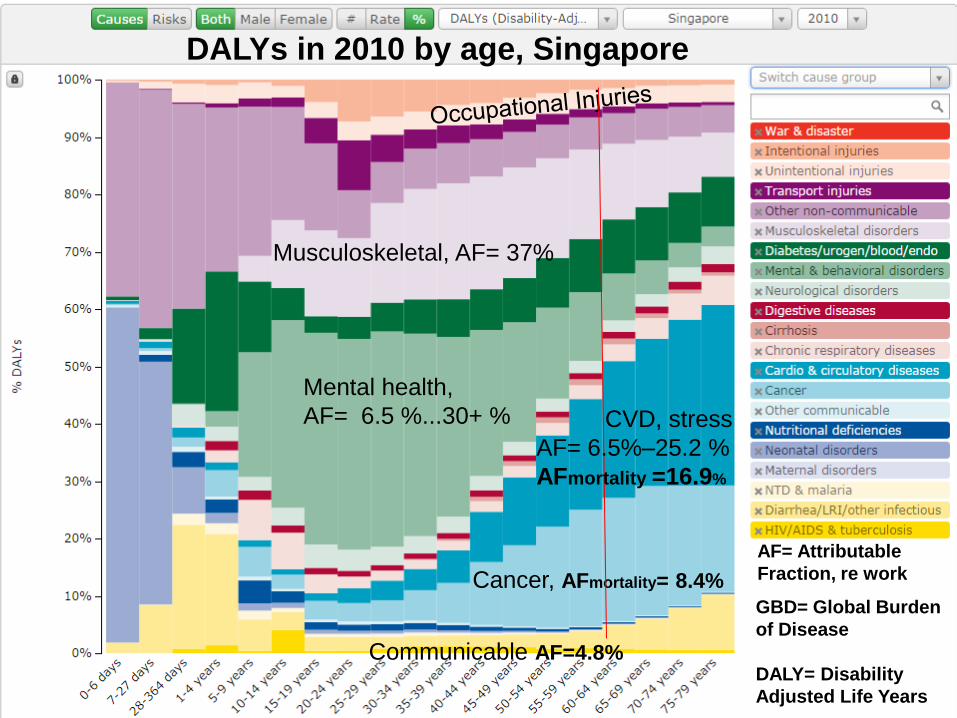
Cancer, AFmortality= 8.4%
DALYs in 2010 by age, Singapore
AF= Attributable
Fraction, re work
Communicable AF=4.8%
GBD= Global Burden
of Disease
DALY= Disability
Adjusted Life Years
Mental health,
AF= 6.5 %...30+ %
Musculoskeletal, AF= 37%
CVD, stress
AF= 6.5%–25.2 %
AFmortality =16.9%

Work –relatedness of common
diseases
A Leading Institute for WSH Knowledge and Innovations
17
3.7% (6.4%m /1.0% f)
Driscoll/Lancet 2014 26

WorkWork--relatedness of common diseasesrelatedness of common diseases
Overall work-relatedness of mortality, ILO: 6.7%
GDP loss, Australian method 5.9%
Global Burden of disease and injury in Europe, WHO 5.0%
Work –relatedness of common
diseases
A Leading Institute for WSH Knowledge and Innovations
18
SG: 3.2% ; AUS: new 4.8 % prev.
3.7%

27-Oct-14 Visiting Expert Week – Tim Driscoll 19

Selected data from various sources,
refs included
27-Oct-14 Visiting Expert Week – Tim Driscoll 20
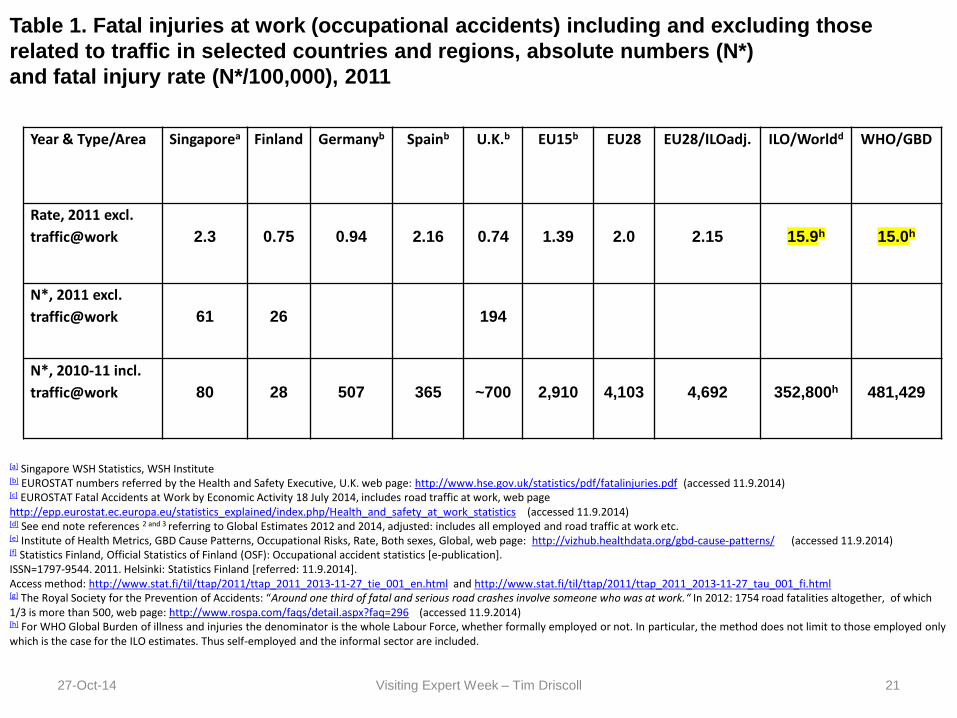
27-Oct-14 Visiting Expert Week – Tim Driscoll 21
Year & Type/Area Singaporea Finland Germanyb Spainb U.K.b EU15b EU28 EU28/ILOadj. ILO/Worldd WHO/GBD
Rate, 2011 excl.
traffic@work
2.3
0.75
0.94
2.16
0.74
1.39
2.0
2.15
15.9h
15.0h
N*, 2011 excl.
traffic@work
61
26
194
N*, 2010-11 incl.
traffic@work
80
28
507
365
~700
2,910
4,103
4,692
352,800h
481,429
Table 1. Fatal injuries at work (occupational accidents) including and excluding those
related to traffic in selected countries and regions, absolute numbers (N*)
and fatal injury rate (N*/100,000), 2011
[a] Singapore WSH Statistics, WSH Institute [b] EUROSTAT numbers referred by the Health and Safety Executive, U.K. web page: http://www.hse.gov.uk/statistics/pdf/fatalinjuries.pdf (accessed 11.9.2014) [c] EUROSTAT Fatal Accidents at Work by Economic Activity 18 July 2014, includes road traffic at work, web page http://epp.eurostat.ec.europa.eu/statistics_explained/index.php/Health_and_safety_at_work_statistics (accessed 11.9.2014) [d] See end note references 2 and 3 referring to Global Estimates 2012 and 2014, adjusted: includes all employed and road traffic at work etc. [e] Institute of Health Metrics, GBD Cause Patterns, Occupational Risks, Rate, Both sexes, Global, web page: http://vizhub.healthdata.org/gbd-cause-patterns/ (accessed 11.9.2014) [f] Statistics Finland, Official Statistics of Finland (OSF): Occupational accident statistics [e-publication]. ISSN=1797-9544. 2011. Helsinki: Statistics Finland [referred: 11.9.2014]. Access method: http://www.stat.fi/til/ttap/2011/ttap_2011_2013-11-27_tie_001_en.html and http://www.stat.fi/til/ttap/2011/ttap_2011_2013-11-27_tau_001_fi.html [g] The Royal Society for the Prevention of Accidents: “Around one third of fatal and serious road crashes involve someone who was at work.“ In 2012: 1754 road fatalities altogether, of which 1/3 is more than 500, web page: http://www.rospa.com/faqs/detail.aspx?faq=296 (accessed 11.9.2014) [h] For WHO Global Burden of illness and injuries the denominator is the whole Labour Force, whether formally employed or not. In particular, the method does not limit to those employed only which is the case for the ILO estimates. Thus self-employed and the informal sector are included.
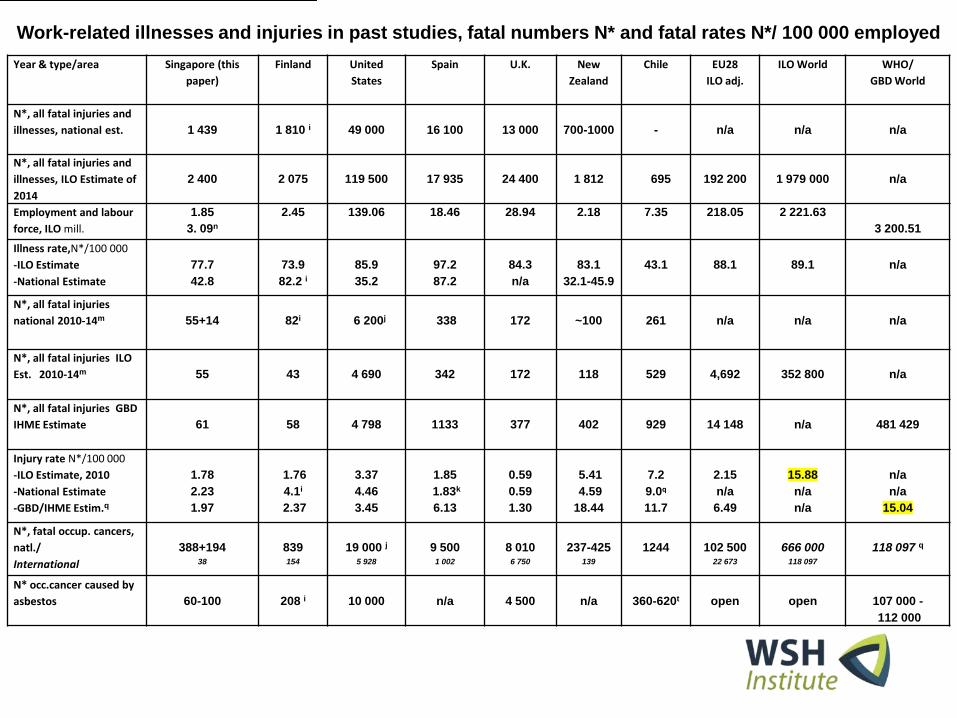
Year & type/area Singapore (this
paper)
Finland United
States
Spain U.K. New
Zealand
Chile EU28
ILO adj.
ILO World WHO/
GBD World
N*, all fatal injuries and
illnesses, national est.
1 439
1 810 i
49 000
16 100
13 000
700-1000
-
n/a
n/a
n/a
N*, all fatal injuries and
illnesses, ILO Estimate of
2014
2 400
2 075
119 500
17 935
24 400
1 812
3 695
192 200
1 979 000
n/a
Employment and labour
force, ILO mill.
1.85
3. 09n
2.45 139.06 18.46 28.94 2.18 7.35 218.05 2 221.63
3 200.51
Illness rate,N*/100 000
-ILO Estimate
-National Estimate
77.7
42.8
73.9
82.2 i
85.9
35.2
97.2
87.2
84.3
n/a
83.1
32.1-45.9
43.1
88.1
89.1
n/a
N*, all fatal injuries
national 2010-14m
55+14
82i
6 200j
338
172
~100
261
n/a
n/a
n/a
N*, all fatal injuries ILO
Est. 2010-14m
55
43
4 690
342
172
118
529
4,692
352 800
n/a
N*, all fatal injuries GBD
IHME Estimate
61
58
4 798
1133
377
402
929
14 148
n/a
481 429
Injury rate N*/100 000
-ILO Estimate, 2010
-National Estimate
-GBD/IHME Estim.q
1.78
2.23
1.97
1.76
4.1i
2.37
3.37
4.46
3.45
1.85
1.83k
6.13
0.59
0.59
1.30
5.41
4.59
18.44
7.2
9.0q
11.7
2.15
n/a
6.49
15.88
n/a
n/a
n/a
n/a
15.04
N*, fatal occup. cancers,
natl./
International
388+194 38
839 154
19 000 j 5 928
9 500 1 002
8 010 6 750
237-425 139
1244
102 500 22 673
666 000 118 097
118 097 q
N* occ.cancer caused by
asbestos
60-100
208 i
10 000
n/a
4 500
n/a
360-620t
open
open
107 000 -
112 000
Work-related illnesses and injuries in past studies, fatal numbers N* and fatal rates N*/ 100 000 employed
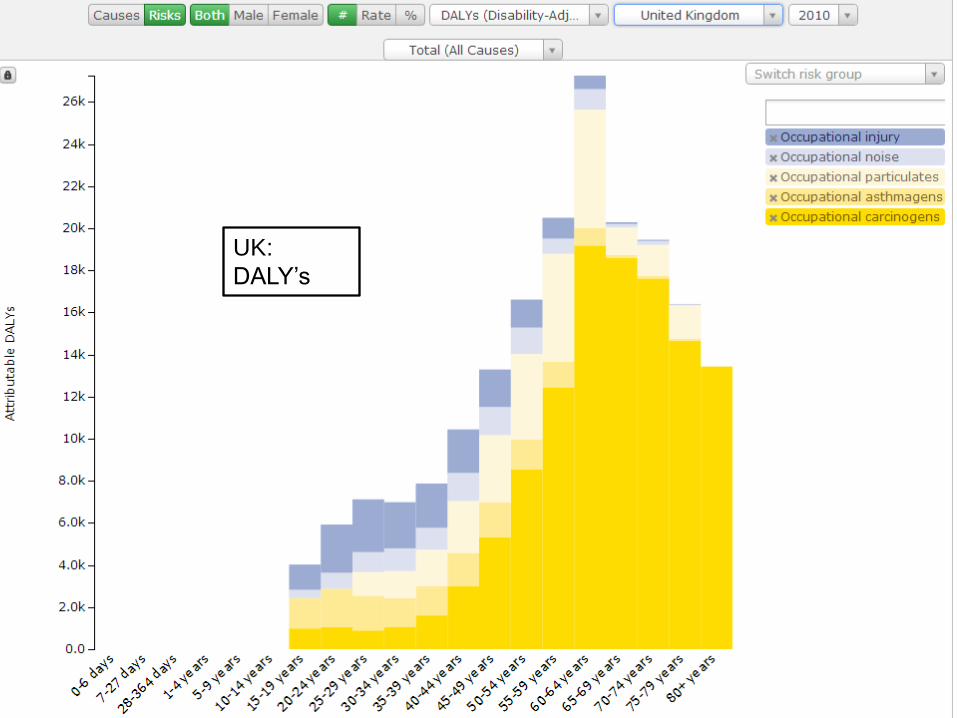
UK:
DALY’s

Germany:
DALY’s

DALYs in men in 2010 by age, High-income Asia-Pacific
Musculoskeletal
Mental health
Cancer
CVD
Transport injuries
Injuries
Musculoskeletal
Mental/behavioural
disorders
Cancer
CVD
Injuries
Musculoskeletal
Mental/behavioural
disorders
Cancer
CVD
http://www.healthmetricsandevaluation.org/gbd/visualizations/regional
Occupational cancer Occupational injuries
Death rates
http://www.healthmetricsandevaluation.org/gbd/visualizations/gbd-cause-patterns

The Lancet, 2013

UK: 6,750
est. 8010
USA: 5,928
est. 19,000-35,000
Singapore: 38
est. 383
Finl: 154
est. 839
http://www.healthmetricsandevaluation.org/gbd/visualizations/regional

http://vizhub.healthdata.org/gbd-cause-patterns/

375,105
YLLs re
occ. cancer
498,604
YLLs re
occ. injuries
Years of Lost Life, N=deaths, L = lost years
For cancer (UK): L = 19.8 years
For injuries(UK): L = 45.3 years
Years Lived with Disability
Disability Adjusted Life Years
Deaths and Lost Years through GBD/WHO and/or ILO
YLLs, U.K. selected causes by
WHO and GBD Estimation Method:
Prof. Tim Driscoll
27-Oct-14 Visiting Expert Week – Tim Driscoll 30

• 26 risk factors to overall GDB
• Only 5 Selected occupational risks;
1. Workplace carcinogens
2. Airborne particulates
3. Hazards for injuries
4. Ergonomic stressors for back pain
5. Noise
Extra:
• Contaminated sharps injuries (healthcare workers)
• Included low-high exposures limits by geographical regions
What exposures were included?
Visiting Expert Week – Tim Driscoll 31 27-Oct-14
Due to inadequate data, WHO’s comparative risk assessment model excluded other occupational risks

ILO Estimation Method
27-Oct-14 Visiting Expert Week – Tim Driscoll 32

Visiting Expert Week – Tim Driscoll 33 27-Oct-14
Who were included in the ILO estimates?
Labour Force by Country Total employed Total employed by Main Sectors
Agriculture
Industry
Services
Farming,
Fishing,
Forestry
Mining,
Manufacturing,
Energy,
Construction

Visiting Expert Week – Tim Driscoll 34 27-Oct-14
Who were included in the ILO estimates?
Labour Force by Country Total employed Total employed by Main Sectors
• ILOSTAT
• CIA World Fact Book
• ILOSTAT
• US Dept of Interior
(for American Samoa)
• Nauru Bureau of Stats
• % labour force by sector
of occupation (CIA)
• % employed by sector of
economic activity
(ILOSTAT)
AFRO AMRO
EURO
EMRO
SEARO
WPRO
HIGH

Visiting Expert Week – Tim Driscoll 35 27-Oct-14
Data Sources and Estimates of Fatal Injuries
ILOSTAT
EUROSTAT
For all countries
For all 28 EU countries
Year 2010: • As much as possible, will use most reliable and
accessible data
• Country sources are used for Finland & US
• If there are discrepancies btw ILOSTAT &
EUROSTAT, will adopt larger reported fig
Missing Fatal Injury Data
• Select rep country for each region and apply their rate of fatal injuries Main sectors
to missing country’s total employed Main Sector
Region Representative Countries
High Australia, Canada, France, Italy, Norway, Singapore, Switzerland
AFRO Algeria, Ghana, Togo, Tunisia, Zimbabwe
AMRO Argentina, Belize, Costa Rica, Dominican Republic, Mexico
EMRO Bahrain, Turkey
EURO Croatia, Czech Republic, Estonia, Latvia, Lithuania, Poland, Romania, Turkey
SEARO, WPRO China, Republic of Korea, Kyrgyzstan, Malaysia, Myanmar, Philippines, Thailand

Visiting Expert Week – Tim Driscoll 36 27-Oct-14
Data Sources and Estimates of Non - Fatal Injuries
ILOSTAT
EUROSTAT
For all countries
For all 28 EU countries
Year 2010: • As much as possible, will use most reliable and
accessible data
• Country sources are used for Finland & US
• If there are discrepancies btw ILOSTAT &
EUROSTAT, will adopt larger reported fig
To address Under reporting of non-fatal injuries & Missing Data
• Estimate from prop of fatal to non-fatal injuries & lower/upper limits of
estimates from reference countries
• Apply limits to derived (or most reliable) fatal injuries by country to est total
non-fatal injuries by country
Lower Limit Upper Limit
EU 15 exclude Greece = 0.13%
Finland, France, Germany = 0.10%

Visiting Expert Week – Tim Driscoll 37 27-Oct-14
Data Sources and Estimates of Occupational Mortality by Diseases
WHO GHE All Cause Mortality by WHO regions by age, gender
Year 2011:
Nurminen &
Karjalainen, 2001 Attributable Fractions by Disease groups
Inclusion-Exclusion of Age and Diseases • Excluded Diseases/Conditions that are not occupational or work-related
• Excluded Diseases/Conditions that are not in Nurminen paper
• Circulatory diseases included only IHD, stroke, cardiomyopathy, myocarditis, endocarditis
• Applied age cut-offs on mortality figures for specific disease groups
• Adjusted AFs for communicable diseases (regional difference)
Regional mortality tables
by Disease groups,
Gender, Age groups
X AFs =
Region Est. Fatal occupational diseases by
Disease groups, Gender, Age
groups

![Estimating the burden of dengue and the impact of release ......Background Dengue is a mosquito-borne viral disease that has one of the world’s fastest growing burden [1]. Despite](https://static.fdocuments.in/doc/165x107/60c5114469bc0845da4b13a7/estimating-the-burden-of-dengue-and-the-impact-of-release-background-dengue.jpg)