Estimating Global Burden of Disease Christopher W. Woods, MD, MPH September 1, 2011.
53
Estimating Global Burden of Disease Christopher W. Woods, MD, MPH September 1, 2011
-
Upload
harry-miles -
Category
Documents
-
view
219 -
download
0
Transcript of Estimating Global Burden of Disease Christopher W. Woods, MD, MPH September 1, 2011.

Estimating Global Burden of Disease
Christopher W. Woods, MD, MPH
September 1, 2011

Reliable health data and statistics are the foundation of health policies, strategies, and evaluation and monitoring…….
Evidence is also the foundation for sound health information for the general public.
Margaret Chan 2007
If you are going to work, work on something important
William Foege, 2006
http://www.ted.com/talks/hans_rosling_shows_the_best_stats_you_ve_ever_seen.html
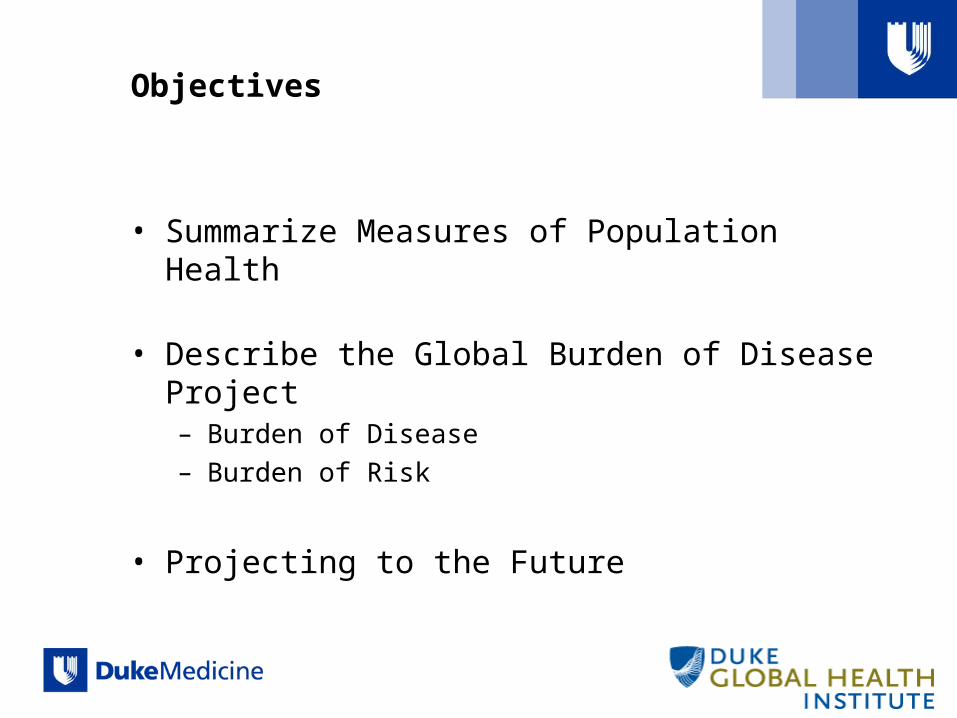
Objectives
• Summarize Measures of Population Health
• Describe the Global Burden of Disease Project – Burden of Disease– Burden of Risk
• Projecting to the Future

World Population Levels in History

Defining Health
• “A state of complete physical, mental, and social well-being and not merely the absence of disease or infirmity”
WHO Charter, 1948
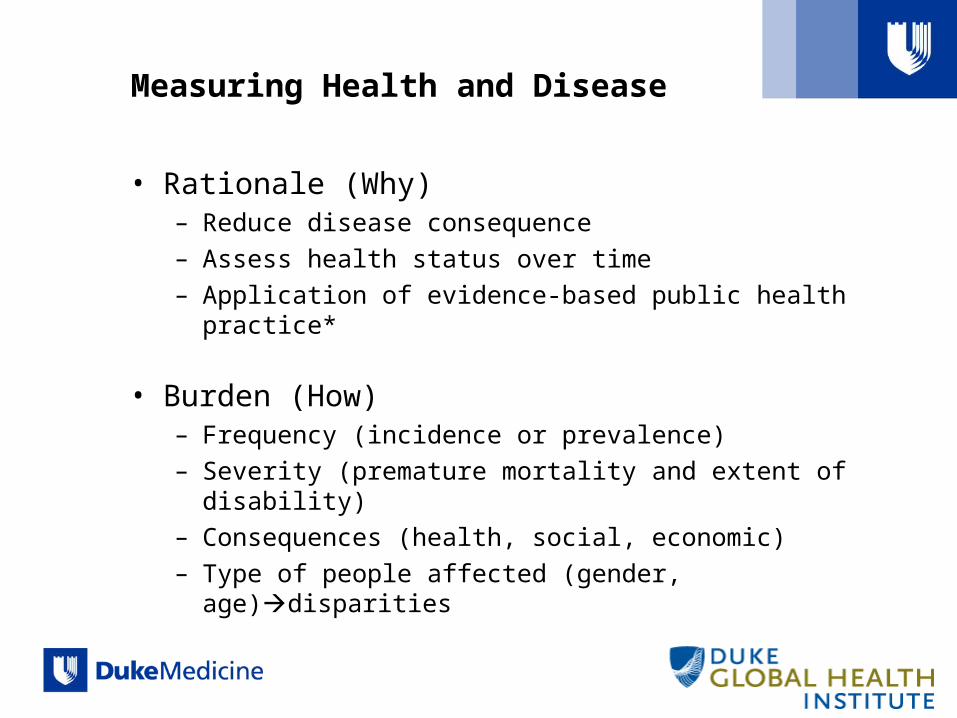
Measuring Health and Disease
• Rationale (Why)– Reduce disease consequence– Assess health status over time– Application of evidence-based public health practice*
• Burden (How)– Frequency (incidence or prevalence)– Severity (premature mortality and extent of disability)– Consequences (health, social, economic)– Type of people affected (gender, age)disparities

Life Expectancy at Birth, US 1900-2000• Common metric
– Measures average expected age at birth
– No measure of quality of life
– Strongly affected by infant and childhood mortality
Nature Medicine 10, S82 - S87 (2004)www.WorldLifeExpectancy.com
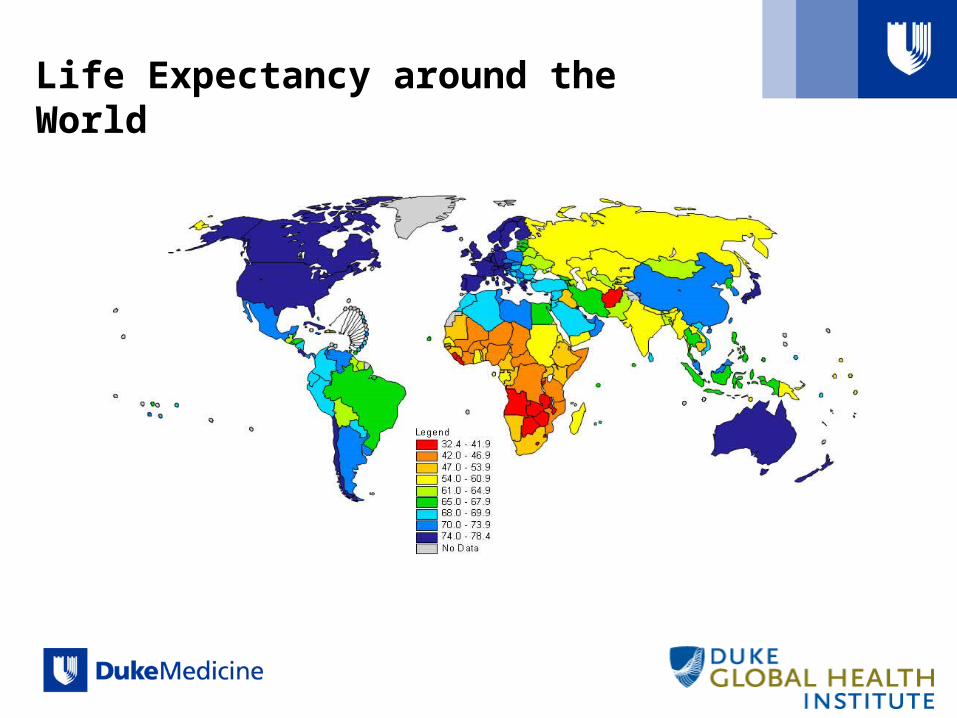
Life Expectancy around the World

Comparing Life Expectancies and Under-Five Mortality Across Countries
Source: World Health Report 2008 and World Development Group Indicators
Country Gross national income per capita
Life expectancyat birth
Under-FiveMortality Rates
Japan 34,600 82 4
Sweden 36,590 81 4
Singapore 48,520 80 3
United States 45,850 77 7
Mexico 10,030 74 27
China 5370 72 31
Thailand 7880 70 21
Uzbekistan 2,020 68 68
Honduras 2,900 67 40
Russia 10,640 65 18
India 3,460 61 74
South Africa 12,120 51 68
Haiti 1,840 50 120
Kenya 1,170 49 120
Malawi 650 41 125
Botswana 10,250 35 120
http://www.nytimes.com/2010/08/15/world/asia/15japan.html?_r=1&scp=1&sq=japan%20elderly&st=cse

Historical Perspective
• As nations become wealthier, they also become healthier, and vice versa.
Source: Marmot M. Health in an
Unequal World. The Lancet
2006;368:2081-94.
Swaziland
However, this relationship is not linear! In fact, there is a clear inflection point in the curve at US$5000 per capita.

Demographic Transition
Transition from traditional to modern society
• Decline in mortality (primarily in under 5)
• Lagging decline in fertility
• http://www.worldlifeexpectancy.com/world-population-pyramid
The Epidemiologic Transition
• Underlying reasons for the demographic transition– Change in disease pattern
• Reduction in malnutrition and communicable diseases

US Crude Mortality Rates for All Causes, Noninfectious Causes, and Infectious Diseases
Armstrong et al, JAMA, 1999.

Components of Public Health Success
• Clean water supply• Sanitary sewage disposal• Food inspection• Disease surveillance• Maternal-child health• Nutrition-free lunch/milk• Housing regulations• Worker safety, ages, hours

Vital statistics: Mortality
• Deaths defined by the Manual of International Statistical Classification of Diseases, Injuries, and Cause of Death, 10th edition (ICD-10)
• Mortality at national and sub-national levels – Fact of death unreliable in 26% of countries (age, sex, place)– Cause is unreliable (even in parts of US)
• Supplement with surveys and verbal autopsies
Murray et al, 2001
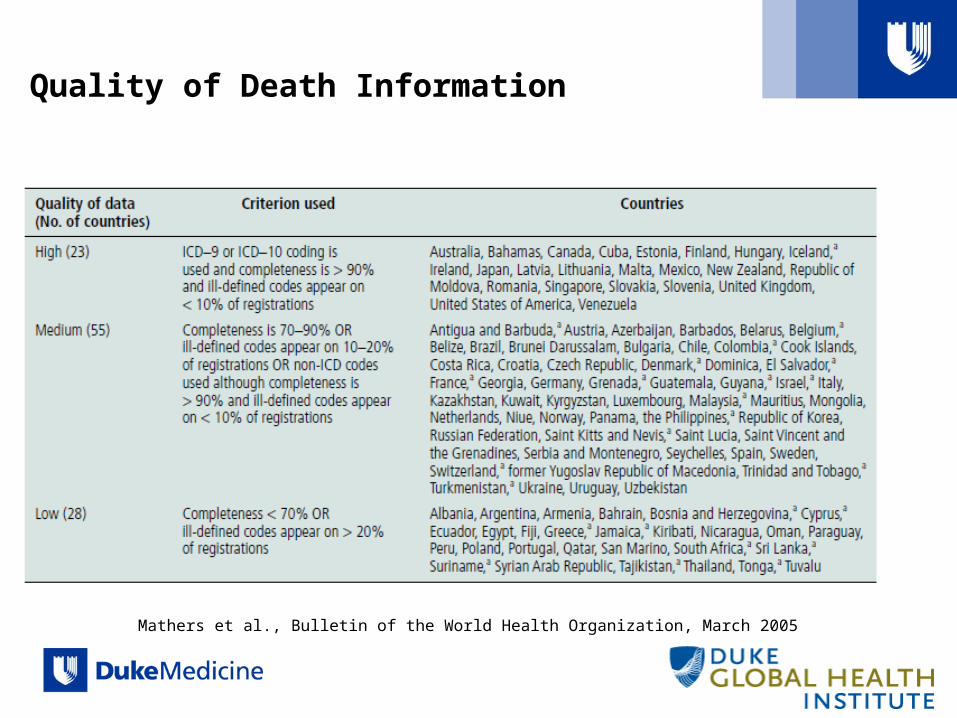
Quality of Death Information
Mathers et al., Bulletin of the World Health Organization, March 2005

Measuring disability
• Morbidity– Case Disability Ratio
• Proportion of those diagnosed with a disease who have disability
• CDR=1 for most diseases• Latent infection or genetic marker may be <1
– Extent or severity of disability• Usually rank 0 to 1
– Duration• Onset until cure and recovery or death• May have continuing permanent disability

Composite Measures of Population Health
• Health Expectancy=A+f(B)– Disability-free Life Expectancy
(DFLE)
– Health Adjusted Life Expectancy (HALE).
• Health Gap (Healthy Life Lost)=C+g(B)– Healthy Life Years (HeaLY)
– Disability Adjusted Life Year
A
B
C
AGE%
Su
rviv
ing

Disability Adjusted Life Years (DALY)
• DALY=YLL + YLD (One lost year of healthy life)
– YLL=Years of life lost to premature mortality
– YLD=Equivalent years of healthy life lost due to disability
• Ranges from 0 to 1
• Uses Life Expectancy table– compare with Japan (80 y male, 82.5 female)
• Uses health professional expert groups to define values– Discount rates for future life– Weight for life lived at different ages– Disability Weights

DALY: Years of Life Lost (YLL)
• YLL = N x Lx
YLL=Years of life lost to premature mortality
– N=Number of deaths in the population
– Lx =Standard life expectancy at age of death
– X=Age of Death
• Example:– 10 deaths at 50 = 10 x Lx=10 x 34=340 YLL

Years Lived with Disability
• YLD = I x DW x d
– YLD=Years of life lived with disability
– I = Number of incident cases in the population– DW = Disability Weight
• Scale 0 (perfect health) to 1 (death)
– d = Duration of disability (years)
• 10 cases of mental retardation due to lead at birth:– 10 x 0.36 x 80 years = 288 YLD

Value Choices for the DALY
• Time discounting: 3%– Falling mortality– Increasing costs
• Age weighting– non uniform weights– less weight to years lived at
younger and older ages
• Disability weights– Largely based on GBD 1990
study with some revisions.– For local prioritization, may
adjust to suit cultural preferences
AGE
% S
urvi
ving

Effect of discounting and age weights on YLL per Death
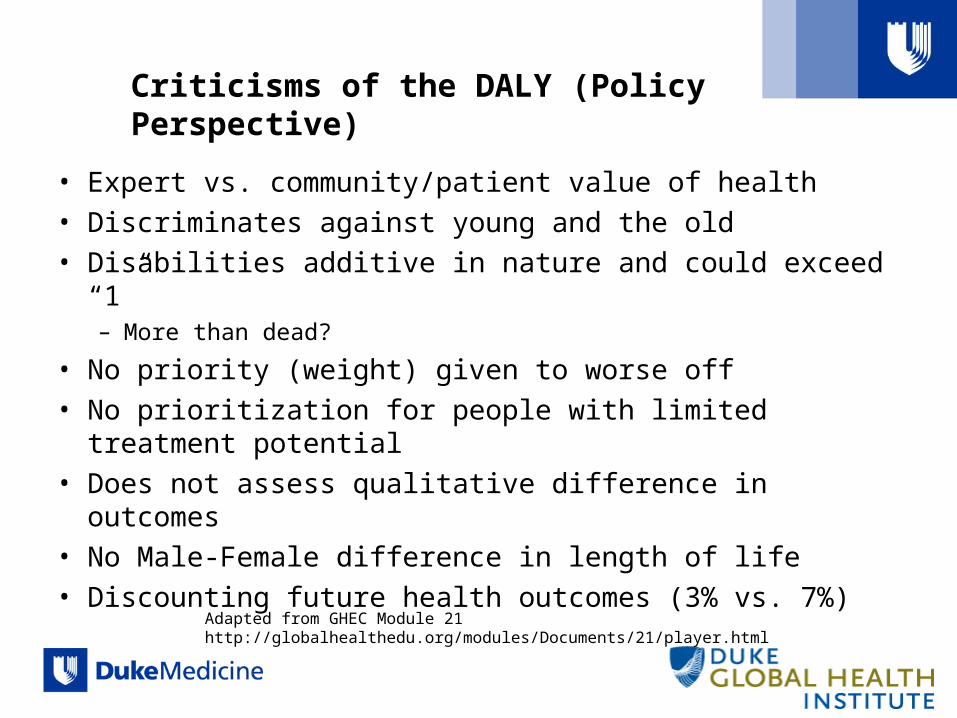
Criticisms of the DALY (Policy Perspective)
• Expert vs. community/patient value of health• Discriminates against young and the old• Disabilities additive in nature and could exceed “1”
– More than dead?
• No priority (weight) given to worse off• No prioritization for people with limited treatment potential• Does not assess qualitative difference in outcomes• No Male-Female difference in length of life • Discounting future health outcomes (3% vs. 7%)
Adapted from GHEC Module 21http://globalhealthedu.org/modules/Documents/21/player.html

Global Burden of Disease StudyMurray and Lopez, 1996
• Quantified Health effects for 107 diseases and injuries in 8 regions in 1990
• Comprehensive and consistent estimates of morbidity and mortality by age, sex, and region
• Introduced the DALY– YLL from premature death
and years lived in less than full health

Global Burden of Disease Goals
• Measure loss of health due to comprehensive set of disease injury and risk factor causes in a comparable way
• Decouple epidemiological assessment from advocacy
• Inject non-fatal health outcomes into health policy debate
• Use a common metric for burden of disease assessment using summary measure for population health and cost-effectiveness analysis
WHO Global Burden of Disease 2004 Report
GBD Philosophy
• Quantities of interest are total events or states at population levels
• Best available data used to make estimates
• Corrections for major known biases to improve cross-population compatibility
• Comprehensive set of disease and injury causes– nothing is left out in principle
• No blanks in the tables, only wider uncertainty intervals
• Internal consistency used as a tool to improve validity
WHO Global Burden of Disease 2004 Report

GBD Data Sources• Mortality
– Death registration, sample registration systems, household surveys, surveillance systems, epidemiological studies, population laboratories
• Morbidity/Disability– Disease registers, population-based studies, longitudinal studies, health
facility data (injuries)
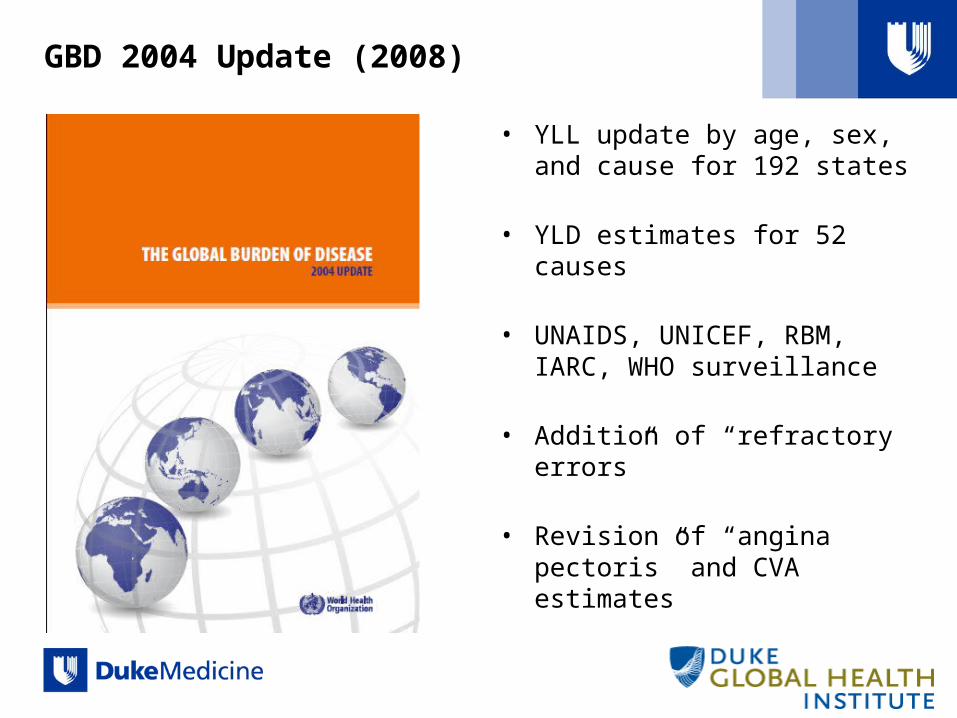
GBD 2004 Update (2008)
• YLL update by age, sex, and cause for 192 states
• YLD estimates for 52 causes
• UNAIDS, UNICEF, RBM, IARC, WHO surveillance
• Addition of “refractory errors”
• Revision of “angina pectoris” and CVA estimates

Regional Estimates by WHO Region 2004
WHO Global Burden of Disease 2004 Report

Approximate number of data sources, GBD 2004
Mortality-causes of death
Death registration for 2001 or 2002 59
Death registration for earlier 711
Child and adult mortality-other sources 535
Epidemiological studies/registers/HS data, etc.
Group I. Communicable (+) 6,539
Group II. Non-communicable 2,127
Group III. Injuries 18
Approximate total datasets used 10,052
WHO Global Burden of Disease 2004 Report
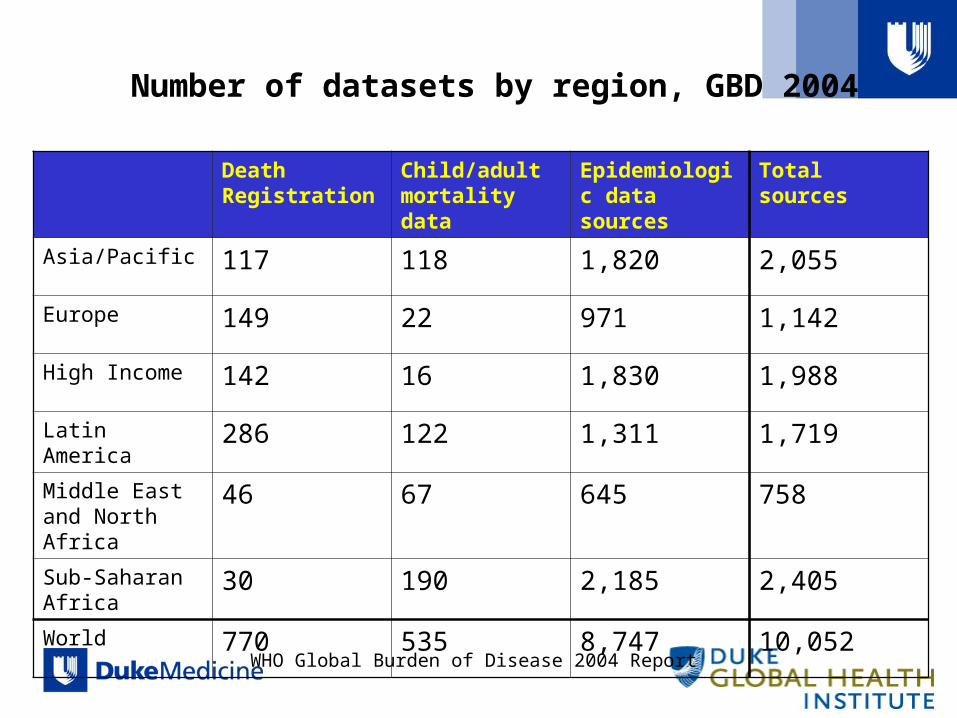
Number of datasets by region, GBD 2004
WHO Global Burden of Disease 2004 Report
Death Registration
Child/adult mortality data
Epidemiologic data sources
Total sources
Asia/Pacific 117 118 1,820 2,055
Europe 149 22 971 1,142
High Income 142 16 1,830 1,988
Latin America 286 122 1,311 1,719
Middle East and North Africa
46 67 645 758
Sub-Saharan Africa
30 190 2,185 2,405
World 770 535 8,747 10,052

Methods and data for cause-of-death for 2004, by Region
WHO Global Burden of Disease 2004 Report

Global Cause of Death by Category
• Group I– Communicable plus
maternal, perinatal and nutritional conditions
• Group II– Non-communicable
conditions (eg, heart disease, stroke, cancer)
• Group III– Injuries including motor
vehicle accidents, homicide, and suicide
58.8 million deaths, 2004
Murray and Chen, 1995

GBD 2004: Leading Causes of Death by Income
WHO Global Burden of Disease 2004 Report
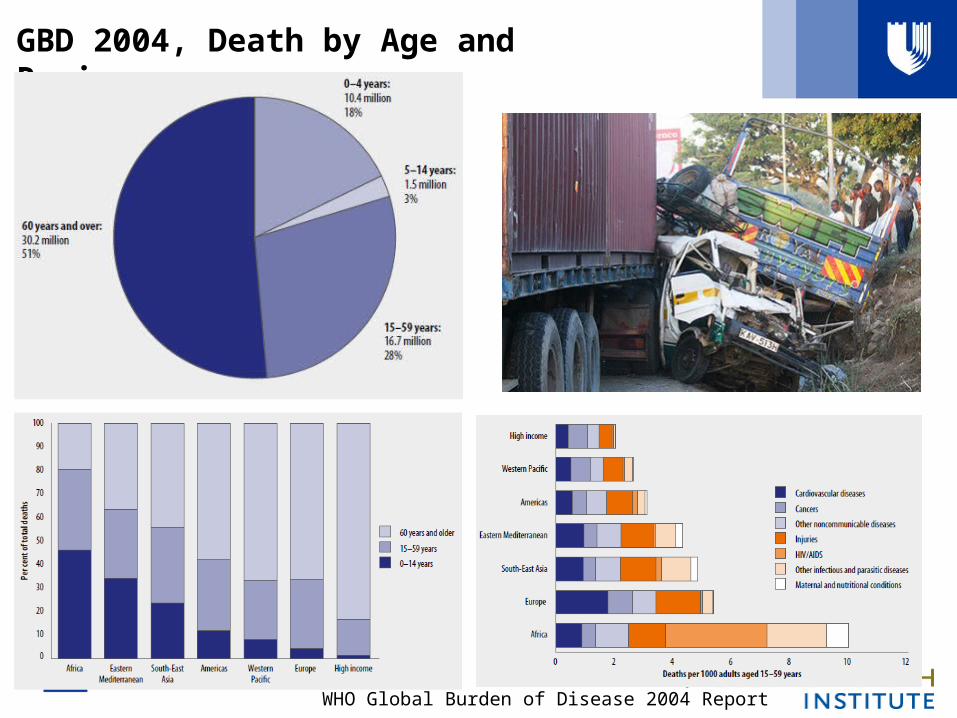
GBD 2004, Death by Age and Region
WHO Global Burden of Disease 2004 Report

GBD 2004, Death by Gender and Category
• Cardiovascular diseases are the leading cause of death.– 32% women, 27% men
• Largest difference among intentional injuries– Twice as high among men
WHO Global Burden of Disease 2004 ReportCancer Is The World's Costliest Disease, Says American Cancer Society
MARILYNN MARCHIONE | 08/16/10 09:29 PM |

GBD: Age < 5 years
WHO Global Burden of Disease 2004 Report
Malnutrition is an underlying cause of 53% of deaths under 2 years of age.

Proportional distribution of deaths and YLL by region, 2004
WHO Global Burden of Disease 2004 Report

Global Mortality Projections, 2004 to 2030
WHO Global Burden of Disease 2004 Report

Disease Burden Measured in DALY
4
396131
11-25

Global View of HIV Infection
UNAIDS, 2008 Report on the Global AIDS Epidemic
33 million people living with HIV, 2008

Burden of Disease by Region, 2002

Leading Causes of GBD, 20042030
WHO Global Burden of Disease 2004 Report
Coming 2010….A Complete Revision 1990-2005

Implementing a BOD study
• Assess demographics• Cause of Death• Define disability by cause with
input• Assess reliability/validity• Define social preferences for
age weighting, discounting, life expectation
• Est HLL for each condition and by group
• Perform sensitivity analysis• Consider other variations
(region, age, sex)• Review policy implications• Modify as necessary for setting
For policy considerations
• Est effectiveness of each intervention under consideration.
• Work out costs of interventions• Develop Cost-effectiveness
ratios to maximize return on healthy life per expenditure
• Review expected gains of healthy life by age, sex, geographic area and adjust as necessary*

Projected Burden of Disease by Income and Major Causes, 2002 - 2030
Source: Mathers CD and Loncar D (2005) Updated projections of mortality and burden of disease, WHO.

Baseline Projections by Category, 2000-2030and Compared with GBD estimates from 1990-2020
Mathers CD, Loncar D, 2006 Projections of Global Mortality and Burden of Disease from 2002 to 2030. PLoS Med 3(11): e442.

Risks Quantified in GBD
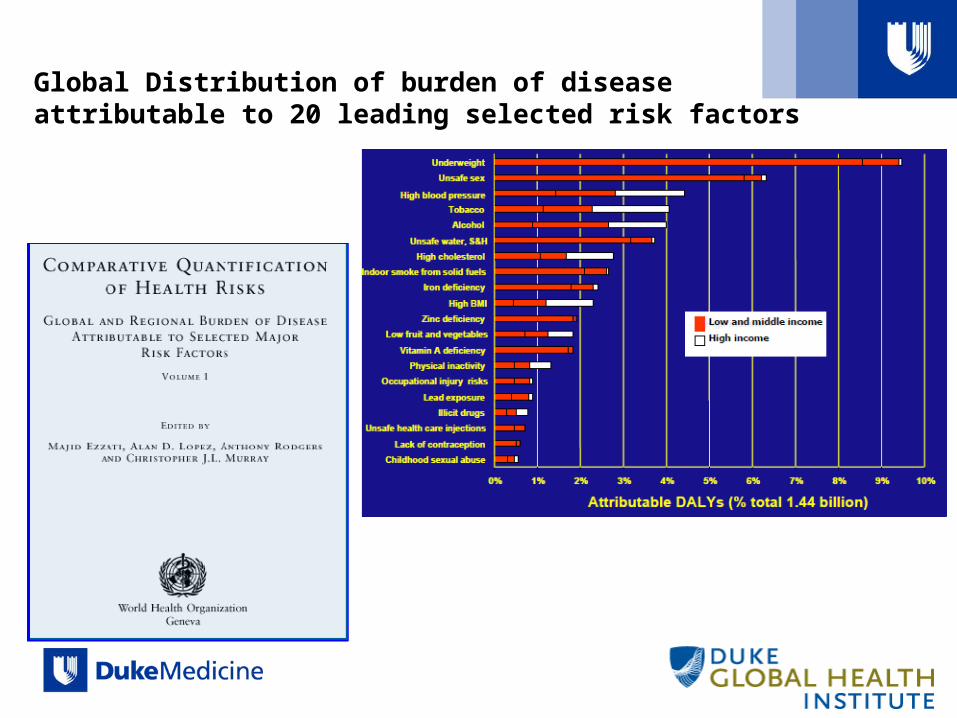
Global Distribution of burden of disease attributable to 20 leading selected risk factors
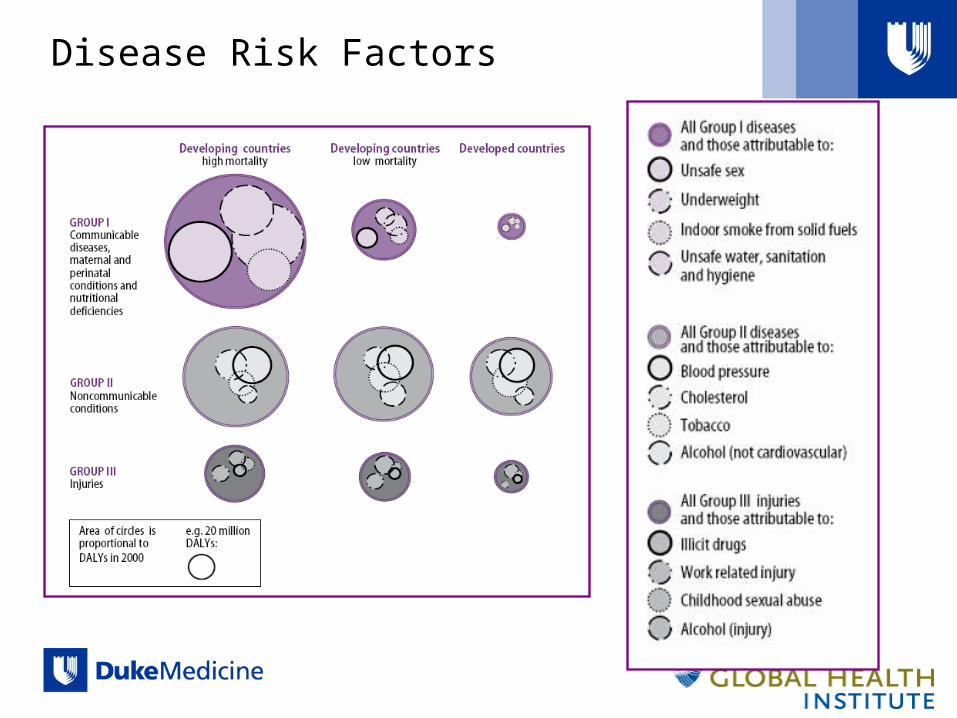
Disease Risk Factors

Deaths and DALYs due to leading 5 risks
Deaths
No. %
DALYs (M)
No. %
Underweight 3.7 6.7% 137.8 9.5%
Unsafe sex 2.9 5.2% 91.9 6.3%
Blood pressure 7.1 12.8% 64.3 4.4%
Tobacco 4.9 8.8% 59.1 4.1%
Alcohol 1.8 3.2% 58.3 4.0%
Joint effects 31% 25%

QALY and DALY