Estimating a Technical Inefficiency Effects Model for Thai...
29
Proceedings of Informing Science & IT Education Conference (InSITE) 2014 Cite as: Amornkitvikai, Y., Harvie, C., & Charoenrat, T. (2014). Estimating a technical inefficiency effects model for thai manufacturing and exporting enterprises (SMEs): A stochastic frontier (SFA) and data envelopment analysis (DEA) approach. Proceedings of Informing Science & IT Education Conference (InSITE) 2014, pp. 363-390 Retrieved from http://Proceedings.InformingScience.org/InSITE2014/InSITE14p363-390Amornkitvikai0731.pdf This paper was revised following blind review by six referees Estimating a Technical Inefficiency Effects Model for Thai Manufacturing and Exporting Enterprises (SMEs): A Stochastic Frontier (SFA) and Data Envelopment Analysis (DEA) Approach Yot Amornkitvikai Faculty of Economics, Rangsit University, Patumthani, Thailand [email protected] Charles Harvie Faculty of Business, University of Wollongong, Wollongong, Australia [email protected] Teerawat Charoenrat Khon Kaen University, Nong Khai, Thailand [email protected]; [email protected] Abstract This paper employs a stochastic frontier (SFA) and data envelopment analysis (DEA) to analyse inefficiency effect models for 3,894 Thai manufacturing and exporting small and medium size enterprises (SMEs), using 2007 Thai Industrial Census data. Thai manufacturing and exporting SMEs experience decreasing returns to scale even though their technical efficiency in production is found to be relatively high. Results from estimations using both approaches also reveal that firm age, medium-sized enterprises compared with small-sized enterprises, firm location in Bangkok, foreign investment and government assistance are significantly and positively related to firm technical efficiency. Focusing on the technical efficiency of SMEs exporting to different destinations, those exporting to OCEANIA perform the best, followed by SMEs exporting to ASEAN, East Asia, and North and South America, while SMEs exporting to Europe experience no significant effect upon their technical efficiency from doing so, where SMEs exporting to the rest of the world is the base exporting SME group. The results also reveal that SMEs in the chem- icals and related products sector perform the best, followed by SMEs in the machinery and transport equipment sector, where the miscellaneous manufactured articles sector is used as the base sector. The manufactured goods sector and food, beverages and tobacco sector are also found to perform better than the miscellaneous manufactured articles sector. Finally, the paper also provides useful evidence-based policy recommendations aimed at enhancing the technical efficiency and competi- tiveness of Thai manufacturing and ex- porting SMEs. Material published as part of this publication, either on-line or in print, is copyrighted by the Informing Science Institute. Permission to make digital or paper copy of part or all of these works for personal or classroom use is granted without fee provided that the copies are not made or distributed for profit or commercial advantage AND that copies 1) bear this notice in full and 2) give the full citation on the first page. It is per- missible to abstract these works so long as credit is given. To copy in all other cases or to republish or to post on a server or to redistribute to lists requires specific permission and payment of a fee. Contact [email protected] to request redistribution permission.
Transcript of Estimating a Technical Inefficiency Effects Model for Thai...
Proceedings of Informing Science & IT Education Conference (InSITE) 2014 Cite as: Amornkitvikai, Y., Harvie, C., & Charoenrat, T. (2014). Estimating a technical inefficiency effects model for thai manufacturing and exporting enterprises (SMEs): A stochastic frontier (SFA) and data envelopment analysis (DEA) approach. Proceedings of Informing Science & IT Education Conference (InSITE) 2014, pp. 363-390 Retrieved from http://Proceedings.InformingScience.org/InSITE2014/InSITE14p363-390Amornkitvikai0731.pdf
This paper was revised following blind review by six referees
Estimating a Technical Inefficiency Effects Model for Thai Manufacturing and Exporting Enterprises
(SMEs): A Stochastic Frontier (SFA) and Data Envelopment Analysis (DEA) Approach
Yot Amornkitvikai Faculty of Economics, Rangsit
University, Patumthani, Thailand
Charles Harvie Faculty of Business, University
of Wollongong, Wollongong, Australia
Teerawat Charoenrat Khon Kaen University, Nong Khai, Thailand
[email protected]; [email protected]
Abstract This paper employs a stochastic frontier (SFA) and data envelopment analysis (DEA) to analyse inefficiency effect models for 3,894 Thai manufacturing and exporting small and medium size enterprises (SMEs), using 2007 Thai Industrial Census data. Thai manufacturing and exporting SMEs experience decreasing returns to scale even though their technical efficiency in production is found to be relatively high. Results from estimations using both approaches also reveal that firm age, medium-sized enterprises compared with small-sized enterprises, firm location in Bangkok, foreign investment and government assistance are significantly and positively related to firm technical efficiency. Focusing on the technical efficiency of SMEs exporting to different destinations, those exporting to OCEANIA perform the best, followed by SMEs exporting to ASEAN, East Asia, and North and South America, while SMEs exporting to Europe experience no significant effect upon their technical efficiency from doing so, where SMEs exporting to the rest of the world is the base exporting SME group. The results also reveal that SMEs in the chem-icals and related products sector perform the best, followed by SMEs in the machinery and transport equipment sector, where the miscellaneous manufactured articles sector is used as the
base sector. The manufactured goods sector and food, beverages and tobacco sector are also found to perform better than the miscellaneous manufactured articles sector. Finally, the paper also provides useful evidence-based policy recommendations aimed at enhancing the technical efficiency and competi-tiveness of Thai manufacturing and ex-porting SMEs.
Material published as part of this publication, either on-line or in print, is copyrighted by the Informing Science Institute. Permission to make digital or paper copy of part or all of these works for personal or classroom use is granted without fee provided that the copies are not made or distributed for profit or commercial advantage AND that copies 1) bear this notice in full and 2) give the full citation on the first page. It is per-missible to abstract these works so long as credit is given. To copy in all other cases or to republish or to post on a server or to redistribute to lists requires specific permission and payment of a fee. Contact [email protected] to request redistribution permission.
Technical Inefficiency Effects Model for Thai Manufacturing and Exporting Enterprises (SMEs)
364
Keywords: Technical Efficiency; Small and Medium Sized Enterprises; Manufacturing; Thai-land; Stochastic Frontier Analysis; Data Envelopment Analysis
Introduction Exporting is one of the key factors which can enhance a country’s economy towards its sustaina-ble growth, since it can enhance a firm’s production efficiency to overcome higher trade barriers and address different market behaviours in international markets. Thai small and medium sized enterprises (SMEs), however, are still not fully competitive, particularly in foreign markets which require i) efficient production, ii) good managerial skills, market competencies, iii) product and service improvement to meet high global standards, iv) access to skilled labour and high quality products, v) advanced technologies, consumer and environmental accountability, and vi) strong business networks. The competitiveness of Thai industry, particularly SMEs, has not yet moved to a higher production frontier, but has fundamentally relied on low-cost labour and natural re-source (raw materials) advantages rather than technological capabilities or skilled labour.
Thai business segments are now under the “Nut-Cracker Effect”, suggesting that Thailand is now trapped between countries which focus upon greater price competitiveness, such as China, Vi-etnam and Indonesia, and countries which employ skilled labour and higher productivity to dif-ferentiate their outputs by concentrating in higher value-added products and services, such as Ja-pan, South Korea and Taiwan (OSMEP, 2007b). The Organisation for Economic Co-operation and Development (OECD) (2011) also suggested that internationalization is one of the key SME policies which can overcome the problem of a “missing middle” for Thai SMEs. This problem is due to the lack of growth-orientation of Thai small enterprises and the relative under-representation of medium-sized enterprises, leading to a distinctly smaller proportion of medium sized enterprises in its SME population compared to that in OECD countries and other non-OECD Asian countries (OECD, 2011). To address these problems the paper will emphasise the following research questions:
• How do Thai manufacturing SMEs perform in terms of technical efficiency?; • What are the significant factors that can enhance their technical efficiency performance?; • How can the technical efficiency of Thai manufacturing SMEs be enhanced?
In addition, little research has been conducted, with the exception of, for example, Charoenrat et al. (2013), on the competitiveness and efficiency of Thai SMEs. No empirical studies, however, have been conducted to measure the efficiency of Thai exporting and manufacturing SMEs. The key objectives of this paper are to rectify this gap by: (1) empirically estimating the technical ef-ficiency of Thai manufacturing and exporting SMEs which can be categorized into 7 sub-exporting destinations, such as (i) ASEAN, (ii) East Asia, (iii) Europe, (iv) North & South Amer-ica, (v) OCEANIA, and (vi) the rest of the world, and 5 sub-manufacturing sectors, such as (i) food and beverages, (ii) manufactured goods, (iii) chemicals and related products, (iv) machinery and transport equipment, and (v) miscellaneous manufactured articles; (2) identifying firm-specific factors contributing to the technical inefficiency of Thai manufacturing and exporting SMEs; and (3) provide evidence-based policy implications and recommendations to promote Thai manufacturing SME efficiency and competitiveness. This analysis is conducted employing firm-level data obtained from the 2007 industrial census collected by the National Statistical Office of Thailand (NSO).
The structure of the paper is as follows: the next section conducts a brief overview of Thailand’s SMEs. The third section explains the methodology, including the concept of technical efficiency, the stochastic production frontier and inefficiency effects model, and the two-stage data envel-opment analysis, followed by the fourth section which reviews the literature. The fifth section describes the data source and data classification. Empirical models and results are highlighted in
Amornkitvikai, Harvie, & Charoenrat
365
the next two sections, respectively. Policy implications and conclusions are also provided in the final section.
An Overview of Thailand’s Small and Medium Sized Enterprises
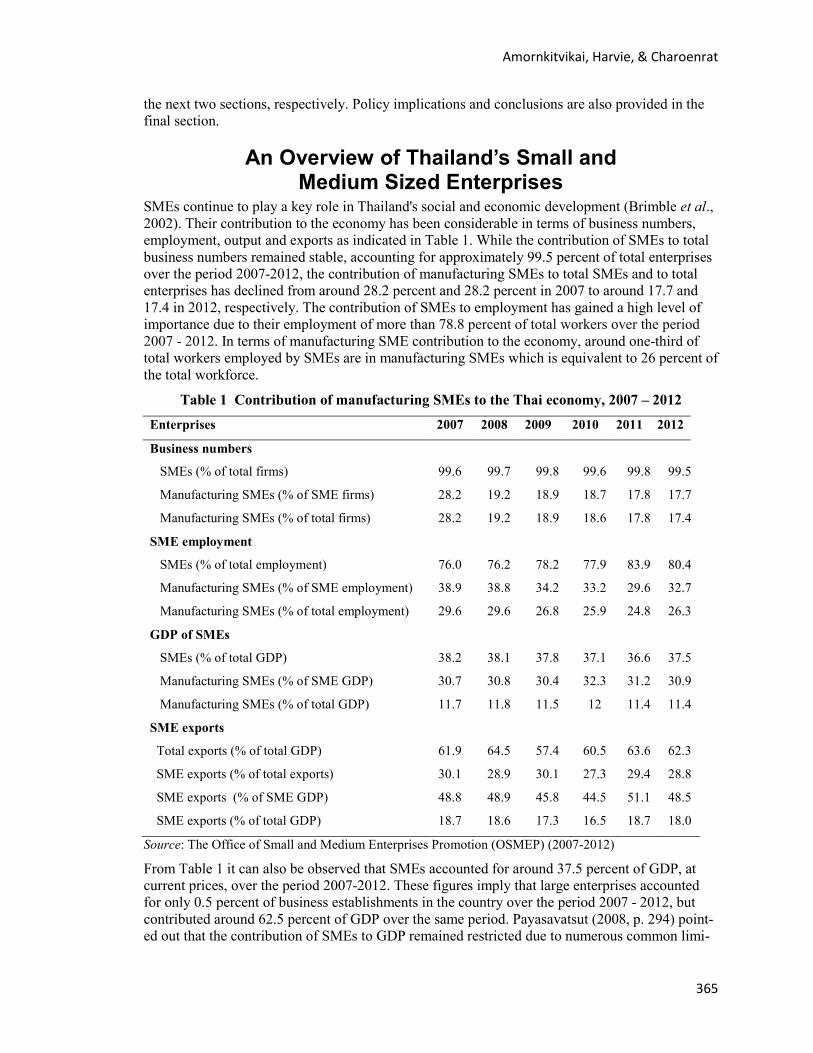
SMEs continue to play a key role in Thailand's social and economic development (Brimble et al., 2002). Their contribution to the economy has been considerable in terms of business numbers, employment, output and exports as indicated in Table 1. While the contribution of SMEs to total business numbers remained stable, accounting for approximately 99.5 percent of total enterprises over the period 2007-2012, the contribution of manufacturing SMEs to total SMEs and to total enterprises has declined from around 28.2 percent and 28.2 percent in 2007 to around 17.7 and 17.4 in 2012, respectively. The contribution of SMEs to employment has gained a high level of importance due to their employment of more than 78.8 percent of total workers over the period 2007 - 2012. In terms of manufacturing SME contribution to the economy, around one-third of total workers employed by SMEs are in manufacturing SMEs which is equivalent to 26 percent of the total workforce.
Table 1 Contribution of manufacturing SMEs to the Thai economy, 2007 – 2012 Enterprises 2007 2008 2009 2010 2011 2012
Business numbers
SMEs (% of total firms) 99.6 99.7 99.8 99.6 99.8 99.5
Manufacturing SMEs (% of SME firms) 28.2 19.2 18.9 18.7 17.8 17.7
Manufacturing SMEs (% of total firms) 28.2 19.2 18.9 18.6 17.8 17.4
SME employment
SMEs (% of total employment) 76.0 76.2 78.2 77.9 83.9 80.4
Manufacturing SMEs (% of SME employment) 38.9 38.8 34.2 33.2 29.6 32.7
Manufacturing SMEs (% of total employment) 29.6 29.6 26.8 25.9 24.8 26.3
GDP of SMEs
SMEs (% of total GDP) 38.2 38.1 37.8 37.1 36.6 37.5
Manufacturing SMEs (% of SME GDP) 30.7 30.8 30.4 32.3 31.2 30.9
Manufacturing SMEs (% of total GDP) 11.7 11.8 11.5 12 11.4 11.4
SME exports
Total exports (% of total GDP) 61.9 64.5 57.4 60.5 63.6 62.3
SME exports (% of total exports) 30.1 28.9 30.1 27.3 29.4 28.8
SME exports (% of SME GDP) 48.8 48.9 45.8 44.5 51.1 48.5
SME exports (% of total GDP) 18.7 18.6 17.3 16.5 18.7 18.0
Source: The Office of Small and Medium Enterprises Promotion (OSMEP) (2007-2012)
From Table 1 it can also be observed that SMEs accounted for around 37.5 percent of GDP, at current prices, over the period 2007-2012. These figures imply that large enterprises accounted for only 0.5 percent of business establishments in the country over the period 2007 - 2012, but contributed around 62.5 percent of GDP over the same period. Payasavatsut (2008, p. 294) point-ed out that the contribution of SMEs to GDP remained restricted due to numerous common limi-
Technical Inefficiency Effects Model for Thai Manufacturing and Exporting Enterprises (SMEs)
366
tations on their operations, such as: a lack of management capabilities, limited access to market information and promotional support from government agencies, a shortage of financial support or working capital, inadequate access to skilled labour, and uncertainties in government support programmes. Similarly, Charoenrat et al. (2013) revealed that SMEs face severe barriers to their future growth and development, which include: access to finance, poor exporting capacity, lim-ited marketing, information technology, innovation and management skills, and experience ex-cessive government bureaucracy and regulations. SMEs, however, still play significant roles and functions in assisting large enterprises, particularly in the context of regional production networks as they help link all important units of industry together, and fill gaps in industrial clusters which might not be completed by large enterprises alone (Mephokee, 2003; Regnier, 2000). They also supply goods, services, information and knowledge for large enterprises, and play a pivotal role in the production process of export goods (Tapaneeyangkul, 2001).
The contribution of exports to growth and development continues to remain important to the Thai economy, constituting around 57 - 64 percent of total GDP over the period 2007 - 2012. In terms of contribution to total exports, however, Thai SMEs have become less important compared with that of large enterprises over the period 2007 – 2012. This contribution was equivalent to 18 per-cent of GDP by 2012 even though they accounted for 99.5 percent of all business establishments in the country1. Consequently, this implies that large enterprises play a leading role in the coun-try’s international trade even though they contributed only 0.5 percent of total enterprises in the country. OSMEP (2011) also pointed out that Thailand’s exports greatly rely on large enterprises, and, therefore, both the public and private sectors should pay attention to promoting greater inter-national trade participation by SMEs. Punyasavatsut (2007) also acknowledged that Thai manu-facturing SMEs were not ready to face the rigours of “international competition” in competitive global markets arising from the country’s increased opening and economic integration, and con-current intense competition from lower labour cost countries. More importantly, Thai business segments, particularly Thai SMEs, are now under the “Nut-Cracker Effect” which implies that Thailand is now trapped between countries with lower price competitiveness, such as China, Vi-etnam and Indonesia and countries with higher value added production and services, such as Ja-pan, South Korea and Taiwan. Finally, OECD (2011) also recommended that internationalisation should be promoted for Thai SMEs, especially Thai small enterprises.
Therefore, measuring the efficiency of Thai exporting and manufacturing SMEs and investigating firm-specific factors affecting their inefficiency are crucial to help understand their lack of com-petitiveness and how to improve this with the objective of alleviating the “Nut-Cracker Effect” on the country. In the following section a review of methodologies such as the concept of technical efficiency, the stochastic production frontier and inefficiency effects models, and data envelop-ment analysis adopted in this study are explained.
Methodology
Concept of Technical Efficiency There are a number of methods that can be used to evaluate firm performance, such as financial performance (financial ratios), output growth, employment generation, export growth, market share, efficiency and productivity. The finance and accounting literature extensively evaluate a firm’s performance by adopting a number of financial ratios. For instance, most enterprises refer to a number of financial or accounting ratios such as profitability ratios, liquidity ratios, market
1 Statistics on the exports of SMEs by sector of activity are not available as the Thai authorities do not compile these.
Amornkitvikai, Harvie, & Charoenrat
367
ratios, and debt ratios to evaluate their business performance. However, they are just the bottom-line performance indicators as they are, in fact, influenced by how firms perform on their effi-ciency and productivity, and how input and product prices change (Fried et al., 2008). Therefore, a firm’s efficiency and productivity performance is at the core of its financial achievement. This paper, therefore, employs the concept of technical efficiency to measure a firm’s performance, which is defined as the capacity and ability of a firm to produce the maximum possible output from a given bundle of inputs and a given technology (Coelli et al., 2005). A firm's operation is technically efficient when it operates on the efficient production frontier, but its operation be-comes technically inefficient when it is located beneath this frontier. Moreover, measuring effi-ciency and sources affecting firm inefficiency can be used to identify and separate controllable and uncontrollable sources of performance variation, and, therefore, assist in the design of appro-priate government policies and recommendations (Fried et al., 2008). This measurement of a firm’s performance differs from allocative efficiency which refers to the ability and willingness of a firm to equate its marginal revenue with its marginal cost (Kalirajan and Shand, 1999). The concept of efficiency also differs from the term "productivity" which refers to “total factor productivity”. Productivity is defined as the ratio of the change in total output over the change in total inputs (Coelli et al., 2005). In addition, a firm can be technically efficient but can improve its productivity by changing its scale of operations. The stochastic production frontier which re-quires a set of inputs and an output to measure a firm's technical efficiency will be discussed next. Moreover, an inefficiency effects model is employed in the study which will be used to link a set of explanatory firm-specific variables with a firm's technical inefficiency and is also now dis-cussed.
The Stochastic Production Frontier and an Inefficiency Effects Model Two approaches can be adopted to measure a firm’s technical efficiency: a non-parametric ap-proach such as Data Envelopment Analysis (DEA) or a parametric approach such as Stochastic Frontier Analysis (SFA). In contrast to the DEA approach, SFA requires functional forms in order to obtain the efficient production frontier, and assumes that firms may deviate from this not only because of technical inefficiency but also due to measurement errors, statistical noise or other non-systematic influences (Admassie & Matambalya 2002). SFA also requires strong distribution assumptions for both statistical random errors (i.e., normal distribution) and non-negative tech-nical-inefficiency random variables. The DEA approach, however, does not impose functional forms; moreover, it uses linear programming to construct a frontier that envelops the data on all firms. Hence, all firms are compared to the firms that perform the "best". DEA overcomes re-strictions on the production and distribution of various residuals, as well as a small number of observations. DEA, therefore, can be used to predict technical efficiency for the first stage of this study, which involves the use of a linear programming method to construct a non-parametric piece-wise surface (or frontier) over the data (Coelli et al., 2005, p. 162).
Aigner, Lovell, and Schmidt (1977) and Meeusen and van den Broeck (1977) independently pro-posed the basic stochastic production frontier within a cross-sectional context. Their models con-sist of two error components. The first error component, 𝑣𝑖2 , allows random variation of the fron-tier across firms. In other words it captures the effects of the omission of relevant variables, ran-dom shocks outside the firm’s control, measurement errors, and approximation errors associated with the use of wrong functional forms (see Førsund et al., 1980, p.13; Coelli et al., 2005, pp.
2 The error component 𝑣𝑖 is assumed to be independently and identically distributed as N (0, 2
Vσ ).
Technical Inefficiency Effects Model for Thai Manufacturing and Exporting Enterprises (SMEs)
368
242-243). The second error component, 𝑢𝑖3 , captures the effects of inefficiency relative to the stochastic frontier. For instance, the following equation represents the log-linear Cobb-Douglas stochastic frontier model version ( 𝑙𝑛𝑦𝑖 = 𝛽0 + 𝛽1𝑙𝑛𝑥𝑖 + 𝑣𝑖 − 𝑢𝑖), which consists of three main components: (i) a deterministic component (𝑙𝑛𝑦𝑖 = 𝛽0 + 𝛽1𝑙𝑛𝑥𝑖), (ii) a noise effect (𝑣𝑖), and (iii) an inefficiency effect ( 𝑢𝑖 ) (Coelli et al., 2005, p. 243). Battese and Coelli (1995) present a model in an attempt to capture technical inefficiency using “panel data”, where inefficiency effects are stochastic and the model also allows for the estimation of both technical change in the stochastic frontier and time-varying technical inefficiencies. The parameterisation from Battese and Corra (1977) is used in the Battese and Coelli model, replacing 𝜎𝑣2 and 𝜎𝑢2 with 𝜎2 = 𝜎𝑣2 + 𝜎𝑢2 and 𝛾 = 𝜎𝑢2/𝜎2. In their model the technical efficiencies of production can be predicted using the conditional expectations of exp (−𝑢𝑖𝑡), given the composed error term of the stochastic frontier. Hence, given the above assumptions, the technical efficiency of the ith firm can be defined as TEit 4
= exp (−𝑢𝑖𝑡 ) = exp (−𝑍𝑖𝑡𝛿 −𝑤𝑖𝑡).
Focusing upon SFA this paper, therefore, applies the Battese and Coelli (1995) model in a cross-sectional context to measure a firm's technical efficiency and investigate firm-specific factors im-pacting upon a firm's inefficiency. FRONTIER 4.1 developed by Coelli (1996) is used to estimate a firm’s technical efficiency as well as an inefficiency model measured by a one-step process in the study.
Data Envelopment Analysis: The Two-stage DEA Analysis For the DEA approach there are two assumptions regarding returns to scale such as variable re-turns to scale (VRS) and constant returns to scale (CRS). The CRS assumes that firms are operat-ing at an optimal scale, but the VRS assumes that firms are not operating at an optimal scale due to imperfect competition, government intervention, and financial constraints (Coelli et al., 2005). In addition, there are two common orientations, input and output, using DEA models. Input-orientated models measure technical efficiency as a proportional reduction in input usage, but output levels are fixed. Input orientation is useful when firms have fixed output levels, and, there-fore, where they are forced to minimize their input usage. On the other hand output-orientated models identify technical efficiency as a proportional increase in output production, where input levels are constant. Output orientation is appropriate when firms have fixed input amounts, and hence they are forced to maximize output production.
In this study the VRS linear programming under the output orientated model is used, which can be written as follows (Coelli et al., 2005, p.180):
𝑀𝑎𝑥𝜑,𝜆 𝜑,
st −𝜑𝑦𝑖 + 𝑌𝜆 ≥ 0, i=1,2,….,n,
𝑥𝑖 − 𝑋𝜆 ≥ 0,
I1′𝜆 ≤ 1,
𝜆 ≥ 0, (1)
3 The error component 𝑢𝑖 is also assumed to be distributed independently of 𝑣𝑖, and 𝑢𝑖 is non-negative (𝑢𝑖 ≥ 0). 4 If a firm has an inefficiency effect equal to zero, technical efficiency equals one.
Amornkitvikai, Harvie, & Charoenrat
369
Where:
𝜑 is a scalar. 1 ≤ 𝜑 < 0, and 𝜑 − 1 is the proportional increase in outputs (𝑦𝑖) which can be ob-tained for the 𝑖𝑡ℎ firm, while holding input amounts (𝑥𝑖) constant.
1𝜑
is the efficiency score for the 𝑖𝑡ℎ firm.
𝑥𝑖 is an input vector for the 𝑖𝑡ℎ firm. 𝝀 is a vector of constants.
I1′𝜆 ≤ 1 defines non-increasing returns to scale (NIRS).
The DEA problem under Equation (1), for instance, takes the firm i, and radially expands the out-put vector of the firm i (𝑦𝑖) as much as possible, while still remaining within the feasible output set. The inner-boundary of this output set is a piece-wise linear production possibility curve which is determined by all the firms in the sample. The DEA model in linear programming (1) also replaces the convexity constraint which is imposed for the VRS: I1′𝜆 = 1 for I1′𝜆 ≤ 1. The modified I1′𝜆 ≤ 1 indicates that the VRS can only be non-increasing (Coelli et al., 2005). In oth-er words the constraint: I1′𝜆 ≤ 1 is set to ensure that the 𝑖𝑡ℎ firm is compared with firms that are smaller than it (Coelli et al., 2005, p.174). One problem of the piece-wise linear frontier in DEA is that firms operating parallel to the axes causes the problem of “slacks”. For the output-orientated model this problem is also known as “output slack” (or output excess), since a firm’s production can be increased without using any more inputs. There are a number of methods that can be used to treat the problem of slack (e.g., one-stage DEA, two-stage DEA, and multi-stage DEA). Therefore, multiple-stage DEA is used to treat this problem, since it is invariant to units of measurement and its efficient projected points have input and output mixes that are similar to those of the inefficient points as strongly recommended by Coelli et al. (2005). The second stage of the two-stage DEA model is conducted by regressing firm-specific variables on the firm’s VRS technical inefficiency scores which are predicted from the first step of the two-stage DEA model. The set of firm-specific variables are used as independent variables for the two-stage DEA model. The estimated inefficiency scores are normally bounded between zero and one. A review of the literature regarding firm-specific factors is one of the important sections, since this section ex-plores possible significant sources of a firm's technical inefficiency and is discussed next.
Literature Review This section provides a review of the literature regarding the factors that affect a firm’s technical efficiency, such as i) firm age, ii) firm size, iii) foreign investment (ownership), iv) firm location, v) exports, vi) research and development (R&D), and vii) government assistance as follows:
Firm Age With respect to empirical studies the effect of firm age on technical efficiency is still inconclu-sive, depending on countries and sectors. Burki and Terrell (1998) used two-stage Data Envelop-ment Analysis (DEA) to investigate factors that affect the efficiency of 153 Pakistani small manu-facturing firms. They found that firm age has a significant and positive effect upon efficiency. However, Tran et al. (2008) used firm-level data in Vietnam in 1996 and 2001 and found that firm age has an insignificant and negative effect on technical efficiency, indicating no evidence of a “learning by doing” experience. However, they suggested that the negative result does not mean that a “learning by doing” experience is not important in Vietnam, but young firms are likely to benefit more from advanced technology rather than from a “learning by doing” process. Similar-ly, Le and Harvie (2010) used large surveys of domestic non-state manufacturing SMEs in 2002,
Technical Inefficiency Effects Model for Thai Manufacturing and Exporting Enterprises (SMEs)
370
2005 and 2007 to examine the technical efficiency performance in Vietnam, and found that older manufacturing SMEs are likely to be technically inefficient5.
Firm Size Focusing on the effect of firm size on technical efficiency, empirical results are still ambiguous depending on countries and sectors analysed. Alvarez and Crespi (2003) found for 1,091 Chilean manufacturing small firms that larger firms are more efficient than small ones, since small firms are likely to have the following difficulties: (i) difficulty in accessing external loans for their in-vestments, (ii) they lack efficient resources (e.g., human capital), (iii) they lack economies of scale, and (iv) they lack formal contracts with customers and suppliers. Similarly, Harvie (2002) also mentioned that there are five main difficulties obstructing SME development, such as (i) ac-cess to markets, (ii) access to technology, (iii) access to human resources, (iv) access to financing, and (v) access to information. An empirical study of Vietnamese SMEs by Le and Harvie (2010) found that larger Vietnamese manufacturing SMEs tend to be technically inefficient compared to small ones. They explained that small firms are more efficient due to flexibility in diversifying and adjusting their businesses and activities in a rapidly changing transition economy.
Foreign Investment (Ownership) Foreign investment (via the form of ownership) has increasingly become important for the en-hancement of firm technical efficiency, since it brings superior technology, managerial expertise, good corporate governance, and a strong foreign - market network (Kimura and Kiyota, 2007). A number of empirical studies have also found a positive association between foreign investment (foreign ownership) and technical efficiency (Fukuyama et al., 1999; Goldar et al., 2003; Bottasso and Sembenelli, 2004). However, Pham et al. (2010) used the Vietnam Enterprise Survey (VES) in 2003 to examine the determinants of efficiency, and found foreign-invested enterprises (FIEs) to be less technically efficient than local-level state owned enterprises. They argued that the rea-son for this unexpected result is that FIEs on average are younger than those in other sectors. Hence, learning by doing is weaker.
Firm Location Firm location is also another important determinant for a firm's technical efficiency, since firms in different locations are likely to have varying technical efficiency. Empirical results are found to be inconclusive. For instance, Le and Harvie (2010) found that manufacturing SMEs located in urban centres in Vietnam had lower technical efficiency compared with SMEs located in rural areas in a survey conducted in 2005, due to higher costs for land, labour and space constraints, but such significant evidence is not found for surveys conducted in 2002 and 2007. However, Tran et al. (2008) found that firms located in metropolitan areas are more technically efficient than their counterparts located in less developed areas in all Vietnamese manufacturing sectors, except in the miscellaneous industries sector. Their result implies that SMEs in metropolitan areas have higher technical and managerial training, educational level, and market opportunities than their non metropolitan counterparts (Tran et al., 2008).
Exports A number of empirical studies have also investigated the effect of export participation on a firm’s technical efficiency (the learning-by-exporting hypothesis). Kim (2003) found that exports posi-
5 Due to using old technology or that they existed in an environment lacking in competition and where state ownership dominated.
Amornkitvikai, Harvie, & Charoenrat
371
tively affect technical efficiency for the food and paper industries, but such a finding is not found in the textile, chemical, and fabrication industries for Korean manufacturing industries. Dilling-Hansen et al. (2003) found no effect of exports on firm technical efficiency for 2,370 Danish firms. Granér and Isaksson (2007) found that exports significantly increased the technical effi-ciency of Kenyan manufacturing firms. However, Alvarez and Crespi (2003) found that an out-ward orientation (firms that sell mainly to foreign markets) has no significant impact on a firm’s efficiency for Chilean manufacturing small firms. Le and Harvie (2010) also found no significant evidence supporting a learning-by-exporting hypothesis for Vietnamese manufacturing SMEs.
Research and Development (R&D) Focusing on research and development (R&D) a number of empirical studies have found that R&D has a positive effect on a firm’s technical efficiency (Aw and Batra, 1998; Dilling-Hansen et al., 2003; Kim, 2003; Sheu and Yang, 2005). Kim (2003) found that the ratio of R&D spending to total output has a significant and positive association with a firm’s technical efficiency for the textile and chemical industries in Korea, but such a relationship was not found in the fabrication industry. Sheu and Yang (2005) also found that R&D, as measured by annual R&D expenditure deflated by the general Wholesale Price Index (WPI), positively influences technical efficiency in Taiwan’s electronics industry.
Government Assistance The effect of government assistance on a firm’s technical efficiency has been examined in a number of empirical studies. Government assistance can be, for example, in the form of financial support (e.g., credit assistance, income tax exemption or reduction, and exemption from import duty on essential raw materials) and non-financial support (e.g., managerial and technical assis-tance, and training support). Empirical results are still inconclusive depending on countries and sectors. For instance, Tran et al. (2008) found that the effect of direct government support (e.g., government credit assistance and government technical support) on firm performance varied across years and industries in Vietnam. They found a positive effect of “government credit assis-tance” on technical efficiency for the machinery and transport equipment sector and also miscel-laneous industries sector in 1996. Their empirical results also revealed that “government technical support” has a significant and positive effect on the technical efficiency for the machinery and transport sector in 1996, and for (i) food processing and (ii) miscellaneous manufacturing sectors in 2001. In addition, Le and Harvie (2010) found that government assistance in the form of land, premises, and credit are found to have a significant and negative effect on the technical efficiency of Vietnamese manufacturing SMEs for surveys conducted in 2002, 2005, and 2007, but signifi-cant and positive evidence is only found for government credit assistance for newly established SMEs in the 2002 survey.
The next section discusses the data source used in this study, which is obtained from the 2007 Thai Industrial Census. The classification of the data into SMEs and sub-manufacturing sectors is also discussed in the following section.
Data Source and Data Classification The 2007 Thai Industrial Census is used to conduct the empirical analysis for this study, which consists of 73,931 firms across all regions in Thailand. This Industrial Census is conducted by the National Statistical Office (NSO) every 10 years. Thailand’s small and medium sized enterprises (SMEs) can be defined using two measures: (i) the number of employees or (ii) the level of fixed assets. Focusing on the Thai manufacturing sector, an enterprise which either employs less than 50 workers or has fixed assets with a value not exceeding 50 million baht is considered as a small enterprise. In addition, an enterprise which either employs between 51 and 200 workers or has
Technical Inefficiency Effects Model for Thai Manufacturing and Exporting Enterprises (SMEs)
372
fixed assets with a value between 51 and 200 million baht is defined as a medium sized enter-prise. With respect to this criterion enterprises which have 200 or less workers are selected as SMEs for this study. As a result, 70,355 enterprises are defined as SMEs, accounting for 95.16 percent of total manufacturing enterprises. This paper, however, only focuses on exporting SMEs, since it aims to investigate and compare technical efficiency among SMEs exporting to different destinations and also SMEs in different sub-manufacturing sectors besides examining the effects of firm-specific variables on the technical efficiency of exporting SMEs. As a result, 3,894 ex-porting SMEs are selected from 70,355 manufacturing SMEs, accounting for 5.53 percent of total manufacturing SMEs.
The selection of output and input variables in this study caused 109 exporting SMEs to be ex-cluded from the sample due to a negative value for “value added” output, and unusual observed values for labour and capital inputs (e.g., fixed assets are recorded as 1 baht, or there are no workers in the firm). As a result of this 3,785 exporting SMEs are used to conduct the empirical analysis for this study. The classification of sub-manufacturing sectors used in the empirical anal-ysis is also based on the Standard International Trade Classification (SITC), since it has been de-veloped by the UN for the purpose of compiling international trade statistics of all commodities entering international trade, and hence it is suitable for this study which focuses on exporting SMEs. These SMEs can be classified as being in the following sub manufacturing sectors: (i) food, beverage and tobacco, (ii) chemicals and related products, (iii) manufactured products, (iv) machinery and transport equipment, and (v) miscellaneous manufactured articles.
The following section is very important, since it focuses on how the stochastic production frontier and inefficiency effects as well as the data envelopment analysis based on the two stage DEA are identified in this study. All of the variables used in the models are also identified in the following section.
Empirical Models
The Stochastic Production Frontier and Inefficiency Effects Model Battese and Coelli (1995) presented a model for capturing technical inefficiency using SFA based on “panel data”. Their model assumes that the inefficiency effects are stochastic, and also allows for the estimation of both technical change in the stochastic frontier and time-varying technical inefficiencies (Battese and Coelli, 1995, p. 326). For this study the Battese and Coelli (1995) model can be applied in the context of cross section data by relaxing the time trend from their model. In other words, the cross section data from the 1997 Thai Industrial Census is used in the context of the Battese and Coelli (1995) model.
Consider the stochastic frontier production function for cross sectional data,
i i i iY =exp (X β+V -U ) (2)
The above equation specifies the stochastic frontier function in terms of the original production values. Where; iY is the production (output) of the ith firm; iX is a (1×X) vector of inputs of production used in the production of the ith firm, and other explanatory variables associated with the ith firm; β is a (k × 1) vector of unknown parameters; the iV s6 are assumed to be iid N (0, σ2)
6 Note that iV measures the shortfall in output iY from its maximum value given by the stochastic frontier,
( ) +i if X Vβ
Amornkitvikai, Harvie, & Charoenrat
373
random errors, independently distributed of the non - negative random variables( iU s); iU s are non-negative random variables, associated with technical inefficiency of production, and are as-sumed to be independently distributed such that iU is obtained by truncation (at zero) of the normal distribution with mean, Ziδ, and variance, σ2.
The Battese and Coelli (1995) model consists of two main components. The first component ex-plained in Equation (2) is to estimate the stochastic frontier production function which contains two random errors: (i) random errors (𝑉𝑖𝑠) and (ii) non-negative random variables (𝑈𝑖𝑠). The first random errors, which are assumed to be independently and identically distributed normal random variables with zero means and variances, 𝜎𝑣2 (𝑉𝑖 ~ 𝑖𝑖𝑑 𝑁(0,𝜎𝑣2)), can be observed, for instance, when the problems of omitted variables and model misspecification arise. The second non-negative random variables which are assumed to be independently and identically distributed normal random variables as truncations at zero with Zi𝛿 means and variances 𝜎𝑢2 (𝑈𝑖 ~ 𝑖𝑖𝑑 𝑁(0,𝜎𝑢2)) are known as the technical inefficiency effects. In addition, these two random variables are assumed to be independently distributed for all firms (i=1,2,….,N). The second component, as specified in Equation (3), links firm-specific variables (i.e., types of firm ownership, firm age, and firm size) with the inefficiency effects or the non-negative random vari-ables. In other words, this part aims to examine what firm-specific variables significantly affect the firm’s inefficiency. The technical inefficiency effect iU in the stochastic frontier model shown in Equation (3) could be specified as in the following equation:
iU = Ziδ + Wi (3)
Where; Zi is a (1×m) vector of explanatory variables associated with technical inefficiency ef-fects; δ is an (m ×1) vector of unknown coefficients to be estimated; Wi is the unobserved random variables, which are assumed to be independently and identically distributed, obtained by trunca-tion of a normal distribution with zero mean and unknown variance, σ2 (iid N(0, σ2 )), such that
iU is non-negative ( i.e., Wi ≥ -Ziδ).
In addition, the method of maximum likelihood (ML), which has desirable large sample (or as-ymptotic) properties, is proposed for simultaneous estimation of the parameters of the stochastic frontier and the model for the technical inefficiency effects. More specifically, the ML estimator is consistent and asymptotically efficient (Coelli, 2005, p. 218). The likelihood function is ex-pressed in terms of the variance parameters: σs
2 ≡ σv2 + σu
2 and γ ≡ σu2 / σs
2. Where the γ parame-ter represents the share of inefficiency in the overall residual variance, and has a value between zero and one. The technical efficiencies of production are predicted using the conditional expecta-tions of exp (- iU ), given the composed error term of the stochastic frontier. In other words the technical efficiency measures the output of the ith firm relative to the output that could be pro-duced by a fully-efficient firm using the same inputs (Coelli et al, 2005, p. 244). Therefore, the technical efficiency of the ith firm can be defined as follows:
TEi 7 = exp (- iU ) = exp (-Ziδ - Wi) (4)
FRONTIER 4.1 is used to estimate the technical efficiency of Thai manufacturing and exporting enterprises, which utilizes the parameterisation from Battese and Corra (1977) by replacing 𝜎𝑣2 and 𝜎𝑢2 with 𝜎2 = 𝜎𝑣2+𝜎𝑢2 and 𝛶 = 𝜎𝑢2/(𝜎𝑣2+𝜎𝑢2). Applying the model of Battese and Coelli (1995), the stochastic frontier production functions in the Cobb-Douglas and translog functional forms are tested for adequate functional form. The Cobb-Douglas functional form can be written as:
7 If a firm has an inefficiency effect equal to zero, technical efficiency equals one.
Technical Inefficiency Effects Model for Thai Manufacturing and Exporting Enterprises (SMEs)
374
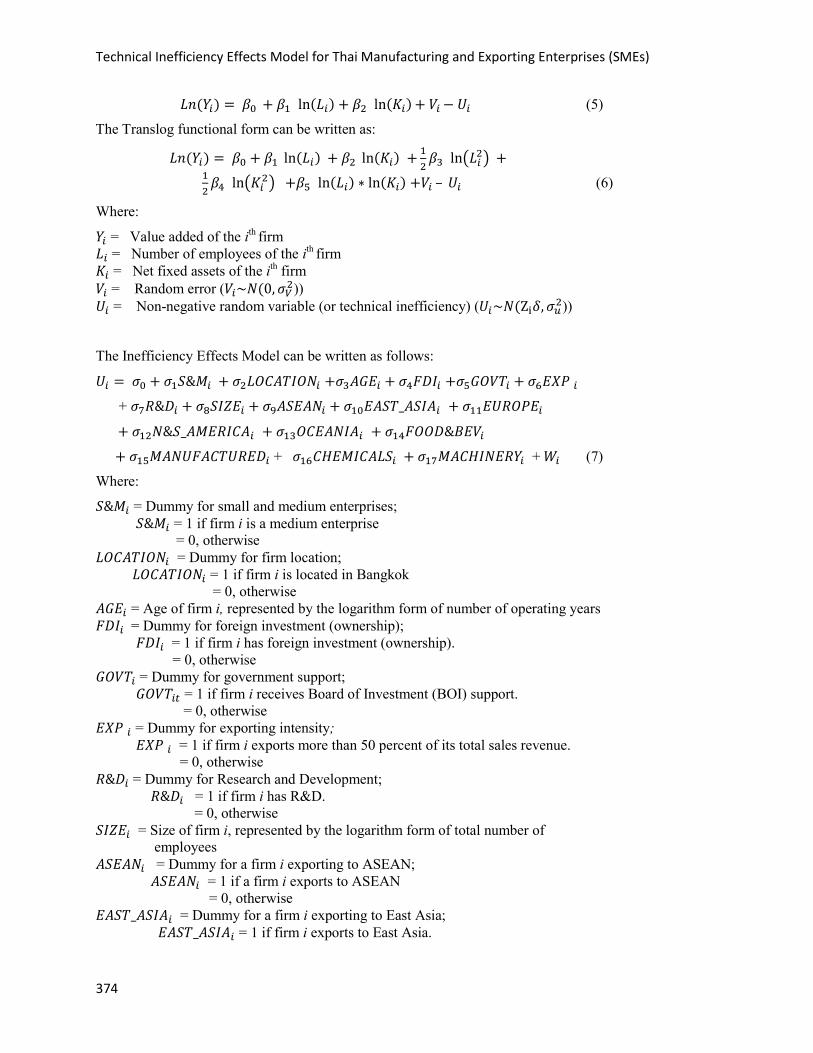
𝐿𝑛(𝑌𝑖) = 𝛽0 + 𝛽1 ln(𝐿𝑖) + 𝛽2 ln(𝐾𝑖) + 𝑉𝑖 − 𝑈𝑖 (5)
The Translog functional form can be written as:
𝐿𝑛(𝑌𝑖) = 𝛽0 + 𝛽1 ln(𝐿𝑖) + 𝛽2 ln(𝐾𝑖) + 12𝛽3 ln�𝐿𝑖2� +
12𝛽4 ln�𝐾𝑖2� +𝛽5 ln(𝐿𝑖) ∗ ln(𝐾𝑖) +𝑉𝑖 – 𝑈𝑖 (6)
Where:
𝑌𝑖 = Value added of the ith firm 𝐿𝑖 = Number of employees of the ith
firm 𝐾𝑖 = Net fixed assets of the ith firm 𝑉𝑖 = Random error (𝑉𝑖~𝑁(0,𝜎𝑉2)) 𝑈𝑖 = Non-negative random variable (or technical inefficiency) (𝑈𝑖~𝑁(Zi𝛿,𝜎𝑢2))
The Inefficiency Effects Model can be written as follows:
𝑈𝑖 = 𝜎0 + 𝜎1𝑆&𝑀𝑖 + 𝜎2𝐿𝑂𝐶𝐴𝑇𝐼𝑂𝑁𝑖 +𝜎3𝐴𝐺𝐸𝑖 + 𝜎4𝐹𝐷𝐼𝑖 +𝜎5𝐺𝑂𝑉𝑇𝑖 + 𝜎6𝐸𝑋𝑃 𝑖
+ 𝜎7𝑅&𝐷𝑖 + 𝜎8𝑆𝐼𝑍𝐸𝑖 + 𝜎9𝐴𝑆𝐸𝐴𝑁𝑖 + 𝜎10𝐸𝐴𝑆𝑇_𝐴𝑆𝐼𝐴𝑖 + 𝜎11𝐸𝑈𝑅𝑂𝑃𝐸𝑖
+ 𝜎12𝑁&𝑆_𝐴𝑀𝐸𝑅𝐼𝐶𝐴𝑖 + 𝜎13𝑂𝐶𝐸𝐴𝑁𝐼𝐴𝑖 + 𝜎14𝐹𝑂𝑂𝐷&𝐵𝐸𝑉𝑖
+ 𝜎15𝑀𝐴𝑁𝑈𝐹𝐴𝐶𝑇𝑈𝑅𝐸𝐷𝑖 + 𝜎16𝐶𝐻𝐸𝑀𝐼𝐶𝐴𝐿𝑆𝑖 + 𝜎17𝑀𝐴𝐶𝐻𝐼𝑁𝐸𝑅𝑌𝑖 + 𝑊𝑖 (7)
Where:
𝑆&𝑀𝑖 = Dummy for small and medium enterprises; 𝑆&𝑀𝑖 = 1 if firm i is a medium enterprise = 0, otherwise 𝐿𝑂𝐶𝐴𝑇𝐼𝑂𝑁𝑖 = Dummy for firm location; 𝐿𝑂𝐶𝐴𝑇𝐼𝑂𝑁𝑖 = 1 if firm i is located in Bangkok = 0, otherwise 𝐴𝐺𝐸𝑖 = Age of firm i, represented by the logarithm form of number of operating years 𝐹𝐷𝐼𝑖 = Dummy for foreign investment (ownership); 𝐹𝐷𝐼𝑖 = 1 if firm i has foreign investment (ownership). = 0, otherwise 𝐺𝑂𝑉𝑇𝑖 = Dummy for government support; 𝐺𝑂𝑉𝑇𝑖𝑡 = 1 if firm i receives Board of Investment (BOI) support. = 0, otherwise 𝐸𝑋𝑃 𝑖 = Dummy for exporting intensity; 𝐸𝑋𝑃 𝑖 = 1 if firm i exports more than 50 percent of its total sales revenue. = 0, otherwise 𝑅&𝐷𝑖 = Dummy for Research and Development; 𝑅&𝐷𝑖 = 1 if firm i has R&D. = 0, otherwise 𝑆𝐼𝑍𝐸𝑖 = Size of firm i, represented by the logarithm form of total number of employees 𝐴𝑆𝐸𝐴𝑁𝑖 = Dummy for a firm i exporting to ASEAN; 𝐴𝑆𝐸𝐴𝑁𝑖 = 1 if a firm i exports to ASEAN = 0, otherwise 𝐸𝐴𝑆𝑇_𝐴𝑆𝐼𝐴𝑖 = Dummy for a firm i exporting to East Asia; 𝐸𝐴𝑆𝑇_𝐴𝑆𝐼𝐴𝑖 = 1 if firm i exports to East Asia.
Amornkitvikai, Harvie, & Charoenrat
375
= 0, otherwise 𝐸𝑈𝑅𝑂𝑃𝐸𝑖 = Dummy for a firm i exporting to Europe8; 𝐸𝑈𝑅𝑂𝑃𝐸𝑖 = 1 if firm i exports to Europe. = 0, otherwise 𝑁&𝑆_𝐴𝑀𝐸𝑅𝐼𝐶𝐴𝑖 = Dummy for a firm i exporting to North and South America; 𝑁&𝑆_𝐴𝑀𝐸𝑅𝐼𝐶𝐴𝑖 = 1 if firm i exports to North and South America. = 0, otherwise 𝑂𝐶𝐸𝐴𝑁𝐼𝐴𝑖 = Dummy for a firm i exporting to OCEANIA; 𝑂𝐶𝐸𝐴𝑁𝐼𝐴𝑖 = 1 if firm i exports to OCEANIA. = 0, otherwise 𝐹𝑂𝑂𝐷&𝐵𝐸𝑉𝑖 = Dummy for a firm i in the food and beverages sector; 𝐹𝑂𝑂𝐷&𝐵𝐸𝑉𝑖 = 1 if firm i is in the food and beverages sector. = 0, otherwise 𝑀𝐴𝑁𝑈𝐹𝐴𝐶𝑇𝑈𝑅𝐸𝐷𝑖 = Dummy for a firm i in the manufactured goods sector; 𝑀𝐴𝑁𝑈𝐹𝐴𝐶𝑇𝑈𝑅𝐸𝐷𝑖 = 1 if firm i is in the manufactured goods sector. = 0, otherwise 𝐶𝐻𝐸𝑀𝐼𝐶𝐴𝐿𝑆𝑖 = Dummy for a firm i in the chemicals and related products sector; 𝐶𝐻𝐸𝑀𝐼𝐶𝐴𝐿𝑆𝑖 = 1 if firm i is in the chemicals and related products sector. = 0, otherwise
𝑀𝐴𝐶𝐻𝐼𝑁𝐸𝑅𝑌𝑖 = Dummy for a firm i in the machinery and transport equipment sector; 𝑀𝐴𝐶𝐻𝐼𝑁𝐸𝑅𝑌𝑖 = 1 if firm i is in the machinery and transport equipment sector. = 0, otherwise 𝑊𝑖 = Random error ((𝑊𝑖~𝑁(0,𝜎𝑊2 ))
Basic descriptive statistics for all the variables mentioned above are provided in Appendix A. Finally, the two-stage data envelopment analysis (DEA) is also modelled in the following sub-section which uses variable returns to scale (VRS) linear programming under the output orientat-ed model to measure a firm's inefficiency score for the first stage, and links a set of firm-specific variables on a firm's technical inefficiency using the maximum likelihood Tobit model.
The Two-Stage Data Envelopment Analysis (DEA) This study employs VRS linear programming under the output orientated model, which can be written in Equation (1) to measure the technical efficiency of Thai manufacturing and exporting enterprises. The multiple-stage DEA, which is strongly recommended by Coelli et al. (2005), is used to treat the problem of output slack (or output excess) for the first-stage of the two-stage DEA model, since a firm’s production can be increased without using any more inputs. The sec-ond stage of the two-stage DEA model is conducted by regressing firm-specific variables on the firm’s VRS technical inefficiency scores which are predicted from the first step of the two-stage DEA model. The set of firm-specific variables are used as explanatory variables for the two-stage DEA model. The estimated inefficiency scores are normally bounded between zero and one. Ap-plying the method of Ordinary Least Squares (OLS) with such a dependent variable that its values are bounded between zero and one will lead to biased and inconsistent estimators, since the OLS
8 European countries include EU and non-EU members. For this study the EU countries consist of Austria, Belgium, Bulgaria, Cyprus, Czech Republic, Denmark, Estonia, Finland, France, Germany, Greece, Hunga-ry, Ireland, Italy, Netherlands, Poland, Portugal, Romania, Spain, Sweden, and the United Kingdom. The non-EU members consist of Andorra, Bosnia and Herzegovina, Croatia, Iceland, Norway, Russian Federa-tion, Switzerland, Turkey, and Ukraine.
Technical Inefficiency Effects Model for Thai Manufacturing and Exporting Enterprises (SMEs)
376
method is likely to predict inefficiency scores which are greater than one (Coelli et al., 2005; Kumbhakar and Lovell, 2000). Hence, the Maximum Likelihood estimation for a two-limit Tobit model9 is adopted (Hoff, 2006; McDonald, 2009), which is given as follows:
(1 − 𝜃𝑖∗) = 𝜎0 + 𝜎1𝑆&𝑀𝑖 + 𝜎2𝐿𝑂𝐶𝐴𝑇𝐼𝑂𝑁𝑖 +𝜎3𝐴𝐺𝐸𝑖 + 𝜎4𝐹𝐷𝐼𝑖 +𝜎5𝐺𝑂𝑉𝑇𝑖 + 𝜎6𝐸𝑋𝑃 𝑖+
𝜎7𝑅&𝐷𝑖 + 𝜎8𝑆𝐼𝑍𝐸𝑖 + 𝜎9𝐴𝑆𝐸𝐴𝑁𝑖 + 𝜎10𝐸𝐴𝑆𝑇_𝐴𝑆𝐼𝐴𝑖 + 𝜎11𝐸𝑈𝑅𝑂𝑃𝐸𝑖 + 𝜎12𝑁&𝑆_𝐴𝑀𝐸𝑅𝐼𝐶𝐴𝑖 + 𝜎13𝑂𝐶𝐸𝐴𝑁𝐼𝐴𝑖 + 𝜎14𝐹𝑂𝑂𝐷&𝐵𝐸𝑉𝑖 + 𝜎15𝑀𝐴𝑁𝑈𝐹𝐴𝐶𝑇𝑈𝑅𝐸𝐷𝑖+ 𝜎16𝐶𝐻𝐸𝑀𝐼𝐶𝐴𝐿𝑆𝑖 + 𝜎17𝑀𝐴𝐶𝐻𝐼𝑁𝐸𝑅𝑌𝑖+ 𝜀𝑖 (8)
(1 − 𝜃𝑖) = � (1 − 𝜃𝑖
∗ ) 𝑖𝑓 0 < (1 − 𝜃𝑖∗) < 1
0 𝑖𝑓 (1 − 𝜃𝑖∗) ≤ 0
1 𝑖𝑓 (1 − 𝜃𝑖∗) ≥ 1
Where:
(1 − 𝜃𝑖∗ ) = Unobserved inefficiency scores of firm i.
(1 − 𝜃𝑖) = Observed inefficiency scores of firm i. 𝜎𝑖 = Unknown parameter to be estimated for each business environment or firm- specific variable i.
The SFA and DEA models discussed in this section are examined in the following section which provides i) the results of hypothesis tests obtained from Equations 5 to 7, ii) the results of a simul-taneous estimation between the stochastic production frontier and inefficiency effects model, and iii) the results of the two-stage data envelopment analysis, and iv) a comparison between the SFA and DEA models.
Results and Discussion
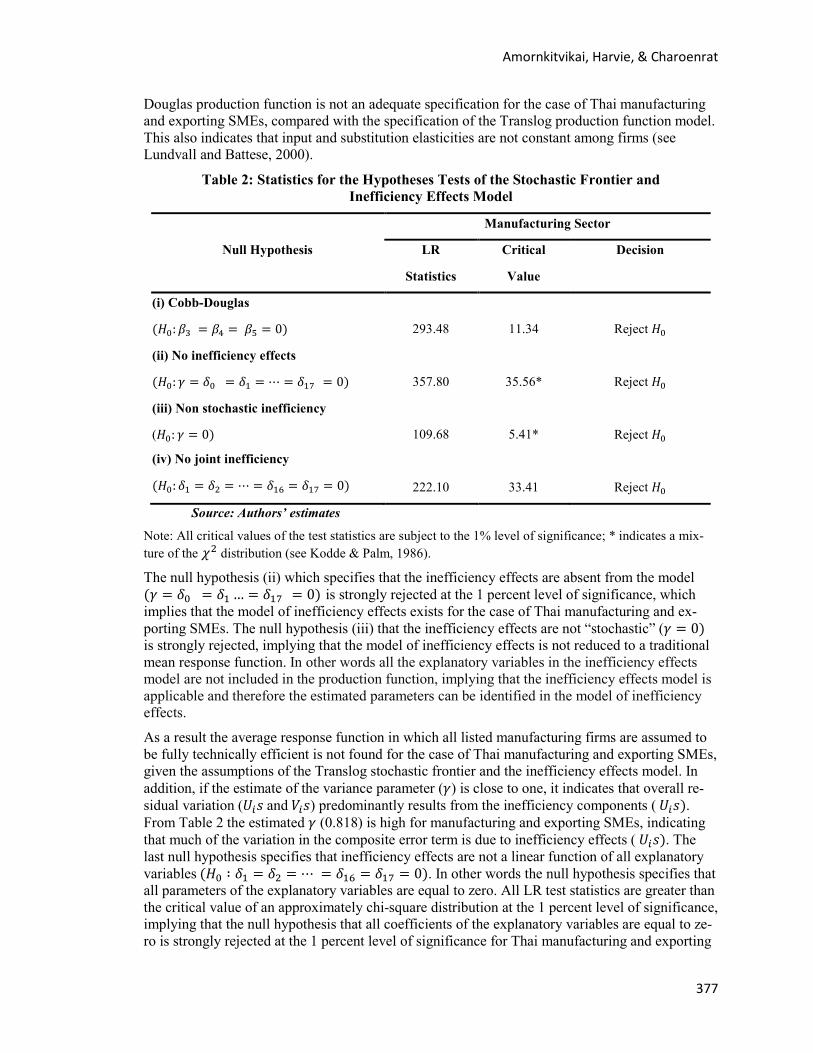
Hypothesis Tests Four null hypothesis tests are required to be conducted as follows: (i) the validation of the Cobb-Douglas production function, (ii) the absence of inefficiency effects, (iii) the absence of stochas-tic inefficiency effects, (iv) the insignificance of joint inefficiency variables as shown in Table 2. A likelihood-ratio test (LR test) is used to test these hypotheses, which can be conducted as fol-lows:
𝜆 = −2{log [𝐿(𝐻0)]− log [𝐿(𝐻1)]} (9)
Where, log [𝐿(𝐻0)] and log [𝐿(𝐻1)] are obtained from the maximized values of the log-likelihood function under the null hypothesis (𝐻0) and the alternative hypothesis (𝐻1), respectively. The LR test statistic has an asymptotic chi-square distribution with parameters equal to the number of re-stricted parameters imposed under the null hypothesis (𝐻0), except hypotheses (ii) and (iii) which have a “mixed” chi-square distribution (see Kodde and Palm (1986)). Hypotheses (ii) and (iii) involve the restriction that 𝛾 is equal to zero, which defines a point on the boundary of the pa-rameter space (Coelli, 1996, p. 6). From Table 2 the null hypothesis (i) is to test whether the Cobb-Douglas production function is adequate for Thai manufacturing and exporting SMEs. Fol-lowing Equations (5) and (6) the null hypothesis (𝐻0 ∶ 𝛽3 = 𝛽4 = 𝛽5 = 0) is strongly rejected at the 1 percent level of significance for manufacturing and exporting SMEs. Therefore, the Cobb- 9 The interval of predicted efficiency scores is [0; 1]. Efficiency scores normally concentrate at or close to 1 (or have a positive pileup at or close to 1 at the right hand side of the interval), but often none of them are at or close to 0 (McDonald, 2009).
Amornkitvikai, Harvie, & Charoenrat
377
Douglas production function is not an adequate specification for the case of Thai manufacturing and exporting SMEs, compared with the specification of the Translog production function model. This also indicates that input and substitution elasticities are not constant among firms (see Lundvall and Battese, 2000).
Table 2: Statistics for the Hypotheses Tests of the Stochastic Frontier and Inefficiency Effects Model
Manufacturing Sector
Null Hypothesis LR Critical Decision
Statistics Value
(i) Cobb-Douglas
(𝐻0:𝛽3 = 𝛽4 = 𝛽5 = 0) 293.48 11.34 Reject 𝐻0
(ii) No inefficiency effects
(𝐻0: 𝛾 = 𝛿0 = 𝛿1 = ⋯ = 𝛿17 = 0) 357.80 35.56* Reject 𝐻0
(iii) Non stochastic inefficiency
(𝐻0: 𝛾 = 0) 109.68 5.41* Reject 𝐻0
(iv) No joint inefficiency
(𝐻0:𝛿1 = 𝛿2 = ⋯ = 𝛿16 = 𝛿17 = 0) 222.10 33.41 Reject 𝐻0
Source: Authors’ estimates Note: All critical values of the test statistics are subject to the 1% level of significance; * indicates a mix-ture of the 𝜒2 distribution (see Kodde & Palm, 1986).
The null hypothesis (ii) which specifies that the inefficiency effects are absent from the model (𝛾 = 𝛿0 = 𝛿1 … = 𝛿17 = 0) is strongly rejected at the 1 percent level of significance, which implies that the model of inefficiency effects exists for the case of Thai manufacturing and ex-porting SMEs. The null hypothesis (iii) that the inefficiency effects are not “stochastic” (𝛾 = 0) is strongly rejected, implying that the model of inefficiency effects is not reduced to a traditional mean response function. In other words all the explanatory variables in the inefficiency effects model are not included in the production function, implying that the inefficiency effects model is applicable and therefore the estimated parameters can be identified in the model of inefficiency effects.
As a result the average response function in which all listed manufacturing firms are assumed to be fully technically efficient is not found for the case of Thai manufacturing and exporting SMEs, given the assumptions of the Translog stochastic frontier and the inefficiency effects model. In addition, if the estimate of the variance parameter (𝛾) is close to one, it indicates that overall re-sidual variation (𝑈𝑖𝑠 and 𝑉𝑖𝑠) predominantly results from the inefficiency components ( 𝑈𝑖𝑠). From Table 2 the estimated 𝛾 (0.818) is high for manufacturing and exporting SMEs, indicating that much of the variation in the composite error term is due to inefficiency effects ( 𝑈𝑖𝑠). The last null hypothesis specifies that inefficiency effects are not a linear function of all explanatory variables (𝐻0 ∶ 𝛿1 = 𝛿2 = ⋯ = 𝛿16 = 𝛿17 = 0). In other words the null hypothesis specifies that all parameters of the explanatory variables are equal to zero. All LR test statistics are greater than the critical value of an approximately chi-square distribution at the 1 percent level of significance, implying that the null hypothesis that all coefficients of the explanatory variables are equal to ze-ro is strongly rejected at the 1 percent level of significance for Thai manufacturing and exporting
Technical Inefficiency Effects Model for Thai Manufacturing and Exporting Enterprises (SMEs)
378
SMEs, given the specification of the Translog stochastic frontier and the model of inefficiency effects. The result of output elasticities with respect to each input, given by 0.70910, indicates the exist-ence of decreasing returns to scale for Thai manufacturing and exporting SMEs (see Kim (1992)). The DEA finding also indicates that approximately 99.79 percent of total observations face de-creasing returns to scale. The average technical efficiencies of Thai manufacturing and exporting SMEs predicted by the SFA and DEA are 0.67 and 0.80, respectively. Due to different SFA and VRS DEA technical efficiency scores, a Spearman rank-order correlation, which is a non-parametric correlation test, was conducted to examine the ranking consistency for Thai manufac-turing and exporting enterprises. The value of the estimated Spearman rank correlation coefficient is 0.697 which is found to be statistically significant at the 1 percent level of significance, and therefore the results of both SFA and DEA techniques are consistent in terms of ranking.
Empirical Results from the SFA and DEA models From the inefficiency effects model inconclusive results of both SFA and DEA are found be-tween firm age and its technical efficiency. Both approaches, however, confirm that medium-sized enterprises perform better than small-sized enterprises (see Tables 3, 4, and 5). In addition the empirical results found by both approaches suggest that SMEs located in Bangkok are found to have higher technical efficiency compared with their counterparts located in other provinces. This result is similar to that of Tran et al. (2008), indicating that metropolitan areas are likely to have higher technical efficiency due to a higher level of technical, managerial training, educa-tional level, and market opportunities than their counterparts in non metropolitan areas (Tran et al., 2008). Firm age is also found by both approaches to have a significant and positive effect on technical efficiency, indicating that learning-by-doing is an important factor for the technical effi-ciency of manufacturing and exporting SMEs.
Foreign investment (via the form of ownership) is also strongly found by both approaches to have a significant and positive association with a firm’s technical efficiency, indicating that foreign investment can bring superior technology, managerial expertise, good corporate governance, and strong foreign - market networks, leading to an improvement of Thai manufacturing and export-ing SMEs’ technical efficiency. SMEs receiving government assistance are strongly found by both approaches to have higher technical efficiency compared with their counterparts that receive no government assistance. These results imply that SMEs are likely to benefit from government assistance via the Board of Investment’s financial assistance in the form of income tax exemption or reduction, and exemption from import duty on essential raw materials. However, insignificant estimated coefficients of exporting intensity and research and development (R&D) found by both approaches indicate that they are not found to have a significant impact on technical efficiency.
With respect to the classification of manufacturing sectors, the coefficients of SMEs in all sub-manufacturing sectors shown in Tables 3, 4, and 5 are found to be significantly negative11, indi-cating that they are technically more efficient than SMEs in the miscellaneous manufactured arti-
10 According to Equation (6), returns to scale is calculated as the sum of the elasticity of output with respect
to capital input (∂ 𝒍𝒏(𝒀𝒊) ∂ 𝒍𝒏(𝑲𝒊⁄ ) = 𝜷𝟐+𝜷𝟒+𝜷𝟓𝒍𝒏 (𝑳𝒊)) and the elasticity of output with respect to la-bour input (∂ 𝒍𝒏(𝒀𝒊) ∂ ⁄ 𝒍𝒏 (𝑳𝒊) = 𝜷𝟏+𝜷𝟑+𝜷𝟓𝒍𝒏 (𝑲𝒊)).
11 The negative coefficient sign is associated with technical inefficiency. However, the negative sign must be converted to positive for the case of technical efficiency.
Amornkitvikai, Harvie, & Charoenrat
379
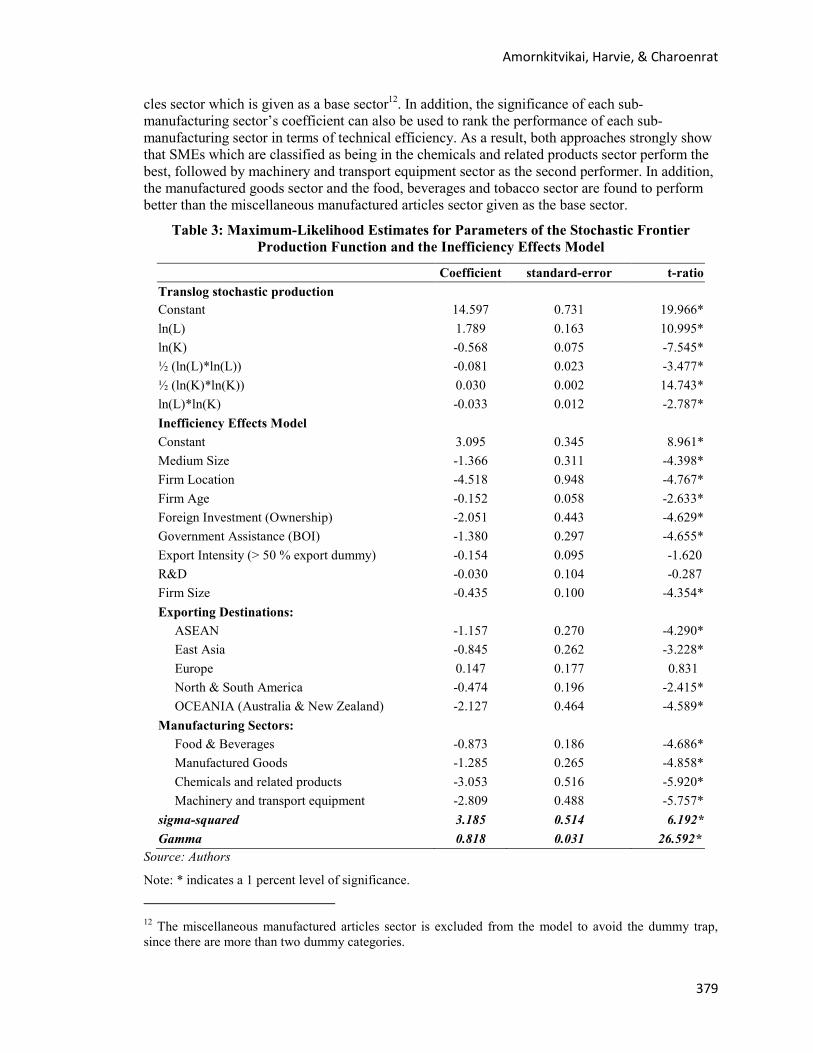
cles sector which is given as a base sector12. In addition, the significance of each sub-manufacturing sector’s coefficient can also be used to rank the performance of each sub-manufacturing sector in terms of technical efficiency. As a result, both approaches strongly show that SMEs which are classified as being in the chemicals and related products sector perform the best, followed by machinery and transport equipment sector as the second performer. In addition, the manufactured goods sector and the food, beverages and tobacco sector are found to perform better than the miscellaneous manufactured articles sector given as the base sector.
Table 3: Maximum-Likelihood Estimates for Parameters of the Stochastic Frontier Production Function and the Inefficiency Effects Model
Coefficient standard-error t-ratio
Translog stochastic production Constant 14.597 0.731 19.966*
ln(L) 1.789 0.163 10.995* ln(K) -0.568 0.075 -7.545* ½ (ln(L)*ln(L)) -0.081 0.023 -3.477* ½ (ln(K)*ln(K)) 0.030 0.002 14.743* ln(L)*ln(K) -0.033 0.012 -2.787* Inefficiency Effects Model
Constant 3.095 0.345 8.961* Medium Size -1.366 0.311 -4.398* Firm Location -4.518 0.948 -4.767* Firm Age -0.152 0.058 -2.633* Foreign Investment (Ownership) -2.051 0.443 -4.629* Government Assistance (BOI) -1.380 0.297 -4.655* Export Intensity (> 50 % export dummy) -0.154 0.095 -1.620 R&D -0.030 0.104 -0.287 Firm Size -0.435 0.100 -4.354* Exporting Destinations:
ASEAN -1.157 0.270 -4.290* East Asia -0.845 0.262 -3.228* Europe 0.147 0.177 0.831
North & South America -0.474 0.196 -2.415* OCEANIA (Australia & New Zealand) -2.127 0.464 -4.589* Manufacturing Sectors:
Food & Beverages -0.873 0.186 -4.686* Manufactured Goods -1.285 0.265 -4.858* Chemicals and related products -3.053 0.516 -5.920* Machinery and transport equipment -2.809 0.488 -5.757* sigma-squared 3.185 0.514 6.192* Gamma 0.818 0.031 26.592*
Source: Authors
Note: * indicates a 1 percent level of significance.
12 The miscellaneous manufactured articles sector is excluded from the model to avoid the dummy trap, since there are more than two dummy categories.
Technical Inefficiency Effects Model for Thai Manufacturing and Exporting Enterprises (SMEs)
380
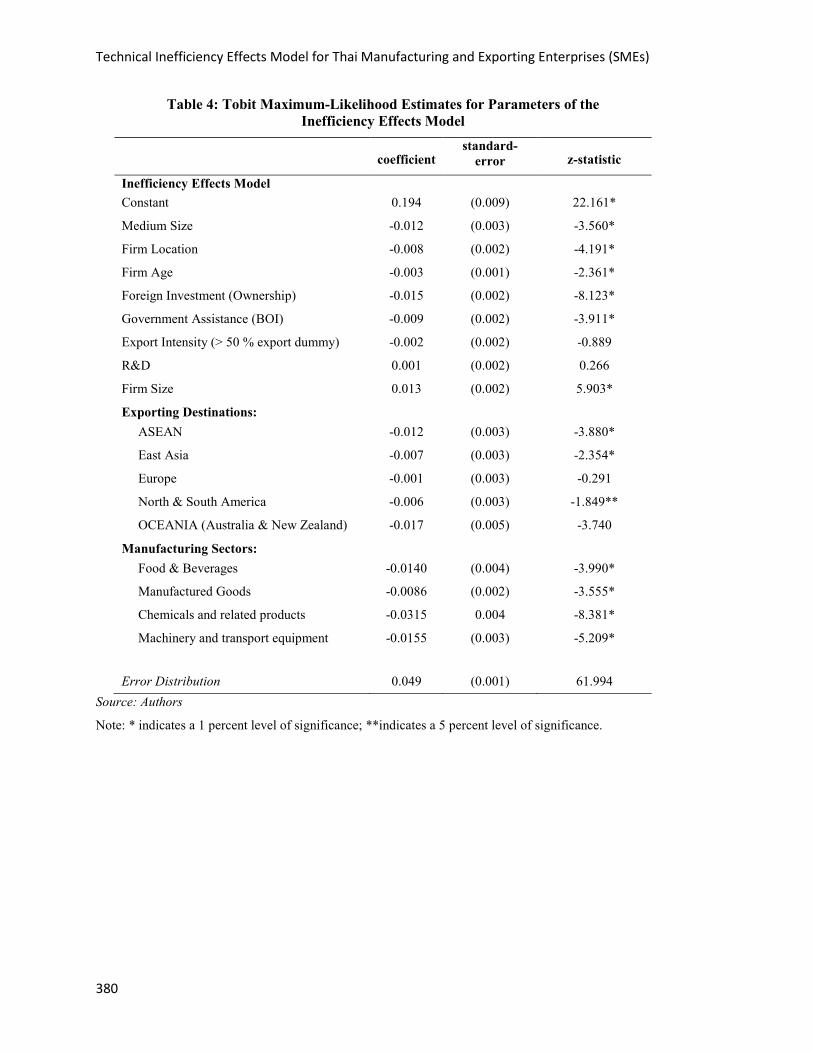
Table 4: Tobit Maximum-Likelihood Estimates for Parameters of the Inefficiency Effects Model
coefficient standard-
error z-statistic
Inefficiency Effects Model Constant 0.194 (0.009) 22.161*
Medium Size -0.012 (0.003) -3.560*
Firm Location -0.008 (0.002) -4.191*
Firm Age -0.003 (0.001) -2.361*
Foreign Investment (Ownership) -0.015 (0.002) -8.123*
Government Assistance (BOI) -0.009 (0.002) -3.911*
Export Intensity (> 50 % export dummy) -0.002 (0.002) -0.889
R&D 0.001 (0.002) 0.266
Firm Size 0.013 (0.002) 5.903*
Exporting Destinations: ASEAN -0.012 (0.003) -3.880*
East Asia -0.007 (0.003) -2.354*
Europe -0.001 (0.003) -0.291
North & South America -0.006 (0.003) -1.849**
OCEANIA (Australia & New Zealand) -0.017 (0.005) -3.740
Manufacturing Sectors: Food & Beverages -0.0140 (0.004) -3.990*
Manufactured Goods -0.0086 (0.002) -3.555*
Chemicals and related products -0.0315 0.004 -8.381*
Machinery and transport equipment -0.0155 (0.003) -5.209*
Error Distribution 0.049 (0.001) 61.994 Source: Authors
Note: * indicates a 1 percent level of significance; **indicates a 5 percent level of significance.
Amornkitvikai, Harvie, & Charoenrat
381
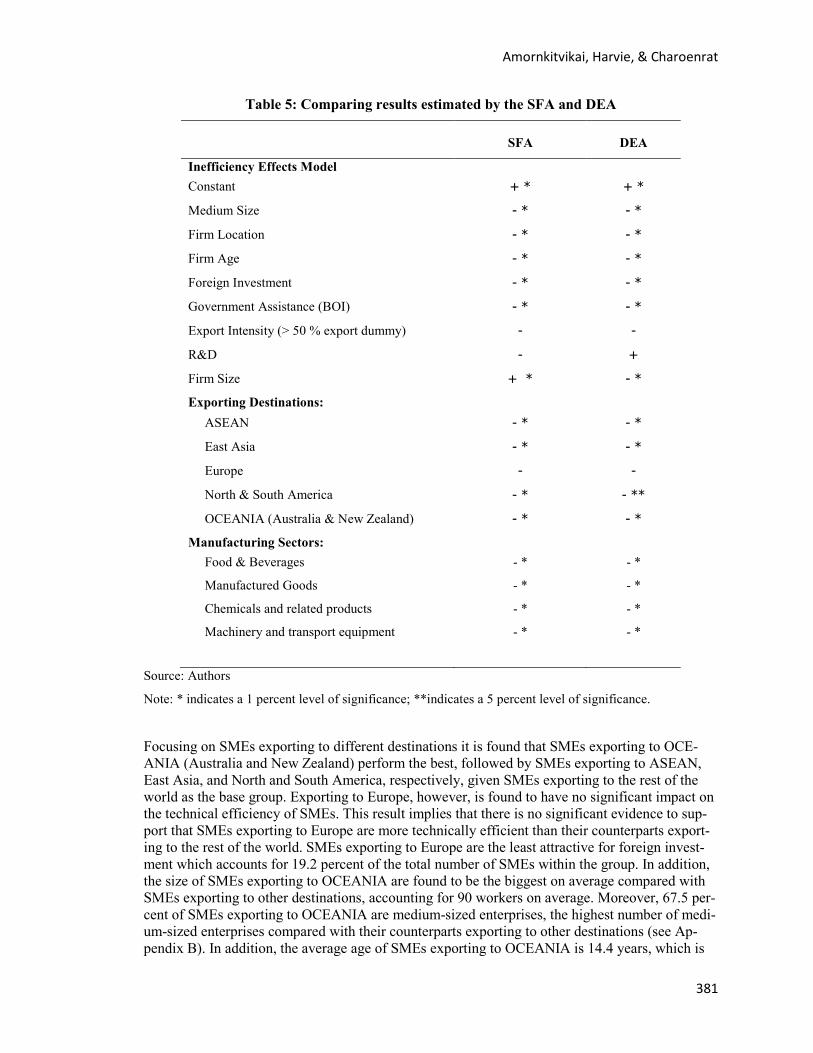
Table 5: Comparing results estimated by the SFA and DEA
SFA DEA
Inefficiency Effects Model Constant + * + *
Medium Size - * - *
Firm Location - * - *
Firm Age - * - *
Foreign Investment - * - *
Government Assistance (BOI) - * - *
Export Intensity (> 50 % export dummy) - -
R&D - +
Firm Size + * - *
Exporting Destinations: ASEAN - * - *
East Asia - * - *
Europe - -
North & South America - * - **
OCEANIA (Australia & New Zealand) - * - *
Manufacturing Sectors: Food & Beverages - * - *
Manufactured Goods - * - *
Chemicals and related products - * - *
Machinery and transport equipment - * - *
Source: Authors
Note: * indicates a 1 percent level of significance; **indicates a 5 percent level of significance.
Focusing on SMEs exporting to different destinations it is found that SMEs exporting to OCE-ANIA (Australia and New Zealand) perform the best, followed by SMEs exporting to ASEAN, East Asia, and North and South America, respectively, given SMEs exporting to the rest of the world as the base group. Exporting to Europe, however, is found to have no significant impact on the technical efficiency of SMEs. This result implies that there is no significant evidence to sup-port that SMEs exporting to Europe are more technically efficient than their counterparts export-ing to the rest of the world. SMEs exporting to Europe are the least attractive for foreign invest-ment which accounts for 19.2 percent of the total number of SMEs within the group. In addition, the size of SMEs exporting to OCEANIA are found to be the biggest on average compared with SMEs exporting to other destinations, accounting for 90 workers on average. Moreover, 67.5 per-cent of SMEs exporting to OCEANIA are medium-sized enterprises, the highest number of medi-um-sized enterprises compared with their counterparts exporting to other destinations (see Ap-pendix B). In addition, the average age of SMEs exporting to OCEANIA is 14.4 years, which is
Technical Inefficiency Effects Model for Thai Manufacturing and Exporting Enterprises (SMEs)
382
the second oldest group. Similarly, the average age of SMEs exporting to ASEAN is also found to be the oldest compared to their counterparts exporting to other regions. One possible explanation why SMEs exporting to different destinations perform differently in terms of technical efficiency might be the benefits from their bilateral trade agreements as discussed below.
Bilateral Trade Agreements One possible explanation why SMEs exporting to OCEANIA are found to be the most technically efficiency is that bilateral trade agreements between (i) Thailand and Australia (Thailand - Aus-tralia Free Trade Agreement: TAFTA) and (ii) Thailand and New Zealand (Thailand - New Zea-land Closer Economic Partnership: TNZCEP) have been in force since 1 January 2005 and 1 July 2005, respectively. According to the Department of Trade Negotiations in Thailand, 83.2 percent of total export goods from Thailand were exempted from Australian tariffs in 2005. Remaining export goods such as textiles and clothes from Thailand, will be exempted from Australian tariffs on 1st January 2015 (Department of Trade Negotiations, 2007c). In addition, 79.1 percent of ex-port goods from Thailand were exempted from New Zealand tariffs in 2005. The remaining two export groups such as (i) textiles, clothes, and footwear and (ii) beef, pork, printing materials, shallots, seeds, fibreboard, and particleboard will be exempted from New Zealand tariffs in 2015 and 2020, respectively (Department of Trade Negotiations, 2007d).
From our previous discussion both (i) chemicals and related products and (ii) machinery and transport sectors are found to be the two most efficient manufacturing sectors for Thai manufac-turing and exporting SMEs. Moreover, SMEs exporting to ASEAN and OCEANIA are the top two groups which have the highest number of SMEs in (i) chemicals and related products and (ii) machinery and transport equipment sectors, accounting for 39.5 percent and 36.7 percent of the total number of SMEs exporting to ASEAN and OCEANIA, respectively.
SMEs exporting to North and South America are found to have the lowest number of firms in (i) chemicals and related products and (ii) machinery and transport equipment sectors, accounting for 13.7 percent of the total number of SMEs exporting to North and South America, followed by SMEs exporting to Europe (14.5 percent of the total number of SMEs exporting to Europe) and SMEs exporting to East Asia (24.4 percent of the total number of SMEs exporting to East Asia).
One possible reason why the technical efficiency of SMEs exporting to ASEAN ranked the sec-ond highest exporting SME group compared with their counterparts exporting to other destina-tions is that the ASEAN Free Trade Agreement (AFTA) has been enforced since 1992. Member countries can, therefore, benefit from the Common Effective Preferential Tariff (CEPT) scheme13 (ASEAN Secretariat, 2002). In addition, 95.6 percent of products in ASEAN have tariff rates of between zero to five percent regarding the Common Effective Preferential Tariff (CEPT) Inclu-sion List (IL), while 99.7 percent of products of the original six members (Brunei Darussalam, Indonesia, Malaysia, the Philippines, Singapore and Thailand) have a 0 - 5 percent tariff range (ASEAN Secretariat, 2009). Focusing on SMEs exporting to East Asia the ASEAN-China Free Trade Agreement was successfully negotiated and signed on 29th November 200414 (Department
13 Six former members (Brunei Darussalam, Indonesia, Malaysia, Philippines, Singapore, and Thailand) agreed to reduce tariff rates for imported goods in the inclusion list (IL) from member countries to zero to five percent by 2003 (by 2006 for Vietnam; by 2008 for Laos and Myanmar; and by 2010 for Cambodia), and a zero tariff rate is expected to be applied by 2010 (by 2015 for all new members) (ASEAN Secretariat, 2002). 14 Thailand and China agreed on a zero tariff for export goods on 1st October 2003, under the Early Harvest Programme of the framework agreement of comprehensive economic cooperation between ASEAN and China (Department of Trade Negotiations, 2008a).
Amornkitvikai, Harvie, & Charoenrat
383
of Trade Negotiations, 2008a). However, the Japan-Thailand Economic Partnership Agreement (JTEPA) and the ASEAN - Korea Free Trade Agreement have been enforced since 1 November 2007 and 1 January 201015, respectively (Department of Trade Negotiations, 2007a, 2008b)16.
Comparing Thai SMEs exporting to North and South America and Europe with their counterparts exporting to OCEANIA, ASEAN, and East Asia, it is apparent that very few bilateral trade agreements with North and South American countries have been completed. A major exception is the Thai - Peru Free Trade Agreement. This Free Trade Agreement has been enforced since mid-2011 (Department of Trade Negotiations, 2007b). A bilateral trade agreement between Thailand and the US (Thailand - US Free Trade Agreement: TUFTA) has also been pending since 2006 due to Thai political unrest (Department of Trade Negotiations, 2010b). In addition, a bilateral trade agreement between Thailand and the EU (Thailand-EU Free Trade Agreement) is still in the process of negotiation (Department of Trade Negotiations, 2010a). In addition, bilateral trade agreements between Thailand and other countries in South America (e.g., Chile and Mexico) are under negotiation. Finally, the results obtained from this section are used to provide empirically based policy implications and suggestions as discussed in the next section.
Conclusions and Policy Implications This study has employed stochastic frontier analysis (SFA) and data envelopment analysis (DEA) to investigate factors that might affect the technical inefficiency of Thai manufacturing and ex-porting SMEs. SFA, as developed by Battese and Coelli (1995), was used to conduct the empiri-cal analysis. Thai manufacturing and exporting SMEs are found to have decreasing returns to scale, given their returns to scale of 0.709. DEA also indicates that most Thai manufacturing and exporting SMEs have decreasing returns to scale. Their technical efficiencies predicted by the SFA and DEA are 0.67 and 0.80, respectively.
From the inefficiency effects model medium sized enterprises are found by both the SFA and DEA approaches to perform better than small sized enterprises, indicating that medium sized en-terprises have an advantage in terms of economies of scale over small sized enterprises. Firm lo-cation is strongly found by both approaches to be one of the significant factors determining firm technical efficiency, since SMEs in Bangkok are found to have higher technical efficiency than their counterparts located in other provinces. This result suggests that manufacturing and export-ing SMEs in Bangkok are likely to be more technically efficient, since SMEs in Bangkok are likely to have: higher technical, managerial training and educational levels; and greater competi-tion and market opportunities than their counterparts in other provinces. Firm age is also found by both approaches to have a significant and positive effect on technical efficiency, indicating that learning-by-doing is also important for manufacturing and exporting SMEs to compete in global markets.
Foreign investment (ownership) is also found by both approaches to have a significant and posi-tive effect on the technical efficiency of Thai manufacturing and exporting SMEs, since foreign investors in Thai manufacturing and exporting SMEs bring superior technology, managerial ex-pertise, good corporate governance, and a strong foreign - market network. As a result, foreign investment is an important factor to improve the technical efficiency of manufacturing and ex-
15 For Thailand 16 The Thai Industrial Census was conducted in 2007 using information on Thai manufacturing enterprises collected at the end of 2006. Therefore, information on these firms used in this paper was conducted before the enforcement of the ASEAN – Korea FTA and JTEPA in 2007 and 2010, respectively.
Technical Inefficiency Effects Model for Thai Manufacturing and Exporting Enterprises (SMEs)
384
porting SMEs. In addition, SMEs receiving support from government are found by both ap-proaches to have higher technical efficiency than their counterparts who receive no support from the government, indicating that SMEs are likely to gain from government assistance via the Board of Investment’s financial assistance such as in the form of income tax exemption or reduc-tion, and exemption from import duty on essential raw materials. However, the empirical results from both approaches show that high export intensity and research and development (R&D) are found to have no significant impact on the technical efficiency of Thai manufacturing and export-ing SMEs, suggesting that Thai manufacturing and exporting SMEs are involved with low skill and value adding activities which require upgrading.
Focusing on the manufacturing sub sectors classified by the Standard International Trade Classi-fication (SITC), it is found that SMEs in the chemicals and related products sector perform the best, followed by SMEs in the machinery and transport equipment sector. However, the evidence does not confirm the ranking of the manufactured goods sector and food, beverages and tobacco sector, using the miscellaneous manufactured articles sector as the base sector, due to the incon-sistent magnitudes of their coefficients estimated by both approaches, but it is confirmed that both these sub-manufacturing sectors perform better than the miscellaneous manufactured articles sec-tor as the base sector.
With respect to SMEs classified by exporting destinations it is strongly found by both approaches that SMEs exporting to OCEANIA (Australia and New Zealand) perform the best, followed by SMEs exporting to ASEAN, East Asia, and North and South America, respectively, given SMEs exporting to the rest of the world as the base group. Exporting to Europe, however, is found to have no significant impact on the technical efficiency of SMEs.
One possible explanation why SMEs exporting to OCEANIA and ASEAN are the most technical-ly efficient is that there is strong evidence of regional and bilateral trade agreements existing in these regions, such as the ASEAN Free Trade Agreement (AFTA) enforced in 1992, Thailand - Australia Free Trade Agreement (TAFTA) enforced in 2005, and the Thailand - New Zealand Closer Economic Partnership (TNZCEP) enforced in 2005. In other words these FTAs are poten-tially very important, involving reduced trade barriers of particular importance to SMEs. Moreo-ver, the depth of these FTAs can be observed from evidence that almost all Thai exported prod-ucts have been excluded from tariffs with respect to these FTAs, and all of these trade agreements have also been enforced before the 2007 Thai Industrial Census.
There is strong evidence to suggest, however, that none of the trade agreements between Thailand and other countries in North and South America and Europe have been enforced, except the Thai-land - Peru Free Trade Agreement which was enforced from mid-2011. Focusing on East Asia, Thailand has had a trade agreement with China since 2003. In addition, the Japan-Thailand Eco-nomic Partnership Agreement (JTEPA) and ASEAN - Korea Free Trade Agreement have been enforced since 1 November 2007 and 1 January 2010, respectively. Interestingly, it was noticed that SMEs exporting to Europe are the least attractive for foreign investors (foreign ownership)17, since foreign investment/ownership accounted for 19.2 percent of the total number of SMEs with-in the group. Moreover, the size of SMEs exporting to OCEANIA, on average, are found to be the largest, and the number of medium sized enterprises are the largest group within SMEs ex-porting to OCEANIA compared with SMEs exporting to other destinations. In addition, the aver-age age of SMEs exporting to OCEANIA is 14.42 years, which is the second oldest group com-pared with SMEs exporting to other regions. In addition, the most distinctive characteristic of SMEs exporting to ASEAN is that their average age is the oldest compared with their counter-
17 For this study foreign investors (or foreign ownership) are represented by the percentage of SME shares owned by foreigners.
Amornkitvikai, Harvie, & Charoenrat
385
parts exporting to other regions. More importantly, SMEs exporting to ASEAN and OCEANIA are the top two groups having the highest number of firms concentrated in (i) chemicals and relat-ed products and (ii) machinery and transport equipment sectors within their group. On the contra-ry, SMEs exporting to North and South America are found to have the least number of firms con-centrated in (i) chemicals and related products and (ii) machinery and transport equipment sectors within their group.
According to the empirical results the size of manufacturing SMEs is found to be one of the im-portant factors in improving the technical efficiency of Thai manufacturing and exporting SMEs. This suggestion also confirms the evidence that large enterprises have a higher value of exports even though the number of large firms is much lower than SMEs. Foreign investment should be promoted for manufacturing and exporting SMEs, since they can benefit from better managerial skills and technology. More importantly, foreign investors normally have good networking with foreign markets (e.g., their foreign partners and head quarters). Therefore, they can provide better foreign market opportunities compared with local investors. Government assistance via the Board of Investment (BOI) should still be promoted for manufacturing and exporting SMEs. Therefore, the government’s SME development strategy should still continue to provide financial support for manufacturing and exporting SMEs. More importantly, bilateral free trade agreements focusing on countries in North and South America and the EU, which are currently under negotiation, could be promoted such as the Thai - EU FTA, Thai – US FTA, Thai – Chile FTA, and Thai - Mexico FTA, with more attention given to addressing trade barriers that are of particular concern to SMEs. The depth of these FTAs should, therefore, be expanded, which appears to be important in successfully enhancing the technical efficiency of Thai manufacturing and exporting SMEs.
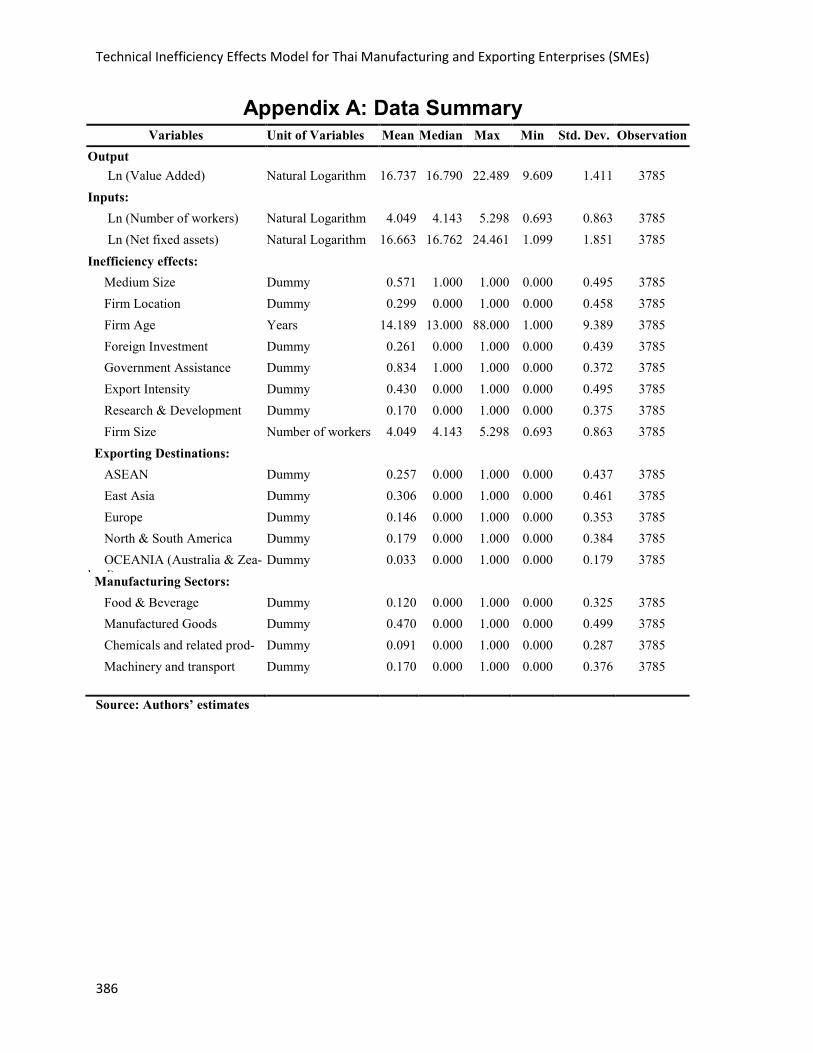
Technical Inefficiency Effects Model for Thai Manufacturing and Exporting Enterprises (SMEs)
386
Appendix A: Data Summary Variables Unit of Variables Mean Median Max Min Std. Dev. Observation
Output Ln (Value Added) Natural Logarithm 16.737 16.790 22.489 9.609 1.411 3785 Inputs:
Ln (Number of workers) Natural Logarithm 4.049 4.143 5.298 0.693 0.863 3785 Ln (Net fixed assets) Natural Logarithm 16.663 16.762 24.461 1.099 1.851 3785 Inefficiency effects:
Medium Size Dummy 0.571 1.000 1.000 0.000 0.495 3785 Firm Location Dummy 0.299 0.000 1.000 0.000 0.458 3785 Firm Age Years 14.189 13.000 88.000 1.000 9.389 3785 Foreign Investment Dummy 0.261 0.000 1.000 0.000 0.439 3785 Government Assistance Dummy 0.834 1.000 1.000 0.000 0.372 3785 Export Intensity Dummy 0.430 0.000 1.000 0.000 0.495 3785 Research & Development Dummy 0.170 0.000 1.000 0.000 0.375 3785 Firm Size Number of workers 4.049 4.143 5.298 0.693 0.863 3785 Exporting Destinations:
ASEAN Dummy 0.257 0.000 1.000 0.000 0.437 3785 East Asia Dummy 0.306 0.000 1.000 0.000 0.461 3785 Europe Dummy 0.146 0.000 1.000 0.000 0.353 3785 North & South America Dummy 0.179 0.000 1.000 0.000 0.384 3785 OCEANIA (Australia & Zea-l d)
Dummy 0.033 0.000 1.000 0.000 0.179 3785 Manufacturing Sectors:
Food & Beverage Dummy 0.120 0.000 1.000 0.000 0.325 3785 Manufactured Goods Dummy 0.470 0.000 1.000 0.000 0.499 3785 Chemicals and related prod-
t Dummy 0.091 0.000 1.000 0.000 0.287 3785
Machinery and transport
Dummy 0.170 0.000 1.000 0.000 0.376 3785
Source: Authors’ estimates
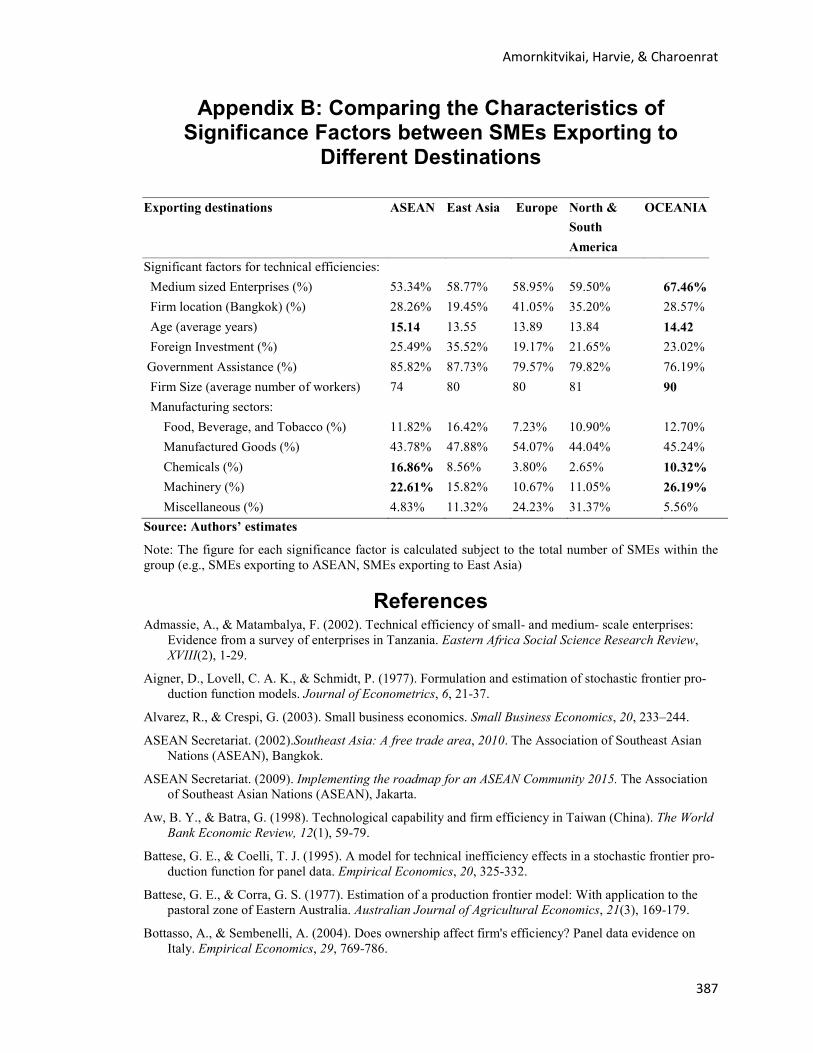
Amornkitvikai, Harvie, & Charoenrat
387
Appendix B: Comparing the Characteristics of Significance Factors between SMEs Exporting to
Different Destinations
Exporting destinations ASEAN East Asia Europe North & OCEANIA South
America
Significant factors for technical efficiencies:
Medium sized Enterprises (%) 53.34% 58.77% 58.95% 59.50% 67.46% Firm location (Bangkok) (%) 28.26% 19.45% 41.05% 35.20% 28.57% Age (average years) 15.14 13.55 13.89 13.84 14.42 Foreign Investment (%) 25.49% 35.52% 19.17% 21.65% 23.02% Government Assistance (%) 85.82% 87.73% 79.57% 79.82% 76.19% Firm Size (average number of workers) 74 80 80 81 90 Manufacturing sectors:
Food, Beverage, and Tobacco (%) 11.82% 16.42% 7.23% 10.90% 12.70% Manufactured Goods (%) 43.78% 47.88% 54.07% 44.04% 45.24% Chemicals (%) 16.86% 8.56% 3.80% 2.65% 10.32% Machinery (%) 22.61% 15.82% 10.67% 11.05% 26.19% Miscellaneous (%) 4.83% 11.32% 24.23% 31.37% 5.56% Source: Authors’ estimates
Note: The figure for each significance factor is calculated subject to the total number of SMEs within the group (e.g., SMEs exporting to ASEAN, SMEs exporting to East Asia)
References Admassie, A., & Matambalya, F. (2002). Technical efficiency of small- and medium- scale enterprises:
Evidence from a survey of enterprises in Tanzania. Eastern Africa Social Science Research Review, XVIII(2), 1-29.
Aigner, D., Lovell, C. A. K., & Schmidt, P. (1977). Formulation and estimation of stochastic frontier pro-duction function models. Journal of Econometrics, 6, 21-37.
Alvarez, R., & Crespi, G. (2003). Small business economics. Small Business Economics, 20, 233–244.
ASEAN Secretariat. (2002).Southeast Asia: A free trade area, 2010. The Association of Southeast Asian Nations (ASEAN), Bangkok.
ASEAN Secretariat. (2009). Implementing the roadmap for an ASEAN Community 2015. The Association of Southeast Asian Nations (ASEAN), Jakarta.
Aw, B. Y., & Batra, G. (1998). Technological capability and firm efficiency in Taiwan (China). The World Bank Economic Review, 12(1), 59-79.
Battese, G. E., & Coelli, T. J. (1995). A model for technical inefficiency effects in a stochastic frontier pro-duction function for panel data. Empirical Economics, 20, 325-332.
Battese, G. E., & Corra, G. S. (1977). Estimation of a production frontier model: With application to the pastoral zone of Eastern Australia. Australian Journal of Agricultural Economics, 21(3), 169-179.
Bottasso, A., & Sembenelli, A. (2004). Does ownership affect firm's efficiency? Panel data evidence on Italy. Empirical Economics, 29, 769-786.
Technical Inefficiency Effects Model for Thai Manufacturing and Exporting Enterprises (SMEs)
388
Brimble, P., Oldfield, D., & Monsakul, M. (Eds). (2002). The role of SMEs in national economies in East Asia. Cheltenham, UK: Edward Elgar.
Burki, A. A., & Terrell, D. (1998). Measuring production efficiency of small firms in Pakistan. World De-velopment, 26(1), 155-169.
Charoenrat, T., Harive, C., & Amornkitvikai, Y. (2013). Thai manufacturing small and medium sized en-terprise technical efficiency: Evidence from firm-level industrial census data. Journal of Asian Eco-nomics, 27(1), 42-56.
Coelli, T. J. (1996). A guide to Frontier Version 4.1: A computer program for stochastic frontier produc-tion and cost function estimation. Working Papers, Armidale.
Coelli, T. J., Rao, D. S. P., O'Donnell, C. J., & Battese, G. E. (2005). An introduction to efficiency and productivity analysis. New York, USA: Springer.
Department of Trade Negotiations. (2007a). Japan-Thailand economic partnership agreement: JTEPA. Retrieved 27 July 2010 from http://www.thaifta.com/ThaiFTA/Home/FTAbyCountry/tabid/53/ctl/detail/id/25/mid/480/usemastercontainer/true/Default.aspx
Department of Trade Negotiations. (2007b). Thai - Peru free trade agreement. Retrieved 27 July 2010 from http://www.thaifta.com/ThaiFTA/Home/FTAbyCountry/tabid/53/ctl/detail/id/26/mid/480/usemastercontainer/true/Default.aspx
Department of Trade Negotiations. (2007c). Thailand - Australia free trade agreement: TAFTA. Retrieved 27 July, 2010, from http://www.thaifta.com/ThaiFTA/Home/FTAbyCountry/tabid/53/ctl/detail/id/21/mid/480/usemastercontainer/true/Default.aspx
Department of Trade Negotiations. (2007d). Thailand - New Zealand closer economic partnership: TNZCEP. Retrieved 27 July, 2010, from http://www.thaifta.com/ThaiFTA/Home/FTAbyCountry/tabid/53/ctl/detail/id/22/mid/480/usemastercontainer/true/Default.aspx
Department of Trade Negotiations. (2008a). ASEAN - China free trade agreement. Retrieved 27 July, 2010, from http://www.thaifta.com/ThaiFTA/Home/FTAbyCountry/tabid/53/ctl/detail/id/4/mid/480/usemastercontainer/true/Default.aspx
Department of Trade Negotiations. (2008b). ASEAN - Korea free trade agreement. Retrieved 27 July, 2010, from http://www.thaifta.com/ThaiFTA/Home/FTAbyCountry/tabid/53/ctl/detail/id/37/mid/480/usemastercontainer/true/Default.aspx
Department of Trade Negotiations. (2010a). Thailand-EU free trade area. Retrieved 27 July, 2010, from http://www.thaifta.com/ThaiFTA/Home/FTAbyCountry/tabid/53/ctl/detail/id/43/mid/480/usemastercontainer/true/Default.aspx
Department of Trade Negotiations. (2010b). Thailand - US free trade agreement: TUFTA, Retrieved 27 July, 2010, from http://www.thaifta.com/thaifta/Home/NegoLastestStatus/tabid/117/Default.aspx
Dilling-Hansen, M., Madsen, E. S., & Smith, V. (2003). Efficiency, R&D and ownership – Some empirical evidence. International Journal of Production Economics, 83, 85-94.
Førsund, F. R., Lovell, C. A. K., & Schmidt, P. (1980). A survey of frontier production functions and of their relationship to efficiency measurement. Journal of Econometrics, 13(1), 5-25.
Fukuyama, H., Guerra, R., & Weber, W. L. (1999). Efficiency and ownership: Evidence from Japanese credit cooperatives. Journal of Economics and Business, 51, 473-487.
Goldar, B. N., Renganathan, V. S., & Banga, R. (2003). Ownership and efficiency in engineering firms in India, 1990-91 to 1999-2000. Working Paper.
Amornkitvikai, Harvie, & Charoenrat
389
Granér, M., & Isaksson, A. (2007). Firm Efficiency and the Destination of Exports: Evidence from Kenyan Plant-level Data, Economic Research Paper 2007, Research and Statistics Branch, United Nations In-dustrial Development Organization (UNIDO), Vienna.
Harvie, C. (2002). The Asian financial and economic crisis and its impact on rational SMEs. In C. Harvie & B-C. Lee, Globalisation and SMEs in East Asia. Cheltenham: Edward Elgar Publishing Limited.
Herrero, I., & Pascoe, S. (2002). Estimation of technical efficiency: A review of some of the stochastic frontier and DEA software. Computers in Higher Education Economics Review, 15(1).
Hoff, A. (2006). Second Stage DEA: Comparison of approaches for modelling the DEA score. European Journal of Operational Research, 181(1), 425-435.
Kalirajan, K. P., & Shand, R. T. (1999). Frontier production functions and technical efficiency measures. Journal of Economic Surveys, 13(2), 149-172.
Kim, H. Y. (1992). The translog production function and variable returns to scale. The Review of Econom-ics and Statistics, 74(3), 546-552.
Kim, S. (2003). Identifying and estimating sources of technical inefficiency in Korean manufacturing in-dustries. Contemporary Economic Policy, 21(1), 132-144.
Kimura, F., & Kiyota, K. (2007). Foreign-owned versus domestically-owned firms: Economic performance in Japan. Review of Development Economics, 11(1), 31-48.
Kodde, D. A., & Palm, F. C. (1986). Wald criteria for jointly testing equality and inequality restrictions. The Econometric Society, 54(5), 1243-1248.
Le, V. & Harvie, C. (2010). Firm performance in Vietnam: Evidence from manufacturing small and medi-um enterprises. WP 04-10, Wollongong.
Lombaerde, P. A. A. D. (2008). The paradoxes of Thailand's pre-crisis export performance. Global Eco-nomic Review, 37(2), 249-264.
Lundvall, K., & Battese, G.E. (2000), 'Firm Size, Age and Efficiency: Evidence from Kenyan manufactur-ing firms', Journal of Development Studies, 36(3), 146-163.
McDonald, J. (2009), 'Using Least Squares and Tobit in Second Stage DEA Efficiency Analyses', Europe-an Journal of Operational Research, 197(2), 792-798.
Meeusen, W., & Broeck, JvD. (1977). Efficiency estimation from Cobb-Douglas production functions with composed error. International Economic Review, 18(2), 435-444.
Mephokee, C. (2003). The Thai SMEs development policies: Country report. Thammasat University, Bangkok.
OECD. (2011). OECD Studies on SMEs and Policies; Thailand: Key Issues and Policies, Retrieved 18 July, 2014, from http://www.oecd-ilibrary.org/industry-and-services/thailand-key-issues-and-policies_9789264121775-en
OSMEP. (2007). The white paper on small and medium enterprises of Thailand in 2006 and trends 2007, Office of Small and Medium Enterprises Promotion, Bangkok.
OSMEP. (2007b). The 2nd SMEs Promotion Plan (2007-2011). Bangkok: Office of Small and Medium En-terprises Promotion.
OSMEP. (2008). The white paper on small and medium enterprises of Thailand in 2007 and trends 2008, Office of Small and Medium Enterprises Promotion, Bangkok.
OSMEP. (2010). The white paper on small and medium enterprises of Thailand in 2009 and trends 2010, Office of Small and Medium Enterprises Promotion, Bangkok.
OSMEP. (2011). The white paper on small and medium enterprises of Thailand in 2010 and trends 2011, Office of Small and Medium Enterprises Promotion, Bangkok.
Technical Inefficiency Effects Model for Thai Manufacturing and Exporting Enterprises (SMEs)
390
OSMEP. (2012). The white paper on small and medium enterprises of Thailand in 2011 and trends 2012, Office of Small and Medium Enterprises Promotion, Bangkok.
Pham, H. T., Dao, T. L., & Reilly, B. (2010). Technical efficiency in the Vietnamese manufacturing sector. Journal of International Development, 22, 503-520.
Punyasavatsut, C. (2007). SMEs in the Thai manufacturing industry: Linking with MNEs. Retrieved 15/05/2009 from http://www.eria.org/research/images/pdf/PDF%20No.5/No,5-10-Thai.pdf.
Regnier, P. (2000). Small and medium enterprises in distress : Thailand, the East Asian crisis and beyond, Ashgate Publishing, Burlington.
Sheu, H-J., & Yang, C-Y. (2005). Insider ownership and firm performance in Taiwan's electronics industry: A technical efficiency perspective. Managerial and Decision Economics, 26, 307-318.
Tapaneeyangkul, P. (2001). Government policies in assisting SMEs for sustainable development. The Of-fice of Small and Medium Enterprise Promotion, Bangkok.
Tran, T. B., Grafton, R. Q., & Kompas, T. (2008). Firm efficiency in a transitional economy: Evidence from Vietnam., Asian Economic Journal, 22(1), 47-66.
Biographies Yot Amornkitvikai is presently a lecturer at the Faculty of Econom-ics, Rangsit University, Thailand. He obtained his Bachelor of Com-merce with Merit (Economics), Master of Commerce with Distinction (Economics), and Ph.D. (Economics) from the University of Wollon-gong, Australia. He was awarded the Faculty of Commerce Dean’s Merit List, University of Wollongong (1999), the Wollongong Interna-tional Postgraduate Coursework Scholarship (1999), and the Rangsit University’s Doctoral Degree Scholarship (2007-2010). Prior to his academic career, he worked at the Siam Commercial Bank PCL and the Stock Exchange of Thailand. His current research interests include enterprise performance, firm productivity, cost efficiency, technical
efficiency, small and medium sized enterprises (SMEs), and listed enterprises. He has published in a number of referred journals with Associate Professor Charles Harvie and Dr. Teerawat Char-oenrat, such as Journal of Australasian Accounting Business and Finance Journal, Journal of Asian Economics, and had his research output accepted for the proceedings at international con-ferences, such as the Australian Conference of Economists (2010), the Korea and the World Economy, IX Conference (2010), the SMEs in a Global Economy Conference (2010, 2011, 2012), the International Council for Small Business (ICSB) World Conference (2012), the Cam-bridge Business & Economics Conference (2013), and the International Conference on Financial Criminology (2014).
Charles Harvie is an Associate Professor School of Accounting Eco-nomics and Finance, Faculty of Business, University of Wollongong, Wollongong, Australia and Director of the Centre for Small Business and Regional Research. He received his Ph.D from the University of Warwick, UK, his MA from McMaster University, Canada, and his BA from the University of Strathclyde, UK. Dr Harvie has been the sole or joint author of 6 books with publishers that include Routledge (UK) and Palgrave-Macmillan (UK). He has been the editor of a fur-ther 10 books published by Edward Elgar (UK/USA) and Palgrave-Macmillan (UK). He has published 58 chapters in numerous books,
101 articles in refereed conference proceedings and 67 refereed journal articles in journals such as Energy Economics (UK), Journal of Asian Economics (USA), Economic Modelling (UK) Aus-
Amornkitvikai, Harvie, & Charoenrat
391
tralasian Accounting Business and Finance Journal (Australia), Applied Economics (UK), Man-chester School (UK), Journal of the Korean Economy (S. Korea), Studies in Economics and Fi-nance (UK), Journal of Policy Modelling (Holland), Korean Economic Review (Korea), Singa-pore Economic Review (Singapore), Australian Economic History Review (Australia), Journal of Social Economics (USA), ASEAN Economic Bulletin (Singapore), Journal of Industrial Rela-tions (Australia) and Resources Policy (USA).
Dr Harvie has conducted extensive research on the economies of East Asia and has written nu-merous books and articles on the Korean, Chinese and Vietnamese economies as well as articles on various aspects of economic development in the region. He has also written extensively on the role and contribution of small and medium enterprises (SMEs) within the region and their contri-bution to current and future economic development and integration in the region.
Dr Harvie has recently been involved in a number of consulting activities related to regional eco-nomic development issues in East Asia and these include the following: 1. A report for the Asian Productivity Organisation (based in Tokyo) concerned with SME
Productivity Measurement (2013) 2. Small and Medium-sized Enterprises Assessment, Strategy and Road Map – an Update, Lao
PDR, prepared for Asian Development Bank, (2013). 3. Small and Medium Enterprises (SMEs) Access to Finance in Selected East Asian Economies,
Economic Research Institute for ASEAN and East Asia (ERIA), Indonesia ( 2012-13). 4. Integrating Small and Medium Enterprises (SMEs) into the More Integrated East Asia, Eco-
nomic Research Institute for ASEAN and East Asia (ERIA), Indonesia (2008-09).
Teerawat Charoenrat is a Lecturer and Director of the Centre for In-do - China Country International Trade and Economic Research, Nong Khai Campus, Khon Kaen University, Nong Khai, 4300, Thailand. Dr. Charoenrat received his Ph.D. in Economics from the University of Wollongong, Australia. He obtained the Royal Thai Government Scholarship Fund and University of Wollongong International Post-graduate Tuition Award for pursuing a Ph.D. degree. His research in-terests include enterprise performance, firm productivity and technical efficiency, Stochastic Frontier Analysis (SFA), Data Envelopment
Analysis (DEA), entrepreneurship, and Small and Medium sized Enterprises (SMEs). He has published in a number of refereed journals, such as Journal of Asian Economics and Australasian Accounting Business and Finance Journal, and had his research output accepted for presentation at leading international conferences such as the Australian Conference of Economists (2011) and (2012), the Global Business and Technology Association’s Fourteenth Annual International Con-ference (2012), the SMEs in a Global Economy Conference (2010, 2012, 2013) 2011, the Interna-tional Council for Small Business World (2012) and the Cambridge Business & Economics Con-ference (2013).