Estimates of crisis-attributable mortality in South Sudan ...
45
LSHTM – Crisis-attributable mortality in South Sudan Page 1 of 45 Estimates of crisis-attributable mortality in South Sudan, December 2013-April 2018 A statistical analysis September 2018 Francesco Checchi PhD* Adrienne Testa MSc Abdihamid Warsame MSc Le Quach BS Rachel Burns MSc Department of Infectious Disease Epidemiology Faculty of Epidemiology and Population Health London School of Hygiene and Tropical Medicine * Corresponding author: [email protected]
Transcript of Estimates of crisis-attributable mortality in South Sudan ...

LSHTM – Crisis-attributable mortality in South Sudan Page 1 of 45
Estimates of crisis-attributable mortality in South Sudan,
December 2013-April 2018
A statistical analysis
September 2018
Francesco Checchi PhD*
Adrienne Testa MSc
Abdihamid Warsame MSc
Le Quach BS
Rachel Burns MSc
Department of Infectious Disease Epidemiology
Faculty of Epidemiology and Population Health
London School of Hygiene and Tropical Medicine
* Corresponding author: [email protected]

LSHTM – Crisis-attributable mortality in South Sudan Page 2 of 45
Executive summary
Background
Large-scale armed conflict in South Sudan has led to the displacement of about 4.5 million people and severely affected food security and livelihoods. So as to inform the ongoing humanitarian response and provide evidence for conflict resolution efforts, we carried out a statistical regression analysis to estimate (ii) the number of excess deaths attributable to the crisis among people within South Sudan, and (ii) the number of people killed during the war period (December 2013 to April 2018). Our study excludes South Sudanese refugees in other countries.
Methods
We derived estimates for each county and month within the analysis period by implementing a six-step estimation method that consists of (i) reconstructing population denominators from census projections and internal and refugee migration; (ii) reviewing and reanalysing previously collected mortality data from 210 county-based household surveys conducted as part of the humanitarian response; (iii) capturing data on various candidate predictors of mortality, including climate, armed conflict intensity, displacement, food security and livelihoods, humanitarian and public health service functionality and epidemic incidence; (iv) fitting a model to predict death rate based on predictor data and survey mortality estimates; (v) defining counterfactual baseline assumptions (what values model predictors would have taken in the absence of the crisis); and (vi) combining the above steps to estimate total, baseline and excess (total minus baseline) mortality. We used a similar approach to estimate the number of people killed, supplementing it with survey data on the injury- and, where available, violence-specific death rate.
Results
Ground surveys were broadly consistent with census estimates in terms of key demographic variables, but the share of infant mortality was unexpectedly low; similarly, survey estimates of the under 5y death rate were not higher during the war period, compared to previously. Statistical models to predict mortality had moderate predictive power but displayed plausible associations of death rate with armed conflict intensity, displacement, food security, vaccination uptake and cholera incidence. We estimate 383,000 people died in excess of the counterfactual baseline during the analysis period, out of an average population of about 10 million, with the death toll concentrated in Jonglei, Unity and the Equatorias, and highest in 2016-2017. During the same period, our analysis suggests some 190,000 people were killed. Alternative analyses using different regression techniques and counterfactual baseline assumptions yielded broadly similar totals.
Discussion
The South Sudanese population experienced elevated mortality during the war period, particularly in the northeast and southern regions of the country. A high proportion of deaths was due to violence. Our estimates are subject to limitations, including unrealistically narrow confidence intervals, uncertainty around population denominators and likely under-reporting of child deaths. On balance, these may have led to mild to moderate under-estimation. These findings indicate the humanitarian response needs to be strengthened, and that all parties should seek urgent conflict resolution.

LSHTM – Crisis-attributable mortality in South Sudan Page 3 of 45
Table of Contents Executive summary ...................................................................................................................................... 2
Acknowledgments ........................................................................................................................................ 4
Disclaimer ..................................................................................................................................................... 4
List of tables and figures .............................................................................................................................. 5
List of abbreviations ..................................................................................................................................... 6
1 Background ........................................................................................................................................... 7
South Sudan context ................................................................................................................................ 7
Scope of this study ................................................................................................................................... 7
2 Methods ................................................................................................................................................ 7
Study design ............................................................................................................................................. 7
Step 1: Population denominators ............................................................................................................. 8
Step 2: Ground mortality survey data ....................................................................................................... 9
Step 3: Mortality predictor data ................................................................................................................ 9
Step 4: Statistical models to predict the death rate ................................................................................ 11
Step 5: Counter-factual baseline assumptions....................................................................................... 11
Step 6: Estimation of excess death toll .................................................................................................. 12
Estimation of the number of people killed .............................................................................................. 12
Ethics ...................................................................................................................................................... 12
3 Results ................................................................................................................................................ 13
Mortality survey availability ..................................................................................................................... 13
Patterns in survey-estimated mortality and other household indicators ................................................ 15
Evolution of population denominators .................................................................................................... 17
Statistical models to predict mortality ..................................................................................................... 18
Excess death toll estimates .................................................................................................................... 19
Estimates of people killed ....................................................................................................................... 23
4 Discussion ........................................................................................................................................... 24
Findings in context .................................................................................................................................. 24
Study strengths and limitations .............................................................................................................. 24
Conclusions ............................................................................................................................................ 27
5 References .......................................................................................................................................... 28
6 Annex .................................................................................................................................................. 30
Notes on geographical names and units ................................................................................................ 30
Quality scoring of eligible mortality surveys ........................................................................................... 30
Re-analysis of mortality survey datasets ................................................................................................ 31
Treatment of mortality surveys without available datasets .................................................................... 32
Patterns in survey estimates .................................................................................................................. 33
Conceptual framework of candidate mortality predictors ....................................................................... 35
Further details on predictor data ............................................................................................................ 36
Predictive models ................................................................................................................................... 39
Additional tables and figures .................................................................................................................. 42

LSHTM – Crisis-attributable mortality in South Sudan Page 4 of 45
Acknowledgments
This work was funded by the United States Institute of Peace, where we are particularly indebted to Payton Knopf, Susan Stigant, Nicoletta Barbera and Ailie Morgan for support and advice. A Warsame was supported by UK Research and Innovation as part of the Global Challenges Research Fund, grant number ES/P010873/1.
We are extremely grateful to colleagues in South Sudan who were instrumental in collecting data and facilitating access to these data, in particular Ismail Kassim and Kiross Tefera Abebe (United Nations Children’s Fund and Nutrition Cluster Information Working Group), and Ryan Burbach (World Health Organization).
At the London School of Hygiene & Tropical Medicine, we are grateful to Hayley Curran and Anna Carnegie for project management support, Neal Alexander for statistical review and advice, and Daniel Carter for data management.
Disclaimer
Geographical names and boundaries presented in this report are used solely for the purpose of producing scientific estimates, and do not necessarily represent the views or official positions of the authors, the London School of Hygiene and Tropical Medicine, any of the agencies that have supplied data for this analysis, or the donors.
The authors are solely responsible for the analyses presented here, and acknowledgment of data sources does not imply that the agencies providing data endorse the results of the analysis.

LSHTM – Crisis-attributable mortality in South Sudan Page 5 of 45
List of tables and figures
Table 1. Variables considered in the analysis as plausible predictors of mortality, by level of causation (see conceptual framework). .............................................................................................................................. 10 Table 2. Counterfactual assumptions made for the main baseline estimate. ............................................ 11 Table 3. Crude summary statistics for eligible mortality surveys, overall and by year. ............................. 15 Table 4. Ordinary least-squares model to predict crude death rate. ......................................................... 18 Table 5. Quantile-quantile non-parametric regression models to predict the injury-specific and violence-specific death rate. ..................................................................................................................................... 19 Table 6. Estimated total, baseline and excess death toll (all ages, all causes), by state hub and overall. .................................................................................................................................................................... 20 Table 7. Estimated number of people killed (all ages), by state hub and overall. ..................................... 23 Table 8. Sensitivity analysis of the effect of uncertainty in population denominators on the estimated excess death toll. .................................................................................................................................................... 25 Table 9. Assessment of strength of evidence of the estimates. ................................................................ 26 Table 10. Survey quality scoring criteria. ................................................................................................... 30 Table 11. Comparison of aggregate and individual mortality questionnaires. ........................................... 32 Table 12. Details on sources and management of candidate mortality predictor data. ............................ 36 Table 13. Estimated excess death toll, by county. ..................................................................................... 42 Table 14. Estimated excess death toll (all ages, all causes), by state hub and overall, using predictions from quantile-quantile regression. .............................................................................................................. 44 Table 15. Estimated excess death toll (all ages, all causes), by state hub and overall, using the 2008 census crude death rate as baseline. ........................................................................................................ 44
Figure 1. Schematic of estimation steps and required inputs. ..................................................................... 8 Figure 2. Flowchart of mortality survey report and database availability. ................................................. 13 Figure 3. Availability of ground mortality information by month and county. Colours indicate relative amount of information. ............................................................................................................................................. 14 Figure 4.Injury-specific death rate point estimates from eligible surveys, by month and region. .............. 16 Figure 5. Relative risk of dying among males, compared to females, by month and region. The red line indicates an equal risk. ............................................................................................................................... 16 Figure 6. Comparison of proportional mortality due to all injuries and proportional mortality due to violence in 44 surveys with data on both. ................................................................................................................ 17 Figure 7. Estimated displaced and non-displaced populations in and outside South Sudan, over time. The red vertical line indicates the start of major conflict. .................................................................................. 17 Figure 8. Estimated total, baseline and excess death toll (all ages, all causes), by year. Brackets indicate 95% confidence intervals. .......................................................................................................................... 20 Figure 9. Estimated total and baseline crude death rate, by month. Shaded areas indicate 95% confidence intervals. ..................................................................................................................................................... 21 Figure 10. Mean estimated crude death rate by county, Dec 2013 to Apr 2018. ...................................... 22 Figure 11. Estimated number of people killed (all ages), by year. Brackets indicate 95% confidence intervals. ..................................................................................................................................................... 23 Figure 12. Sensitivity analysis of the effect of under-reporting of under 5y deaths. ................................. 26 Figure 13. Distribution of survey quality scores ......................................................................................... 31 Figure 14. Crude death rate point estimates from eligible surveys, by mid-point of the recall period and region. ......................................................................................................................................................... 33 Figure 15. Under 5 years death rate point estimates from eligible surveys, by mid-point of the recall period and region................................................................................................................................................... 34 Figure 16. Net migration rate point estimates from available surveys, by recall period mid-point and region. .................................................................................................................................................................... 34 Figure 17. Causal framework of predictors of excess mortality. ................................................................ 35 Figure 18. Terms of trade (Kg of white flour that can be purchased by a medium-sized goat), by state and month. The red line shows raw data. The blue line shows smoothed values. .......................................... 38 Figure 19. Diagnostic plots for ordinary least-squares model to predict crude death rate. ....................... 40 Figure 20. Predictions versus data for quantile-quantile regression model of crude death rate. .............. 40 Figure 21. Predictions versus data for quantile-quantile regression models of injury-specific (left) and violence-specific (right) death rate. ............................................................................................................ 41

LSHTM – Crisis-attributable mortality in South Sudan Page 6 of 45
Figure 22. Map of South Sudan counties, showing the average estimated excess death rate over the period of analysis................................................................................................................................................... 45
List of abbreviations
ACLED Armed Conflict Location & Event Data Project AFP Acute Flaccid Paralysis AWSD Aid Worker Security Database CDR Crude death rate CI Confidence interval ENA Emergency Nutrition Assessment (software) EPI Expanded Programme on Immunisation FEWS NET Famine Early Warning Systems Network IDP Internally displaced person IPC Integrated Phase Classification LOOCV Leave-one-out cross-validation mo Month OLS Ordinary Least-Squares (regression) PoC Protection of Civilians (site) SE Standard error SMART Standardised Monitoring and Assessment of Relief and Transitions UN United Nations UNHCR United Nations High Commissioner for Refugees UN OCHA United Nations Office for the Coordination of Humanitarian Affairs USD United States Dollar U5DR Under 5 years death rate WFP United Nations World Food Programme WHO World Health Organization y Year

LSHTM – Crisis-attributable mortality in South Sudan Page 7 of 45
1 Background
South Sudan context
The Republic of South Sudan became independent in July 2011 after decades of armed conflict. During the next two years, despite ongoing insecurity in different regions, the country developed its institutions and services. In December 2013, large-scale conflict resumed, initially between armed groups loyal to President Salva Kiir and his deputy, Riek Machar. A Compromise Peace Agreement signed in August 2015 temporarily led to shared government, but broke down in July 2016, with conflict gaining intensity and spreading geographically since then.
As of early 2018, the war involved about two dozen, mostly communally-based armed groups, and had caused the displacement of about 2 million people within South Sudan and a further 2.5 million as refugees to neighbouring countries. The humanitarian response to this crisis is among the largest worldwide, targeting about 6 million people with a total funding requirement of 1.7 billion USD in 2018, 45% funded as of September 2018.1
Scope of this study
Protracted armed conflicts are characterised by increased population mortality, both directly (violence) and indirectly (increased risk of disease, reduced access to healthcare) attributable to the crisis.2 Information on this “excess” mortality can inform the ongoing humanitarian response, provide evidence for resource mobilisation, and support conflict resolution.3 We aimed to estimate the death rate and death toll attributable to the war in South Sudan from its start in December 2013 to April 2018 (4y 4mo), and the number of people killed during the same period. Our analysis covers the population living within South Sudan at any point during the above period and excludes both refugees to South Sudan and South Sudanese refugees abroad.
2 Methods
Study design
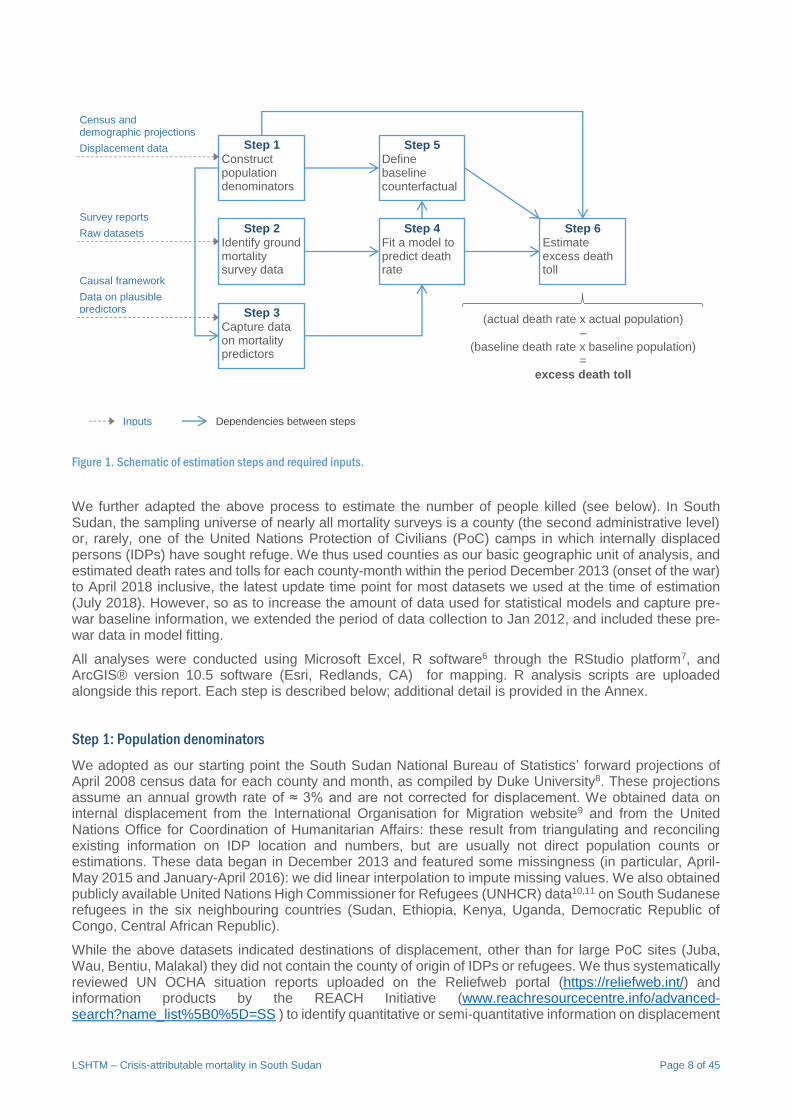
We adapted a six-step statistical regression approach previously used for Somalia4 and akin to indirect small-area estimation methods5 (Figure 1). This consisted of:
1. Reconstructing the evolution of population denominators across time (months) and space (counties of South Sudan: see below) during the analysis period, by accounting for population growth, internal displacement and refugee movements;
2. Identifying, reviewing and where possible re-analysing any small-area surveys of retrospective mortality conducted in South Sudan over the last few years;
3. Capturing and curating data on variables that plausibly predicted mortality, based on a causal framework, and that covered the entirety of South Sudan and, at a minimum, the entire period of analysis;
4. Fitting a statistical model to predict death rate built using the predictors from step 3 (independent variables) and individual ground survey death rate estimates (dependent variable) from step 2;
5. Coming up with counterfactual assumptions about what value model predictors would have taken in the absence of the crisis, and creating a corresponding counterfactual dataset to represent “baseline” conditions;
6. Applying the model to both the actual and counterfactual datasets to predict both total and baseline death rates, respectively; multiplying estimated death rates by the corresponding population denominators from step 1; and subtracting the baseline from the total death toll to compute excess, crisis-attributable mortality.
LSHTM – Crisis-attributable mortality in South Sudan Page 8 of 45
Figure 1. Schematic of estimation steps and required inputs.
We further adapted the above process to estimate the number of people killed (see below). In South Sudan, the sampling universe of nearly all mortality surveys is a county (the second administrative level) or, rarely, one of the United Nations Protection of Civilians (PoC) camps in which internally displaced persons (IDPs) have sought refuge. We thus used counties as our basic geographic unit of analysis, and estimated death rates and tolls for each county-month within the period December 2013 (onset of the war) to April 2018 inclusive, the latest update time point for most datasets we used at the time of estimation (July 2018). However, so as to increase the amount of data used for statistical models and capture pre-war baseline information, we extended the period of data collection to Jan 2012, and included these pre-war data in model fitting.
All analyses were conducted using Microsoft Excel, R software6 through the RStudio platform7, and ArcGIS® version 10.5 software (Esri, Redlands, CA) for mapping. R analysis scripts are uploaded alongside this report. Each step is described below; additional detail is provided in the Annex.
Step 1: Population denominators
We adopted as our starting point the South Sudan National Bureau of Statistics’ forward projections of April 2008 census data for each county and month, as compiled by Duke University8. These projections assume an annual growth rate of ≈ 3% and are not corrected for displacement. We obtained data on internal displacement from the International Organisation for Migration website9 and from the United Nations Office for Coordination of Humanitarian Affairs: these result from triangulating and reconciling existing information on IDP location and numbers, but are usually not direct population counts or estimations. These data began in December 2013 and featured some missingness (in particular, April-May 2015 and January-April 2016): we did linear interpolation to impute missing values. We also obtained publicly available United Nations High Commissioner for Refugees (UNHCR) data10,11 on South Sudanese refugees in the six neighbouring countries (Sudan, Ethiopia, Kenya, Uganda, Democratic Republic of Congo, Central African Republic).
While the above datasets indicated destinations of displacement, other than for large PoC sites (Juba, Wau, Bentiu, Malakal) they did not contain the county of origin of IDPs or refugees. We thus systematically reviewed UN OCHA situation reports uploaded on the Reliefweb portal (https://reliefweb.int/) and information products by the REACH Initiative (www.reachresourcecentre.info/advanced-search?name_list%5B0%5D=SS ) to identify quantitative or semi-quantitative information on displacement
Step 1
Construct population denominators
Step 2 Identify ground mortality survey data
Step 3 Capture data on mortality predictors
Step 4 Fit a model to predict death rate
Step 5 Define baseline counterfactual
Step 6 Estimate excess death toll
(actual death rate x actual population) –
(baseline death rate x baseline population) =
excess death toll
Census and demographic projections
Displacement data
Survey reports Raw datasets
Causal framework
Data on plausible predictors
Inputs Dependencies between steps

LSHTM – Crisis-attributable mortality in South Sudan Page 9 of 45
flows and dates, and estimate the percent origin of IDPs or refugees for each county-month. We generally held these percentages constant until the next reported displacement wave. IDP data were altogether missing prior to December 2013, and we relied on published situation reports to approximate figures for the January 2012 to November 2013 period. We used the above information to adjust county-month census projections by subtracting emigrants (IDPs to other counties or refugees) and adding immigrants (IDPs to the county).
Step 2: Ground mortality survey data
Since 2010, the inter-agency Standardised Monitoring and Assessment of Relief and Transitions (SMART) initiative has increasingly rolled out and supported training on a systematic method for household public health and food security surveys in crisis settings.12 The SMART toolbox includes a standard protocol, data collection instruments, template reports and the Emergency Nutrition Assessment (ENA) software to plan, enter data and automatically analyse surveys.13 SMART surveys are conducted primarily to monitor the prevalence of acute malnutrition. However, they usually also feature a retrospective mortality component in which respondents are interviewed about the composition of their household, births, deaths and in- or out-migrations during a so-called “recall” period whose duration (typically 3-4mo) is defined opportunistically by a memorable date in the recent past.14 Earlier SMART surveys mainly relied on an “aggregate” mortality questionnaire, which elicited simple information on the number of household members and number of demographic events during the recall period; more recently, “individual” questionnaires have been the norm, whereby each household member, past or present is listed separately (see Annex). Individual questionnaires also collect information on gender and cause of death as reported by next-of-kin respondents; this cause is usually classified broadly into disease, injury and unknown categories.
In South Sudan, the Nutrition Cluster’s Information Working Group coordinates and supports the quality implementation of SMART surveys. We obtained survey reports and, where possible, raw datasets for any surveys known to the Working Group as having been conducted from January 2012 onwards. We extracted necessary meta-data from each report, noted obvious issues with implementation, particularly sampling constraints (e.g. reduction of the effective sampling frame due to insecurity in parts of the county) and applied a simplified version of a previously published algorithm15 to assign a relative quality score to each survey (see Annex). We cleaned and re-analysed each available dataset and, where discordant, adopted re-estimated figures for further analysis; generally, there was high concordance between estimates presented in survey reports and our re-analysis (see Annex).
The following survey-estimated indicators were carried forward as dependent variables for statistical models: (i) the crude death rate (CDR), defined as the number of deaths due to any cause among all ages occurring in a given population unit per unit time (in humanitarian settings, deaths per 10,000 person-days is the conventional scale); the under 5 years death rate (U5DR), namely deaths of children under 5y among the under 5y population per unit time; the injury-specific death rates, equal to CDR but with the numerator consisting only of deaths reported as injury-related; and the violence-specific death rate, whenever a survey distinguished intentional from unintentional injury deaths: this cause of death was variably coded as ‘violence’, ‘killing’ or ‘war-related’.
Step 3: Mortality predictor data
We adapted a previously published conceptual framework16 of causes of mortality in crisis settings (Annex, Figure 17). We then did online searches and contacted agencies in South Sudan to identify previously collected data on variables that were direct or proxy measures of each domain in the framework. Datasets were considered eligible if they had consistent geographical (all of South Sudan at county or state level) and time (starting no later than December 2013) coverage.
Table 1 lists candidate predictor variables for which sufficiently complete datasets were identified, organised by causality level and domain; see the Annex for sources and data cleaning details. While further data on health service functionality, disease burden and humanitarian services were sought, these were either too sparse or covered only a recent period. Generally, for each dataset we corrected obvious data entry errors (e.g. incorrect county names) and removed unusual values based on range and consistency checks.

LSHTM – Crisis-attributable mortality in South Sudan Page 10 of 45
Table 1. Variables considered in the analysis as plausible predictors of mortality, by level of causation (see conceptual framework).
Variable Value(s) Domain Geographic
unit Time unit
Span of data
Notes and assumptions
Distal
Rainfall Difference between 3mo running average and 10y historical average (mm)
Climate County Month Jan 2012 to Apr 2018
Explored lags of 0-6mo.
Season (climate)
month (Jan-Dec) rainy, dry month
Climate County Month n/a Expected seasonal pattern.
Incidence of armed conflict events†
events per 100,000 population
Exposure to armed conflict / insecurity
County Month Jan 2012 to Apr 2018
Explored lags of 0-6mo.
Incidence of attacks against aid workers†
events per 100,000 population
Exposure to armed conflict / insecurity
County Month Jan 2012 to Apr 2018
Explored lags of 0-6mo.
Region northeast, northwest, southern
Exposure to armed conflict / insecurity
County n/a n/a Areas under opposition control or disputed had decreased service provision.
Proportion of IDPs
proportion Forced displacement
County Month Jan 2012 to Apr 2018
As per our population estimation.
Intermediate
Main local livelihood type
agriculturalist, agropastoral, pastoralist, displaced (PoC camps only)
Food security and livelihoods
County n/a n/a Assumed to be constant over time.
Season (food) lean, not lean month Food insecurity and livelihoods
livelihood zone
n/a n/a Expected seasonal pattern.
Cereal harvest†
metric tonnes per 1000 population
Food insecurity and livelihoods
county Year Jan 2010 to Dec 2017
Distributed equally across each month of the year. Theoretical requirement ≈ 10 mt per 1000 person-months.
Terms of trade purchasing power index
Kg of white wheat flour that an average medium goat can be exchanged for (3mo running average)
Food insecurity and livelihoods
state (average of 1-3 markets per state)
Month Jan 2011 to Apr 2018
Explored lags of 0-6mo.
Food distributions†
metric tonnes per 100,000 population
Food insecurity and livelihoods
county Month Jan 2013 to Apr 2018
Explored lags of 0-6mo.
Humanitarian actor presence †
actors per 100,000 population (all sectors; health, nutrition and water, hygiene & sanitation; health only)
Humanitarian service functionality
county Month Feb 2014 to Apr 2018
Proxy of level of humanitarian response.
Acute flaccid paralysis incidence†
cases per 100,000 population
Health service functionality
county Month Jan 2012 to Mar 2018
Proxy of functionality of public health surveillance.
Uptake of measles routine vaccination†
doses given per 100,000 population
Health service coverage
county Month Jan 2012 to Apr 2018
Assume no value = no routine vaccination taking place.
Proximate
Cholera incidence†
cases per 100,000 population
Disease burden (epidemic)
county Month Jan 2012 to Apr 2018
Suspected and confirmed cases. No cases reported before 2014.
Measles incidence†
cases per 100,000 population
Disease burden (epidemic)
county Month Jan 2012 to Apr 2018
Suspected and confirmed cases.
† Divided by county population estimates to obtain a population rate.

LSHTM – Crisis-attributable mortality in South Sudan Page 11 of 45
Step 4: Statistical models to predict the death rate
We fitted ordinary least-squares (OLS) regression models to each survey-month containing a survey estimate of CDR or U5DR, with composite weights reflecting survey quality, any representativeness issues due to incomplete coverage of the county and the proportion of the county-month covered by the survey (see Annex). We explored the univariate association of each candidate predictor with CDR or U5DR and categorised variables appropriately. For variables that may have caused mortality with some delay (e.g. terms of trade), we explored lags of 0 to 6mo (see Table 1). We selected distal, intermediate and proximate predictors to carry into multivariate analysis based on their predictive power (adjusted R2 ≥ 1%). We built a distal model first, then added intermediate predictors, and lastly proximate predictors, retaining variables if they had a plausible association with death rate, improved fit and did not worsen the expected predictive power of the model on external data, which we quantified using leave-one-out cross-validation (LOOCV). We tested plausible effect modifications using the same criteria. Recognising the nested data structure (repeat surveys within the same county), we also specified county as a random effect, but LOOCV indicated this led to substantial overfitting.
We did Box-Cox transformations of CDR and U5DR to achieve better fits. Since models remained mildly heteroskedastic, we also tried non-parametric regression techniques including quantile-quantile regression17 (predicting the median of square-root transformations of CDR and U5DR), multivariate adaptive regression splines18 and decision trees19, all of which yielded similar findings. We present only estimates from OLS and quantile-quantile regression.
Step 5: Counter-factual baseline assumptions
Table 2 presents assumptions made to create a counterfactual dataset containing values of the final model predictors in the absence of a crisis. We assumed that displacement due to the communal conflict in Pibor county would have persisted, and that elsewhere displacement levels would have been as pre-war in terms of national average, but locally proportional to each county’s share of total IDPs during the war period. Apart from a few counties in which conflict intensity was lower during the war period than before, for each predictor we applied the 2012-2013 levels specific to each county.
Table 2. Counterfactual assumptions made for the main baseline estimate.
Variable Counterfactual assumptions Notes
Proportion of IDPs The proportion of IDPs in each county would have been equal to the mean total across South Sudan in Jan 2012-Nov 2013, multiplied by the county’s mean percent share of total IDPs during Dec 2013-Apr 2018. Same number of IDPs in Pibor county as mean of 2012-2013. Refugee denominators unchanged.
Assume that the relative scale of internal displacement during the war reflects each county’s general potential for displacement. Accordingly, in the counterfactual denominator IDPs are “returned” to their counties of origin pro rata to the assumption. Assume conflict in Pibor County would have continued. Necessary so as to compare an equal overall population within South Sudan: however, this may lead to under- or over-estimation if refugees experienced higher or lower mortality.
Incidence of armed conflict events
Mean of 2012-2013 level within each county, or actual level, whichever is lower.
Incidence of attacks against aid workers
Mean of 2012-2013 level within each county, or actual level, whichever is lower.
Terms of trade purchasing power index
Mean of 2012-2013 levels per state.
Food distributions Mean of Jan-Nov 2013 levels per county. No data available prior to 2013.
Uptake of measles routine vaccination
On an annual basis, no lower than the mean of 2012-2013 levels per county.
Assumption preserves any improvements in vaccination coverage observed during the crisis period in any county.
Cholera incidence Zero. South Sudan had no reported cholera transmission between 2010 and 2013. Cholera is highly associated with crisis conditions.

LSHTM – Crisis-attributable mortality in South Sudan Page 12 of 45
As an alternative baseline scenario, we assumed that the CDR in each county would have been equal to the 2008 census value (0.55 per 10,000 person-days).
Step 6: Estimation of excess death toll
We used a bootstrap procedure to estimate excess mortality and confidence intervals (CIs). For each of 10,000 runs and each county-month, we (i) sampled and back-transformed a random actual and baseline CDR value from the respective normal distributions of the OLS predictions; (ii) multiplied both by estimated population denominators; and (iii) subtracted baseline from actual death tolls to obtain the excess. For any desired level of aggregation (e.g. by state or by year), we summed random runs across county-months and computed medians and 95% percentile intervals of the distribution of sums. We also calculated 95%CIs through statistical error propagation rules and obtained nearly identical results.
We also present alternative excess death toll estimates using quantile-quantile regression predictions: the latter consist of a non-parametric step-function that represents the probability distribution of CDR for any given county-month, with quantiles from 1% to 99% of the distribution determining the steps. Accordingly, for step (i) above we sampled random CDR values from this step-function.
Estimation of the number of people killed
We implemented two approaches to estimate numbers killed during the war period:
1. In this regression approach, we fit a model to predict the injury death rate from any of the candidate predictors and CDR itself; we then fit a model to predict the violent death rate from any of the predictors and the injury death rate itself. We used quantile-quantile regression for both models, as OLS fits displayed highly non-normal residuals, but otherwise built models as described for CDR. We estimated the number of people killed for each county-month as the median and 95% percentile intervals of 10,000 runs of the following sequential process: (i) generating a random CDR prediction as in Step 6 above; (ii) predicting injury death rate based on predictor data and the random CDR value; (iii) generating a random injury death rate by sampling from from the non-parametric prediction step-function generated by quantile-quantile regression across the 0-100% quantile range; (iv) predicting violent death rate based on predictor data and the random injury death rate value; and (v) generating a random violent death rate value as above, which we then multiplied by population. We adopted this approach to maximise data availability, noting that injury data were far more frequent than violence data, but that violence mortality, when available, was strongly correlated with injury (see Results).
2. In a more empirical approach, we (i) repeatedly (10,000 runs) sampled random CDR values for each county-month as in Step 6; (ii) randomly sampled a proportion of violent deaths from the observed distribution of violent death proportional mortality across all the surveys; and (iii) multiplied CDR by proportion of violent deaths.
We also tried to predict the violent death rate directly from CDR or modelling the proportion of injury and/or violent deaths using beta regression; these alternatives yielded unsatisfactory fits.
Ethics
All data were previously collected for routine humanitarian response and/or health service provision purposes, and were either in the public domain or shared in fully anonymised format. The study was approved by the Ethics Committee of the London School of Hygiene & Tropical Medicine (ref. 15334). We applied to the Ethics Review Committee of the South Sudan Ministry of Health (6 Apr 2018), but did not receive a response despite repeated inquiries.

LSHTM – Crisis-attributable mortality in South Sudan Page 13 of 45
3 Results
Mortality survey availability
Figure 2 summarises the availability of ground mortality survey reports and raw databases. Overall, we identified 227 surveys conducted between Jan 2012 and Apr 2018 by 36 different government, UN and non-governmental organisations. We included 92.5% (210/227) in the analysis and were able to re-analyse raw datasets of 86.1% (181/210) of these. Datasets were missing for 2/26 eligible surveys in 2012, 10/13 in 2013, 11/15 in 2014, 5/53 in 2015, 0/54 in 2016, 1/39 in 2017 and 0/10 in 2018.
An aggregate household questionnaire was used in 21/24 surveys with datasets in 2012, 3/3 in 2013 and 4/48 in 2015; all other datasets originated from individual-based questionnaires. Two surveys were exhaustive; the remainder did two-stage cluster sampling with probability of cluster allocation proportional to population size, and household selection within primary sampling units (usually villages) through simple random sampling out of household lists generated on site, with segmentation of villages in 52 surveys to reduce the household sampling frame.
Proportional mortality due to injuries was available for 167 surveys (146 within the dataset and a further 21 within the report). Only 44 differentiated unintentional injuries from intentional violence (hitherto referred to as ‘violence’) as a cause of death.
Figure 2. Flowchart of mortality survey report and database availability.
Overall, the analysis period included 764,482,000 person-months, of which 117,538,000 (15.4%) were included in the recall period of one or more surveys. Figure 3 shows survey data availability over time, by county, with darker colours proportional to the composite weight attributed to each survey-month of data (grey = no data). Survey person-time coverage was lowest in 2013 (5.4%, 6,524,000/121,095,000 person-months) and highest in 2016 (25.9%, 32,389,000/125,110,000). Data collection intensified during the crisis years.
227 SMART surveys shared
17 not eligible for analysis
10 no mortality data collected
2 likely duplicates
2 unrepresentative (small IDP camp)
1 covered three counties with no
stratification
2 very unusual CDR 95%CI
210 eligible for analysis
1 report not available
1 dataset not available
209 report available
28 dataset not available
181 dataset available
28 "aggregate" household
questionnaire
153 "individual" household
questionnaire

LSHTM – Crisis-attributable mortality in South Sudan Page 14 of 45
Figure 3. Availability of ground mortality information by month and county. Colours indicate relative amount of information.

LSHTM – Crisis-attributable mortality in South Sudan Page 15 of 45
Patterns in survey-estimated mortality and other household indicators
Table 3 reports summary descriptive statistics for eligible surveys, not adjusted for possible confounders. Both CDR and U5DR estimates were in a wide range; CDR was mostly elevated compared to the 2008 census value, but U5DR was notably lower, and the proportion of infants among all under 5y deaths was consistently lower than in a country-wide multiple indicator cluster survey done in 2010. Net migration from surveyed households was negative during the crisis years, particularly in the north-eastern region (see Annex, Figure 16). Other findings were broadly consistent with census estimates.
Table 3. Crude summary statistics for eligible mortality surveys, overall and by year.
Statistic† Overall Year Comparison
2012 2013 2014 2015 2016 2017 2018 Value Source
Eligible surveys (N)
210 26 13 15 53 54 39 10 n/a
Crude death rate (per 10,000 person-days)
0.71 (0.04 to 4.84, 210)
0.75 (0.06 to 4.22, 26)
0.62 (0.13 to 1.90, 13)
0.62 (0.19 to 2.03, 15)
0.53 (0.06 to 2.78, 53)
0.79 (0.04 to 4.56, 54)
0.82 (0.25 to 4.08, 39)
1.20 (0.34 to 4.84, 10)
0.55‡ Census 200820
Injury-specific death rate (per 10,000 person-days)
0.15 (0.00 to 3.06, 171)
0.07 (0.00 to 1.60, 8)
0.03 (0.00 to 0.26, 3)
0.09 (0.05 to 0.43, 8)
0.09 (0.00 to 2.50, 49)
0.15 (0.00 to 2.58, 54)
0.20 (0.00 to 2.96, 39)
0.35 (0.08 to 3.06, 10)
0.14‡ Census 200820
Under 5 years death rate (per 10,000 child-days)
0.75 (0.00 to 4.89, 210)
1.11 (0.00 to 3.08, 26)
0.97 (0.27 to 4.89, 13)
1.01 (0.00 to 3.78, 15)
0.59 (0.00 to 2.64, 53)
0.76 (0.00 to 3.85, 54)
0.66 (0.00 to 1.85, 39)
0.73 (0.00 to 2.13, 10)
1.78‡ Census 200820
Proportion of under 5y deaths that were among infants <1y
0.33 (0.00 to 1.00, 145)
0.29 (0.00 to 0.57, 2)
n/a (n/a, 0)
0.40 (0.00 to 1.00, 3)
0.40 (0.00 to 1.00, 42)
0.34 (0.00 to 1.00, 52)
0.33 (0.00 to 1.00, 37)
0.25 (0.00 to 0.67, 9)
0.73 Household Health Survey 201021
Household size
6.6 (3.1 to 9.9, 181)
6.6 (5.2 to 8.2, 24)
6.7 (6.4 to 6.9, 3)
6.3 (5.2 to 6.7, 4)
6.4 (3.1 to 9.6, 48)
6.6 (3.5 to 8.8, 54)
6.8 (4.3 to 9.9, 38)
7.4 (6.2 to 8.7, 10)
7 Census 200820
Proportion of children under 5y
0.19 (0.14 to 0.28, 181)
0.19 (0.16 to 0.28, 24)
0.19 (0.18 to 0.22, 3)
0.21 (0.20 to 0.25, 4)
0.19 (0.14 to 0.28, 48)
0.19 (0.15 to 0.26, 54)
0.19 (0.14 to 0.28, 38)
0.17 (0.15 to 0.22, 10)
0.16 Census 200820
Proportion of females in household
0.52 (0.46 to 0.59, 153)
0.53 (0.51 to 0.53, 3)
n/a (n/a, 0)
0.52 (0.49 to 0.59, 4)
0.52 (0.48 to 0.58, 44)
0.53 (0.48 to 0.58, 54)
0.52 (0.46 to 0.57, 38)
0.51 (0.49 to 0.53, 10)
0.48 Census 200820
Crude birth rate (per 1000 person-years)
33.8 (1.4 to 128.1, 181)
49.0 (13.2 to 128.1, 24)
48.7 (29.8 to 77.3, 3)
20.2 (3.1 to 71.5, 4)
32.4 (1.4 to 82.1, 48)
35.1 (7.2 to 88.2, 54)
29.1 (1.7 to 55.6, 38)
24.3 (15.9 to 109.9, 10)
37 US Census Bureau 201522
Net migration rate (per 1000 person-years)
-129 (-791 to 936, 181)
4 (-259 to 329, 24)
51 (-11 to 210, 3)
-72 (-84 to -34, 4)
-57 (-517 to 399, 48)
-213 (-791 to 936, 54)
-174 (-762 to 97, 38)
-229 (-527 to -86, 10)
n/a
† Values in cells are median (range, number of surveys containing information). ‡ Approximated by combining number of people (all ages, under 5y) present on census dates, number of deaths (all ages, under 5y) reported by households over the previous 12mo and proportion of deaths due to injury.
We explored whether the unexpectedly low U5DR values could be explained through response bias, e.g. households omitting to mention child deaths, particularly in the neonatal period. Moderately significant crude positive associations between the crude birth rate and either U5DR or the proportion of infant deaths among all deaths under 5y were observed by OLS regression (p = 0.01, p = 0.04 respectively); higher child mortality is expected as birth rate increases, but these findings may also indicate that births and neonatal/infant deaths may have been simultaneously under-reported (see Discussion). There was, however, no association between survey quality score and U5DR or proportion of infant deaths (data not shown).

LSHTM – Crisis-attributable mortality in South Sudan Page 16 of 45
Survey point estimates suggested large regional differences in the death rate due to injury (Figure 4), and a far higher death rate among males than females, especially in the northeast region (Figure 5).
Figure 4.Injury-specific death rate point estimates from eligible surveys, by month and region.
Figure 5. Relative risk of dying among males, compared to females, by month and region. The red line indicates an equal risk.

LSHTM – Crisis-attributable mortality in South Sudan Page 17 of 45
Proportional mortality due to violence was within 10% of that due to all injuries in 31/44 surveys that captured both quantities (Figure 6).
Figure 6. Comparison of proportional mortality due to all injuries and proportional mortality due to violence in 44 surveys with data on
both.
Evolution of population denominators
We estimated that the population living inside South Sudan (excluding refugees from other countries) peaked at about 10.2 million right before the start of major conflict, and had declined to 9.7 million by April 2018, of whom 1.8 million were IDPs (Figure 7). The number of South Sudanese refugees in neighbouring countries rose from 0.1 million to 2.5 million during the same period.
Figure 7. Estimated displaced and non-displaced populations in and outside South Sudan, over time. The red vertical line indicates the
start of major conflict.

LSHTM – Crisis-attributable mortality in South Sudan Page 18 of 45
Statistical models to predict mortality
The main OLS model to predict crude death rate is shown in Table 4. Model diagnostic plots are shown in the Annex (Figure 19). The model had moderate predictive power, and there was evidence of dilution of the regression slope, resulting in potential under-estimation. Observed associations were plausible: CDR increased linearly with incidence of armed conflict events and proportion of IDPs, and decreased linearly with vaccination uptake; CDR also appeared to increase with attacks against aid workers and where cholera was reported, but was lower among PoC-based populations and those that received food distributions, while also decreasing with increasing terms of trade.
Table 4. Ordinary least-squares model to predict crude death rate.
Predictor Coefficient† Standard error† P-value
(intercept) -0.08 0.09 0.371
Distal causal level
Incidence of armed conflict events (events per 100,000 people; lag = 4mo)
0 ref.
0.01-0.99 0.09 0.05 0.073
1.00-1.99 0.29 0.06 <0.001
≥ 2.00 0.37 0.06 <0.001
Incidence of attacks against aid workers (incidents per 100,000 people; lag = 5mo)
0 ref.
≥ 0 0.29 0.09 0.001
Region
northwest ref.
northeast 0.22 0.05 <0.001
southern 0.21 0.07 0.004
Main local livelihood type
agriculturalist ref.
agropastoral -0.10 0.06 0.121
pastoralist 0.05 0.09 0.585
PoC site -0.42 0.15 0.005
Proportion of the population that is internally displaced
<25% ref.
25.0-49.9% 0.09 0.06 0.109
50.0-74.9% 0.16 0.06 0.009
75.0-99.9% 0.38 0.08 <0.001
100% (PoC sites) -0.10 0.13 0.438
Intermediate causal level
Terms of trade (Kg white flour per goat; lag =3 mo) -0.01 0.00 <0.001
Food distributed (mt per 100,000 people; lag = 2mo)
0 ref.
0.1-19.9 -0.19 0.06 0.001
20.0-49.9 -0.07 0.07 0.310
50.0-199.9 -0.07 0.06 0.240
200.0-499.9 -0.12 0.06 0.051
≥ 500.0 -0.08 0.06 0.176
Uptake of measles vaccination (doses per 100,000 people)
0 ref.
0.1-49.9 -0.04 0.07 0.522
50.0-249.9 -0.08 0.05 0.115
≥ 250.0 -0.16 0.06 0.006
Proximate causal level
Cholera incidence
0 ref.
≥ 0 0.14 0.05 0.004
Model validity Internal External‡
Mean squared residuals (untransformed) 0.191 0.203
Adjusted R2 36% 30%
Percent of predictions within ± 0.5 deaths per 10,000 person-days of data 74% 73%
Percent of predictions within ± 1.0 deaths per 10,000 person-days of data 91% 90%
† Box-Cox transformation (λ = 0.22). ‡ Expected based on leave-one-out cross-validation (LOOCV).

LSHTM – Crisis-attributable mortality in South Sudan Page 19 of 45
A quantile-quantile regression model of CDR composed of the same predictors performed similarly (Annex, Figure 20). All U5DR models had very poor predictive power and are thus not presented. Best-fit quantile-quantile regression models for the injury-specific and violence-specific death rate are shown in Table 5, and corresponding prediction plots in the Annex (Figure 21).
Table 5. Quantile-quantile non-parametric regression models to predict the injury-specific and violence-specific death rate.
Predictor
Injury-specific death rate Violence-specific death rate
Coefficient† Standard
error† P-value Coefficient†
Standard error†
P-value
(intercept) 0.12 0.01 <0.001 0.08 0.03 0.014
Distal causal level
Region
northwest ref.
northeast 0.04 0.01 0.006
southern 0.02 0.02 0.369
Main local livelihood type
agriculturalist ref.
agropastoral 0.10 0.04 0.006
pastoralist -0.10 0.04 0.023
PoC site 0.10 0.07 0.181
Proportion of the population that is internally displaced
<25% ref. ref.
25.0-49.9% 0.06 0.02 0.018 -0.05 0.10 0.626
50.0-74.9% 0.05 0.04 0.172 -0.08 0.06 0.158
75.0-99.9% 0.19 0.06 0.003 -0.08 0.05 0.103
100% (PoC sites) 0.01 0.02 0.611 0.02 0.06 0.776
Intermediate causal level
(n/a)
Proximate causal level
Cholera incidence
0 ref.
≥ 0 0.05 0.03 0.093
Crude death rate 0.28 0.02 <0.001
Injury-specific death rate 0.97 0.11 <0.001
Model validity Internal External‡ Internal External‡
Mean squared residuals (untransformed)
0.036 0.036 0.023 0.024
Percent of predictions that are within ± 0.1 deaths per 10,000 person-days of the data
63% 63% 89% 89%
Percent of predictions that are within ± 0.2 deaths per 10,000 person-days of the data
81% 81% 98% 98%
† For median (τ = 0.5) prediction. Square-root transformation. ‡ Expected based on leave-one-out cross-validation (LOOCV).
Excess death toll estimates
During the period Dec 2013 to Apr 2018, we estimate that 1,177,600 deaths due to any cause occurred among people living within South Sudan, and that 794,600 deaths would have occurred under counterfactual assumptions (Table 2). This yields an excess death toll of 382,900 (Table 6), with the highest excess mortality projected for Jonglei, Unity and the southern (Eastern, Central, Western Equatoria) state hubs.

LSHTM – Crisis-attributable mortality in South Sudan Page 20 of 45
Table 6. Estimated total, baseline and excess death toll (all ages, all causes), by state hub and overall.
State hub Total deaths (95%CI) Baseline deaths (95%CI) Excess deaths (95%CI)
Central Equatoria 142,900
(139,800 to 146,200) 58,200
(57,200 to 59,200) 84,700
(81,400 to 88,200)
Eastern Equatoria 151,500
(149,700 to 153,400) 98,800
(97,400 to 100,300) 52,700
(50,200 to 55,100)
Jonglei 187,100
(184,900 to 189,100) 121,400
(119,900 to 122,800) 65,600
(63,100 to 68,100)
Lakes 92,700
(91,600 to 93,900) 87,500
(86,700 to 88,300) 5,200
(3,700 to 6,700)
Northern Bahr el Ghazal 72,700
(71,500 to 73,900) 53,300
(52,500 to 54,000) 19,500
(18,000 to 20,900)
Abyei Special Administrative Area
6,900 (6,700 to 7,200)
12,800 (12,400 to 13,300)
-5,900 (-6,500 to -5,400)
Unity 163,800
(161,600 to 165,900) 93,400
(92,400 to 94,700) 70,300
(67,800 to 72,700)
Upper Nile 142,300
(140,800 to 143,800) 122,400
(121,200 to 123,700) 19,900
(17,900 to 22,000)
Warrap 86,700
(85,500 to 87,800) 54,900
(54,100 to 55,700) 31,800
(30,400 to 33,200)
Western Bahr el Ghazal 44,900
(43,800 to 46,000) 44,500
(43,700 to 45,500) 300
(-1,000 to 1,700)
Western Equatoria 86,100
(85,000 to 87,300) 47,400
(46,700 to 48,000) 38,800
(37,500 to 40,100)
Total 1,177,600
(1,171,800 to 1,183,300) 794,600
(791,300 to 798,000) 382,900
(376,000 to 389,800)
We estimate that excess deaths were highest in 2016 and 2017 (Figure 8), mirroring the trends in elevation of CDR compared to the counterfactual baseline (Figure 9).
Figure 8. Estimated total, baseline and excess death toll (all ages, all causes), by year. Brackets indicate 95% confidence intervals.

LSHTM – Crisis-attributable mortality in South Sudan Page 21 of 45
Figure 9. Estimated total and baseline crude death rate, by month. Shaded areas indicate 95% confidence intervals.
Across South Sudan, Rubkona, Leer, Mayendit, Malakal, Koch, Panyijiar, Guit, Fashoda, Duk, Mundri West, and Panyikang counties experienced average CDR levels > 1 per 10,000 person-days during the analysis period, with CDR highest in Unity state hub (Figure 10). Death tolls and mean excess death rate by county are presented in the Annex, Table 13 and Figure 22 respectively.
Alternative estimation methods yielded reasonably similar estimates: a quantile-quantile regression of CDR predicted an excess death toll of 417,400 (Annex, Table 14 for state hub results), while using the 2008 census CDR as the baseline gave a lower estimate of 279,300 (Annex, Table 15).

LSHTM – Crisis-attributable mortality in South Sudan Page 22 of 45
Figure 10. Mean estimated crude death rate by county, Dec 2013 to Apr 2018.

LSHTM – Crisis-attributable mortality in South Sudan Page 23 of 45
Estimates of people killed
We estimate that 190,000 people were killed during the civil war period (note that this total includes any counterfactual baseline of violent mortality that would have occurred even without the war). An alternative method yields a somewhat higher total (Table 7).
Table 7. Estimated number of people killed (all ages), by state hub and overall.
State hub Number of people killed (95%CI)
Method 1 (regression-based) Method 2 (empirical)
Central Equatoria 14,700 (12,900 to 17,000) 26,500 (22,500 to 30,500)
Eastern Equatoria 10,000 (9,000 to 11,100) 28,100 (25,300 to 31,000)
Jonglei 34,700 (31,000 to 38,800) 34,800 (31,700 to 37,700)
Lakes 12,800 (11,200 to 14,400) 17,300 (15,400 to 19,300)
Northern Bahr el Ghazal 9,500 (8,000 to 11,400) 13,400 (11,300 to 15,300)
Abyei Special Administrative Area 800 (600 to 1,200) 1,300 (900 to 1,700)
Unity 55,100 (48,300 to 63,400) 30,500 (26,900 to 34,100)
Upper Nile 28,300 (25,400 to 31,900) 26,400 (24,000 to 29,000)
Warrap 11,900 (10,600 to 13,700) 16,100 (14,200 to 18,100)
Western Bahr el Ghazal 4,700 (3,800 to 5,900) 8,300 (6,900 to 10,000)
Western Equatoria 7,000 (6,300 to 7,700) 16,100 (14,400 to 17,800)
Total 190,000 (180,600 to 200,300) 218,900 (209,900 to 227,200)
Among the 21 surveys that reported violent deaths by age and gender, the mean proportion of those killed who were children under 18y was 10.6% (median 0.0%, range 0.0% to 57.1%), while women aged 18y or older were 7.9% (median 0.0%, range 0.0% to 33.3%); note that denominators are very small. Data were too sparse to attempt gender- and age-specific models of violent deaths.
As for excess deaths, most violent mortality occurred in 2016 and 2017 (Figure 11).
Figure 11. Estimated number of people killed (all ages), by year. Brackets indicate 95% confidence intervals.

LSHTM – Crisis-attributable mortality in South Sudan Page 24 of 45
4 Discussion
Findings in context
Our study suggests that South Sudanese living within South Sudan experienced consistently elevated death rates during the war period, peaking in 2016 and 2017. Mortality appeared highest in the northeast and southern regions of the country. A high proportion of deaths were due to injury and violence, mostly affecting adult males but not entirely sparing women and children. Unexpectedly, there was no evidence that under 5y mortality increased from baseline.
We believe these are the first such estimates for South Sudan as a whole. A survey23 done in 2016 in Unity state hub estimated a CDR > 1 per 10,000 person days, with about 7000 violent deaths over 1y in a population of 200-250,000, similar to our 2016 estimates for Unity (data not shown). Systematic monitoring of refugee arrivals to Ugandan camps during March-December 2017 yielded a pre-arrival CDR of 1.8 per 10,000 person-days, with 75% of deaths due to violence.24
During 2016-2017, deteriorating food security was a key focus of the South Sudan humanitarian response. The Integrated Phase Classification (IPC) system for benchmarking the gravity of food insecurity and associated risks issued progressively starker classifications, with the number of people projected to be severely food insecure rising from 2.1 million (September 2014) to a peak of 5.5 million in May-July 2017.25 Our study retrospectively corroborates some of the IPC classifications, at least on a relative scale, by confirming that Unity state hub in particular experienced very high excess mortality. Further deteriorations in food security may well occur on a vast scale in future if the war continues to damage livelihoods. However, our findings do not suggest death rates during the analysis period consistent with widespread severe food insecurity and malnutrition on a scale seen in recent famine events4,26.
Instead, these and other estimates point to a conflict that, for civilians, has been arguably even more violent than has been reported, and that has caused massive waves of displacement. Violence itself appears to be the key driver of overall mortality and of deaths indirectly attributable to the war. By comparison, violence caused 68-93% of deaths during the acute conflict phase in Darfur27, mostly among male adults28; 18% in rebel-held areas of Angola29; 67-76% in the Ituri region30 and 35-40% in the North Kivu province31 of the Democratic Republic of Congo; and 91% among Central African refugees in Chad 32. These surveys covered displaced populations and time periods of acute conflict; studies of excess mortality with a longer time span in large populations have generally pointed to more moderate but sustained elevations in death rate, as in the case of this study: for example, about 605,000 excess deaths were estimated across the Democratic Republic of Congo during 2003-200433, and 298,000 in Darfur from 2003 to 2008, of which 62,000 violent34; in Iraq, conflicting estimates of 654,000 excess deaths, nearly all violent35, and 151,000 violent deaths36 were issued for the period 2003-2006, and 405,000 (about 240,000 violent) for 2003-201137.
Study strengths and limitations
Unlike a single crisis-wide ground survey, our method makes efficient use of a wealth of existing data and ties mortality estimation to a realistic causal framework. The statistical model we developed, while only moderately predictive, performs well on external validation, and, critically, displays plausible associations between predictors and mortality expected based on our causal framework and existing evidence about the public health consequences of armed conflict. Our analytic approach enables estimation over a large time period and geographic scale, while also providing information for single county-month units or any aggregation of these over time or geography dimensions. Critically, it provides data for areas and periods that were never included in ground data collection, and would thus otherwise have been omitted from estimates.
Key study limitations are discussed below and their overall effect summarised in Table 9.
Insufficient error propagation. Our statistical analysis ignores errors around survey point estimates, meaning only regression model error is reflected in confidence intervals, which are consequently unrealistically narrow. We could not identify a straightforward solution to incorporate survey error in the analysis, but this should be explored in further applications of the method, e.g. through a combination of Monte Carlo and Bayesian model averaging techniques.

LSHTM – Crisis-attributable mortality in South Sudan Page 25 of 45
Uncertainty around population denominators. We likewise unrealistically assumed perfect accuracy of population figures. However, denominator error would affect both model fits (through inaccuracy in calculation of population rates, e.g. conflict intensity, and the proportion of IDPs) and the denominator used to compute death tolls from death rates. We can explore this uncertainty by reconstructing population denominators assuming a range of upward or downward biases in census projections and the numbers of IDPs and refugees within and outside each county. Applying these alternative denominators yields considerable variation in excess death tolls (Table 8), from as low as 183,800 assuming census figures are greatly under-estimated and displacement figures greatly over-estimated, to 580,700 in the opposite scenario. We believe that inaccurate displacement figures are more likely than inaccurate census projections, but as shown in Table 8 error in the latter is more impactful.
Table 8. Sensitivity analysis of the effect of uncertainty in population denominators on the estimated excess death toll.
Bias in displacement figures
-30% -20% -10% 0% +10% +20% +30%
Bia
s i
n c
en
su
s p
roje
cti
on
s
-30% 267,600 253,600 239,700 225,700 211,700 197,800 183,800
-20% 319,800 305,800 291,800 277,900 263,900 250,000 236,000
-10% 371,900 358,000 344,000 330,100 316,100 302,200 288,200
0% 424,100 410,200 396,200 382,300 368,300 354,300 340,400
+10% 476,300 462,400 448,400 434,400 420,500 406,500 392,600
+20% 528,500 514,500 500,600 486,600 472,700 458,700 444,700
+30% 580,700 566,700 552,800 538,800 524,800 510,900 496,900
Under-reporting of child deaths. We believe that under-reporting of child deaths during household interviews is the most plausible explanation for the unusually low U5DR estimates generated by most eligible surveys. That only ≈ 30-35% of under 5y deaths in the surveys were among infants strongly suggests that babies and very young children may have been differentially omitted: this is consistent with our and colleagues’ anecdotal experience of conducting mortality surveys in difficult settings without having sufficient time to ask probing questions of household respondents, and double-check information provided. It may also reflect cultural sensitivities around discussing children’s deaths specific to South Sudan. The SMART mortality questionnaire has never been thoroughly validated in different settings.38
We explored the effect of increasing proportions of under-reporting of under 5y deaths (25%, 50%, 75%) by augmenting survey CDR point estimates accordingly, re-fitting OLS models and estimating excess death tolls based on the new model predictions. As shown in Figure 12, while the actual and baseline death tolls rise substantially as under-reporting increases, the net effect on excess death toll is moderate. However, this sensitivity analysis assumes that the proportion of under-reporting remained constant over time: it is plausible instead that under-reporting increased during the crisis period, e.g. due to more difficult circumstances of survey implementation: this would better account for the apparent lack of change in U5DR during the war years, which is inconsistent with evidence from various other armed conflicts.33,39-41 Differential under-reporting as a function of conflict intensity would cause a greater under-estimation in excess death toll than that shown in Figure 12.

LSHTM – Crisis-attributable mortality in South Sudan Page 26 of 45
Figure 12. Sensitivity analysis of the effect of under-reporting of under 5y deaths.
Other issues. For some counties we estimate a negative excess death toll (Annex, Table 13): this may reflect genuine improvements in health status in some areas of South Sudan, compared to the baseline, but may also be due to model error and/or artificially returning displaced populations to their counties of origin in the counterfactual scenario, resulting in smaller denominators and thus death tolls in the counties with highest displacement and thus presumably highest CDR.
We did not attempt estimation of excess deaths among South Sudanese refugees. It is unclear whether this would have added to the overall death toll: refugees tend to experience lower mortality than other crisis-affected groups42, meaning South Sudanese abroad may have had a lower death rate than if they had remained within their country.
Counterfactual assumptions made to estimate baseline mortality may be inappropriate: for example, it is possible that in the absence of a major civil war, South Sudan would have known even less displacement and insecurity than we assumed counterfactually, or vice versa that local communal conflicts would have increased. While these assumptions can be questioned, conservatively adopting the 2008 baseline death rate still yields a death toll of 279,000 (Annex, Table 15).
Lastly, the observed dilution of the CDR regression slope (towards under-prediction) is known to often result from problems with predictor data quality43: for any independent variable, non-directional measurement error attenuates the observed correlation with the dependent variable (death rate). By contrast, any systematic error in predictor data (e.g. underestimation of cholera incidence) would probably have a low net effect on models, provided this bias remained constant over time.
Table 9. Assessment of strength of evidence of the estimates.
Characteristic Estimate of excess death toll Estimate of number of people killed
Precision assessment
Known or suspected reasons for under-estimating random error
No error propagation from survey estimates of CDR
No error propagation from survey estimates of CDR
No error propagation from survey estimates of proportional mortality
Known or suspected reasons for over-estimating random error
[none] [none]
Likely overall robustness of confidence intervals
Low (overly narrow) Very low (overly narrow)

LSHTM – Crisis-attributable mortality in South Sudan Page 27 of 45
Bias assessment
Known or suspected reasons for under-estimation
Under-reporting of child deaths, with possible increase in under-reporting over time
Dilution of CDR regression fit
Selection bias due to exclusion of insecure or inaccessible areas of a county from the survey’s sampling frame (documented for 56/210 or 26.6% surveys)
Dilution of CDR regression fit
Selection bias due to exclusion of insecure or inaccessible areas of a county from the survey’s sampling frame (documented for 56/210 or 26.6% surveys)
Known or suspected reasons for over-estimation
Over-reporting of displacement figures
Reduction in birth rate and increase in mortality during the war period, leading to lower rate of population growth and thus over-estimation of population
Over-reporting of displacement figures
Reduction in birth rate and increase in mortality during the war period, leading to lower rate of population growth and thus over-estimation of population
Other possible biases with unclear directionality
Inaccuracy in census estimates
Scant displacement data prior to 2014
Faulty assumptions about the counterfactual baseline (particularly around conflict intensity and displacement)
Inaccuracy in census estimates
Sparse data on proportional mortality due to violence
Likely overall extent and direction of bias
Moderate under-estimation Mild under-estimation
Conclusions
Our findings illuminate the human cost of protracted conflict in South Sudan. They should spur warring parties and international actors to seek lasting conflict resolution, and, failing this, to conduct military action in accordance with international law.
This study also provides a crude metric against which to benchmark the extent to which the humanitarian response to the South Sudanese crisis has been able to reach those in need with timely, quality interventions. The large number of excess deaths not directly attributable to violence, and thus potentially avertable through humanitarian services, suggests insufficient access to affected populations, inadequate resourcing of humanitarian actors and/or sub-optimal performance of humanitarian services. Our study does not provide insight on the relative importance of the above factors. It should, however, spur humanitarian actors to urgently review and address gaps in the response, including whether current funding levels are commensurate with need. Humanitarian action also requires safe and unobstructed movement of humanitarian staff and supplies across the country: warring factions should heed previous calls44,45 to remove security and bureaucratic obstacles to humanitarian operations.
Statistical analysis of existing survey and other previously collected data can efficiently produce estimates of crisis-attributable mortality, as an alternative or complement to ground data collection. A possible extension of this approach, provided data are made more systematically available, could be to generate ongoing forward-predictions of mortality over short time horizons, thereby supporting real-time decision-making by humanitarian and policy actors. As noted elsewhere25, limitations in data availability, and problems with the quality of important data inputs such as population and displacement denominators, limit the validity of this and similar crisis-wide analyses: an effort to strengthen data across humanitarian sectors will enable clearer and more timely situational awareness and analysis to support the response.

LSHTM – Crisis-attributable mortality in South Sudan Page 28 of 45
5 References
1. United Nations Office for the Coordination of Humanitarian Affairs. South Sudan. 2018. https://www.unocha.org/south-sudan (accessed 31 Aug 2018. 2. Salama P, Spiegel P, Talley L, Waldman R. Lessons learned from complex emergencies over past decade. Lancet 2004; 364(9447): 1801-13. 3. Checchi F, Roberts L. Documenting mortality in crises: what keeps us from doing better. PLoS Med 2008; 5(7): e146. 4. Food and Agriculture Organisation, Famine Early Warning Systems Network. Mortality among populations of southern and central Somalia affected by severe food insecurity and famine during 2010-2012. Rome and Washington, DC: FAO and FEWS NET, 2013. http://www.fsnau.org/downloads/Somalia_Mortality_Estimates_Final_Report_8May2013_upload.pdf, accessed 28 May 2018 5. Rao JNK, Molina I. Small area estimation. 2nd ed. Hoboken, NJ: John Wiley & Sons, Inc.; 2015. 6. R Development Core Team. R: A language and environment for statistical computing. 2008. http://www.r-project.org. 7. RStudio Team. RStudio: Integrated Development for R. 2015. http://www.rstudio.com/. 8. Jordan L. South Sudan – Annual County Population Estimates. 2018. https://data.humdata.org/dataset/south-sudan-annual-county-population-estimates-2008-2020 (accessed 15 June 2018). 9. International Organisation for Migration. Displacement Tracking Matrix. Geneva, Switzerland: IOM; 2018.https://displacement.iom.int/south-sudan 10. United Nations High Commissioner for Refugees. Operational Portal: Refugee Situations. 2018. https://data2.unhcr.org/en/situations/southsudan (accessed 5 June 2018. 11. United Nations High Commissioner for Refugees. Uganda Comprehensive Refugee Response Portal. 2018. https://ugandarefugees.org/en/country/uga (accessed 10 June 2018. 12. Standardised Monitoring and Assessment of Relief and Transitions (SMART). Measuring Mortality, Nutritional Status, and Food Security in Crisis Situations: SMART Methodology. SMART Manual Version 2, 2017. https://smartmethodology.org/survey-planning-tools/smart-methodology/, accessed 28 May 2018 13. Erhardt J. Emergency Nutrition Assessment (ENA) Software for SMART. 2015. https://smartmethodology.org/survey-planning-tools/smart-emergency-nutrition-assessment/. 14. Cairns KL, Woodruff BA, Myatt M, Bartlett L, Goldberg H, Roberts L. Cross-sectional survey methods to assess retrospectively mortality in humanitarian emergencies. Disasters 2009; 33(4): 503-21. 15. Prudhon C, de Radigues X, Dale N, Checchi F. An algorithm to assess methodological quality of nutrition and mortality cross-sectional surveys: development and application to surveys conducted in Darfur, Sudan. Popul Health Metr 2011; 9(1): 57. 16. Checchi F, Warsame A, Treacy-Wong V, Polonsky J, van Ommeren M, Prudhon C. Public health information in crisis-affected populations: a review of methods and their use for advocacy and action. Lancet 2017; 390(10109): 2297-313. 17. Koenker R. Quantile regression in R: a vignette2018. https://cran.r-project.org/web/packages/quantreg/vignettes/rq.pdf (accessed 23 July 2018). 18. Milborrow S. Notes on the earth package2018. http://www.milbo.org/doc/earth-notes.pdf (accessed 25 July 2018). 19. Therneau TM, Atkinson EJ. An Introduction to Recursive Partitioning Using the RPART Routines2018. https://cran.r-project.org/web/packages/rpart/vignettes/longintro.pdf (accessed 28 July 2018). 20. Government of Southern Sudan, Southern Sudan Centre for Census SaE. Southern Sudan Counts: Tables from the 5th Sudan Population and Housing Census, 2008. Juba: Government of South Sudan, 2010.http://www.ssnbss.org/sites/default/files/2016-08/southern_sudan_counts_tables_from_the_5th_sudan_population_and_housing_census_2008.pdf (accessed 27 May 2018). 21. Ministry of Health, National Bureau of Statistics, United Nations Children's Fund. South Sudan Household Survey 2010: Monitoring the Situation of Children and Women in South Sudan. Juba, South Sudan: Ministry of Health, 2013.http://www.ssnbss.org/sites/default/files/2016-08/Sudan_Household_Health_Survey_Report_2010.pdf (accessed 25 May 2018). 22. United States Census Bureau. International database. Washington, DC: US Census Bureau; 2018.https://www.census.gov/data-tools/demo/idb/informationGateway.php 23. Office of the Deputy Humanitarian Coordinator for South Sudan. Crisis impacts on households in Unity State, South Sudan, 2014-2015: Initial results of a survey. Juba, South Sudan, 2016.https://reliefweb.int/sites/reliefweb.int/files/resources/160202_Crisis%20impacts%20on%20households%20in%20Unity%20State_SS.pdf (accessed 20 August 2018).

LSHTM – Crisis-attributable mortality in South Sudan Page 29 of 45
24. Ardiet D. Weekly surveillance among new arrivals of South Sudanese refugees in Uganda. Paris, France: Epicentre; 2018 25. Maxwell D, Hailey P, Kim JJ, McCloskey E, Wrabel M. Constraints and Complexities of Information and Analysis in Humanitarian Emergencies: Evidence from South Sudan. Boston, MA: Feinstein International Center, Tufts University, 2018.http://fic.tufts.edu/assets/SouthSudan-Case-Study-Report.pdf (accessed 30 August 2018). 26. Centers for Disease C, Prevention. Notes from the field: mortality among refugees fleeing Somalia--Dadaab refugee camps, Kenya, July-August 2011. MMWR Morb Mortal Wkly Rep 2011; 60(33): 1133. 27. Depoortere E, Checchi F, Broillet F, et al. Violence and mortality in West Darfur, Sudan (2003-04): epidemiological evidence from four surveys. Lancet 2004; 364(9442): 1315-20. 28. Grandesso F, Sanderson F, Kruijt J, Koene T, Brown V. Mortality and malnutrition among populations living in South Darfur, Sudan: results of 3 surveys, September 2004. Jama 2005; 293(12): 1490-4. 29. Grein T, Checchi F, Escriba JM, et al. Mortality among displaced former UNITA members and their families in Angola: a retrospective cluster survey. BMJ 2003; 327(7416): 650. 30. Ahoua L, Tamrat A, Duroch F, Grais RF, Brown V. High mortality in an internally displaced population in Ituri, Democratic Republic of Congo, 2005: results of a rapid assessment under difficult conditions. Glob Public Health 2006; 1(3): 195-204. 31. Alberti KP, Grellety E, Lin YC, et al. Violence against civilians and access to health care in North Kivu, Democratic Republic of Congo: three cross-sectional surveys. Confl Health 2010; 4: 17. 32. Coldiron ME, Roederer T, Llosa AE, et al. Retrospective mortality among refugees from the Central African Republic arriving in Chad, 2014. Confl Health 2017; 11: 7. 33. Coghlan B, Brennan RJ, Ngoy P, et al. Mortality in the Democratic Republic of Congo: a nationwide survey. Lancet 2006; 367(9504): 44-51. 34. Degomme O, Guha-Sapir D. Patterns of mortality rates in Darfur conflict. Lancet 2010; 375(9711): 294-300. 35. Burnham G, Lafta R, Doocy S, Roberts L. Mortality after the 2003 invasion of Iraq: a cross-sectional cluster sample survey. Lancet 2006; 368(9545): 1421-8. 36. Alkhuzai AH, Ahmad IJ, Hweel MJ, et al. Violence-related mortality in Iraq from 2002 to 2006. N Engl J Med 2008; 358(5): 484-93. 37. Hagopian A, Flaxman AD, Takaro TK, et al. Mortality in Iraq associated with the 2003-2011 war and occupation: findings from a national cluster sample survey by the university collaborative Iraq Mortality Study. PLoS Med 2013; 10(10): e1001533. 38. Brown V, Checchi F, Depoortere E, et al. Wanted: studies on mortality estimation methods for humanitarian emergencies, suggestions for future research. Emerg Themes Epidemiol 2007; 4(1): 9. 39. Wagner Z, Heft-Neal S, Bhutta ZA, Black RE, Burke M, Bendavid E. Armed conflict and child mortality in Africa, 1995–2005: a geospatial analysis. Lancet 2018; S0140-6736(18): 31437-5. 40. Polonsky JA, Ronsse A, Ciglenecki I, Rull M, Porten K. High levels of mortality, malnutrition, and measles, among recently-displaced Somali refugees in Dagahaley camp, Dadaab refugee camp complex, Kenya, 2011. Confl Health 2013; 7(1): 1. 41. Guha-Sapir D, Panhuis WG. Conflict-related mortality: an analysis of 37 datasets. Disasters 2004; 28(4): 418-28. 42. Heudtlass P, Speybroeck N, Guha-Sapir D. Excess mortality in refugees, internally displaced persons and resident populations in complex humanitarian emergencies (1998-2012) - insights from operational data. Confl Health 2016; 10: 15. 43. Frost C, Thompson S. Correcting for regression dilution bias: comparison of methods for a single predictor variable. Journal of the Royal Statistical Society Series A 2000; 163: 173-90. 44. United Nations Office for the Coordination of Humanitarian Affairs. Bureaucratic access impediments to humanitarian operations in South Sudan. Juba: UN OCHA, 2017.http://docs.southsudanngoforum.org/sites/default/files/2017-11/SBureaucratic_Access_Impediments_Survey_Report.pdf (accessed 20 September 2018). 45. United Nations Office for the Coordination of Humanitarian Affairs. South Sudan: humanitarian coordinator deeply concerned by bureaucratic impediments and access constraints. Juba; 2016.https://reliefweb.int/sites/reliefweb.int/files/resources/SS_161130_Press_Release_HC_concerned_by_bureaucratic_impediments.pdf (accessed 20 September 2018).

LSHTM – Crisis-attributable mortality in South Sudan Page 30 of 45
6 Annex
Notes on geographical names and units
Over the last 3y, the government of South Sudan has re-organised the country’s administrative levels into 32 new states and 180 new counties. Different parties to the conflict may or may not recognise these new administrative divisions. In practice, the humanitarian response is still structured along the previous system of 10 states, which we refer to here as state hubs. All datasets we collected were organised according to the old 10-state, 79-county system, which we have accordingly adhered to for the purpose of this analysis. Furthermore, any data from Akoka County have been aggregated with those from Baliet County, which it previously was part of, as different datasets included or did not include the former. The status of Abyei Special Administrative Area is disputed between South Sudan and Sudan, but this territory is usually included in humanitarian response planning for South Sudan, and as such we also included it in this analysis. Administrative names and geographical boundaries referred to in this report do not necessarily represent the views of the study authors, donors or any of the agencies reporting data.
Quality scoring of eligible mortality surveys
So as to differentially weight surveys according to their quality, we scored each available report from 0% to 100% based on a set of 25 yes-no questions under 10 domains of survey design, implementation and analysis (Table 10), selected from a published paper1. We scored each question as 0 if the corresponding criterion was not meant or the answer was unclear from the survey report, 1 if the criterion was met or could be reasonably inferred, and “N/A” if the question did not apply to the report in question. So as to not give undue weight to any of the 10 domains, we averaged the total binary scores for each non-“N/A” question under each domain, summed the area averages and converted the total to a percentage. If no report was available (one survey), we arbitrarily assumed a quality score of 25%.
Table 10. Survey quality scoring criteria.
Domain Question
Survey design (sampling biases)
Sampling frame Is the sampling universe defined?
Is the population size current and cross-checked?
Sampling design
Is there a clear description of the sampling methodology?
Is sampling fully non-purposive (at every stage)?
IF systematic random sampling was done: is there a clear description of a non-arbitrary sampling step?
IF cluster sampling was done: is there a clear description of cluster sampling?
Cluster sampling – household selection
Is there a clear description of the household selection?
IF segmentation was performed: was it done non-purposively and weighted?
IF only the first household was selected randomly: Was the method by which the first household was sampled clear and non-purposive?
IF all households were selected randomly: Was the method by which the first household was sampled clear, non-purposive, and non-arbitrary?
IF all households were selected randomly: Was the source of lists current and cross-checked?
Survey non-response
Is there a description of a valid revisit strategy?
Was the number of non-responding households reported?
Was the percentage of non-respondents < 15%?
Precision of cluster sampling
Is there a sufficiently large (>25) number of clusters per explicit stratum or entire sampling frame?
1 Prudhon C, de Radigues X, Dale N, Checchi F. An algorithm to assess methodological quality of nutrition and mortality cross-sectional surveys: development and application to surveys conducted in Darfur, Sudan. Popul Health Metr 2011; 9(1):
57.

LSHTM – Crisis-attributable mortality in South Sudan Page 31 of 45
Domain Question
Survey implementation (measurement biases)
Questionnaire
Was there was a pre-piloted structured questionnaire in the local language?
Is the recall period clearly marked?
Was a calendar used as an aide-memoire?
Was the questionnaire for individuals only?
Training and supervision Were interviewers both trained and supervised?
Were surveys checked at the end of each day?
Recall bias Was a recall period provided in the report?
Was the recall period longer than 2 years?
Analysis
Stratification
IF explicit stratification was done: Was the analysis weighted for unequal sampling probabilities?
IF implicit stratification was done: Was the analysis stratified?
Estimation
Was a sample size given?
Were confidence intervals reported?
Were standard errors / confidence intervals adjusted for design effect (clustering)?
Figure 13 shows the distribution of survey quality scores. The median score was 77% with an inter-quartile range of 63% to 82%.
Figure 13. Distribution of survey quality scores
Re-analysis of mortality survey datasets
In addition to quality scoring, we extracted from each report the survey’s recall period, point estimates and 95%CI of CDR and U5DR, the proportion of deaths due to injury and/or violence, any stated difference between the theoretical sampling universe (e.g. a county) and the communities actually included in the sampling frame, and the reason for this difference (e.g. insecure, inaccessible areas).
Available datasets arose from two types of standardised survey questionnaires (Table 11). Generally, households were defined as groups of people living under the same roof and sharing food from the same

LSHTM – Crisis-attributable mortality in South Sudan Page 32 of 45
pot (accordingly, multiple wives living and eating in different houses were considered separate households).
Table 11. Comparison of aggregate and individual mortality questionnaires.
Characteristic “Aggregate” questionnaire “Individual” questionnaire
Questionnaire process
i. Ask for the number of people who slept in the household during the previous night.
ii. Ask for the number of people who joined the household during the recall period.
iii. Ask for the number of people who left the household during the recall period.
iv. Ask for the number of births during the recall period.
v. Ask for the number of deaths during the recall period.
i. List people who slept in the household during the previous night: establish whether they joined or were born during the recall period.
ii. List people who left during the recall period. iii. List people who have died during the recall
period: establish whether they were born during the period (infant deaths) and ask about cause and location of death.
Age information Under 5y, older Individual ages in years
Gender information No Yes
Cause of death information
No Yes. Categories varied by survey, but all surveys included an ‘injury/trauma’ category, and some distinguished ‘violence/killing’ from other injuries.
Calculation of person-time denominator (all rates except U5DR)
(𝑛all + 0.5𝑑all + 0.5𝑙all − 0.5𝑏all − 0.5𝑗all) ∙ 𝑅, where n = people in household now; d = dead; l = left; b = born; j = joined; all = all ages; R = recall period in days. This expression assumes people joined and left households, were born and died at the mid-point of the recall period.
Calculation of person-time denominator (U5DR)
(𝑛u5 + 0.5𝑑u5 + 0.5𝑙u5 − 0.5𝑏u5 − 0.5𝑗u5 + 0.5𝑎u5) ∙ 𝑅, where n = people in household now; l = left; j = joined; a; aged out of under 5y cohort; u5 = under 5y; R = recall period in days. Assuming constant birth rate, 𝑎u5 = 𝑏u5 − 𝑑u5 . Therefore, the person-time expression simplifies to
(𝑛u5 + 0.5𝑙u5 − 0.5𝑗u5) ∙ 𝑅 . This expression assumes children joined and left households, were born and died at the mid-point of the recall period.
Datasets were cleaned based on obvious errors (e.g. values out of the allowed range) and combined with the stated recall period to compute CDR, U5DR, crude birth rate, in-, out- and net migration rate, and, for individual datasets only, injury-specific death rate and stratification of death rates by gender. We used the survey package in R to calculate point estimates and 95%CIs for each indicator, assuming a Poisson distribution of deaths and adjusting standard errors for cluster sampling design, unless sampling at every stage was simple or systematic. The two exhaustive surveys were treated as simple random samples.
For 164/181 (90.6%) surveys the re-estimated CDR was within 0.10 deaths per 10,000 person-days of the reported CDR. For six (3.3%) surveys it was 0.1 to 0.5 deaths per 10,000 person-days higher, and for a further 3 (1.7%) between 0.5 and 1.5 higher. Five (2.8%) surveys had a re-estimated CDR 0.1 to 0.5 deaths per 10,000 person-days below the reported value, and 2 (1.1%) between 0.5 and 1.5 lower. The median difference between the re-estimated and reported CDR was 0.0006 deaths per 10,000 person-days.
Treatment of mortality surveys without available datasets
We assumed point estimates provided in the report were accurate for these surveys. If no dataset was available for a given survey s, we estimated the standard error (SE) of its log death rates from the reported
point estimate �̂�𝑠 and its 95%CI: since 𝑦𝑠,0.975 = 𝑒(ln �̂�𝑠+1.96𝑆𝐸 (ln �̂�𝑠)) (and 𝑦𝑠,0.025 = 𝑒(ln �̂�𝑠−1.96𝑆𝐸 (ln �̂�𝑠))), by
rearrangement 𝑆𝐸 (ln �̂�)𝑠 =ln 𝑦𝑠,0.975− ln �̂�𝑠
1.96 . For the single survey that did not report a 95%CI, we calculated
95%CI assuming a Poisson distribution and simple random sampling, namely 𝑆𝐸 (ln �̂�)𝑠 =1
√𝑑𝑠. We
checked whether reported 95%CIs were plausible by computing the asymmetry between the upper and

LSHTM – Crisis-attributable mortality in South Sudan Page 33 of 45
lower CI: for one survey with asymmetric U5DR CI, we re-computed a 95%CI based on the reported
number of deaths under 5y and an assumed design effect K of 2.0 (𝑆𝐸 (ln �̂�)𝑠 =1
√𝑑𝑠K ).
Whenever the proportion of deaths due to injury and/or violence were provided in the report, we multiplied them by the reported CDR to compute the point estimate of the injury and/or violence death rates.
Patterns in survey estimates
Figure 14 and Figure 15 show, respectively, CDR and U5DR point estimates over time, by region of South Sudan. Figure 16 shows the corresponding pattern for the net household migration rate.
Figure 14. Crude death rate point estimates from eligible surveys, by mid-point of the recall period and region.

LSHTM – Crisis-attributable mortality in South Sudan Page 34 of 45
Figure 15. Under 5 years death rate point estimates from eligible surveys, by mid-point of the recall period and region.
Figure 16. Net migration rate point estimates from available surveys, by recall period mid-point and region.

LSHTM – Crisis-attributable mortality in South Sudan Page 35 of 45
Conceptual framework of candidate mortality predictors
The conceptual framework of candidate mortality predictors is presented below (Figure 17). Boxes and causal arrows in grey are those for which we could not locate any consistently available data.
Figure 17. Causal framework of predictors of excess mortality.
Physical health Reproductive and neonatal health
Burden of NCDs
Burden of endemic infectious diseases
Epidemic occurrence and severity
Trauma injuries (intentional and unintentional)
Exposure to armed attacks/ insecurity
Forced displacement
Interruption of chronic treatment
(HIV, TB, NCDs)
Addiction
Excess
Baseline
Averted
Death rate
Sexual and gender-based violence
Food insecurity and
livelihoods
Feeding and care practices
Nutritional status
Humanitarian (public health) services
Service functionality
Service coverage
Service quality
Mental health and psychosocial functioning
Climate

LSHTM – Crisis-attributable mortality in South Sudan Page 36 of 45
Further details on predictor data
Further details on sources of candidate predictor data and decisions we took while managing the data are presented in Table 12.
Table 12. Details on sources and management of candidate mortality predictor data.
Variable Source Source and data management notes
Rainfall United Nations World Food Programme Food Security Analysis data site: http://dataviz.vam.wfp.org/seasonal_explorer/rainfall_vegetation/visualizations
We computed the 3mo running average of the absolute difference between rainfall levels in mm and the historical average over the past 10y.
Season (climate) Famine Early Warning Systems Network (FEWS NET): http://fews.net/sites/default/files/documents/reports/South%20Sudan%20LHZ%20%20Report_Final.pdf (August 2013)
For each livelihood zone (below), we classified each month as being mainly in the typical rainy or mainly in the typical dry seasons.
Incidence of armed conflict events
Armed Conflict Location & Event Data Project (ACLED): https://www.acleddata.com/
The ACLED project collects information on armed conflict events based on extensive review of multi-language media sources and other public information. Each row on the ACLED dataset is an individual event. We tallied all events irrespective of ACLED-defined typology, as we did not want to make assumptions about which events would be more or less associated with mortality. Each event row also contains a reported number of fatalities due to the event.
Incidence of attacks against aid workers
Aid Worker Security Database (AWSD): https://aidworkersecurity.org/incidents
The Aid Worker Security Database project collects data on various types of attacks to aid workers, capturing information from media sources and receiving direct reports from aid organisations and operational security entities. We tallied all attacks irrespective of typology.
Region n/a (constructed variable) While not relevant administratively, we hypothesised that our regional groupings (northwest: Lakes, Northern Bahr el Ghazal, Warrap, Western Bahr el Ghazal; northeast: Jonglei, Unity, Upper Nile; southern: Central Equatoria, Eastern Equatoria, Western Equatoria) would capture broad differences in exposure to armed conflict and disease burden. We included Abyei Special Administrative Area within the northeast region due to proximity.
Main local livelihood type
Famine Early Warning Systems Network (FEWS NET): http://fews.net/sites/default/files/documents/reports/South%20Sudan%20LHZ%20%20Report_Final.pdf (August 2013)
While the source distinguishes 11 livelihood zones within South Sudan, we grouped these into agriculturalist, agropastoral and pastoralist. Most livelihood zones overlap with county borders; we defined the main livelihood type for each county as that which applied to the majority of the county’s population, as reported by the source. If a given survey’s sampling universe was a PoC camp, we defined the livelihood as displaced.
Proportion of the population that is internally displaced
n/a (constructed variable) Both numerator and denominator were taken from our estimated population dataset. If a survey’s sampling universe was a PoC camp, we set this variable to 1 (100%).
Season (food) Famine Early Warning Systems Network (FEWS NET): http://fews.net/sites/default/files/documents/reports/South%20Sudan%20LHZ%20%20Report_Final.pdf (August 2013)
For each livelihood zone (above), the source provides typical expected seasonal food security calendars. We classified each month as being mainly in the typical lean season, or not.
Cereal harvest CLiMIS portal developed by the South Sudan National Bureau of Statistics, and Ministry of Agriculture and Food Security in partnership with the United Nations Food and Agriculture Organisation, the United Nations World Food Programme, FEWS
As cereal harvests were only reported on an annual basis, we assumed an equal monthly amount per capita over any given year. For Abyei in 2011, as data were missing we arbitrarily assumed an annual harvest of 500 mt, assuming it would have been much lower than 2012 due to more intense conflict and displacement during 2011.

LSHTM – Crisis-attributable mortality in South Sudan Page 37 of 45
Variable Source Source and data management notes
NET, Concern Worldwide and ACTED: http://climis-southsudan.org/
Terms of trade purchasing power index
CLiMIS portal: http://climis-southsudan.org/
Abyei data were missing and were imputed by assuming they were the same as for Warrap state, which it borders. Upper Nile data were missing for 6mo of 2016, 11mo of 2017 and 2mo of 2018: we imputed the Upper Nile series for 2016-2018 by averaging any non-missing values from Upper Nile with weight = 5, values from neighbouring states (Unity, Jonglei) with weight = 1, and values from other states with weight = 0.5. There were 4 other instances of missing values of up to 3mo consecutive duration: we linearly interpolated these based on values prior and following the missing months. After imputation of missing values, we smoothed each state series using a spline function (R package spline with spar parameter= 0.5). The original and smoothed time series are shown in Figure 18. Lastly, we computed 3mo rolling averages using the smoothed values. We assumed that the state values applied equally to each county within the state.
Food distributions United Nations World Food Programme
We did not have complete data on the type of food distribution (e.g. general food distribution; blanket distribution; food for schools; etc.), so we merely considered the total mt of food distributed during any county-month. We assumed that absence of a county-month from the dataset meant that no food had been distributed.
Uptake of measles routine vaccination
World Health Organization We decided not to calculate a standard indicator of administrative vaccination coverage, as this would have implied further assumptions (e.g. proportion of the population under 1y old). The simple uptake indicator of doses administered per person-time is not a meaningful coverage measure, but still represents adequately relative differences in the functionality (and/or accessibility) of health services. Some counties did not transmit a vaccination report during certain months: we assumed that this meant no routine vaccination had been ongoing, i.e. 0 doses delivered. This assumption is likely to be incorrect in some cases, but we believe that counties from which no report was received would have at least had relatively low coverage.
Acute flaccid paralysis incidence
World Health Organization We tallied all reported acute flaccid paralysis cases (note were confirmed as polio infections), as this variable was intended to be a proxy for health service functionality (in a county with access and relatively functional health services, we expected that AFP surveillance would have detected relatively more cases).
Humanitarian actor presence (all sectors; health, nutrition and WASH; health only)
United Nations Office for Coordination of Humanitarian Affairs
We did not have consistently available information on the activities (e.g. sub-sector of health), target population, programming size, budget or output of humanitarian actors, and as such opted for the number of agencies per capita as a rough proxy of the intensity of humanitarian response.
Cholera incidence World Health Organization We assumed all cases reported on the database were true cholera cases (in reality, these include both suspect and confirmed cases).
Measles incidence World Health Organization We included all cases in the county-month aggregate totals, except those marked as discarded, which we took to indicate that they did not meet laboratory and/or epidemiological criteria for measles.

LSHTM – Crisis-attributable mortality in South Sudan Page 38 of 45
Figure 18. Terms of trade (Kg of white flour that can be purchased by a medium-sized goat), by state and month. The red line shows raw data. The blue line shows smoothed values.

LSHTM – Crisis-attributable mortality in South Sudan Page 39 of 45
Predictive models
For all models, we attributed to each survey-month (s, t) observation a composite weight equal to 𝑊𝑠,𝑡 =
𝑊𝑄,𝑠𝑊𝐵,𝑠𝑊𝐴,𝑠,𝑡, where
𝑊𝑄,𝑠, a quality weight, is the survey’s quality score (range [0,1]);
𝑊𝐵,𝑠, a representativeness bias weight (range [0,1]), is the approximate fraction of the sampling
universe that was actually included in the sample, as per the survey’s report (for example, if a report stated that the sampling frame excluded 3 out of 6 payams, we took this fraction as 0.5); this weight penalises surveys that did not sample some of the county due to insecurity or inaccessibility, so as to account for possible selection bias (accessible populations are likely to experience lower mortality); in five cases where an unspecified number of villages were reported as left out of the sampling frame, we assumed that 𝑊𝐵,𝑠= 0.5;
𝑊𝐴,𝑠,𝑡, an analytic weight inversely proportional to the survey-month’s contribution to the total recall
period R, equal to 𝑟𝑠,𝑡
𝑅𝑠 , i.e. the fraction of the survey’s total recall period 𝑅𝑠 that takes place in the
survey-month, related to the SE as follows:
o 𝑆𝐸 (ln �̂�)𝑠,𝑡 = 𝑆𝐸 (ln �̂�)𝑠√�̂�𝑁𝑅
√�̂�𝑁𝑟𝑡= 𝑆𝐸 (ln �̂�)𝑠
1
√𝑟𝑡𝑅
, where N is the total number of people
sampled.
We included this composite weight in all model fitting. We also tried an alternative analytic weight that, in addition to the above, penalised surveys according to their relative level of estimate imprecision, but this yielded worse fits.
Diagnostic plots for the OLS model to predict CDR are shown in Figure 19. Figure 20 shows a plot of predictions versus data for the quantile-quantile regression model of CDR, while Figure 21 shows the equivalent plot for the models of injury-specific and violence-specific death rates.

LSHTM – Crisis-attributable mortality in South Sudan Page 40 of 45
Figure 19. Diagnostic plots for ordinary least-squares model to predict crude death rate.
Figure 20. Predictions versus data for quantile-quantile regression model of crude death rate.

LSHTM – Crisis-attributable mortality in South Sudan Page 41 of 45
Figure 21. Predictions versus data for quantile-quantile regression models of injury-specific (left) and violence-specific (right) death
rate.

LSHTM – Crisis-attributable mortality in South Sudan Page 42 of 45
Additional tables and figures
Table 13. Estimated excess death toll, by county.
County Total deaths (95%CI) Baseline deaths (95%CI) Excess deaths (95%CI)
Abiemnhom 2,400 (2,400 to 2,500) 2,000 (1,900 to 2,000) 500 (400 to 600)
Abyei 6,900 (6,700 to 7,200) 12,800 (12,400 to 13,300) -5,900 (-6,500 to -5,400)
Akobo 19,700 (19,000 to 20,400) 4,900 (4,800 to 5,000) 14,800 (14,100 to 15,500)
Aweil Centre 4,800 (4,600 to 5,000) 7,700 (7,500 to 8,000) -2,900 (-3,200 to -2,600)
Aweil East 32,600 (31,600 to 33,500) 3,600 (3,500 to 3,700) 28,900 (28,000 to 29,900)
Aweil North 11,600 (11,300 to 11,900) 25,900 (25,200 to 26,500) -14,300 (-15,000 to -13,600)
Aweil South 7,000 (6,800 to 7,200) 9,600 (9,300 to 9,800) -2,600 (-2,900 to -2,300)
Aweil West 16,800 (16,200 to 17,300) 6,500 (6,300 to 6,700) 10,300 (9,700 to 10,800)
Awerial 17,200 (16,600 to 17,900) 12,500 (12,200 to 12,800) 4,700 (4,000 to 5,400)
Ayod 21,700 (20,900 to 22,400) 6,100 (5,900 to 6,300) 15,600 (14,800 to 16,300)
Baliet 7,400 (7,200 to 7,600) 12,700 (12,300 to 13,000) -5,300 (-5,700 to -4,800)
Bor South 22,900 (22,100 to 23,700) 6,400 (6,100 to 6,600) 16,500 (15,700 to 17,300)
Budi 17,700 (17,000 to 18,300) 19,900 (19,200 to 20,600) -2,300 (-3,200 to -1,300)
Canal/Pigi 16,500 (16,000 to 17,100) 12,000 (11,600 to 12,400) 4,600 (3,900 to 5,200)
Cueibet 13,000 (12,600 to 13,400) 8,800 (8,600 to 9,100) 4,100 (3,700 to 4,600)
Duk 10,000 (9,700 to 10,400) 14,800 (14,400 to 15,300) -4,800 (-5,300 to -4,200)
Ezo 10,400 (10,000 to 10,700) 6,800 (6,500 to 7,000) 3,600 (3,200 to 4,000)
Fangak 15,500 (15,000 to 16,100) 8,400 (8,100 to 8,700) 7,100 (6,500 to 7,800)
Fashoda 8,600 (8,300 to 8,900) 8,700 (8,500 to 9,000) -200 (-500 to 300)
Gogrial East 8,900 (8,600 to 9,100) 2,600 (2,500 to 2,600) 6,300 (6,100 to 6,600)
Gogrial West 23,000 (22,300 to 23,700) 9,000 (8,700 to 9,300) 14,000 (13,300 to 14,700)
Guit 5,400 (5,300 to 5,600) 26,700 (25,900 to 27,500) -21,300 (-22,000 to -20,500)
Ibba 5,000 (4,800 to 5,100) 3,700 (3,500 to 3,800) 1,300 (1,100 to 1,500)
Ikotos 15,200 (14,700 to 15,700) 3,700 (3,600 to 3,900) 11,400 (10,900 to 12,000)
Juba 66,700 (63,800 to 69,600) 13,900 (13,300 to 14,600) 52,800 (49,600 to 55,800)
Jur River 12,700 (12,400 to 13,100) 24,600 (24,000 to 25,100) -11,800 (-12,500 to -11,100)
Kajo-Keji 18,000 (17,300 to 18,700) 11,900 (11,500 to 12,400) 6,100 (5,400 to 7,000)
Kapoeta East 27,800 (26,900 to 28,800) 13,800 (13,200 to 14,400) 14,000 (12,900 to 15,100)
Kapoeta North 19,100 (18,400 to 19,700) 23,100 (22,300 to 24,000) -4,000 (-5,200 to -3,100)
Kapoeta South 14,400 (13,900 to 14,900) 13,900 (13,400 to 14,500) 400 (-300 to 1,200)
Koch 13,800 (13,400 to 14,200) 10,500 (10,200 to 10,800) 3,300 (2,900 to 3,800)
Lafon 19,000 (18,400 to 19,600) 9,300 (9,000 to 9,600) 9,700 (9,000 to 10,500)
Lainya 8,000 (7,700 to 8,300) 9,800 (9,500 to 10,100) -1,800 (-2,300 to -1,400)
Leer 21,600 (20,900 to 22,200) 7,100 (6,900 to 7,300) 14,500 (13,800 to 15,100)
Longochuk 6,300 (6,200 to 6,500) 6,600 (6,400 to 6,800) -200 (-500 to 0)
Luakpiny/Nasir 31,300 (30,400 to 32,300) 4,600 (4,500 to 4,800) 26,700 (25,700 to 27,700)
Maban 8,400 (8,100 to 8,700) 22,500 (21,800 to 23,200) -14,100 (-14,900 to -13,300)
Magwi 21,700 (20,900 to 22,600) 4,800 (4,600 to 5,000) 17,000 (16,100 to 17,900)
Maiwut 9,700 (9,400 to 10,000) 13,500 (13,100 to 13,900) -3,700 (-4,300 to -3,200)
Malakal 17,600 (16,900 to 18,200) 6,400 (6,200 to 6,600) 11,200 (10,500 to 11,900)
Manyo 4,400 (4,300 to 4,600) 8,800 (8,500 to 9,100) -4,300 (-4,700 to -4,000)

LSHTM – Crisis-attributable mortality in South Sudan Page 43 of 45
County Total deaths (95%CI) Baseline deaths (95%CI) Excess deaths (95%CI)
Maridi 11,500 (11,100 to 11,900) 2,700 (2,600 to 2,800) 8,800 (8,400 to 9,200)
Mayendit 14,200 (13,800 to 14,700) 9,600 (9,300 to 9,900) 4,600 (4,100 to 5,200)
Mayom 28,100 (27,300 to 29,000) 7,500 (7,200 to 7,700) 20,700 (19,800 to 21,600)
Melut 10,100 (9,800 to 10,500) 15,000 (14,600 to 15,500) -4,900 (-5,500 to -4,400)
Morobo 10,100 (9,800 to 10,400) 4,800 (4,700 to 5,000) 5,300 (5,000 to 5,600)
Mundri East 8,200 (7,800 to 8,600) 5,500 (5,200 to 5,800) 2,700 (2,200 to 3,200)
Mundri West 7,000 (6,700 to 7,200) 3,700 (3,600 to 3,900) 3,300 (3,000 to 3,600)
Mvolo 6,100 (5,900 to 6,400) 2,800 (2,700 to 3,000) 3,300 (3,000 to 3,600)
Nagero 1,300 (1,300 to 1,400) 3,500 (3,300 to 3,600) -2,100 (-2,300 to -2,000)
Nyirol 21,400 (20,800 to 22,200) 1,000 (1,000 to 1,100) 20,400 (19,700 to 21,200)
Nzara 8,300 (8,100 to 8,600) 10,200 (9,800 to 10,600) -1,800 (-2,300 to -1,400)
Panyijiar 19,300 (18,700 to 19,800) 7,600 (7,400 to 7,800) 11,600 (11,100 to 12,300)
Panyikang 5,100 (5,000 to 5,300) 6,700 (6,500 to 6,900) -1,600 (-1,800 to -1,300)
Pariang 13,600 (13,200 to 14,000) 4,800 (4,700 to 4,900) 8,800 (8,400 to 9,300)
Pibor 16,500 (15,700 to 17,200) 13,300 (12,600 to 13,900) 3,200 (2,200 to 4,200)
Pochalla 8,100 (7,800 to 8,400) 18,000 (17,300 to 18,700) -9,900 (-10,600 to -9,200)
Raga 8,400 (8,100 to 8,800) 4,400 (4,300 to 4,600) 4,000 (3,700 to 4,400)
Renk 21,600 (20,900 to 22,300) 5,800 (5,600 to 6,000) 15,700 (15,100 to 16,500)
Rubkona 45,200 (43,700 to 46,800) 17,700 (17,000 to 18,300) 27,500 (26,000 to 29,200)
Rumbek Centre 19,800 (19,200 to 20,500) 8,300 (8,000 to 8,600) 11,500 (10,800 to 12,300)
Rumbek East 13,300 (12,900 to 13,700) 14,400 (14,000 to 14,900) -1,100 (-1,700 to -500)
Rumbek North 5,200 (5,000 to 5,400) 10,600 (10,400 to 10,900) -5,400 (-5,700 to -5,100)
Tambura 7,000 (6,800 to 7,300) 4,500 (4,300 to 4,600) 2,600 (2,300 to 2,900)
Terekeka 13,900 (13,400 to 14,500) 3,500 (3,400 to 3,700) 10,400 (9,900 to 11,000)
Tonj East 10,700 (10,300 to 11,000) 10,400 (10,100 to 10,700) 300 (-200 to 700)
Tonj North 14,500 (14,000 to 14,900) 9,700 (9,400 to 10,000) 4,700 (4,200 to 5,300)
Tonj South 9,500 (9,100 to 9,800) 16,600 (16,100 to 17,200) -7,100 (-7,800 to -6,500)
Torit 16,700 (16,100 to 17,400) 10,200 (9,900 to 10,700) 6,500 (5,700 to 7,300)
Twic 20,200 (19,600 to 20,800) 6,600 (6,400 to 6,800) 13,600 (13,000 to 14,300)
Twic East 12,100 (11,800 to 12,500) 28,000 (27,200 to 28,700) -15,900 (-16,700 to -15,000)
Ulang 11,600 (11,300 to 12,000) 11,100 (10,800 to 11,400) 500 (100 to 1,000)
Uror 22,700 (22,000 to 23,300) 8,600 (8,400 to 8,900) 14,100 (13,400 to 14,800)
Wau 23,700 (22,700 to 24,600) 15,600 (15,000 to 16,200) 8,100 (6,900 to 9,300)
Wulu 4,000 (3,900 to 4,200) 12,400 (12,100 to 12,700) -8,400 (-8,700 to -8,000)
Yambio 21,300 (20,500 to 22,100) 4,100 (3,900 to 4,200) 17,200 (16,400 to 18,100)
Yei 26,100 (25,200 to 27,000) 14,200 (13,800 to 14,800) 11,900 (10,800 to 12,900)
Yirol East 7,500 (7,300 to 7,700) 13,600 (13,300 to 13,900) -6,100 (-6,500 to -5,700)
Yirol West 12,600 (12,200 to 13,000) 6,700 (6,600 to 7,000) 5,800 (5,400 to 6,300)
Total 1,177,600
(1,171,800 to 1,183,300) 794,600
(791,300 to 798,000) 382,900
(376,000 to 389,800)

LSHTM – Crisis-attributable mortality in South Sudan Page 44 of 45
Table 14. Estimated excess death toll (all ages, all causes), by state hub and overall, using predictions from quantile-quantile regression.
State hub Total deaths (95%CI) Baseline deaths (95%CI) Excess deaths (95%CI)
Central Equatoria 161,800
(151,500 to 172,700) 73,800
(69,000 to 79,200) 87,900
(76,300 to 99,900)
Eastern Equatoria 181,200
(170,900 to 191,300) 120,400
(113,200 to 127,400) 60,800
(48,400 to 73,600)
Jonglei 220,700
(209,600 to 232,100) 145,600
(137,200 to 154,200) 74,900
(60,500 to 88,900)
Lakes 105,000
(98,600 to 111,700) 99,000
(93,700 to 105,400) 6,000
(-3,300 to 14,700)
Northern Bahr el Ghazal 84,400
(77,400 to 92,800) 62,200
(56,000 to 69,200) 22,200
(12,500 to 31,600)
Abyei Special Admin. Area 7,400
(6,400 to 8,500) 13,900
(11,900 to 16,100) -6,500
(-8,800 to -4,300)
Unity 181,700
(171,300 to 192,300) 109,000
(101,400 to 116,200) 72,700
(60,000 to 85,700)
Upper Nile 169,900
(159,300 to 181,300) 144,300
(137,200 to 151,800) 25,900
(11,700 to 38,700)
Warrap 101,800
(93,900 to 110,400) 67,100
(60,400 to 74,500) 34,500
(23,000 to 46,300)
Western Bahr el Ghazal 51,500
(46,400 to 57,300) 55,500
(48,500 to 62,400) -4,000
(-12,400 to 4,600)
Western Equatoria 100,200
(94,700 to 106,000) 57,200
(54,300 to 60,100) 42,900
(36,700 to 49,800)
Total 1,365,600
(1,337,700 to 1,395,600) 948,500
(926,700 to 969,400) 417,400
(381,300 to 455,800)
Table 15. Estimated excess death toll (all ages, all causes), by state hub and overall, using the 2008 census crude death rate as baseline.
State hub Total deaths (95%CI) Baseline deaths (95%CI) Excess deaths (95%CI)
Central Equatoria 142,800
(139,700 to 146,300) 66,600
76,300 (73,100 to 79,700)
Eastern Equatoria 151,500
(149,600 to 153,300) 102,700
48,700 (46,800 to 50,600)
Jonglei 187,000
(184,800 to 189,000) 107,200
79,800 (77,600 to 81,900)
Lakes 92,700
(91,400 to 93,900) 120,700
-28,000 (-29,300 to -26,800)
Northern Bahr el Ghazal 72,700
(71,500 to 73,900) 75,400
-2,600 (-3,900 to -1,500)
Abyei Special Admin. Area 6,900
(6,700 to 7,100) 13,000
-6,100 (-6,400 to -5,900)
Unity 163,800
(161,700 to 165,800) 90,900
72,900 (70,800 to 74,900)
Upper Nile 142,300
(140,700 to 143,700) 126,700
15,600 (14,000 to 17,100)
Warrap 86,700
(85,600 to 87,800) 75,100
11,700 (10,600 to 12,700)
Western Bahr el Ghazal 44,900
(43,800 to 45,900) 59,900
-15,000 (-16,100 to -13,900)
Western Equatoria 86,100
(85,000 to 87,200) 60,000
26,100 (25,000 to 27,300)
Total 1,177,400
(1,171,700 to 1,183,300) 898,100
279,300 (273,700 to 285,200)

LSHTM – Crisis-attributable mortality in South Sudan Page 45 of 45
Figure 22. Map of South Sudan counties, showing the average estimated excess death rate over the period of analysis.