Establishment of an International Scale for Instrumented...
41
NIST Technical Note 1875 Establishment of an International Scale for Instrumented Charpy Testing: comparison between NIST and LNE Enrico Lucon Stéphane Lefrançois Chris N. McCowan Ray L. Santoyo This publication is available free of charge from: http://dx.doi.org/10.6028/NIST.TN.1875
Transcript of Establishment of an International Scale for Instrumented...
NIST Technical Note 1875
Establishment of an International
Scale for Instrumented Charpy
Testing: comparison between
NIST and LNE
Enrico Lucon
Stéphane Lefrançois
Chris N. McCowan
Ray L. Santoyo
This publication is available free of charge from: http://dx.doi.org/10.6028/NIST.TN.1875
NIST Technical Note 1875
Establishment of an International
Scale for Instrumented Charpy
Testing: comparison between
NIST and LNE
Enrico Lucon
Chris N. McCowan
Ray L. Santoyo
Applied Chemicals and Materials Division
Material Measurement Laboratory
Stéphane Lefrançois
LNE, Laboratoire National de métrologie et d'Essais
Paris, France
This publication is available free of charge from:
http://dx.doi.org/10.6028/NIST.TN.1875
April 2015
U.S. Department of Commerce Penny Pritzker, Secretary
National Institute of Standards and Technology
Willie May, Acting Under Secretary of Commerce for Standards and Technology and Acting Director
Certain commercial entities, equipment, or materials may be identified in this
document in order to describe an experimental procedure or concept adequately.
Such identification is not intended to imply recommendation or endorsement by the
National Institute of Standards and Technology, nor is it intended to imply that the
entities, materials, or equipment are necessarily the best available for the purpose.
National Institute of Standards and Technology Technical Note 1875
Natl. Inst. Stand. Technol. Tech. Note 1875, 40 pages (April 2015)
CODEN: NTNOEF
This publication is available free of charge from:
http://dx.doi.org/10.6028/NIST.TN.1875
iii
Abstract
As a contribution to the establishment of an international scale for instrumented Charpy testing,
aimed at ensuring that impact forces are obtained more accurately, NIST and Laboratoire National
de métrologie et d’Essais (LNE, France) have participated in an interlaboratory comparison of
instrumented impact tests on reference specimens of different energy levels from seven certified
verification batches. In both locations, tests have been performed using nominally identical Charpy
machines and the same instrumentation (Charpy striker and acquisition system). The comparison
between NIST and LNE test results has revealed statistically significant differences, particularly
in terms of absorbed energies and instrumented forces. The reasons for such discrepancies are
unclear, although a malfunction of the acquisition system during the tests at LNE and possible
differences in the surface finish of the machine anvils and supports in the two labs are possible
contributing factors.
Keywords
Absorbed energy; instrumented Charpy testing; instrumented forces; interlaboratory comparison;
lateral expansion; LNE; NIST; reference Charpy specimens; surface finish.
iv
Table of Contents
Abstract .......................................................................................................................................... iii
Keywords ....................................................................................................................................... iii
Table of Contents ........................................................................................................................... iv
1. Introduction ............................................................................................................................. 1
2. Description of the technical program ...................................................................................... 2
2.1 Materials and specimens .................................................................................................. 2
2.2 Test machines ................................................................................................................... 2
2.3 Instrumented striker and acquisition system .................................................................... 3
3. Test results ............................................................................................................................... 5
3.1 NIST force verification specimens (LL-103 and HH-103) .............................................. 5
3.1.1 Statistical analyses of the differences between NIST and LNE ................................. 10
3.2 NIST certified reference specimens (LL-136 and HH-140) .......................................... 11
3.2.1 Statistical analyses of the differences between NIST and LNE ................................. 18
3.2 LNE certified reference specimens (1AD, 5AB, and 9E) .................................................. 19
3.3.1 Statistical analyses of the differences between NIST and LNE ................................. 28
4. Discussion .............................................................................................................................. 30
4.1 Instrumented parameters .................................................................................................... 30
4.2 Absorbed energy ................................................................................................................ 31
4.3 Lateral expansion ............................................................................................................... 33
5. Conclusions ........................................................................................................................... 34
References ..................................................................................................................................... 35
1
1. Introduction
Even though the Charpy impact test has already celebrated its 100th anniversary [1,2], it is
still widely used in laboratories and industries all over the world to obtain information on the
impact toughness of materials.
The Charpy test method was first standardized by the American Society for Testing and
Materials (ASTM) in 1933 [3], followed by an International Organization for Standardization
(ISO) standard published in 1983 [4].
Even though instrumented impact testing is often considered to be a relatively recent
technical development of Charpy testing, the earliest known paper on the topic actually predates
the first pendulum test machine publication by one year [5]. This type of test started to gain
popularity in the technical community in the early 1920’s, when it was considered a sort of
laboratory curiosity. The first review of instrumented impact methods was published in 1926 [6],
but it was during the 1960’s that the volume of work on instrumented impact testing started to
increase drastically.
The first attempt to standardize instrumented impact testing dates back to the 1970’s, when
an ASTM Technical Subcommittee was formed with the objective of producing a test method for
measuring the dynamic fracture toughness of fatigue precracked Charpy specimens. This work
was later abandoned, and it was only in the late 1990’s that ISO started work on a test standard for
instrumented impact testing. This standard (ISO 14556) was finally published in 2000 [7], and was
later followed by the first edition of ASTM E2298, published in 2009 [8].
Although instrumented Charpy tests are routinely performed in many laboratories around
the world and international standards are now available for the execution of the tests and the
analysis of the results, there remains a need to ensure that impact forces are obtained more
accurately. To accomplish this, an international scale based on SI units needs to be established to
reduce bias between National Metrology Institutes (NMIs).
To this regard, during the annual meeting of ISO/TC 164 SC4 (Mechanical Testing of
Metals, Toughness Testing -- Fracture, Pendulum, Tear) held in Paris France in 2011, multiple
intercomparisons of instrumented Charpy tests between NMIs were discussed and proposed as a
means to reduce bias between National Institutes.
The first step of this activity was an interlaboratory comparison of instrumented Charpy
test results between NIST and the Brazilian National Institute of Metrology, Quality and
Technology (Inmetro). This exercise was conducted in 2012-2013, and consisted of testing NIST
reference specimens of low and high energy on nominally identical1 impact machines available at
NIST and Inmetro, equipped with the same instrumented striker. Tests were performed in four
stages, two at NIST and two at Inmetro, over a period spanning from August 2012 to February
2013. NIST acted as the Pilot Laboratory for this Supplementary Comparison among the
SIM.MWG7 (Inter-American Metrology Institutes - Technical Committee of Mass and Related
Quantity-Working Group of Force 7), in cooperation with Inmetro for the development and the
planning of this interlaboratory comparison. The results of this activity have been published jointly
by NIST and Inmetro in the form of a Technical Report [9].
1 By “nominally identical”, we mean here that the two machines are from the same manufacturer, correspond to the
same model, and have the same potential energy (capacity) and impact velocity.

2
The following stage of the project consisted in a similar interlaboratory comparison of
instrumented Charpy test results between NIST and the Laboratoire National de métrologie et
d’Essais (LNE, France). The scope of the comparison was expanded to include tests on reference
specimens produced by both institutes at different absorbed energy levels, as well as instrumented
and non-instrumented impact tests. The experimental activity was conducted on two nominally
identical pendulum impact machines, one operated by NIST Boulder, CO (USA) and the other by
LNE Trappes (France), equipped with the same instrumented striker. Signal acquisition was
accomplished by means of the same instrumentation. The complete results of this activity are
provided in this document.
2. Description of the technical program
2.1 Materials and specimens
Both NIST and LNE produce and sell certified reference Charpy specimens for the indirect
verification of impact pendulum machines, in accordance with ASTM E23 and ISO 148
respectively.
NIST certified reference specimens cover three absorbed energy (KV) levels at -40 °C: low
energy (≈ 15 J), high energy (≈ 100 J), and super-high energy (≈ 200 J). LNE certified reference
Charpy specimens cover five absorbed energy levels at 20 °C: low energy (≈ 25 J), medium energy
(≈ 80 J), high energy (≈ 120 J and ≈ 160 J), and super high energy (≈ 200 J).
Within this intercomparison between NIST and LNE, full-size Charpy specimens from the
following reference lots have been tested (expanded uncertainties are also provided):
NIST LL-103 (low energy, certified KV = 15.3 J ± 0.1 J at -40 °C and 18.2 J ± 0.1 J at
21 °C)
NIST HH-103 (high energy, KV = 97.5 J ± 0.6 J at -40 °C and 105.3 J ± 0.6 J at 21 °C)
NIST LL-136 (low energy, certified KV = 17.1 J ± 0.1 J at -40 °C)
NIST HH-140 (high energy, certified KV = 97.6 J ± 0.6 J at -40 °C)
LNE 1AD (certified KV = 29.7 J ± 0.9 J at 20 °C)
LNE 5AB (certified KV = 131.9 J ± 3.6 J at 20 °C)
LNE 9E (certified KV = 199.1 J ± 4.0 J at 20 °C).
Note that lots LL-103 and HH-103 (force verification specimens) have also been certified
at NIST for the dynamic verification of instrumented strikers by means of an international
round-robin exercise [10]. Their certified values of maximum force, Fm, at 21 °C are (expanded
uncertainties are also provided):
LL-103 – Fm = 33.00 kN ± 1.86 kN
HH-103 – Fm = 24.06 kN ± 0.07 kN.
A total of 140 Charpy tests (70 instrumented and 70 non-instrumented) have been
performed. The complete test matrix, organized in chronological fashion, is provided in Table 1.
2.2 Test machines
Two nominally identical impact pendulum machines have been used for this exercise. Both
machines had the following characteristics:

3
potential energy (machine capacity) = 358.63 J
impact velocity = 5.13 m/s.
The most notable difference is the angle of taper of the anvils. The NIST machine had an angle of
10 ° in accordance with ASTM E23-12c, whereas the machine at LNE had an angle of 11 °, which
satisfies the requirements of ISO 148-2:2008 [10].
Table 1 - Test matrix of the interlaboratory comparison between NIST and LNE.
Test
location Test date
Specimen
lot/batch
Number
of tests Type of test
NIST May 13, 2014
LL-103 3
Instrumented
HH-103 3
LL-136 5
HH-140 5
LNE
May 20, 2014
LL-103 3
HH-103 3
LL-136 5
HH-140 5
1AD 5
5AB 5
9E 5
May 21, 2014
LL-103 2
HH-103 2
LL-136 10
Non-instrumented
HH-140 10
1AD 5
5AB 5
9E 5
NIST
June 3, 2014
LL-103 2
Instrumented
HH-103 2
1AD 5
5AB 5
9E 5
June 4, 2014
LL-136 10
Non-instrumented
HH-140 10
1AD 5
5AB 5
9E 5
2.3 Instrumented striker and acquisition system
The same instrumented striker and data acquisition system was used for all Charpy tests.
This striker, designated JS-1, had a radius of the striking edge equal to 8 mm, in accordance with
ASTM E23-12c. The striker was instrumented with strain-gages in a “left-right” configuration
with respect to the direction of impact2.
2 The other common design for an instrumented striker is the so-called “top-bottom” configuration.
4
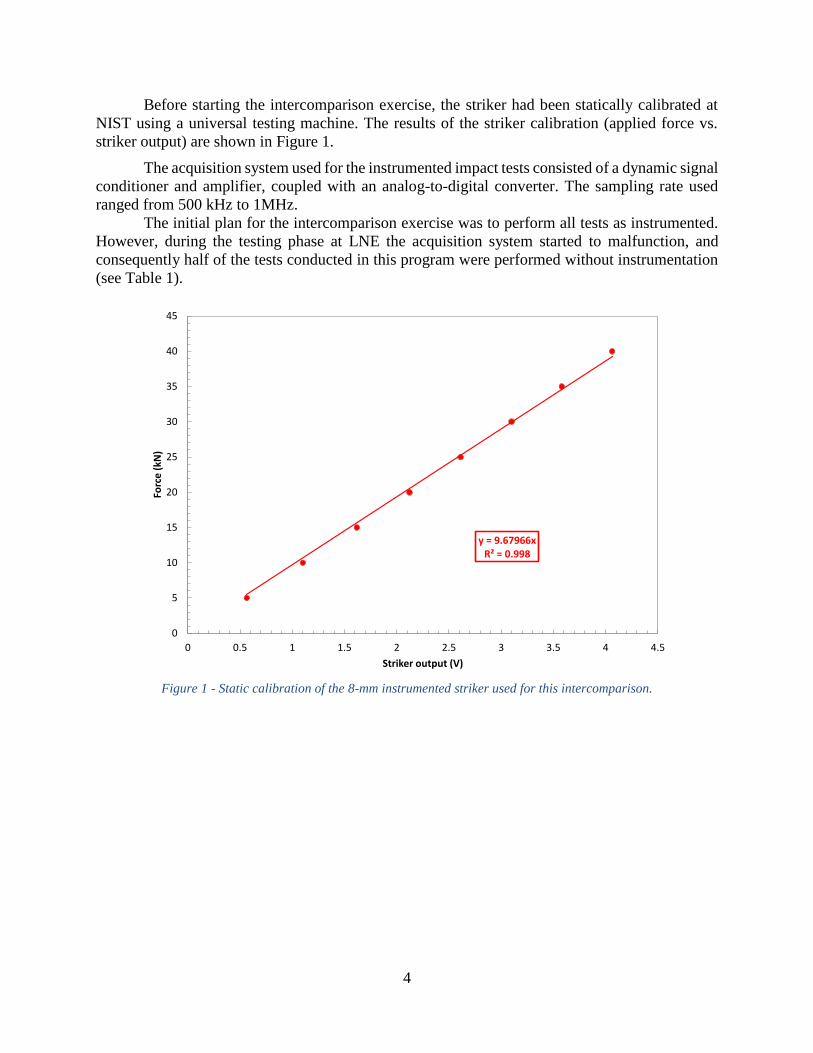
Before starting the intercomparison exercise, the striker had been statically calibrated at
NIST using a universal testing machine. The results of the striker calibration (applied force vs.
striker output) are shown in Figure 1.
The acquisition system used for the instrumented impact tests consisted of a dynamic signal
conditioner and amplifier, coupled with an analog-to-digital converter. The sampling rate used
ranged from 500 kHz to 1MHz.
The initial plan for the intercomparison exercise was to perform all tests as instrumented.
However, during the testing phase at LNE the acquisition system started to malfunction, and
consequently half of the tests conducted in this program were performed without instrumentation
(see Table 1).
Figure 1 - Static calibration of the 8-mm instrumented striker used for this intercomparison.
y = 9.67966xR² = 0.998
0
5
10
15
20
25
30
35
40
45
0 0.5 1 1.5 2 2.5 3 3.5 4 4.5
Forc
e (
kN)
Striker output (V)

5
3. Test results
3.1 NIST force verification specimens (LL-103 and HH-103)
The individual test results obtained at NIST and LNE on LL-103 and HH-103 are presented
in Table 2 and Table 3, respectively. In the tables, the following parameters are reported:
force at general yield, Fgy;
elastic compliance3, Cel;
maximum force, Fm;
absorbed energy calculated under the instrumented test record, Wt;
absorbed energy provided by the machine encoder, KV;
ratio KV/Wt;
lateral expansion4, LE.
For each parameter average values, standard deviations and coefficients of variation5 (CV)
are reported for each individual test day and considering all tests performed in one location.
Table 2 - Results of the tests performed on LL-103.
3 The elastic compliance was obtained by visually selecting the force oscillations belonging to the initial linear portion
of the force-displacement curve. 4 Note that all lateral expansion measurements, on specimens tested both at NIST and LNE, were executed at NIST
by the same operator. 5 The coefficient of variation is obtained, in percent, by dividing the standard deviation by the average value.
Charpy Specimen F gy C el Fm W t KV LE
lot id (kN) (mm/kN) (kN) (J) (J) (mm)
96 25.99 0.019 34.02 20.17 18.67 0.926 0.047
420 27.02 0.020 33.39 19.91 18.76 0.942 0.040
938 26.02 0.018 33.70 21.13 19.89 0.941 0.055
Average 26.34 0.019 33.70 20.40 19.33 0.942 0.048
s 0.586 7.00E-04 0.315 0.643 0.680 0.009 0.008
CV, % 2.23 3.65 0.93 3.15 3.52 0.99 15.80
186 31.71 0.021 36.01 22.86 20.61 0.902 0.066
153 28.57 0.023 36.83 21.90 20.17 0.921 0.062
747 29.49 0.021 39.89 24.12 20.85 0.864 0.106
Average 29.92 0.022 37.58 22.96 20.54 0.896 0.078
s 1.614 1.01E-03 2.045 1.113 0.345 0.029 0.024
CV, % 5.39 4.71 5.44 4.85 1.68 3.21 31.19
237 30.67 0.021 34.05 21.81 19.04 0.873 0.076
1162 29.82 0.021 36.53 23.83 20.93 0.878 0.105
Average 30.25 0.021 35.29 22.82 19.99 0.876 0.091
s 0.601 6.51E-04 1.754 1.428 1.336 0.004 0.021
CV, % 1.99 3.10 4.97 6.26 6.69 0.43 22.66
639 20.25 0.037 23.98 15.31 19.89 1.299 0.052
1144 20.31 0.032 21.36 18.91 18.67 0.987 0.044
Average 20.28 0.034 22.67 17.11 19.28 1.143 0.048
s 0.042 4.04E-03 1.853 2.546 0.863 0.221 0.006
CV, % 0.21 11.72 8.17 14.88 4.47 19.29 11.79
Average 23.92 0.025 29.29 19.09 19.18 1.019 0.048
s 3.347 8.63E-03 6.118 2.254 0.653 0.158 0.006
CV, % 13.99 34.16 20.89 11.81 3.40 15.52 12.66
Average 30.05 0.021 36.66 22.90 20.32 0.888 0.083
s 1.193 8.44E-04 2.104 1.066 0.774 0.023 0.021
CV, % 3.97 3.96 5.74 4.65 3.81 2.61 25.50
NIST
(5/13/14)
LNE
(5/20/14)
LNE
(5/21/14)
NIST
(6/3/14)
LL-103
NIST
(all)
LNE
(all)
Lab KV /W t
6
Table 3 - Results of the tests performed on HH-103.
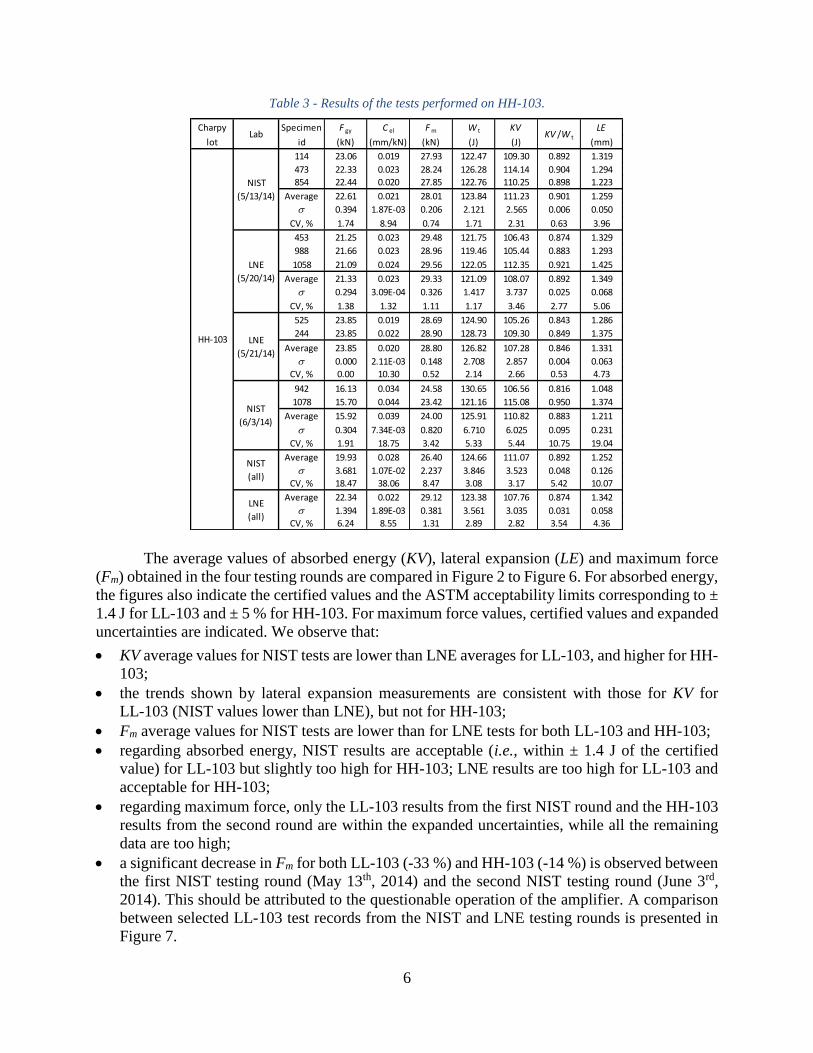
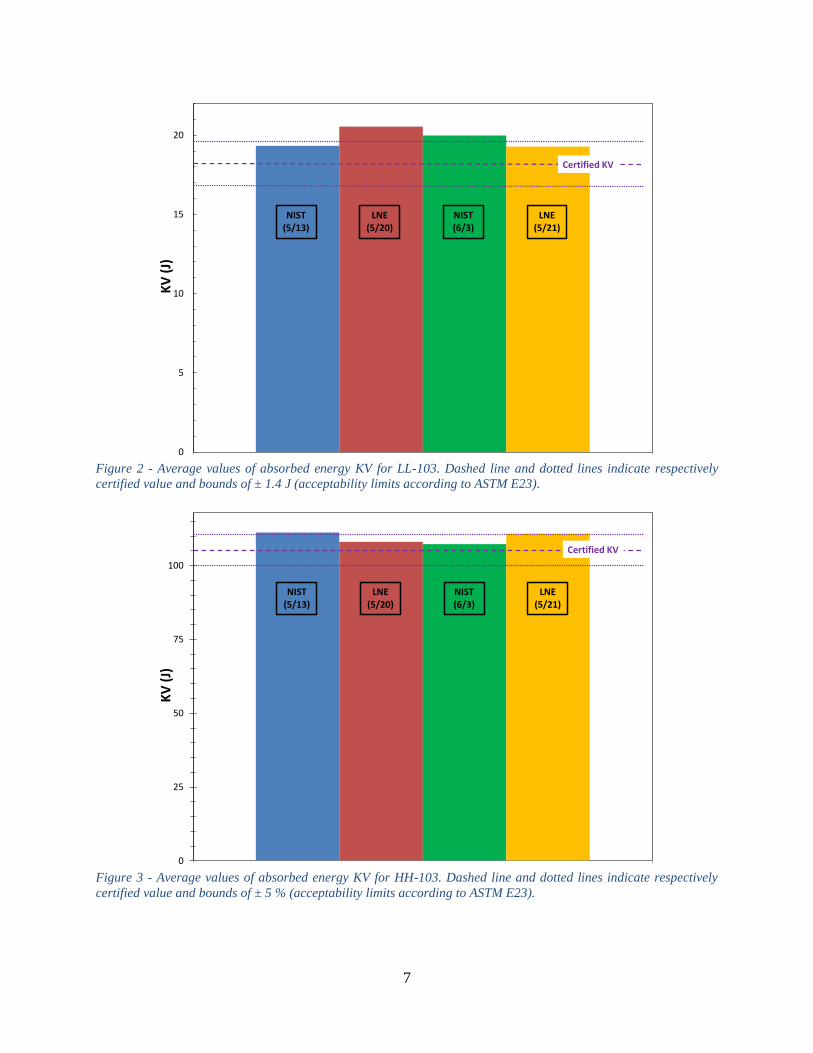
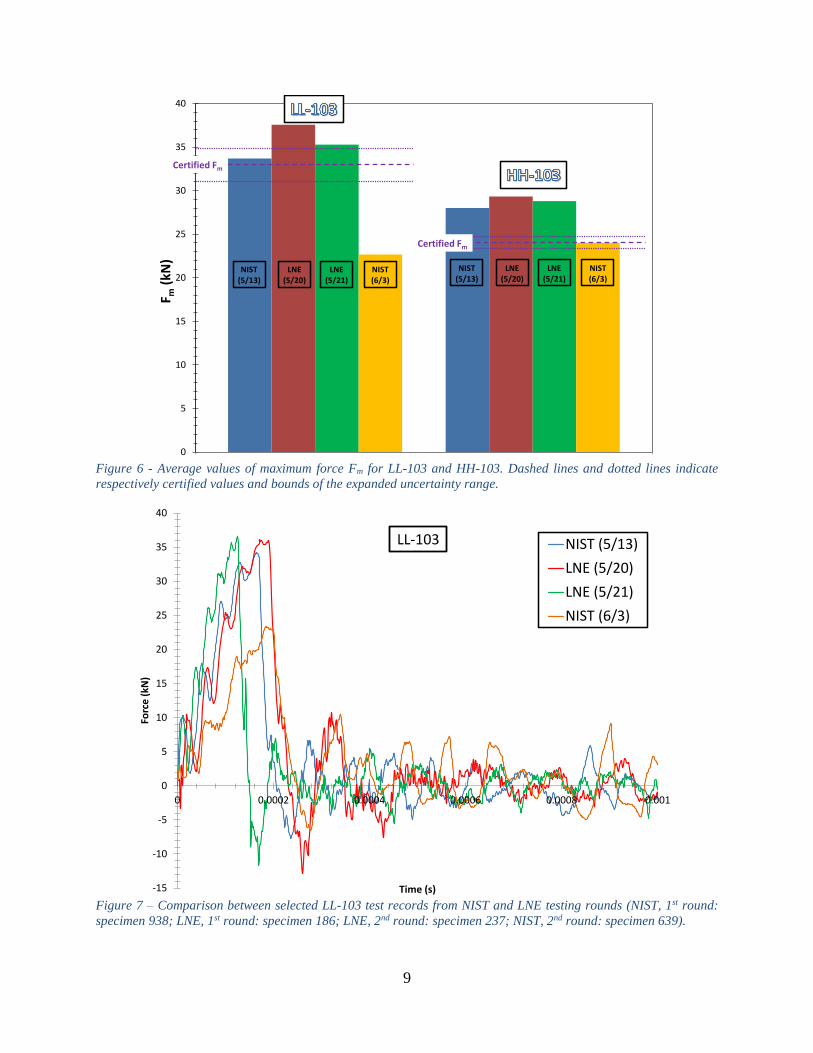
The average values of absorbed energy (KV), lateral expansion (LE) and maximum force
(Fm) obtained in the four testing rounds are compared in Figure 2 to Figure 6. For absorbed energy,
the figures also indicate the certified values and the ASTM acceptability limits corresponding to ±
1.4 J for LL-103 and ± 5 % for HH-103. For maximum force values, certified values and expanded
uncertainties are indicated. We observe that:
KV average values for NIST tests are lower than LNE averages for LL-103, and higher for HH-
103;
the trends shown by lateral expansion measurements are consistent with those for KV for
LL-103 (NIST values lower than LNE), but not for HH-103;
Fm average values for NIST tests are lower than for LNE tests for both LL-103 and HH-103;
regarding absorbed energy, NIST results are acceptable (i.e., within ± 1.4 J of the certified
value) for LL-103 but slightly too high for HH-103; LNE results are too high for LL-103 and
acceptable for HH-103;
regarding maximum force, only the LL-103 results from the first NIST round and the HH-103
results from the second round are within the expanded uncertainties, while all the remaining
data are too high;
a significant decrease in Fm for both LL-103 (-33 %) and HH-103 (-14 %) is observed between
the first NIST testing round (May 13th, 2014) and the second NIST testing round (June 3rd,
2014). This should be attributed to the questionable operation of the amplifier. A comparison
between selected LL-103 test records from the NIST and LNE testing rounds is presented in
Figure 7.
Charpy Specimen F gy C el Fm W t KV LE
lot id (kN) (mm/kN) (kN) (J) (J) (mm)
114 23.06 0.019 27.93 122.47 109.30 0.892 1.319
473 22.33 0.023 28.24 126.28 114.14 0.904 1.294
854 22.44 0.020 27.85 122.76 110.25 0.898 1.223
Average 22.61 0.021 28.01 123.84 111.23 0.901 1.259
s 0.394 1.87E-03 0.206 2.121 2.565 0.006 0.050
CV, % 1.74 8.94 0.74 1.71 2.31 0.63 3.96
453 21.25 0.023 29.48 121.75 106.43 0.874 1.329
988 21.66 0.023 28.96 119.46 105.44 0.883 1.293
1058 21.09 0.024 29.56 122.05 112.35 0.921 1.425
Average 21.33 0.023 29.33 121.09 108.07 0.892 1.349
s 0.294 3.09E-04 0.326 1.417 3.737 0.025 0.068
CV, % 1.38 1.32 1.11 1.17 3.46 2.77 5.06
525 23.85 0.019 28.69 124.90 105.26 0.843 1.286
244 23.85 0.022 28.90 128.73 109.30 0.849 1.375
Average 23.85 0.020 28.80 126.82 107.28 0.846 1.331
s 0.000 2.11E-03 0.148 2.708 2.857 0.004 0.063
CV, % 0.00 10.30 0.52 2.14 2.66 0.53 4.73
942 16.13 0.034 24.58 130.65 106.56 0.816 1.048
1078 15.70 0.044 23.42 121.16 115.08 0.950 1.374
Average 15.92 0.039 24.00 125.91 110.82 0.883 1.211
s 0.304 7.34E-03 0.820 6.710 6.025 0.095 0.231
CV, % 1.91 18.75 3.42 5.33 5.44 10.75 19.04
Average 19.93 0.028 26.40 124.66 111.07 0.892 1.252
s 3.681 1.07E-02 2.237 3.846 3.523 0.048 0.126
CV, % 18.47 38.06 8.47 3.08 3.17 5.42 10.07
Average 22.34 0.022 29.12 123.38 107.76 0.874 1.342
s 1.394 1.89E-03 0.381 3.561 3.035 0.031 0.058
CV, % 6.24 8.55 1.31 2.89 2.82 3.54 4.36
HH-103
NIST
(5/13/14)
LNE
(5/20/14)
NIST
(6/3/14)
LNE
(5/21/14)
Lab KV /W t
NIST
(all)
LNE
(all)
7
Figure 2 - Average values of absorbed energy KV for LL-103. Dashed line and dotted lines indicate respectively
certified value and bounds of ± 1.4 J (acceptability limits according to ASTM E23).
Figure 3 - Average values of absorbed energy KV for HH-103. Dashed line and dotted lines indicate respectively
certified value and bounds of ± 5 % (acceptability limits according to ASTM E23).
0
5
10
15
20
KV
(J)
Certified KV
NIST(5/13)
NIST(6/3)
LNE(5/20)
LNE(5/21)
0
25
50
75
100
KV
(J)
Certified KV
NIST(5/13)
NIST(6/3)
LNE(5/20)
LNE(5/21)
8
Figure 4 - Average values of lateral expansion (LE) for LL-103.
Figure 5 - Average values of lateral expansion (LE) for HH-103.
0
0.01
0.02
0.03
0.04
0.05
0.06
0.07
0.08
0.09
0.1
Late
ral e
xpan
sio
n (
mm
)
NIST(5/13)
NIST(6/3)
LNE(5/20)
LNE(5/21)
0
0.2
0.4
0.6
0.8
1
1.2
1.4
Late
ral e
xpan
sio
n (
mm
)
NIST(5/13)
NIST(6/3)
LNE(5/20)
LNE(5/21)
9
Figure 6 - Average values of maximum force Fm for LL-103 and HH-103. Dashed lines and dotted lines indicate
respectively certified values and bounds of the expanded uncertainty range.
Figure 7 – Comparison between selected LL-103 test records from NIST and LNE testing rounds (NIST, 1st round:
specimen 938; LNE, 1st round: specimen 186; LNE, 2nd round: specimen 237; NIST, 2nd round: specimen 639).
0
5
10
15
20
25
30
35
40
F m(k
N)
Certified Fm
Certified Fm
NIST(5/13)
NIST(6/3)
LNE(5/20)
LNE(5/21)
NIST(5/13)
NIST(6/3)
LNE(5/20)
LNE(5/21)
-15
-10
-5
0
5
10
15
20
25
30
35
40
0 0.0002 0.0004 0.0006 0.0008 0.001
Forc
e (
kN)
Time (s)
NIST (5/13)
LNE (5/20)
LNE (5/21)
NIST (6/3)
LL-103
10
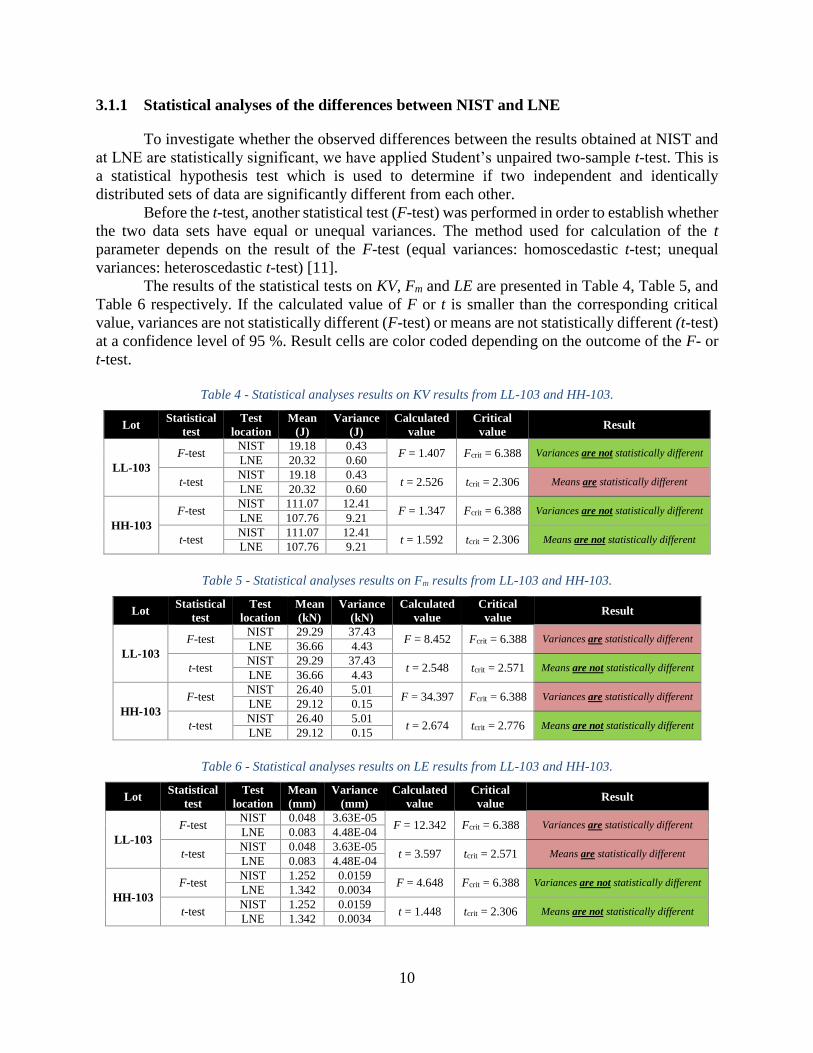
3.1.1 Statistical analyses of the differences between NIST and LNE
To investigate whether the observed differences between the results obtained at NIST and
at LNE are statistically significant, we have applied Student’s unpaired two-sample t-test. This is
a statistical hypothesis test which is used to determine if two independent and identically
distributed sets of data are significantly different from each other.
Before the t-test, another statistical test (F-test) was performed in order to establish whether
the two data sets have equal or unequal variances. The method used for calculation of the t
parameter depends on the result of the F-test (equal variances: homoscedastic t-test; unequal
variances: heteroscedastic t-test) [11].
The results of the statistical tests on KV, Fm and LE are presented in Table 4, Table 5, and
Table 6 respectively. If the calculated value of F or t is smaller than the corresponding critical
value, variances are not statistically different (F-test) or means are not statistically different (t-test)
at a confidence level of 95 %. Result cells are color coded depending on the outcome of the F- or
t-test.
Table 4 - Statistical analyses results on KV results from LL-103 and HH-103.
Lot Statistical
test
Test
location
Mean
(J)
Variance
(J)
Calculated
value
Critical
value Result
LL-103
F-test NIST 19.18 0.43
F = 1.407 Fcrit = 6.388 Variances are not statistically different LNE 20.32 0.60
t-test NIST 19.18 0.43
t = 2.526 tcrit = 2.306 Means are statistically different LNE 20.32 0.60
HH-103
F-test NIST 111.07 12.41
F = 1.347 Fcrit = 6.388 Variances are not statistically different LNE 107.76 9.21
t-test NIST 111.07 12.41
t = 1.592 tcrit = 2.306 Means are not statistically different LNE 107.76 9.21
Table 5 - Statistical analyses results on Fm results from LL-103 and HH-103.
Lot Statistical
test
Test
location
Mean
(kN)
Variance
(kN)
Calculated
value
Critical
value Result
LL-103
F-test NIST 29.29 37.43
F = 8.452 Fcrit = 6.388 Variances are statistically different LNE 36.66 4.43
t-test NIST 29.29 37.43
t = 2.548 tcrit = 2.571 Means are not statistically different LNE 36.66 4.43
HH-103
F-test NIST 26.40 5.01
F = 34.397 Fcrit = 6.388 Variances are statistically different LNE 29.12 0.15
t-test NIST 26.40 5.01
t = 2.674 tcrit = 2.776 Means are not statistically different LNE 29.12 0.15
Table 6 - Statistical analyses results on LE results from LL-103 and HH-103.
Lot Statistical
test
Test
location
Mean
(mm)
Variance
(mm)
Calculated
value
Critical
value Result
LL-103
F-test NIST 0.048 3.63E-05
F = 12.342 Fcrit = 6.388 Variances are statistically different LNE 0.083 4.48E-04
t-test NIST 0.048 3.63E-05
t = 3.597 tcrit = 2.571 Means are statistically different LNE 0.083 4.48E-04
HH-103
F-test NIST 1.252 0.0159
F = 4.648 Fcrit = 6.388 Variances are not statistically different LNE 1.342 0.0034
t-test NIST 1.252 0.0159
t = 1.448 tcrit = 2.306 Means are not statistically different LNE 1.342 0.0034
11
While variances were found to be sometimes equal and sometimes unequal among the
different data sets, the t-tests performed showed statistically significant differences between NIST
and LNE for LL-103.
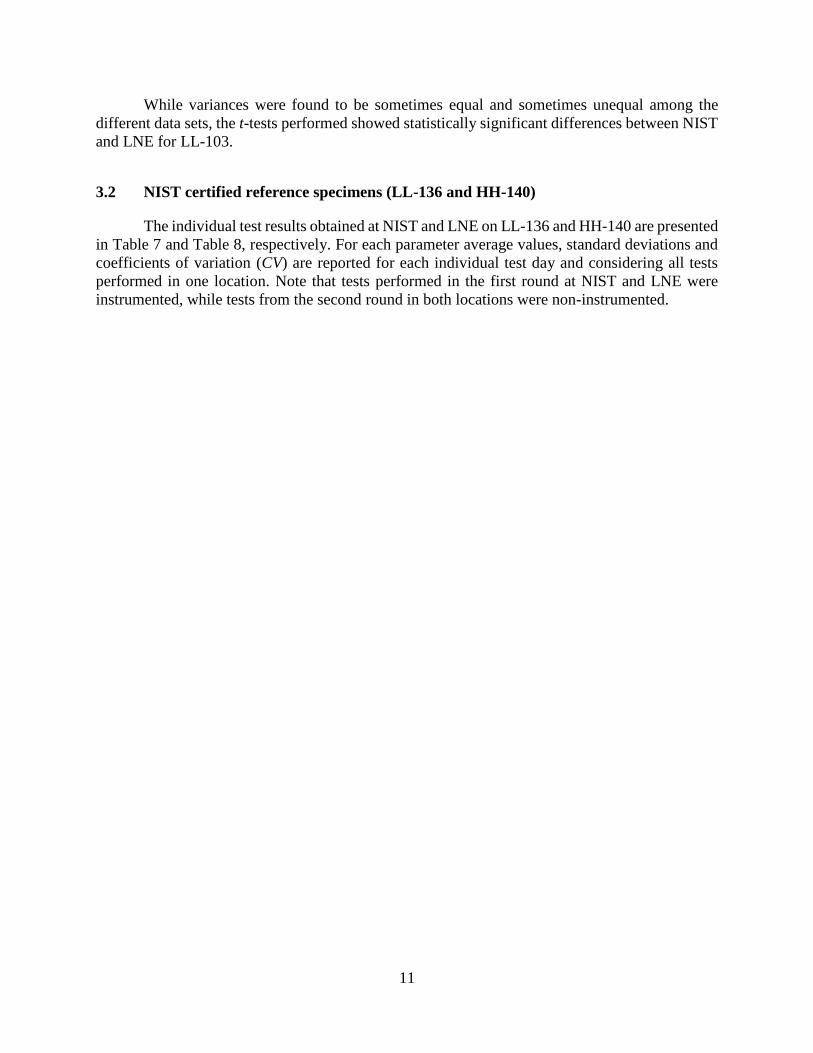
3.2 NIST certified reference specimens (LL-136 and HH-140)
The individual test results obtained at NIST and LNE on LL-136 and HH-140 are presented
in Table 7 and Table 8, respectively. For each parameter average values, standard deviations and
coefficients of variation (CV) are reported for each individual test day and considering all tests
performed in one location. Note that tests performed in the first round at NIST and LNE were
instrumented, while tests from the second round in both locations were non-instrumented.
12
Table 7 - Results of the tests performed on LL-136.
Charpy Specimen F gy C el Fm W t KV LE
lot id (kN) (mm/kN) (kN) (J) (J) (mm)
857 31.56 0.012 34.82 24.10 22.24 0.923 0.127
1023 31.77 0.010 34.82 22.45 19.80 0.882 0.087
1030 31.08 0.013 34.79 22.21 20.58 0.927 0.111
1193 33.63 0.013 34.64 22.80 20.84 0.914 0.125
2265 33.47 0.009 35.05 21.86 19.89 0.910 0.041
Average 32.30 0.011 34.82 22.68 20.28 0.908 0.091
s 1.168 1.77E-03 0.147 0.863 0.983 0.018 0.036
CV, % 3.62 15.52 0.42 3.80 4.85 1.94 39.27
706 21.28 0.020 38.67 25.29 23.98 0.948 0.076
709 24.63 0.024 37.87 24.28 22.13 0.911 0.099
1050 19.05 0.019 37.99 24.24 21.54 0.889 0.128
1114 24.61 0.020 36.22 24.33 22.06 0.907 0.176
1867 22.82 0.023 37.99 25.10 23.31 0.929 0.056
Average 22.48 0.021 37.75 24.65 22.60 0.917 0.107
s 2.371 2.38E-03 0.911 0.505 1.006 0.023 0.047
CV, % 10.55 11.19 2.41 2.05 4.45 2.47 43.91
782 21.14 0.217
808 23.60 0.145
828 23.67 0.102
909 24.30 0.107
1126 22.09 0.153
2116 23.33 0.130
2180 21.94 0.117
2459 24.43 0.128
2498 22.32 0.120
2623 20.85 0.117
Average 22.77 0.134
s 1.274 0.033
CV, % 5.60 24.89
1033 19.98 0.098
947 23.38 0.068
384 21.55 0.099
2175 18.85 0.098
2143 19.63 0.088
1203 20.59 0.078
2177 20.85 0.129
760 21.11 0.105
997 19.55 0.113
847 22.68 0.112
Average 20.82 0.099
s 1.426 0.018
CV, % 6.85 17.93
Average 22.71 0.125
s 1.157 0.039
CV, % 5.09 31.15
Average 20.77 0.099
s 1.260 0.024
CV, % 6.07 24.15
Lab KV /W t
NIST
(6/4/14)
LNE
(5/21/14)
NON-INSTRUMENTED
TESTS
NIST
(5/13/14)
LNE
(5/20/14)
LL-136
NON-INSTRUMENTED
TESTS
LNE
(all)
NIST
(all)
13
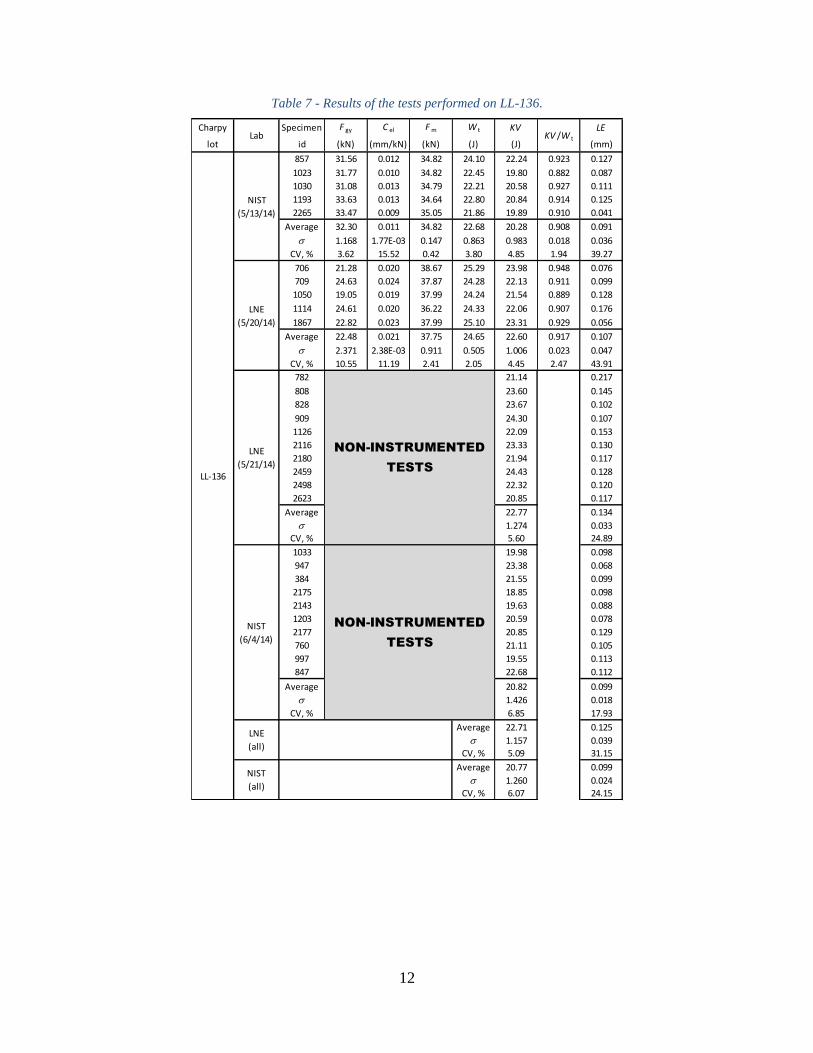
Table 8 - Results of the tests performed on HH-140.
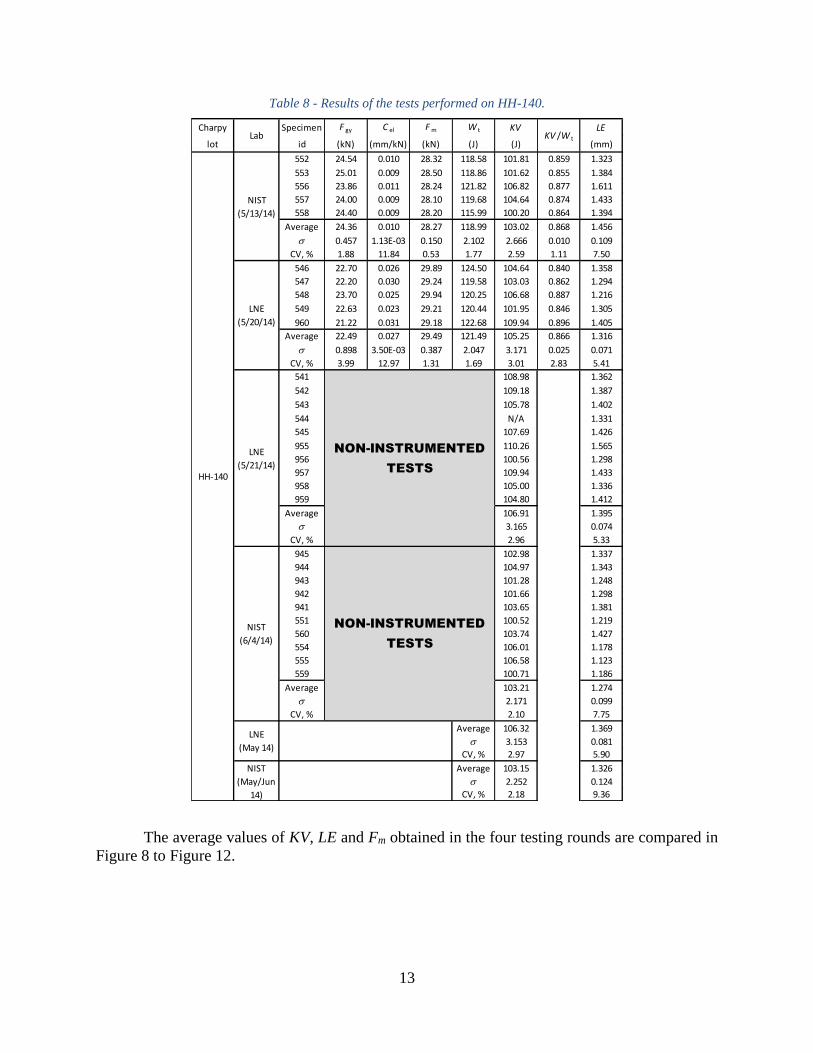
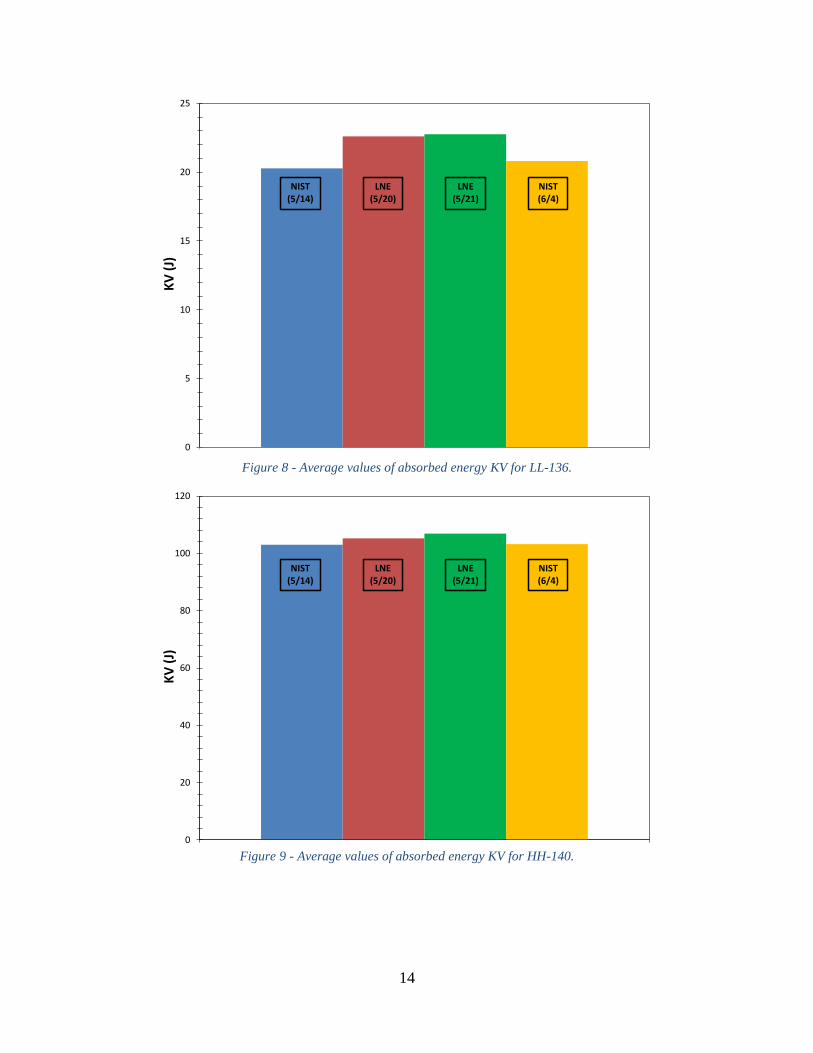
The average values of KV, LE and Fm obtained in the four testing rounds are compared in
Figure 8 to Figure 12.
Charpy Specimen F gy C el Fm W t KV LE
lot id (kN) (mm/kN) (kN) (J) (J) (mm)
552 24.54 0.010 28.32 118.58 101.81 0.859 1.323
553 25.01 0.009 28.50 118.86 101.62 0.855 1.384
556 23.86 0.011 28.24 121.82 106.82 0.877 1.611
557 24.00 0.009 28.10 119.68 104.64 0.874 1.433
558 24.40 0.009 28.20 115.99 100.20 0.864 1.394
Average 24.36 0.010 28.27 118.99 103.02 0.868 1.456
s 0.457 1.13E-03 0.150 2.102 2.666 0.010 0.109
CV, % 1.88 11.84 0.53 1.77 2.59 1.11 7.50
546 22.70 0.026 29.89 124.50 104.64 0.840 1.358
547 22.20 0.030 29.24 119.58 103.03 0.862 1.294
548 23.70 0.025 29.94 120.25 106.68 0.887 1.216
549 22.63 0.023 29.21 120.44 101.95 0.846 1.305
960 21.22 0.031 29.18 122.68 109.94 0.896 1.405
Average 22.49 0.027 29.49 121.49 105.25 0.866 1.316
s 0.898 3.50E-03 0.387 2.047 3.171 0.025 0.071
CV, % 3.99 12.97 1.31 1.69 3.01 2.83 5.41
541 108.98 1.362
542 109.18 1.387
543 105.78 1.402
544 N/A 1.331
545 107.69 1.426
955 110.26 1.565
956 100.56 1.298
957 109.94 1.433
958 105.00 1.336
959 104.80 1.412
Average 106.91 1.395
s 3.165 0.074
CV, % 2.96 5.33
945 102.98 1.337
944 104.97 1.343
943 101.28 1.248
942 101.66 1.298
941 103.65 1.381
551 100.52 1.219
560 103.74 1.427
554 106.01 1.178
555 106.58 1.123
559 100.71 1.186
Average 103.21 1.274
s 2.171 0.099
CV, % 2.10 7.75
Average 106.32 1.369
s 3.153 0.081
CV, % 2.97 5.90
Average 103.15 1.326
s 2.252 0.124
CV, % 2.18 9.36
NON-INSTRUMENTED
TESTS
NIST
(May/Jun
14)
NIST
(5/13/14)
LNE
(5/20/14)
Lab
LNE
(5/21/14)HH-140
NIST
(6/4/14)
NON-INSTRUMENTED
TESTS
LNE
(May 14)
KV /W t
14
Figure 8 - Average values of absorbed energy KV for LL-136.
Figure 9 - Average values of absorbed energy KV for HH-140.
0
5
10
15
20
25
KV
(J)
NIST(5/14)
LNE(5/21)
LNE(5/20)
NIST(6/4)
0
20
40
60
80
100
120
KV
(J)
NIST(5/14)
LNE(5/21)
LNE(5/20)
NIST(6/4)
15
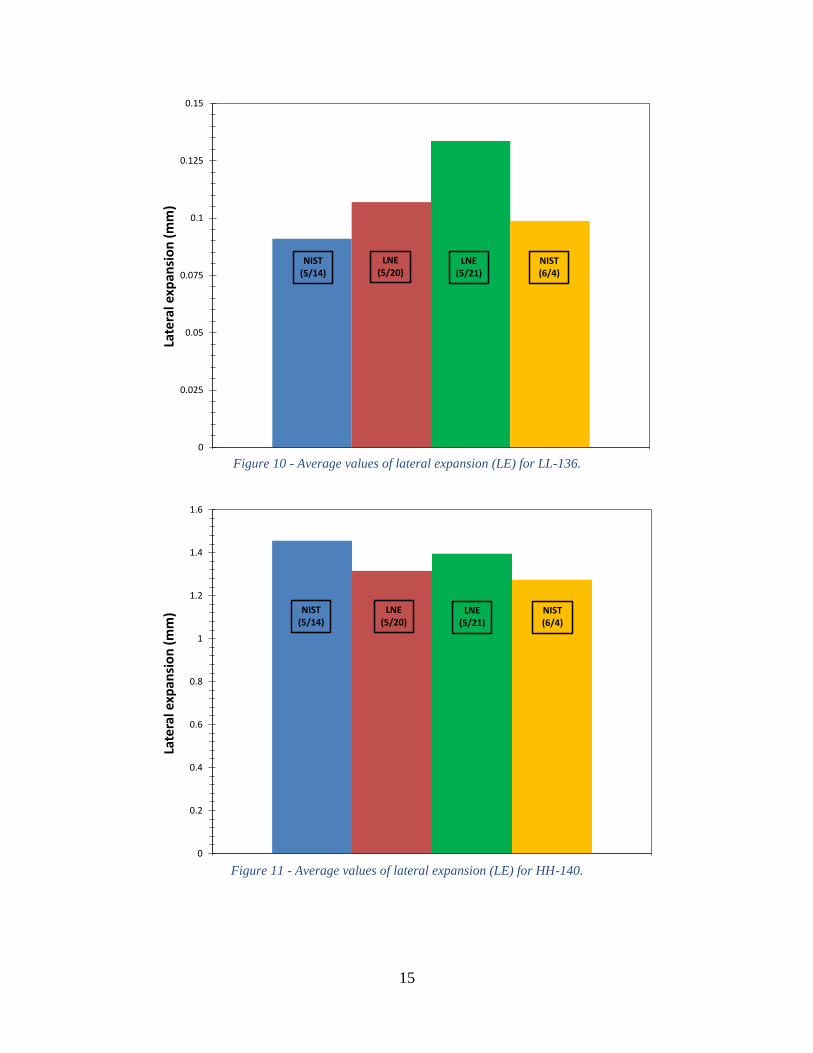
Figure 10 - Average values of lateral expansion (LE) for LL-136.
Figure 11 - Average values of lateral expansion (LE) for HH-140.
0
0.025
0.05
0.075
0.1
0.125
0.15
Late
ral e
xpan
sio
n (
mm
)
NIST(5/14)
LNE(5/21)
LNE(5/20)
NIST(6/4)
0
0.2
0.4
0.6
0.8
1
1.2
1.4
1.6
Late
ral e
xpan
sio
n (
mm
) NIST(5/14)
LNE(5/21)
LNE(5/20)
NIST(6/4)
16
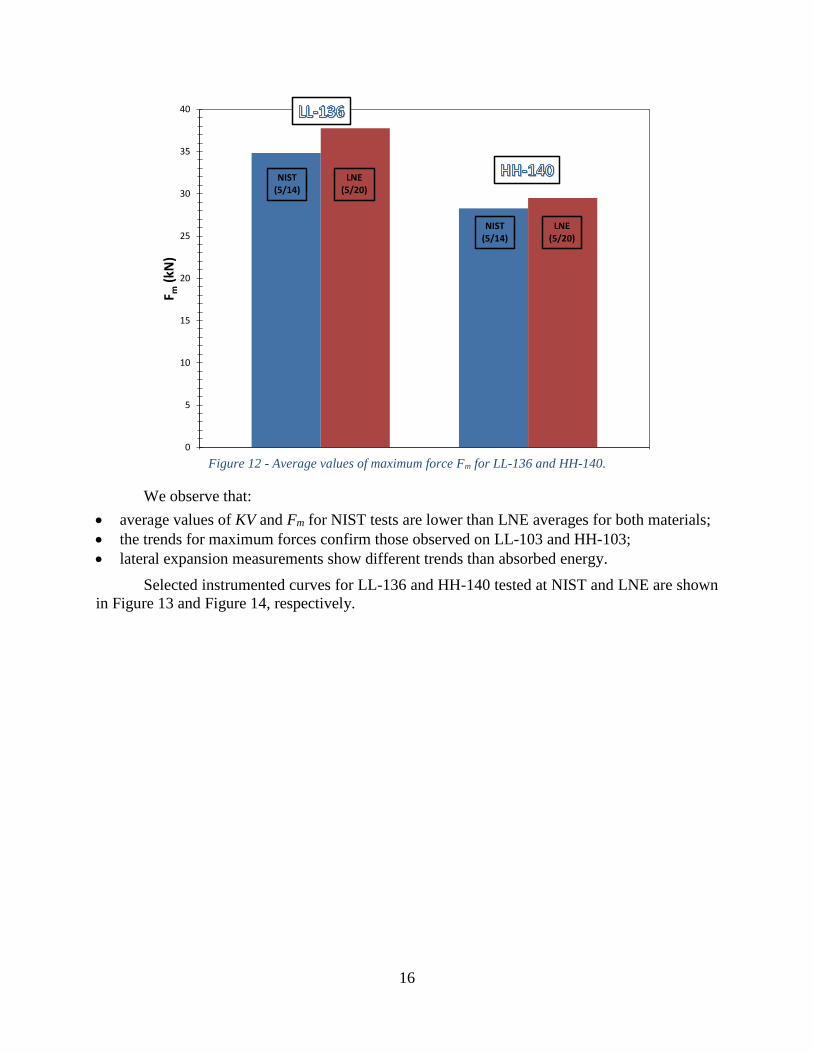
Figure 12 - Average values of maximum force Fm for LL-136 and HH-140.
We observe that:
average values of KV and Fm for NIST tests are lower than LNE averages for both materials;
the trends for maximum forces confirm those observed on LL-103 and HH-103;
lateral expansion measurements show different trends than absorbed energy.
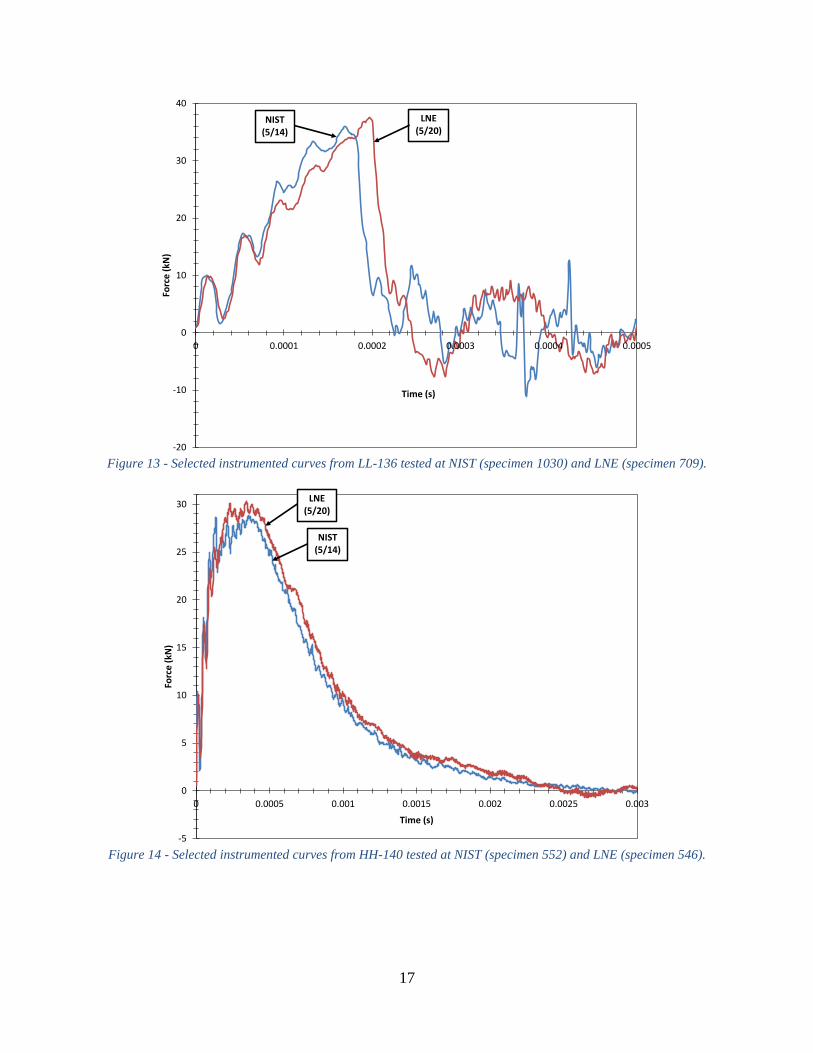
Selected instrumented curves for LL-136 and HH-140 tested at NIST and LNE are shown
in Figure 13 and Figure 14, respectively.
0
5
10
15
20
25
30
35
40
F m(k
N)
NIST(5/14)
LNE(5/20)
NIST(5/14)
LNE(5/20)
17
Figure 13 - Selected instrumented curves from LL-136 tested at NIST (specimen 1030) and LNE (specimen 709).
Figure 14 - Selected instrumented curves from HH-140 tested at NIST (specimen 552) and LNE (specimen 546).
-20
-10
0
10
20
30
40
0 0.0001 0.0002 0.0003 0.0004 0.0005
Forc
e (
kN)
Time (s)
NIST(5/14)
LNE(5/20)
-5
0
5
10
15
20
25
30
0 0.0005 0.001 0.0015 0.002 0.0025 0.003
Forc
e (
kN)
Time (s)
NIST(5/14)
LNE(5/20)

18
3.2.1 Statistical analyses of the differences between NIST and LNE
In addition to analyzing the statistical differences between the mean values of the test
results obtained at NIST and at LNE, we have also applied the same procedure (F-test to
investigate the equality of the variances, and t-test for the difference between means) to test
absorbed energy and lateral expansion results obtained at the same location in two different test
days. The results of these preliminary analyses are listed in Table 9 (NIST tests) and
Table 10 (LNE tests), which show no statistical difference between tests performed on different
days.
Table 9 - Statistical analyses on KV results obtained at NIST from LL-136 and HH-140.
Lot Statistical
test
Test
date
Mean
(J)
Variance
(J)
Calculated
value
Critical
value Result
LL-136
F-test 5/13/14 20.67 0.97
F = 2.102 Fcrit = 5.999 Variances are not statistically different 6/4/14 20.82 2.03
t-test 5/13/14 20.67 0.97
t = 0.204 tcrit = 2.160 Means are not statistically different 6/4/14 20.82 2.03
HH-140
F-test 5/13/14 103.02 7.11
F = 1.508 Fcrit = 3.633 Variances are not statistically different 6/4/14 103.21 4.72
t-test 5/13/14 111.07 12.41
t = 0.150 tcrit = 2.160 Means are not statistically different 6/4/14 107.76 9.21
Table 10 - Statistical analyses on KV results obtained at LNE from LL-136 and HH-140.
Lot Statistical
test
Test
date
Mean
(J)
Variance
(J)
Calculated
value
Critical
value Result
LL-136
F-test 5/20/14 22.60 1.01
F = 1.605 Fcrit = 5.999 Variances are not statistically different 5/21/14 22.77 1.62
t-test 5/20/14 22.60 1.01
t = 0.248 tcrit = 2.160 Means are not statistically different 5/21/14 22.77 1.62
HH-140
F-test 5/20/14 106.91 10.02
F = 1.004 Fcrit = 3.838 Variances are not statistically different 5/21/14 105.25 10.06
t-test 5/20/14 106.91 10.02
t = 0.941 tcrit = 2.179 Means are not statistically different 5/21/14 105.25 10.06
The results of the statistical tests on KV, Fm and LE are presented in Table 11, Table 12,
and Table 13 respectively.
Table 11 - Statistical analyses results on KV results from LL-136 and HH-140.
Lot Statistical
test
Test
location
Mean
(J)
Variance
(J)
Calculated
value
Critical
value Result
LL-136
F-test NIST 20.77 1.59
F = 1.186 Fcrit = 2.483 Variances are not statistically different LNE 22.71 1.34
t-test NIST 20.77 1.59
t = 4.404 tcrit = 2.048 Means are statistically different LNE 22.71 1.34
HH-140
F-test NIST 103.15 5.07
F = 1.961 Fcrit = 2.507 Variances are not statistically different LNE 106.32 9.94
t-test NIST 103.15 5.07
t = 3.133 tcrit = 2.052 Means are statistically different LNE 106.32 9.94
19
Table 12 - Statistical analyses results on Fm results from LL-136 and HH-140.
Lot Statistical
test
Test
location
Mean
(kN)
Variance
(kN)
Calculated
value
Critical
value Results
LL-136
F-test NIST 34.82 0.02
F = 0.026 Fcrit = 0.157 Variances are not statistically different LNE 37.75 0.83
t-test NIST 34.82 0.02
t = 7.089 tcrit = 2.306 Means are statistically different LNE 37.75 0.83
HH-140
F-test NIST 28.27 0.02
F = 0.150 Fcrit = 0.157 Variances are not statistically different LNE 29.49 0.15
t-test NIST 28.27 0.02
t = 6.570 tcrit = 2.306 Means are statistically different LNE 29.49 0.15
Table 13 - Statistical analyses results on LE results from LL-136 and HH-140.
Lot Statistical
test
Test
location
Mean
(mm)
Variance
(mm)
Calculated
value
Critical
value Results
LL-136
F-test NIST 0.099 5.67E-04
F = 2.663 Fcrit = 2.484 Variances are statistically different LNE 0.125 1.51E-03
t-test NIST 0.099 5.67E-04
t = 2.221 tcrit = 2.069 Means are statistically different LNE 0.125 1.51E-03
HH-140
F-test NIST 1.326 0.015
F = 2.361 Fcrit = 2.484 Variances are not statistically different LNE 1.369 0.007
t-test NIST 1.326 0.015
t = 1.125 tcrit = 2.048 Means are not statistically different LNE 1.369 0.007
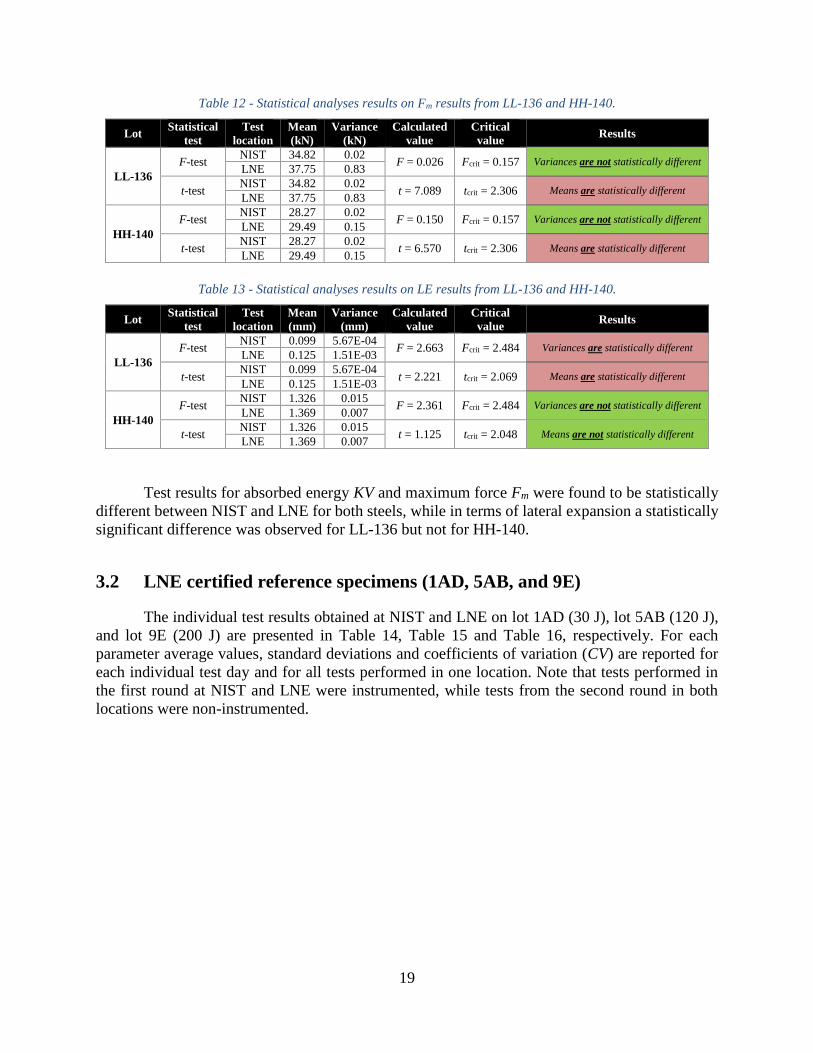
Test results for absorbed energy KV and maximum force Fm were found to be statistically
different between NIST and LNE for both steels, while in terms of lateral expansion a statistically
significant difference was observed for LL-136 but not for HH-140.
3.2 LNE certified reference specimens (1AD, 5AB, and 9E)
The individual test results obtained at NIST and LNE on lot 1AD (30 J), lot 5AB (120 J),
and lot 9E (200 J) are presented in Table 14, Table 15 and Table 16, respectively. For each
parameter average values, standard deviations and coefficients of variation (CV) are reported for
each individual test day and for all tests performed in one location. Note that tests performed in
the first round at NIST and LNE were instrumented, while tests from the second round in both
locations were non-instrumented.
20
Table 14 - Results of the tests performed on 1AD.
Charpy Specimen F gy C el Fm W t KV LE
lot id (kN) (mm/kN) (kN) (J) (J) (mm)
M52 30.70 0.023 43.28 33.99 30.57 0.899 0.163
D59 26.06 0.024 42.55 33.51 N/A N/A 0.106
J40 16.94 0.024 45.26 31.91 30.01 0.940 0.086
N38 27.78 0.022 44.89 33.96 30.53 0.899 0.153
E67 24.61 0.022 45.15 34.46 31.38 0.911 0.146
Average 25.22 0.023 44.23 33.57 30.64 0.917 0.123
s 5.153 7.65E-04 1.232 0.985 0.566 0.019 0.033
CV, % 20.43 3.34 2.78 2.93 1.85 2.13 26.97
H24 30.25 0.092
A65 30.23 0.052
P69 29.50 0.118
G83 31.15 0.158
I12 29.35 0.093
Average 30.10 0.103
s 0.718 0.039
CV, % 2.39 37.97
Average 30.33 0.117
s 0.675 0.037
CV, % 2.22 31.86
I43 22.95 0.033 31.08 25.17 29.62 1.177 0.144
P25 23.14 0.031 27.96 22.56 28.56 1.266 0.382
J18 21.77 0.033 27.13 20.95 28.64 1.367 0.131
H89 24.79 0.033 27.66 22.64 29.26 1.292 0.091
L58 33.10 0.019 38.07 29.89 29.26 0.979 0.141
Average 25.15 0.030 30.38 24.24 29.07 1.226 0.178
s 4.573 5.82E-03 4.567 3.500 0.453 0.149 0.116
CV, % 18.18 19.57 15.03 14.44 1.56 12.16 65.30
J77 28.65 0.050
B75 28.83 0.089
K43 29.09 0.084
H59 29.27 0.136
N53 29.89 0.032
Average 29.15 0.078
s 0.478 0.040
CV, % 1.64 51.23
Average 29.11 0.128
s 0.441 0.097
CV, % 1.51 75.99
NON-INSTRUMENTED
TESTS
Lab/Date KV /W t
LNE
(all)
NON-INSTRUMENTED
TESTS
LNE
(5/21/14)
1AD
NIST
(all)
LNE
(5/20/14)
NIST
(6/4/14)
NIST
(6/3/14)

21
Table 15 - Results of the tests performed on 5AB.
Charpy Specimen F gy C el Fm W t KV LE
lot id (kN) (mm/kN) (kN) (J) (J) (mm)
P33 19.41 0.024 29.04 145.70 127.72 0.877 1.630
C98 20.67 0.024 29.38 150.21 129.95 0.865 1.564
K77 21.81 0.021 28.75 151.03 129.31 0.856 1.538
G30 20.33 0.022 29.31 146.66 124.76 0.851 1.501
N19 26.30 0.019 29.09 149.83 127.03 0.848 1.519
Average 21.70 0.022 29.11 148.69 127.76 0.855 1.531
s 2.709 2.19E-03 0.249 2.353 2.045 0.012 0.050
CV, % 12.48 9.83 0.85 1.58 1.60 1.37 3.28
M74 128.82 1.509
E89 134.95 1.714
D14 127.56 1.552
L09 133.76 1.532
C37 129.15 1.673
Average 130.85 1.596
s 3.283 0.091
CV, % 2.51 5.73
Average 129.30 1.573
s 3.051 0.074
CV, % 2.36 4.68
J57 22.22 0.021 28.01 130.71 117.64 0.900 1.570
F33 21.23 0.021 27.61 129.07 122.38 0.948 1.429
K08 22.11 0.022 27.97 143.47 130.80 0.912 1.560
N55 21.70 0.021 27.66 130.73 119.25 0.912 1.577
G71 21.08 0.022 27.47 132.90 122.76 0.924 1.480
Average 21.67 0.021 27.74 133.38 122.57 0.919 1.523
s 0.510 4.12E-04 0.236 5.804 5.078 0.018 0.066
CV, % 2.35 1.94 0.85 4.35 4.14 1.99 4.30
I14 121.93 1.454
B15 122.59 1.557
N73 119.09 1.469
D60 116.24 1.503
P95 125.81 1.486
Average 121.13 1.494
s 3.631 0.040
CV, % 3.00 2.66
Average 121.85 1.509
s 4.230 0.053
CV, % 3.47 3.54
KV /W t
NON-INSTRUMENTED
TESTS
NIST
(6/4/14)
NON-INSTRUMENTED
TESTS
LNE
(5/21/14)
NIST
(all)
LNE
(all)
NIST
(6/3/14)
5AB
LNE
(5/20/14)
Lab/Date

22
Table 16 - Results of the tests performed on 9E.
The average values of KV, LE and Fm obtained in the four testing rounds are compared in
Figure 15 to Figure 21. For absorbed energy, Figure 15 to Figure 17 also indicate the certified values
of KV and the acceptability limits in accordance with ISO 148:2, i.e., ± 4 J (below 40 J) and ± 15
% (above 40 J). Comparisons between selected instrumented curves from tests performed at LNE
and NIST are given in Figure 22 (1AD), Figure 23 (5AB), and Figure 24 (9E).
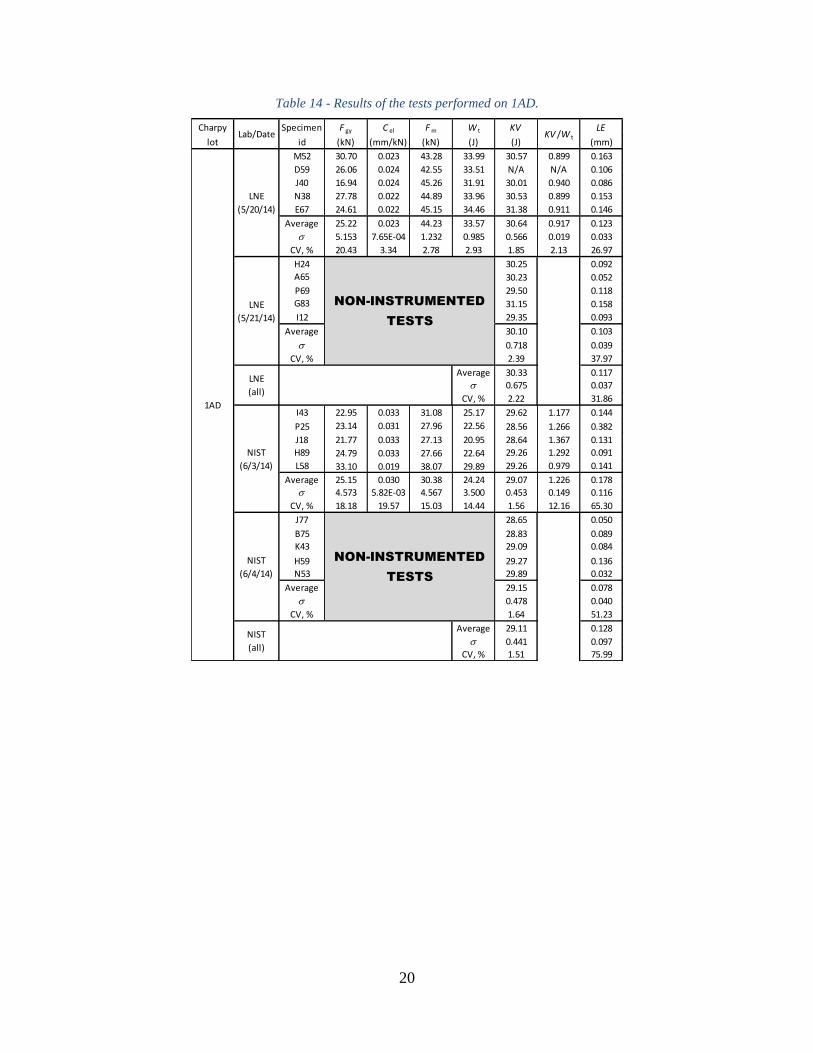
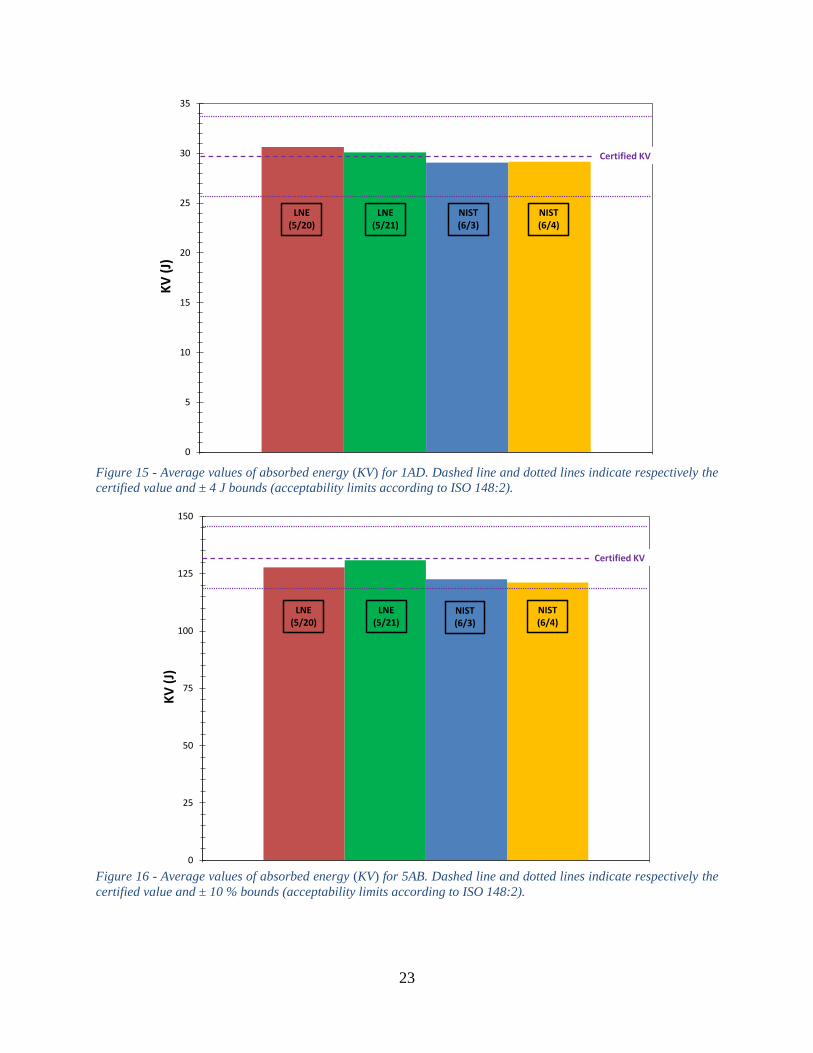
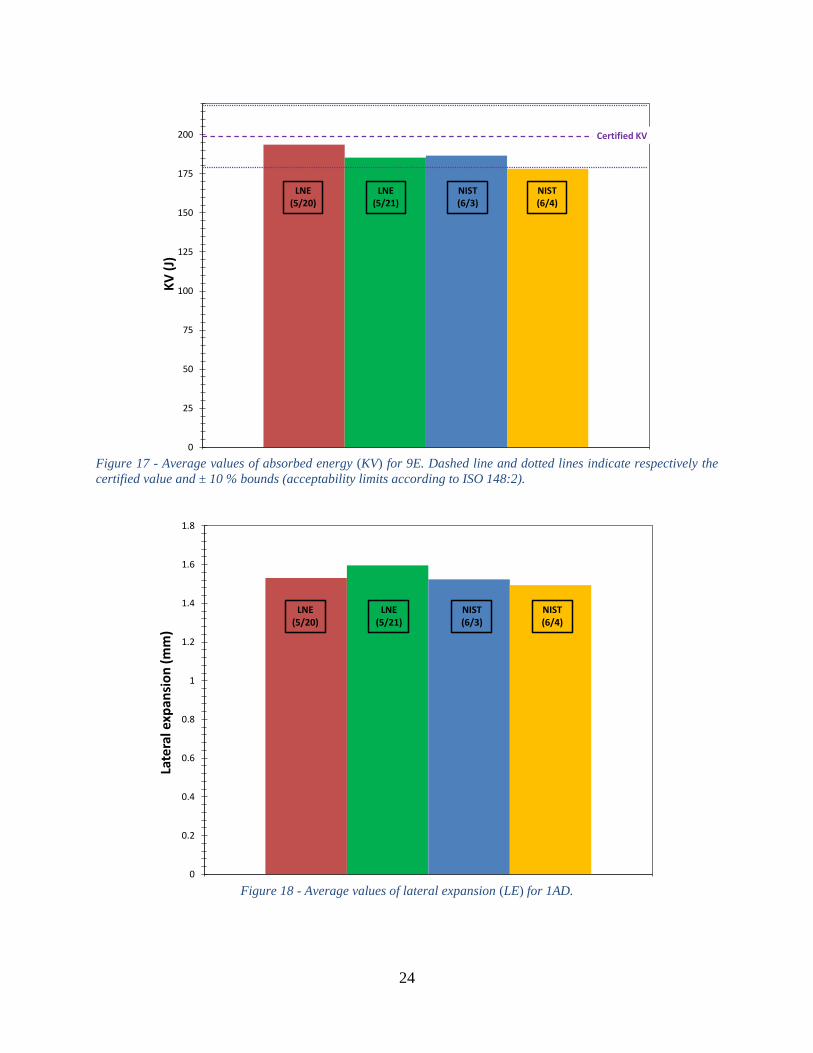
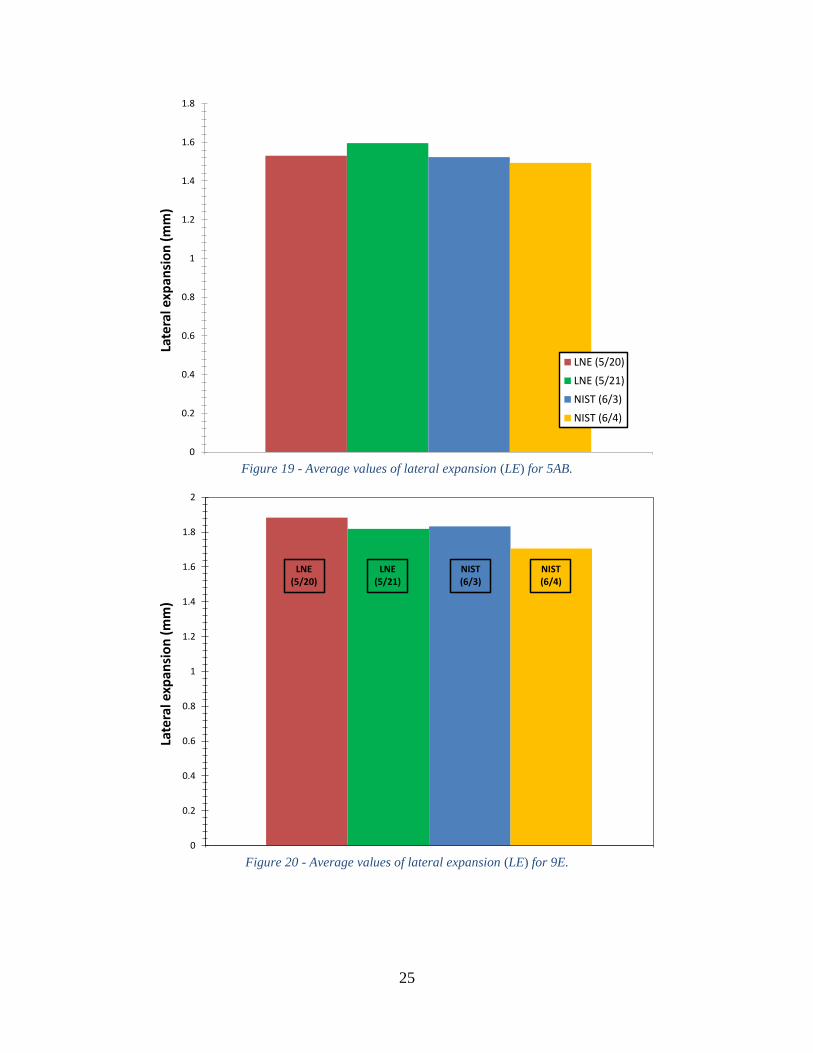
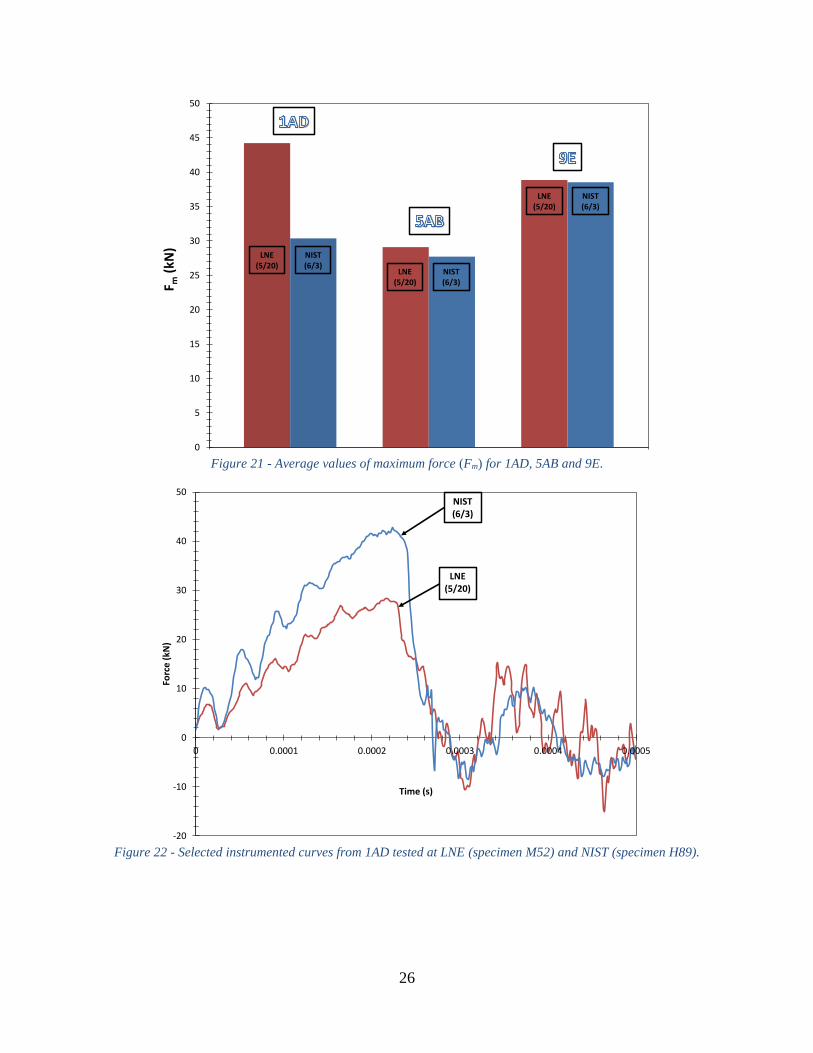
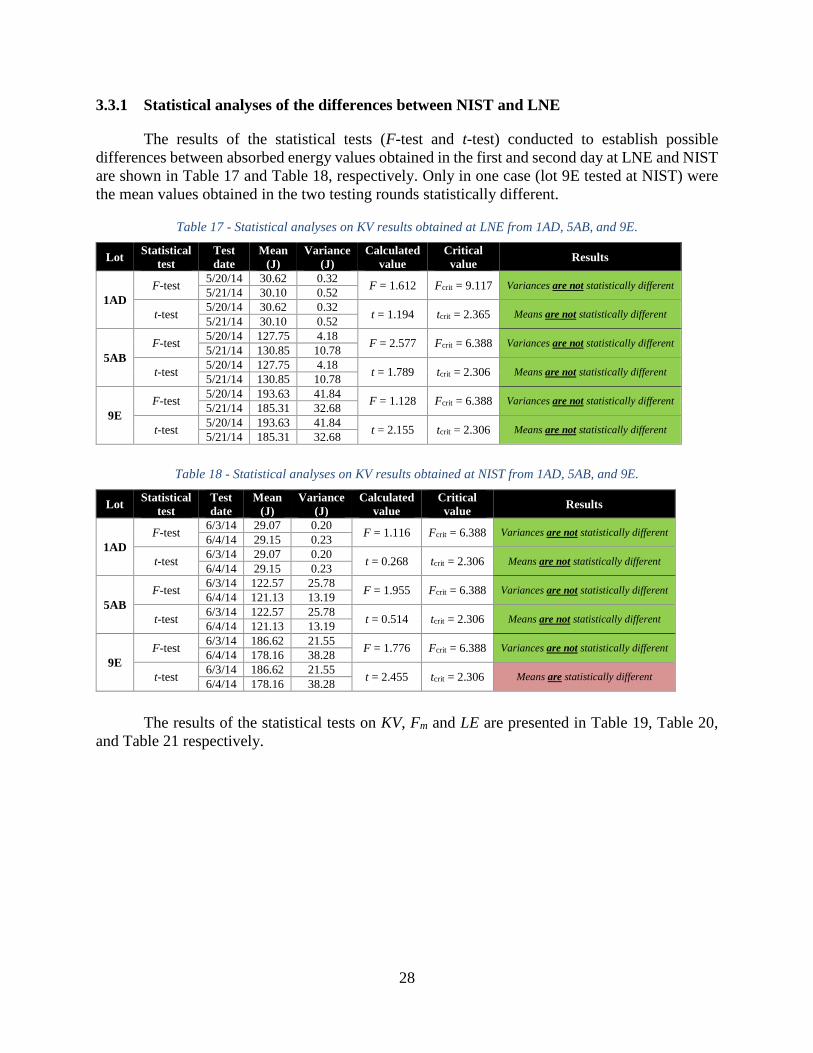
Although clear and consistent trends are not visible, a general tendency is observed for
average values obtained at LNE to be higher than average values obtained at NIST. The largest
discrepancy can be noted for Fm values measured on 1AD (see Figure 21 and Figure 22).
J36 26.86 0.023 39.63 225.66 197.32 0.874 2.126
M33 29.69 0.020 38.87 222.14 191.85 0.864 1.837
L56 32.15 0.021 38.85 202.47 185.33 0.915 1.949
H52 27.55 0.021 38.72 225.92 202.36 0.896 1.841
B55 25.24 0.021 38.32 197.86 191.29 0.967 1.905
Average 28.30 0.021 38.88 214.81 193.63 0.910 1.883
s 2.681 9.63E-04 0.475 13.550 6.468 0.041 0.118
CV, % 9.47 4.54 1.22 6.31 3.34 4.48 6.28
H70 192.49 1.720
F41 184.58 1.857
K28 179.84 1.822
M61 179.91 1.837
I01 189.73 1.857
Average 185.31 1.819
s 5.716 0.057
CV, % 3.08 3.14
Average 189.47 1.875
s 7.235 0.106
CV, % 3.82 5.65
I34 29.60 0.023 38.36 198.95 182.91 0.919 1.717
J69 29.97 0.024 38.21 210.43 186.18 0.885 1.752
M19 29.46 0.024 38.65 215.42 194.39 0.902 1.781
A33 29.47 0.023 38.68 209.96 186.45 0.888 2.015
C43 29.54 0.024 38.82 206.66 183.18 0.886 1.901
Average 29.61 0.024 38.54 208.28 186.62 0.890 1.833
s 0.210 6.31E-04 0.251 6.085 4.642 0.015 0.123
CV, % 0.71 2.64 0.65 2.92 2.49 1.66 6.71
G08 173.59 1.421
F51 177.63 1.583
B15 187.02 1.924
A45 181.11 1.984
C81 171.47 1.617
Average 178.16 1.706
s 6.187 0.239
CV, % 3.47 14.03
Average 182.39 1.770
s 6.816 0.192
CV, % 3.74 10.82
NON-INSTRUMENTED
TESTS
LNE
(all)
LNE
(5/20/14)
LNE
(5/21/14)
NON-INSTRUMENTED
TESTS
NIST
(all)
9E
NIST
(6/3/14)
NIST
(6/4/14)
23
Figure 15 - Average values of absorbed energy (KV) for 1AD. Dashed line and dotted lines indicate respectively the
certified value and ± 4 J bounds (acceptability limits according to ISO 148:2).
Figure 16 - Average values of absorbed energy (KV) for 5AB. Dashed line and dotted lines indicate respectively the
certified value and ± 10 % bounds (acceptability limits according to ISO 148:2).
0
5
10
15
20
25
30
35
KV
(J)
Certified KV
LNE(5/20)
NIST(6/3)
LNE(5/21)
NIST(6/4)
0
25
50
75
100
125
150
KV
(J)
Certified KV
LNE(5/20)
NIST(6/3)
LNE(5/21)
NIST(6/4)
24
Figure 17 - Average values of absorbed energy (KV) for 9E. Dashed line and dotted lines indicate respectively the
certified value and ± 10 % bounds (acceptability limits according to ISO 148:2).
Figure 18 - Average values of lateral expansion (LE) for 1AD.
0
25
50
75
100
125
150
175
200
KV
(J)
Certified KV
LNE(5/20)
NIST(6/3)
LNE(5/21)
NIST(6/4)
0
0.2
0.4
0.6
0.8
1
1.2
1.4
1.6
1.8
Late
ral e
xpan
sio
n (
mm
)
LNE(5/20)
NIST(6/3)
LNE(5/21)
NIST(6/4)
25
Figure 19 - Average values of lateral expansion (LE) for 5AB.
Figure 20 - Average values of lateral expansion (LE) for 9E.
0
0.2
0.4
0.6
0.8
1
1.2
1.4
1.6
1.8
Late
ral e
xpan
sio
n (
mm
)
LNE (5/20)
LNE (5/21)
NIST (6/3)
NIST (6/4)
0
0.2
0.4
0.6
0.8
1
1.2
1.4
1.6
1.8
2
Late
ral e
xpan
sio
n (
mm
)
LNE(5/20)
NIST(6/3)
LNE(5/21)
NIST(6/4)
26
Figure 21 - Average values of maximum force (Fm) for 1AD, 5AB and 9E.
Figure 22 - Selected instrumented curves from 1AD tested at LNE (specimen M52) and NIST (specimen H89).
0
5
10
15
20
25
30
35
40
45
50
F m(k
N)
LNE(5/20)
NIST(6/3)
LNE(5/20)
NIST(6/3)
LNE(5/20)
NIST(6/3)
-20
-10
0
10
20
30
40
50
0 0.0001 0.0002 0.0003 0.0004 0.0005
Forc
e (
kN)
Time (s)
NIST(6/3)
LNE(5/20)

27
Figure 23 - Selected instrumented curves from 5AB tested at LNE (specimen P33) and NIST (specimen G71).
NOTE: the shape of the LNE test record indicates a malfunction of the acquisition system.
Figure 24 - Selected instrumented curves from 9E tested at LNE (specimen M33) and NIST (specimen A33).
-5
0
5
10
15
20
25
30
35
0 0.0005 0.001 0.0015 0.002 0.0025 0.003
Forc
e (
kN)
Time (s)
NIST(6/3)
LNE(5/20)
-5
0
5
10
15
20
25
30
35
40
45
0 0.0005 0.001 0.0015 0.002 0.0025 0.003
Forc
e (
kN)
Time (s)
NIST(6/3)
LNE(5/20)
28
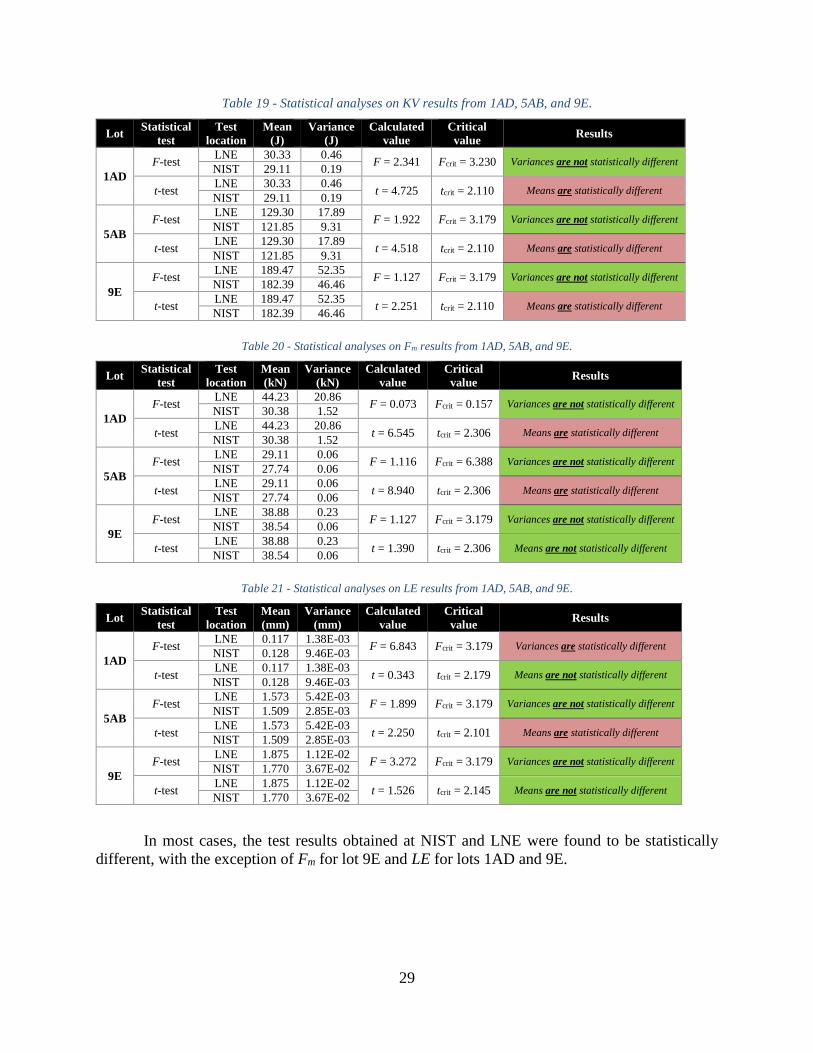
3.3.1 Statistical analyses of the differences between NIST and LNE
The results of the statistical tests (F-test and t-test) conducted to establish possible
differences between absorbed energy values obtained in the first and second day at LNE and NIST
are shown in Table 17 and Table 18, respectively. Only in one case (lot 9E tested at NIST) were
the mean values obtained in the two testing rounds statistically different.
Table 17 - Statistical analyses on KV results obtained at LNE from 1AD, 5AB, and 9E.
Lot Statistical
test
Test
date
Mean
(J)
Variance
(J)
Calculated
value
Critical
value Results
1AD
F-test 5/20/14 30.62 0.32
F = 1.612 Fcrit = 9.117 Variances are not statistically different 5/21/14 30.10 0.52
t-test 5/20/14 30.62 0.32
t = 1.194 tcrit = 2.365 Means are not statistically different 5/21/14 30.10 0.52
5AB
F-test 5/20/14 127.75 4.18
F = 2.577 Fcrit = 6.388 Variances are not statistically different 5/21/14 130.85 10.78
t-test 5/20/14 127.75 4.18
t = 1.789 tcrit = 2.306 Means are not statistically different 5/21/14 130.85 10.78
9E
F-test 5/20/14 193.63 41.84
F = 1.128 Fcrit = 6.388 Variances are not statistically different 5/21/14 185.31 32.68
t-test 5/20/14 193.63 41.84
t = 2.155 tcrit = 2.306 Means are not statistically different 5/21/14 185.31 32.68
Table 18 - Statistical analyses on KV results obtained at NIST from 1AD, 5AB, and 9E.
Lot Statistical
test
Test
date
Mean
(J)
Variance
(J)
Calculated
value
Critical
value Results
1AD
F-test 6/3/14 29.07 0.20
F = 1.116 Fcrit = 6.388 Variances are not statistically different 6/4/14 29.15 0.23
t-test 6/3/14 29.07 0.20
t = 0.268 tcrit = 2.306 Means are not statistically different 6/4/14 29.15 0.23
5AB
F-test 6/3/14 122.57 25.78
F = 1.955 Fcrit = 6.388 Variances are not statistically different 6/4/14 121.13 13.19
t-test 6/3/14 122.57 25.78
t = 0.514 tcrit = 2.306 Means are not statistically different 6/4/14 121.13 13.19
9E
F-test 6/3/14 186.62 21.55
F = 1.776 Fcrit = 6.388 Variances are not statistically different 6/4/14 178.16 38.28
t-test 6/3/14 186.62 21.55
t = 2.455 tcrit = 2.306 Means are statistically different 6/4/14 178.16 38.28
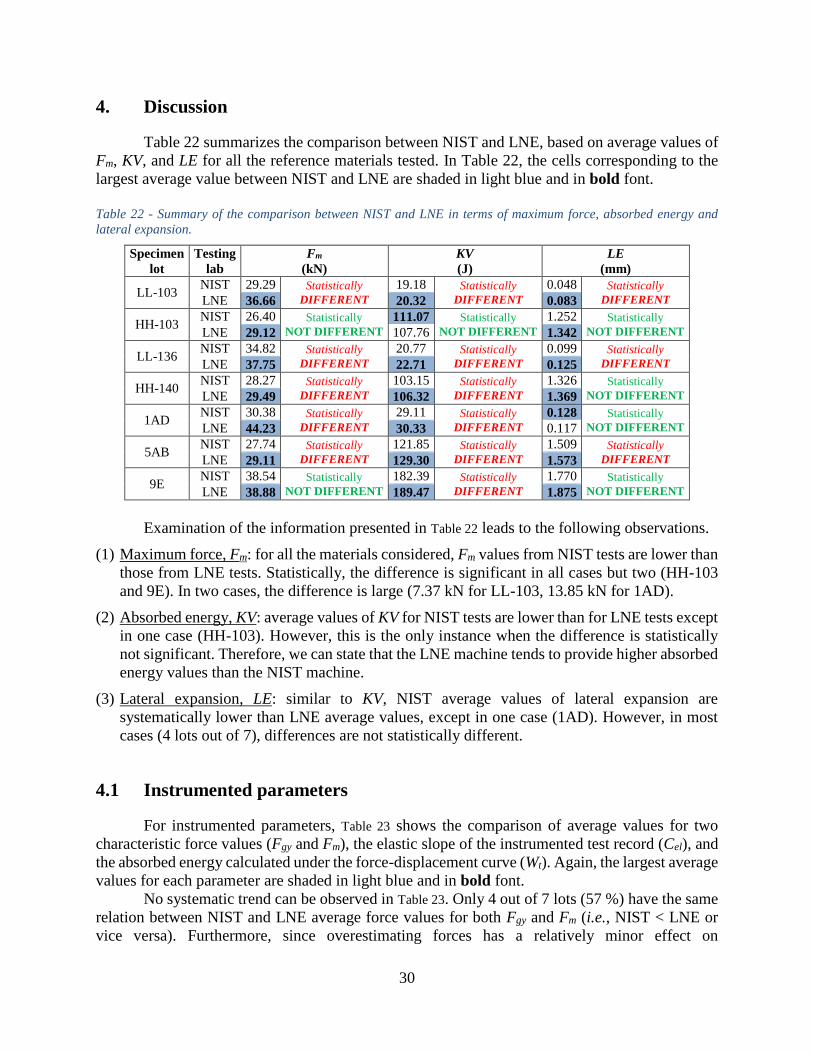
The results of the statistical tests on KV, Fm and LE are presented in Table 19, Table 20,
and Table 21 respectively.
29
Table 19 - Statistical analyses on KV results from 1AD, 5AB, and 9E.
Lot Statistical
test
Test
location
Mean
(J)
Variance
(J)
Calculated
value
Critical
value Results
1AD
F-test LNE 30.33 0.46
F = 2.341 Fcrit = 3.230 Variances are not statistically different NIST 29.11 0.19
t-test LNE 30.33 0.46
t = 4.725 tcrit = 2.110 Means are statistically different NIST 29.11 0.19
5AB
F-test LNE 129.30 17.89
F = 1.922 Fcrit = 3.179 Variances are not statistically different NIST 121.85 9.31
t-test LNE 129.30 17.89
t = 4.518 tcrit = 2.110 Means are statistically different NIST 121.85 9.31
9E
F-test LNE 189.47 52.35
F = 1.127 Fcrit = 3.179 Variances are not statistically different NIST 182.39 46.46
t-test LNE 189.47 52.35
t = 2.251 tcrit = 2.110 Means are statistically different NIST 182.39 46.46
Table 20 - Statistical analyses on Fm results from 1AD, 5AB, and 9E.
Lot Statistical
test
Test
location
Mean
(kN)
Variance
(kN)
Calculated
value
Critical
value Results
1AD
F-test LNE 44.23 20.86
F = 0.073 Fcrit = 0.157 Variances are not statistically different NIST 30.38 1.52
t-test LNE 44.23 20.86
t = 6.545 tcrit = 2.306 Means are statistically different NIST 30.38 1.52
5AB
F-test LNE 29.11 0.06
F = 1.116 Fcrit = 6.388 Variances are not statistically different NIST 27.74 0.06
t-test LNE 29.11 0.06
t = 8.940 tcrit = 2.306 Means are statistically different NIST 27.74 0.06
9E
F-test LNE 38.88 0.23
F = 1.127 Fcrit = 3.179 Variances are not statistically different NIST 38.54 0.06
t-test LNE 38.88 0.23
t = 1.390 tcrit = 2.306 Means are not statistically different NIST 38.54 0.06
Table 21 - Statistical analyses on LE results from 1AD, 5AB, and 9E.
Lot Statistical
test
Test
location
Mean
(mm)
Variance
(mm)
Calculated
value
Critical
value Results
1AD
F-test LNE 0.117 1.38E-03
F = 6.843 Fcrit = 3.179 Variances are statistically different NIST 0.128 9.46E-03
t-test LNE 0.117 1.38E-03
t = 0.343 tcrit = 2.179 Means are not statistically different NIST 0.128 9.46E-03
5AB
F-test LNE 1.573 5.42E-03
F = 1.899 Fcrit = 3.179 Variances are not statistically different NIST 1.509 2.85E-03
t-test LNE 1.573 5.42E-03
t = 2.250 tcrit = 2.101 Means are statistically different NIST 1.509 2.85E-03
9E
F-test LNE 1.875 1.12E-02
F = 3.272 Fcrit = 3.179 Variances are not statistically different NIST 1.770 3.67E-02
t-test LNE 1.875 1.12E-02
t = 1.526 tcrit = 2.145 Means are not statistically different NIST 1.770 3.67E-02
In most cases, the test results obtained at NIST and LNE were found to be statistically
different, with the exception of Fm for lot 9E and LE for lots 1AD and 9E.
30
4. Discussion
Table 22 summarizes the comparison between NIST and LNE, based on average values of
Fm, KV, and LE for all the reference materials tested. In Table 22, the cells corresponding to the
largest average value between NIST and LNE are shaded in light blue and in bold font.
Table 22 - Summary of the comparison between NIST and LNE in terms of maximum force, absorbed energy and
lateral expansion.
Specimen
lot
Testing
lab
Fm
(kN)
KV
(J)
LE
(mm)
LL-103 NIST 29.29 Statistically
DIFFERENT 19.18 Statistically
DIFFERENT 0.048 Statistically
DIFFERENT LNE 36.66 20.32 0.083
HH-103 NIST 26.40 Statistically
NOT DIFFERENT 111.07 Statistically
NOT DIFFERENT 1.252 Statistically
NOT DIFFERENT LNE 29.12 107.76 1.342
LL-136 NIST 34.82 Statistically
DIFFERENT 20.77 Statistically
DIFFERENT 0.099 Statistically
DIFFERENT LNE 37.75 22.71 0.125
HH-140 NIST 28.27 Statistically
DIFFERENT 103.15 Statistically
DIFFERENT 1.326 Statistically
NOT DIFFERENT LNE 29.49 106.32 1.369
1AD NIST 30.38 Statistically
DIFFERENT 29.11 Statistically
DIFFERENT 0.128 Statistically
NOT DIFFERENT LNE 44.23 30.33 0.117
5AB NIST 27.74 Statistically
DIFFERENT 121.85 Statistically
DIFFERENT 1.509 Statistically
DIFFERENT LNE 29.11 129.30 1.573
9E NIST 38.54 Statistically
NOT DIFFERENT 182.39 Statistically
DIFFERENT 1.770 Statistically
NOT DIFFERENT LNE 38.88 189.47 1.875
Examination of the information presented in Table 22 leads to the following observations.
(1) Maximum force, Fm: for all the materials considered, Fm values from NIST tests are lower than
those from LNE tests. Statistically, the difference is significant in all cases but two (HH-103
and 9E). In two cases, the difference is large (7.37 kN for LL-103, 13.85 kN for 1AD).
(2) Absorbed energy, KV: average values of KV for NIST tests are lower than for LNE tests except
in one case (HH-103). However, this is the only instance when the difference is statistically
not significant. Therefore, we can state that the LNE machine tends to provide higher absorbed
energy values than the NIST machine.
(3) Lateral expansion, LE: similar to KV, NIST average values of lateral expansion are
systematically lower than LNE average values, except in one case (1AD). However, in most
cases (4 lots out of 7), differences are not statistically different.
4.1 Instrumented parameters
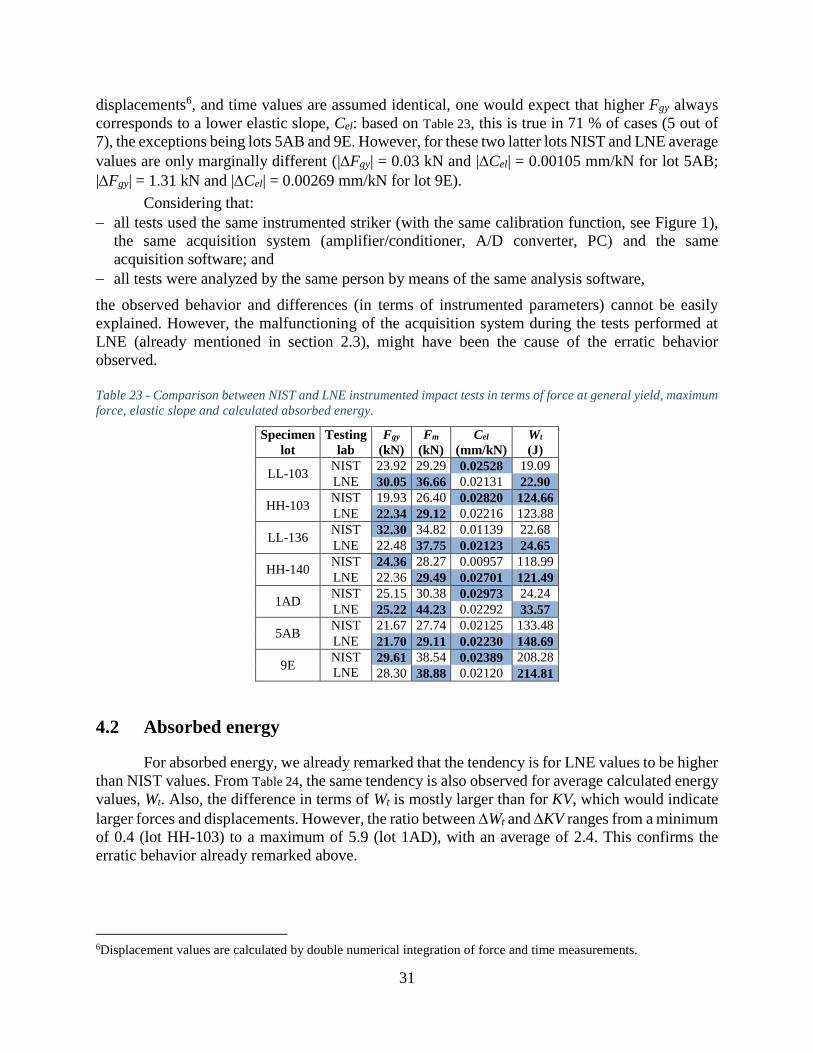
For instrumented parameters, Table 23 shows the comparison of average values for two
characteristic force values (Fgy and Fm), the elastic slope of the instrumented test record (Cel), and
the absorbed energy calculated under the force-displacement curve (Wt). Again, the largest average
values for each parameter are shaded in light blue and in bold font.
No systematic trend can be observed in Table 23. Only 4 out of 7 lots (57 %) have the same
relation between NIST and LNE average force values for both Fgy and Fm (i.e., NIST < LNE or
vice versa). Furthermore, since overestimating forces has a relatively minor effect on
31
displacements6, and time values are assumed identical, one would expect that higher Fgy always
corresponds to a lower elastic slope, Cel: based on Table 23, this is true in 71 % of cases (5 out of
7), the exceptions being lots 5AB and 9E. However, for these two latter lots NIST and LNE average
values are only marginally different (|Fgy| = 0.03 kN and |Cel| = 0.00105 mm/kN for lot 5AB;
|Fgy| = 1.31 kN and |Cel| = 0.00269 mm/kN for lot 9E).
Considering that:
all tests used the same instrumented striker (with the same calibration function, see Figure 1),
the same acquisition system (amplifier/conditioner, A/D converter, PC) and the same
acquisition software; and
all tests were analyzed by the same person by means of the same analysis software,
the observed behavior and differences (in terms of instrumented parameters) cannot be easily
explained. However, the malfunctioning of the acquisition system during the tests performed at
LNE (already mentioned in section 2.3), might have been the cause of the erratic behavior
observed.
Table 23 - Comparison between NIST and LNE instrumented impact tests in terms of force at general yield, maximum
force, elastic slope and calculated absorbed energy.
Specimen
lot
Testing
lab
Fgy
(kN)
Fm
(kN)
Cel
(mm/kN)
Wt
(J)
LL-103 NIST 23.92 29.29 0.02528 19.09
LNE 30.05 36.66 0.02131 22.90
HH-103 NIST 19.93 26.40 0.02820 124.66
LNE 22.34 29.12 0.02216 123.88
LL-136 NIST 32.30 34.82 0.01139 22.68
LNE 22.48 37.75 0.02123 24.65
HH-140 NIST 24.36 28.27 0.00957 118.99
LNE 22.36 29.49 0.02701 121.49
1AD NIST 25.15 30.38 0.02973 24.24
LNE 25.22 44.23 0.02292 33.57
5AB NIST 21.67 27.74 0.02125 133.48
LNE 21.70 29.11 0.02230 148.69
9E NIST
LNE 29.61 38.54 0.02389 208.28
28.30 38.88 0.02120 214.81
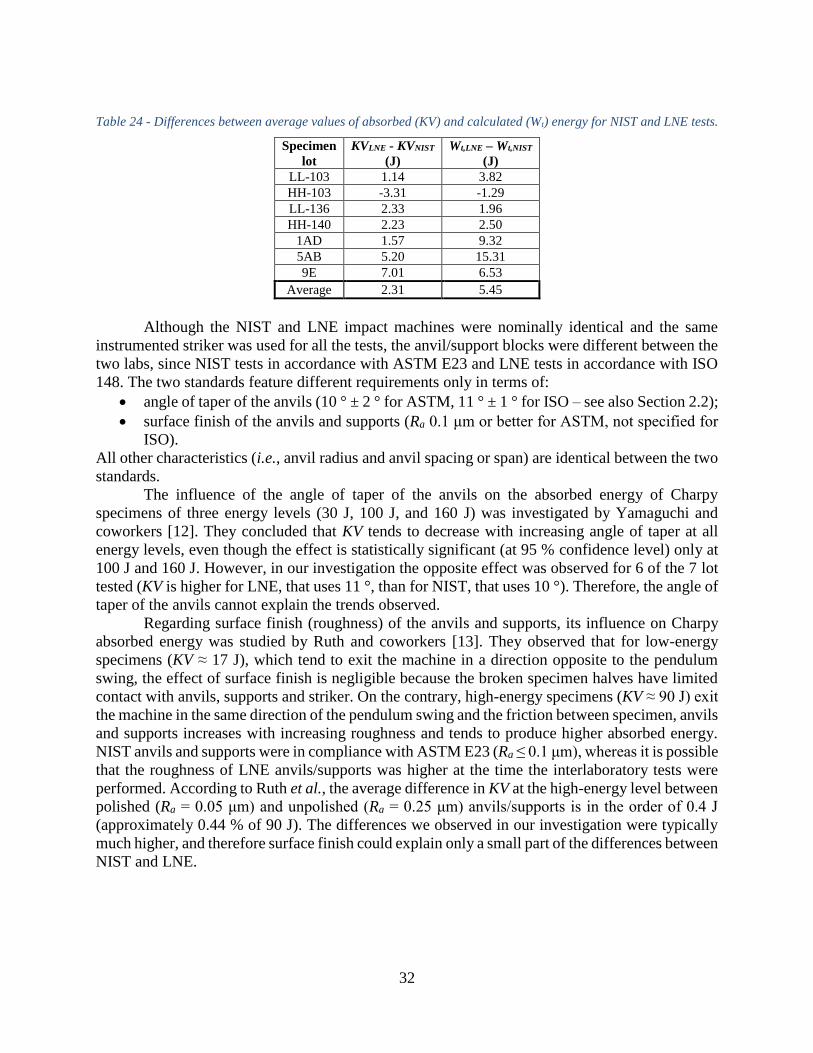
4.2 Absorbed energy
For absorbed energy, we already remarked that the tendency is for LNE values to be higher
than NIST values. From Table 24, the same tendency is also observed for average calculated energy
values, Wt. Also, the difference in terms of Wt is mostly larger than for KV, which would indicate
larger forces and displacements. However, the ratio between Wt and KV ranges from a minimum
of 0.4 (lot HH-103) to a maximum of 5.9 (lot 1AD), with an average of 2.4. This confirms the
erratic behavior already remarked above.
6Displacement values are calculated by double numerical integration of force and time measurements.
32
Table 24 - Differences between average values of absorbed (KV) and calculated (Wt) energy for NIST and LNE tests.
Specimen
lot
KVLNE - KVNIST
(J)
Wt,LNE – Wt,NIST
(J)
LL-103 1.14 3.82
HH-103 -3.31 -1.29
LL-136 2.33 1.96
HH-140 2.23 2.50
1AD 1.57 9.32
5AB 5.20 15.31
9E 7.01 6.53
Average 2.31 5.45
Although the NIST and LNE impact machines were nominally identical and the same
instrumented striker was used for all the tests, the anvil/support blocks were different between the
two labs, since NIST tests in accordance with ASTM E23 and LNE tests in accordance with ISO
148. The two standards feature different requirements only in terms of:
angle of taper of the anvils (10 ° ± 2 ° for ASTM, 11 ° ± 1 ° for ISO – see also Section 2.2);
surface finish of the anvils and supports (Ra 0.1 μm or better for ASTM, not specified for
ISO).
All other characteristics (i.e., anvil radius and anvil spacing or span) are identical between the two
standards.
The influence of the angle of taper of the anvils on the absorbed energy of Charpy
specimens of three energy levels (30 J, 100 J, and 160 J) was investigated by Yamaguchi and
coworkers [12]. They concluded that KV tends to decrease with increasing angle of taper at all
energy levels, even though the effect is statistically significant (at 95 % confidence level) only at
100 J and 160 J. However, in our investigation the opposite effect was observed for 6 of the 7 lot
tested (KV is higher for LNE, that uses 11 °, than for NIST, that uses 10 °). Therefore, the angle of
taper of the anvils cannot explain the trends observed.
Regarding surface finish (roughness) of the anvils and supports, its influence on Charpy
absorbed energy was studied by Ruth and coworkers [13]. They observed that for low-energy
specimens (KV ≈ 17 J), which tend to exit the machine in a direction opposite to the pendulum
swing, the effect of surface finish is negligible because the broken specimen halves have limited
contact with anvils, supports and striker. On the contrary, high-energy specimens (KV ≈ 90 J) exit
the machine in the same direction of the pendulum swing and the friction between specimen, anvils
and supports increases with increasing roughness and tends to produce higher absorbed energy.
NIST anvils and supports were in compliance with ASTM E23 (Ra ≤ 0.1 μm), whereas it is possible
that the roughness of LNE anvils/supports was higher at the time the interlaboratory tests were
performed. According to Ruth et al., the average difference in KV at the high-energy level between
polished (Ra = 0.05 μm) and unpolished (Ra = 0.25 μm) anvils/supports is in the order of 0.4 J
(approximately 0.44 % of 90 J). The differences we observed in our investigation were typically
much higher, and therefore surface finish could explain only a small part of the differences between
NIST and LNE.
33
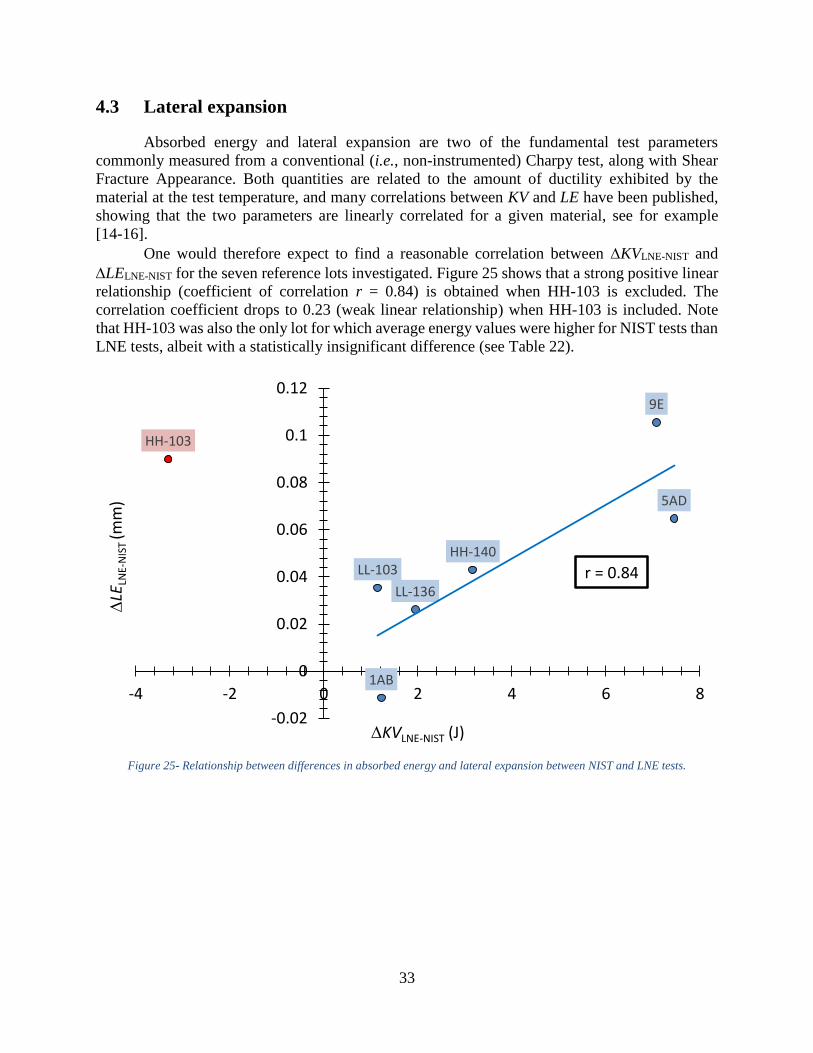
4.3 Lateral expansion
Absorbed energy and lateral expansion are two of the fundamental test parameters
commonly measured from a conventional (i.e., non-instrumented) Charpy test, along with Shear
Fracture Appearance. Both quantities are related to the amount of ductility exhibited by the
material at the test temperature, and many correlations between KV and LE have been published,
showing that the two parameters are linearly correlated for a given material, see for example
[14-16].
One would therefore expect to find a reasonable correlation between KVLNE-NIST and
LELNE-NIST for the seven reference lots investigated. Figure 25 shows that a strong positive linear
relationship (coefficient of correlation r = 0.84) is obtained when HH-103 is excluded. The
correlation coefficient drops to 0.23 (weak linear relationship) when HH-103 is included. Note
that HH-103 was also the only lot for which average energy values were higher for NIST tests than
LNE tests, albeit with a statistically insignificant difference (see Table 22).
Figure 25- Relationship between differences in absorbed energy and lateral expansion between NIST and LNE tests.
LL-136
HH-140
1AB
5AD
9E
LL-103
HH-103
-0.02
0
0.02
0.04
0.06
0.08
0.1
0.12
-4 -2 0 2 4 6 8
LE
LNE-
NIS
T (m
m)
KVLNE-NIST (J)
r = 0.84
34
5. Conclusions
In the framework of a collaborative effort aimed at establishing an international scale for
instrumented impact testing, NIST and Laboratoire National de métrologie et d’Essai (LNE,
France) performed instrumented Charpy tests on seven certified reference materials, produced by
both institutes. The tests were carried out at both locations (Boulder, Colorado and Trappes,
France) on two nominally identical impact machines equipped with the same instrumented striker
and the same signal conditioning and acquisition system.
The results from the tests performed at NIST and LNE were compared in terms of both
non-instrumented parameters (absorbed energy, KV, and lateral expansion, LE) and instrumented
parameters (maximum force, Fm, and calculated energy, Wt). The statistical significance of the
differences between average values obtained at NIST and LNE on each material was assessed by
means of the unpaired two-sample t-test.
While no significant difference was observed between tests performed on different days at
the same location, most of the differences between NIST and LNE in terms of Fm and KV were
found to be statistically significant at the 95 % confidence level. For all reference lots except
HH-103, for which results were not statistically different between the two institutes, tests
performed at LNE exhibit systematically higher maximum forces and higher absorbed energies.
This confirms results from previous intercomparisons, where LNE absorbed energies were found
to be systematically higher than NIST absorbed energies, even when striker, anvil and supports for
the LNE machine were in compliance with ASTM E23 [17]. The bias in terms of Wt showed a
similar trend, although the magnitude of the difference was typically larger than for KV. On the
other hand, measurements of lateral expansion were generally equivalent between NIST and LNE
and no specific trend was observed.
The source of the disagreement between the two sets of results is unclear. The difference
in the angle of taper of the anvils (10 ° for NIST, 11 ° for LNE) is unlikely to affect the results
significantly, and according to a published study, a larger taper angle should induce a decrease,
rather than an increase of absorbed energy. In addition, a possible difference in the surface finish
of machine anvils and supports might be invoked, considering that the LNE machine complies
with ISO 148, which does not require a specific surface finish, whereas NIST complies with ASTM
E23, which prescribes a surface finish of 0.1 μm or better. Rougher anvils and supports cause more
energy dissipation due to greater friction for ductile specimens that exit the machine in the same
direction of the pendulum swing. This factor, however, appears insufficient to fully explain the
observed bias. Furthermore, for 3 of the 7 lots investigated (low-energy specimens), friction is not
expected to play any role.
Even though the reasons of the observed differences are not apparent, some discrepancies
between Charpy results from different reference specimen producers have already been reported
[17]. The results presented here reinforce the need for further collaborations among National
Institutes, with the aim of establishing an international scale for instrumented Charpy testing.
35
References
[1] “Pendulum Impact Testing – A Century of Progress,” ASTM STP 1380, T. A. Siewert and
M. P. Manahan, Eds., American Society for Testing and Materials, West Conshohocken,
PA., 2000.
[2] “From Charpy to Present Impact Testing,” ESIS Publication 30, D. François and A. Pineau,
Eds., Elsevier, 2002.
[3] ASTM E23, “Standard Test Methods for Notched Bar Impact Testing of Metallic Materials,”
ASTM Book of Standards 03.01.
[4] ISO 148-1, “Metallic materials – Charpy pendulum impact test – Part 1: Test method,”
International Standards Organization, Geneva (Switzerland).
[5] M. P. Manahan and T. A. Siewert, “The History of Instrumented Impact Testing,” Journal of
ASTM International, Vol. 3, Issue 2, February 2006.
[6] F. Korber and A. A. Storp, “On the Force Progress during Impact Testing,” Mittelugen aus
dem Kaiser Wilhelm Institut für Eisenforschung, Vol. 8, 1926, p. 8.
[7] ISO 14556, “Steel — Charpy V-notch pendulum impact test — Instrumented test method,”
International Standards Organization, Geneva (Switzerland).
[8] ASTM E2298, “Standard Test Method for Instrumented Impact Testing of Metallic
Materials,” ASTM Book of Standards 03.01.
[9] Bureau International des Poids et Mesures, Key and supplementary comparisons,
SIM.M.F-S3, “Comparison of Instrumented Charpy Tests,” 2012-2013, Report in progress,
Draft B.
[10] ISO 148-2, “Metallic materials – Charpy pendulum impact test – Part 2: Verification of
testing machines,” International Standards Organization, Geneva (Switzerland).
[11] J. Y. Zhang, “Confidence interval and the Student's t-test,” at
http://projectile.sv.cmu.edu/research/public/talks/t-test.htm#types, retrieved 12/3/2014.
[12] Y. Yamaguchi, S. Takagi, and H. Nakano, “Effects of Anvil Configurations on Absorbed
Energy,” in “Pendulum Impact Testing – A Century of Progress,” ASTM STP 1380, T. A.
Siewert and M. P. Manahan, Eds., American Society for Testing and Materials, West
Conshohocken, PA., 2000, pp. 164-180.
[13] E. A. Ruth, D. P. Vigliotti, and T. A. Siewert, “Effect of Surface Finish of Charpy Anvils and
Striking Bits on Absorbed Energy,” in “Pendulum Impact Machines – Procedures and
Specimens for Verification,” ASTM STP 1248, T. A. Siewert and A. K. Schmieder, Eds.,
American Society for Testing and Materials, Philadelphia, PA., 1995, pp. 164-180.
[14] R. K. Nanstad and M. A. Sokolov, “Charpy Impact Test Results on Five Materials and NIST
Verification Specimens Using Instrumented 2-mm and 8-mm Strikers,” in “Pendulum Impact
Machines – Procedures and Specimens for Verification,” ASTM STP 1248, T. A. Siewert
and A. K. Schmieder, Eds., American Society for Testing and Materials, Philadelphia, PA.,
1995, pp. 111-139.
[15] M. Tanaka, Y. Ohno, H. Horigome, H. Tani, K. Shiota, and A. Misawa, “Effects of the
Striking Edge Radius and Asymmetrical Strikes on Charpy Impact Test Results,” in
“Pendulum Impact Machines – Procedures and Specimens for Verification,” ASTM STP
1248, T. A. Siewert and A. K. Schmieder, Eds., American Society for Testing and Materials,
Philadelphia, PA., 1995, pp. 153-170.
36
[16] K. Wallin, T. Planman, and M. Valo, “Fracture Mechanics Based Scaling Criteria for
Miniature and Sub-Size Charpy-V Specimens,” in “From Charpy to Present Impact Testing,”
ESIS Publication 30, D. François and A. Pineau, Eds., Elsevier, 2002, pp. 279-288.
[17] C. McCowan, J. Pauwels, G. Revise, and H. Nakano, “International Comparison of Impact
Verification Programs,” in “Pendulum Impact Testing – A Century of Progress,” ASTM STP
1380, T. A. Siewert and M. P. Manahan, Eds., American Society for Testing and Materials,
West Conshohocken, PA., 2000, pp. 73-89.

![gtklogger: A Tool For Systematically Testing Graphical ... › nistpubs › TechnicalNotes › NIST.TN.1862.pdf · For our example, we use the GIMP Tool Kit (GTK) widget set [1],](https://static.fdocuments.in/doc/165x107/5f032bf37e708231d407e4ed/gtklogger-a-tool-for-systematically-testing-graphical-a-nistpubs-a-technicalnotes.jpg)