ERP Systems Drive
8
IBM GLOBAL BUSINESS SERVICES Financial management Benchmarking Brief 1 Enterprise Resource Planning Syst ems dr ive cost reduction and ef ficienc y in Finance and Accounting Operations Benchmark data quantifies the value of integra ted software app lications The basis for increasing performance Organizations operating in today’s increasingl y volatile and uncertain glob- al business climate are more dependent than ever on effectively partnering with the Finance organi zation to successfu lly navigate this complex envi- ronment. Over the years, Finance organizations have played an increasing role in developing enterprise strategy and helping achieve tactical objectives to improve operational performance, drive cost reduction, identify new rev- enue opportunities and forecast future performance. Increasing demands for this type of support have necessitated that Finance transform itself to become more efficient, and in so doing, free up resources – from traditional accounting transaction activities to more resources dedicated to decision support. Findings from the 2010 IBM Global CFO Study, with over 1,900 partici- pating senior Finance executives, support the notion that adopting a com- mon financial system drives better value, scalability, efficiency and controls. 1 The CFO Study found that a m ain driver of Financ e function efficiency, particularly in accounting transaction processing and operations, is the adoption of common process and data standards. The study found that this can be achieved by addressing three key change enablers: 1. A common ledger and accounting transacti on applicati ons that e nable and sustain common processes and data 2. An enter prise-wide s ervice deliver y model for transact ional activi ties, in the form of shared services, outsourcing or a hybrid combination 2 3. Global process ownership, which is an essential prerequisite for the transformation to common processes and data. Overview An analysis of da ta fr om 1,20 0 benchmarking study participants quantifies the benefits an organization can gain through the use of enterprise resource planning systems (ERPs). Benchmarking data shows that Finance organizations that have adopted ERPs experienced as much as 300 percent material improvements in efficiency, and as much as 65 percent reduction in costs associated with performing Finance and Accou nting operatio ns. IBM Institute for Business V alue
-
Upload
alexander-sergeyevich-korovin -
Category
Documents
-
view
221 -
download
0
Transcript of ERP Systems Drive
8132019 ERP Systems Drive
httpslidepdfcomreaderfullerp-systems-drive 18
IBM GLOBAL BUSINESS SERVICES Financial management
Benchmarking Brief
1
Enterprise Resource Planning
Systems drive cost reductionand efficiency in Finance and Accounting Operations
Benchmark data quantifies the value of integrated software applications
The basis for increasing performanceOrganizations operating in todayrsquos increasingly volatile and uncertain glob-
al business climate are more dependent than ever on effectively partnering with the Finance organization to successfully navigate this complex envi-
ronment Over the years Finance organizations have played an increasing
role in developing enterprise strategy and helping achieve tactical objectives
to improve operational performance drive cost reduction identify new rev-
enue opportunities and forecast future performance Increasing demands
for this type of support have necessitated that Finance transform itself to
become more efficient and in so doing free up resources ndash from traditional
accounting transaction activities to more resources dedicated to decision
support
Findings from the 2010 IBM Global CFO Study with over 1900 partici-
pating senior Finance executives support the notion that adopting a com-mon financial system drives better value scalability efficiency and controls 1
The CFO Study found that a main driver of Finance function efficiency
particularly in accounting transaction processing and operations is the
adoption of common process and data standards The study found that this
can be achieved by addressing three key change enablers
1 A common ledger and accounting transaction applications that enable
and sustain common processes and data
2 An enterprise-wide service delivery model for transactional activities
in the form of shared services outsourcing or a hybrid combination2
3 Global process ownership which is an essential prerequisite for the
transformation to common processes and data
Overview
An analysis of data from 1200
benchmarking study participants
quantifies the benefits an organization
can gain through the use of enterprise
resource planning systems (ERPs)
Benchmarking data shows that Finance
organizations that have adopted ERPs
experienced as much as 300 percent
material improvements in efficiency and
as much as 65 percent reduction in costs
associated with performing Finance and
Accounting operations
IBM Institute for Business Value
8132019 ERP Systems Drive
httpslidepdfcomreaderfullerp-systems-drive 28
IBM GLOBAL BUSINESS SERVICES Financial management
Benchmarking Brief
2
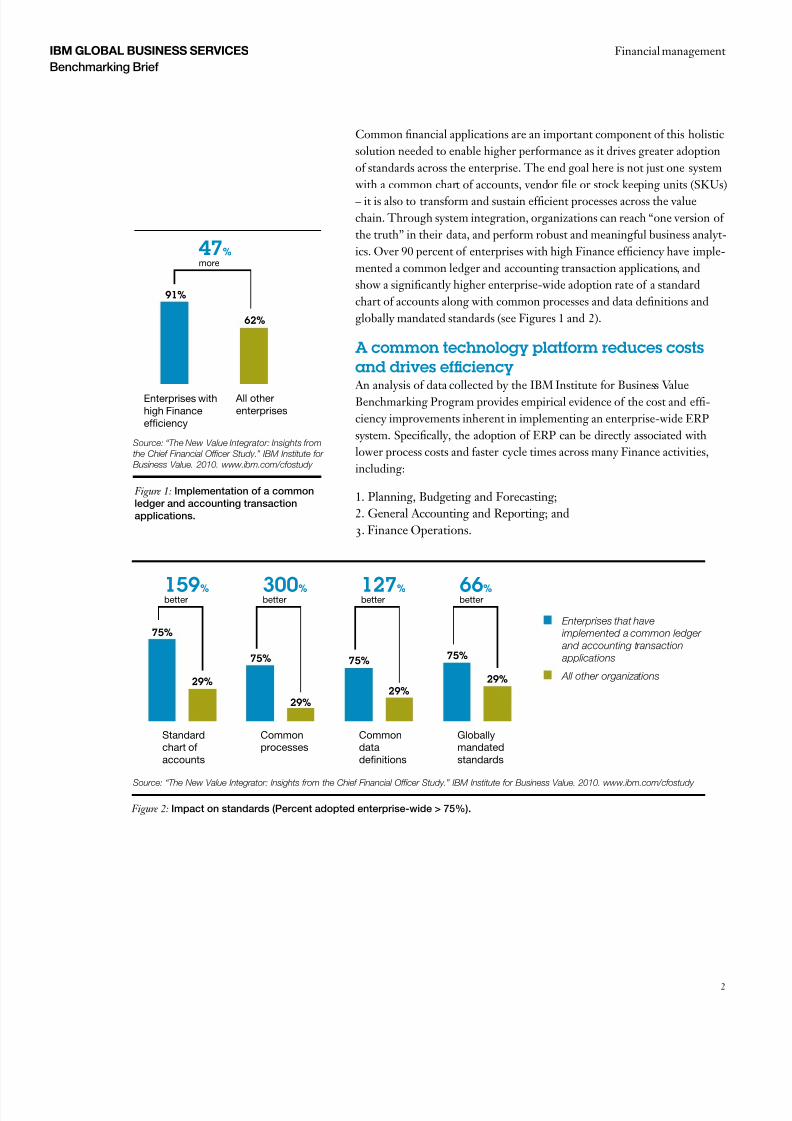
Common financial applications are an important component of this holistic
solution needed to enable higher performance as it drives greater adoption
of standards across the enterprise The end goal here is not just one system
with a common chart of accounts vendor file or stock keeping units (SKUs)
ndash it is also to transform and sustain efficient processes across the value
chain Through system integration organizations can reach ldquoone version of
the truthrdquo in their data and perform robust and meaningful business analyt-
ics Over 90 percent of enterprises with high Finance efficiency have imple-
mented a common ledger and accounting transaction applications and
show a significantly higher enterprise-wide adoption rate of a standard
chart of accounts along with common processes and data definitions and
globally mandated standards (see Figures 1 and 2)
A common technology platform reduces costsand drives efficiency An analysis of data collected by the IBM Institute for Business Value
Benchmarking Program provides empirical evidence of the cost and effi-
ciency improvements inherent in implementing an enterprise-wide ERP
system Specifically the adoption of ERP can be directly associated with
lower process costs and faster cycle times across many Finance activities
including
1 Planning Budgeting and Forecasting
2 General Accounting and Reporting and
983091 Finance Operations
Enterprises with
high Finance
efficiency
Figure 1 Implementation of a commonledger and accounting transactionapplications
47more
91
62
All other
enterprises
Figure 2 Impact on standards (Percent adopted enterprise-wide gt 75)
Standard
chart of
accounts
159better
75
29
Common
processes
300better
75
29
Common
data
definitions
127better
75
29
Globally
mandated
standards
66better
75
29
Enterprises that have
implemented a common ledger
and accounting transaction
applications
All other organizations
Source ldquoThe New Value Integrator Insights from
the Chief Financial Officer Studyrdquo IBM Institute for
Business Value 2010 wwwibmcomcfostudy
Source ldquoThe New Value Integrator Insights from the Chief Financial Officer Studyrdquo IBM Institute for Business Value 2010 wwwibmcomcfostudy
8132019 ERP Systems Drive
httpslidepdfcomreaderfullerp-systems-drive 38
IBM GLOBAL BUSINESS SERVICES Financial management
Benchmarking Brief
3
The approach taken for this analysis was by design conservative since not
every enterprise can or necessarily needs to aspire to be ldquoWorld Classrdquo
across the board3 We examined the median performance of two Peer
Groups participants that have implemented an ERP system (ERP Peer
Group) and those that have not (non-ERP Peer Group) Our objective was
to demonstrate by comparison of median results within a large set of Fi-
nance- and Accounting Operations-specific process areas that tangible ben-
efits are applicable to a broad population of companies that may not yet
have considered adoption of a common technology platform Overall orga-
nizations that have implemented ERP have 74 percent fewer FTEs for the
Finance function per US$1 billion revenue and 19 percent lower Finance
function cost as a percentage of Selling General amp Administrative (SGampA)
costs compared to all other organizations (see Figures 3 and 4)
We see these benefits across three major areas
1 Planning Budgeting and ForecastingFor the planning budgeting and forecasting process our analysis revealed
that companies using ERP have lower median cost and improvements in
the cycle time to complete the annual budget cycle (see Figures 5 and 6)
They also show a significant improvement in productivity regarding the
collection and manipulation of budget data and higher frequency in
preparing financial forecasts (see Figures 7 and 8) This substantiates that
organizations that have adopted a common technology platform spend less
time collecting and reconciling data and more time discerning valuable
insights and allocating resources
Figure 3 Number of FTEs for theFinance function per US$1 billionbusiness entity revenue
Enterprises that have
implemented ERP
74higher
474
1826
19
lower
2632
All other
organizations
Enterprises that have
implemented ERP
All other
organizations
Finance function costs
Figure 4 Total Finance function cost asa percentage of SGampA
39lower
$048
$079
Enterprises that have
implemented ERP
All other
organizations
Cost ndash planning budgeting forecasting
Figure 5 Total cost of the processldquoPerform planningbudgeting forecastingrdquo per US$1000 revenue
36improvement
315
495
Enterprises that have
implemented ERP
All other
organizations
Productivity ndash budgeting cycle time
Figure 6 Cycle time in days tocomplete the annual budget cycle
21lower
333
423
Enterprises that have
implemented ERP
All other
organizations
Productivity ndash time spent on budgeting
Figure 7 Percentage of time spentcollecting and manipulating budgetdata
20higher
120
100
Enterprises that have
implemented ERP
All other
organizations
Productivity ndash forecasting
Figure 8 Frequency per annum thatfinancial forecasts are prepared
Finance function FTEs
8132019 ERP Systems Drive
httpslidepdfcomreaderfullerp-systems-drive 48
8132019 ERP Systems Drive
httpslidepdfcomreaderfullerp-systems-drive 58
8132019 ERP Systems Drive
httpslidepdfcomreaderfullerp-systems-drive 68
8132019 ERP Systems Drive
httpslidepdfcomreaderfullerp-systems-drive 78
8132019 ERP Systems Drive
httpslidepdfcomreaderfullerp-systems-drive 88
GBE03542-USEN-00
Please Recycle
copy Copyright IBM Corporation 983090983088983089983091
IBM Global ServicesRoute 983089983088983088Somers NY 983089983088983093983096983097USA
Produced in the United States of AmericaFebruary 983090983088983089983091 All Rights Reserved
IBM the IBM logo and ibmcom are trademarks or registered trademarksof International Business Machines Corporation in the United States other
countries or both If these and other IBM trademarked terms are markedon their first occurrence in this information with a trademark symbol(reg or trade) these symbols indicate US registered or common lawtrademarks owned by IBM at the time this information was published Suchtrademarks may also be registered or common law trademarks in othercountries A current list of IBM trademarks is available on the Web atldquoCopyright and trademark informationrdquo at ibmcom legalcopytradeshtml
Other company product and service names may be trademarks or servicemarks of others
References in this publication to IBM products and services do notimply that IBM intends to make them available in all countries in whichIBM operates
References
1 IBM Institute for Business Value ldquoThe New Value Integrator Insightsfrom the Global Chief Financial Officer Studyrdquo March 2010 wwwibmcomcfostudy
2 For more information on the impact of service delivery models seeIBM Institute for Business Value ldquoIBM benchmarks demonstrate theeffectiveness of Service Delivery Models for Finance and Operationsfunctionsrdquo August 2011 httppublicdheibmcomcommonssiecm engbe03424usenGBE03424USENPDF
3 ldquoWorld Classrdquo represents the top quintile performance (80th percentile)in the distribution of survey respondents
8132019 ERP Systems Drive
httpslidepdfcomreaderfullerp-systems-drive 28
IBM GLOBAL BUSINESS SERVICES Financial management
Benchmarking Brief
2
Common financial applications are an important component of this holistic
solution needed to enable higher performance as it drives greater adoption
of standards across the enterprise The end goal here is not just one system
with a common chart of accounts vendor file or stock keeping units (SKUs)
ndash it is also to transform and sustain efficient processes across the value
chain Through system integration organizations can reach ldquoone version of
the truthrdquo in their data and perform robust and meaningful business analyt-
ics Over 90 percent of enterprises with high Finance efficiency have imple-
mented a common ledger and accounting transaction applications and
show a significantly higher enterprise-wide adoption rate of a standard
chart of accounts along with common processes and data definitions and
globally mandated standards (see Figures 1 and 2)
A common technology platform reduces costsand drives efficiency An analysis of data collected by the IBM Institute for Business Value
Benchmarking Program provides empirical evidence of the cost and effi-
ciency improvements inherent in implementing an enterprise-wide ERP
system Specifically the adoption of ERP can be directly associated with
lower process costs and faster cycle times across many Finance activities
including
1 Planning Budgeting and Forecasting
2 General Accounting and Reporting and
983091 Finance Operations
Enterprises with
high Finance
efficiency
Figure 1 Implementation of a commonledger and accounting transactionapplications
47more
91
62
All other
enterprises
Figure 2 Impact on standards (Percent adopted enterprise-wide gt 75)
Standard
chart of
accounts
159better
75
29
Common
processes
300better
75
29
Common
data
definitions
127better
75
29
Globally
mandated
standards
66better
75
29
Enterprises that have
implemented a common ledger
and accounting transaction
applications
All other organizations
Source ldquoThe New Value Integrator Insights from
the Chief Financial Officer Studyrdquo IBM Institute for
Business Value 2010 wwwibmcomcfostudy
Source ldquoThe New Value Integrator Insights from the Chief Financial Officer Studyrdquo IBM Institute for Business Value 2010 wwwibmcomcfostudy
8132019 ERP Systems Drive
httpslidepdfcomreaderfullerp-systems-drive 38
IBM GLOBAL BUSINESS SERVICES Financial management
Benchmarking Brief
3
The approach taken for this analysis was by design conservative since not
every enterprise can or necessarily needs to aspire to be ldquoWorld Classrdquo
across the board3 We examined the median performance of two Peer
Groups participants that have implemented an ERP system (ERP Peer
Group) and those that have not (non-ERP Peer Group) Our objective was
to demonstrate by comparison of median results within a large set of Fi-
nance- and Accounting Operations-specific process areas that tangible ben-
efits are applicable to a broad population of companies that may not yet
have considered adoption of a common technology platform Overall orga-
nizations that have implemented ERP have 74 percent fewer FTEs for the
Finance function per US$1 billion revenue and 19 percent lower Finance
function cost as a percentage of Selling General amp Administrative (SGampA)
costs compared to all other organizations (see Figures 3 and 4)
We see these benefits across three major areas
1 Planning Budgeting and ForecastingFor the planning budgeting and forecasting process our analysis revealed
that companies using ERP have lower median cost and improvements in
the cycle time to complete the annual budget cycle (see Figures 5 and 6)
They also show a significant improvement in productivity regarding the
collection and manipulation of budget data and higher frequency in
preparing financial forecasts (see Figures 7 and 8) This substantiates that
organizations that have adopted a common technology platform spend less
time collecting and reconciling data and more time discerning valuable
insights and allocating resources
Figure 3 Number of FTEs for theFinance function per US$1 billionbusiness entity revenue
Enterprises that have
implemented ERP
74higher
474
1826
19
lower
2632
All other
organizations
Enterprises that have
implemented ERP
All other
organizations
Finance function costs
Figure 4 Total Finance function cost asa percentage of SGampA
39lower
$048
$079
Enterprises that have
implemented ERP
All other
organizations
Cost ndash planning budgeting forecasting
Figure 5 Total cost of the processldquoPerform planningbudgeting forecastingrdquo per US$1000 revenue
36improvement
315
495
Enterprises that have
implemented ERP
All other
organizations
Productivity ndash budgeting cycle time
Figure 6 Cycle time in days tocomplete the annual budget cycle
21lower
333
423
Enterprises that have
implemented ERP
All other
organizations
Productivity ndash time spent on budgeting
Figure 7 Percentage of time spentcollecting and manipulating budgetdata
20higher
120
100
Enterprises that have
implemented ERP
All other
organizations
Productivity ndash forecasting
Figure 8 Frequency per annum thatfinancial forecasts are prepared
Finance function FTEs
8132019 ERP Systems Drive
httpslidepdfcomreaderfullerp-systems-drive 48
8132019 ERP Systems Drive
httpslidepdfcomreaderfullerp-systems-drive 58
8132019 ERP Systems Drive
httpslidepdfcomreaderfullerp-systems-drive 68
8132019 ERP Systems Drive
httpslidepdfcomreaderfullerp-systems-drive 78
8132019 ERP Systems Drive
httpslidepdfcomreaderfullerp-systems-drive 88
GBE03542-USEN-00
Please Recycle
copy Copyright IBM Corporation 983090983088983089983091
IBM Global ServicesRoute 983089983088983088Somers NY 983089983088983093983096983097USA
Produced in the United States of AmericaFebruary 983090983088983089983091 All Rights Reserved
IBM the IBM logo and ibmcom are trademarks or registered trademarksof International Business Machines Corporation in the United States other
countries or both If these and other IBM trademarked terms are markedon their first occurrence in this information with a trademark symbol(reg or trade) these symbols indicate US registered or common lawtrademarks owned by IBM at the time this information was published Suchtrademarks may also be registered or common law trademarks in othercountries A current list of IBM trademarks is available on the Web atldquoCopyright and trademark informationrdquo at ibmcom legalcopytradeshtml
Other company product and service names may be trademarks or servicemarks of others
References in this publication to IBM products and services do notimply that IBM intends to make them available in all countries in whichIBM operates
References
1 IBM Institute for Business Value ldquoThe New Value Integrator Insightsfrom the Global Chief Financial Officer Studyrdquo March 2010 wwwibmcomcfostudy
2 For more information on the impact of service delivery models seeIBM Institute for Business Value ldquoIBM benchmarks demonstrate theeffectiveness of Service Delivery Models for Finance and Operationsfunctionsrdquo August 2011 httppublicdheibmcomcommonssiecm engbe03424usenGBE03424USENPDF
3 ldquoWorld Classrdquo represents the top quintile performance (80th percentile)in the distribution of survey respondents

8132019 ERP Systems Drive
httpslidepdfcomreaderfullerp-systems-drive 48
8132019 ERP Systems Drive
httpslidepdfcomreaderfullerp-systems-drive 58
8132019 ERP Systems Drive
httpslidepdfcomreaderfullerp-systems-drive 68
8132019 ERP Systems Drive
httpslidepdfcomreaderfullerp-systems-drive 78
8132019 ERP Systems Drive
httpslidepdfcomreaderfullerp-systems-drive 88
GBE03542-USEN-00
Please Recycle
copy Copyright IBM Corporation 983090983088983089983091
IBM Global ServicesRoute 983089983088983088Somers NY 983089983088983093983096983097USA
Produced in the United States of AmericaFebruary 983090983088983089983091 All Rights Reserved
IBM the IBM logo and ibmcom are trademarks or registered trademarksof International Business Machines Corporation in the United States other
countries or both If these and other IBM trademarked terms are markedon their first occurrence in this information with a trademark symbol(reg or trade) these symbols indicate US registered or common lawtrademarks owned by IBM at the time this information was published Suchtrademarks may also be registered or common law trademarks in othercountries A current list of IBM trademarks is available on the Web atldquoCopyright and trademark informationrdquo at ibmcom legalcopytradeshtml
Other company product and service names may be trademarks or servicemarks of others
References in this publication to IBM products and services do notimply that IBM intends to make them available in all countries in whichIBM operates
References
1 IBM Institute for Business Value ldquoThe New Value Integrator Insightsfrom the Global Chief Financial Officer Studyrdquo March 2010 wwwibmcomcfostudy
2 For more information on the impact of service delivery models seeIBM Institute for Business Value ldquoIBM benchmarks demonstrate theeffectiveness of Service Delivery Models for Finance and Operationsfunctionsrdquo August 2011 httppublicdheibmcomcommonssiecm engbe03424usenGBE03424USENPDF
3 ldquoWorld Classrdquo represents the top quintile performance (80th percentile)in the distribution of survey respondents
8132019 ERP Systems Drive
httpslidepdfcomreaderfullerp-systems-drive 68
8132019 ERP Systems Drive
httpslidepdfcomreaderfullerp-systems-drive 78
8132019 ERP Systems Drive
httpslidepdfcomreaderfullerp-systems-drive 88
GBE03542-USEN-00
Please Recycle
copy Copyright IBM Corporation 983090983088983089983091
IBM Global ServicesRoute 983089983088983088Somers NY 983089983088983093983096983097USA
Produced in the United States of AmericaFebruary 983090983088983089983091 All Rights Reserved
IBM the IBM logo and ibmcom are trademarks or registered trademarksof International Business Machines Corporation in the United States other
countries or both If these and other IBM trademarked terms are markedon their first occurrence in this information with a trademark symbol(reg or trade) these symbols indicate US registered or common lawtrademarks owned by IBM at the time this information was published Suchtrademarks may also be registered or common law trademarks in othercountries A current list of IBM trademarks is available on the Web atldquoCopyright and trademark informationrdquo at ibmcom legalcopytradeshtml
Other company product and service names may be trademarks or servicemarks of others
References in this publication to IBM products and services do notimply that IBM intends to make them available in all countries in whichIBM operates
References
1 IBM Institute for Business Value ldquoThe New Value Integrator Insightsfrom the Global Chief Financial Officer Studyrdquo March 2010 wwwibmcomcfostudy
2 For more information on the impact of service delivery models seeIBM Institute for Business Value ldquoIBM benchmarks demonstrate theeffectiveness of Service Delivery Models for Finance and Operationsfunctionsrdquo August 2011 httppublicdheibmcomcommonssiecm engbe03424usenGBE03424USENPDF
3 ldquoWorld Classrdquo represents the top quintile performance (80th percentile)in the distribution of survey respondents

8132019 ERP Systems Drive
httpslidepdfcomreaderfullerp-systems-drive 78
8132019 ERP Systems Drive
httpslidepdfcomreaderfullerp-systems-drive 88
GBE03542-USEN-00
Please Recycle
copy Copyright IBM Corporation 983090983088983089983091
IBM Global ServicesRoute 983089983088983088Somers NY 983089983088983093983096983097USA
Produced in the United States of AmericaFebruary 983090983088983089983091 All Rights Reserved
IBM the IBM logo and ibmcom are trademarks or registered trademarksof International Business Machines Corporation in the United States other
countries or both If these and other IBM trademarked terms are markedon their first occurrence in this information with a trademark symbol(reg or trade) these symbols indicate US registered or common lawtrademarks owned by IBM at the time this information was published Suchtrademarks may also be registered or common law trademarks in othercountries A current list of IBM trademarks is available on the Web atldquoCopyright and trademark informationrdquo at ibmcom legalcopytradeshtml
Other company product and service names may be trademarks or servicemarks of others
References in this publication to IBM products and services do notimply that IBM intends to make them available in all countries in whichIBM operates
References
1 IBM Institute for Business Value ldquoThe New Value Integrator Insightsfrom the Global Chief Financial Officer Studyrdquo March 2010 wwwibmcomcfostudy
2 For more information on the impact of service delivery models seeIBM Institute for Business Value ldquoIBM benchmarks demonstrate theeffectiveness of Service Delivery Models for Finance and Operationsfunctionsrdquo August 2011 httppublicdheibmcomcommonssiecm engbe03424usenGBE03424USENPDF
3 ldquoWorld Classrdquo represents the top quintile performance (80th percentile)in the distribution of survey respondents