Erosion of an Axial Transonic Fan due to dust ingestion
17
American Journal of Aerospace Engineering 2015; 2(1-1): 47-63 Published online October 15, 2014 (http://www.sciencepublishinggroup.com/j/ajae) doi: 10.11648/j.ajae.s.2015020101.15 Erosion of an Axial Transonic Fan due to dust ingestion Ahmed Fayez EL-Saied, Mohamed Hassan Gobran, Hassan Zohier Hassan Mechanical Power Eng. Dept., Zagazig University, Zagazig, Egypt Email address: [email protected] (A. F. EL-Saied), [email protected] (M. H. Gobran), [email protected] (H. Z. Hassan) To cite this article: Ahmed Fayez EL-Saied, Mohamed Hassan Gobran, Hassan Zohier Hassan. Erosion of an Axial Transonic Fan due to Dust Ingestion. American Journal of Aerospace Engineering. Special Issue: Hands-on Learning Technique for Multidisciplinary Engineering Education. Vol. 2, No. 1-1, 2015, pp. 47-63. doi: 10.11648/j.ajae.s.2015020101.15 Abstract: This paper deals with the prediction of the particle dynamic and erosion characteristics due to dust ingestion in an axial flow fan, installed in a high bypass-ratio turbofan engine that operates in a dusty environment. Dynamic behavior comprises the particle trajectory and its impact velocity and location. While the erosion characteristics are resembled by the impact frequency, erosion rate, erosion parameter and the penetration rate. The study was carried out in two flight regimes, namely, takeoff, where the sand particles are prevailing, and cruise, where the fly ashes are dominated. In both cases, the effect of the particle size on its trajectory, impact location, and the erosion characteristics was studied. To simulate the problem in a more realistic manner, a Rosin Rambler particle diameter distribution was assumed at takeoff and cruise conditions. At takeoff, this distribution varies from 50 to 300 µm with a mean diameter of 150 µm sand particles. While at cruise, this distribution varies from 5 to 30 µm with a mean diameter of 15 µm fly ash particles. The computational domain employed was a periodic sector through both the fan and its intake bounding an angle of (360/38) where the number of fan blades is (38). The intake is a stationary domain while the fan is a rotating one and the FLUENT solver is used to solve this problem. Firstly, the flow field was solved in the computational domain using the Navier-Stokes finite- volume supported by the Spalart-Allmaras turbulence model. The governing equations, representing the particle motion through the moving stream of a compressible flow are introduced herein to calculate the particle trajectory. The solution of these equations is carried out based on the Lagrangian approach. Next, empirical equations representing the particle impact characteristics with the walls are introduced to calculate the rebound velocity, the erosion rate, erosion parameter, impact frequency and penetration rate. Moreover, a method to smoothen the irregularity in the calculated scattered data was discussed as well. During takeoff flight regime, the pressure side of fan blade experienced higher particle impact and erosion damage. The highest erosion rate was found at the corner formed by blade tip and trailing edge of pressure side. During cruise conditions, less erosion rates resulted. Maximum erosion rates are found at the leading edge of the pressure side. Keywords: Turbomachinery Erosion, Transonic Axial Fan, Fan Erosion, Particulate Flow 1. Introduction Erosion is a main physical problem facing the aircraft engines, especially for those operating in the desert or polluted environment. The tendency of an aircraft engine to ingest ground particles during ground operation is a well- known phenomenon. During high power setting at takeoff, the generated ground vortex has the capability of picking up particles from the ground, which are then ingested into the engine. Thrust reversal can also blow solid particles into the engine intake during landing. During takeoff or landing, helicopters need to use the effect of down-wash to create additional lift. The down-wash associated with hover maneuver and multiple pick-ups with rotor turning may generate a severe dust cloud around the aircraft. This dust cloud circulates up and over the rotor blades to re-enter the circling air from above, inevitably a great deal of dust enters the engine. Moreover, the aircraft engine is subjected to fly ashes during flight operation. In addition, dust from the desert areas is rich in sodium and potassium, especially particles of diameter up to 100 microns which are the most common. These particles deposit on the surfaces of the hot section of the engine after combining with sulfur and oxygen during the combustion process. Particles of four metals; sodium, potassium, vanadium, and lead will disrupt the protective coating of the hot gas sections leading to faster oxidization of these parts by the hot gases. Turbomachinery blade erosion has been the subject of many analytical and experimental investigations in the last fifty
Transcript of Erosion of an Axial Transonic Fan due to dust ingestion

American Journal of Aerospace Engineering 2015; 2(1-1): 47-63 Published online October 15, 2014 (http://www.sciencepublishinggroup.com/j/ajae) doi: 10.11648/j.ajae.s.2015020101.15
Erosion of an Axial Transonic Fan due to dust ingestion
Ahmed Fayez EL-Saied, Mohamed Hassan Gobran, Hassan Zohier Hassan
Mechanical Power Eng. Dept., Zagazig University, Zagazig, Egypt
Email address: [email protected] (A. F. EL-Saied), [email protected] (M. H. Gobran), [email protected] (H. Z. Hassan)
To cite this article: Ahmed Fayez EL-Saied, Mohamed Hassan Gobran, Hassan Zohier Hassan. Erosion of an Axial Transonic Fan due to Dust Ingestion. American Journal of Aerospace Engineering. Special Issue: Hands-on Learning Technique for Multidisciplinary Engineering Education. Vol. 2, No. 1-1, 2015, pp. 47-63. doi: 10.11648/j.ajae.s.2015020101.15
Abstract: This paper deals with the prediction of the particle dynamic and erosion characteristics due to dust ingestion in an axial flow fan, installed in a high bypass-ratio turbofan engine that operates in a dusty environment. Dynamic behavior comprises the particle trajectory and its impact velocity and location. While the erosion characteristics are resembled by the impact frequency, erosion rate, erosion parameter and the penetration rate. The study was carried out in two flight regimes, namely, takeoff, where the sand particles are prevailing, and cruise, where the fly ashes are dominated. In both cases, the effect of the particle size on its trajectory, impact location, and the erosion characteristics was studied. To simulate the problem in a more realistic manner, a Rosin Rambler particle diameter distribution was assumed at takeoff and cruise conditions. At takeoff, this distribution varies from 50 to 300 µm with a mean diameter of 150 µm sand particles. While at cruise, this distribution varies from 5 to 30 µm with a mean diameter of 15 µm fly ash particles. The computational domain employed was a periodic sector through both the fan and its intake bounding an angle of (360/38) where the number of fan blades is (38). The intake is a stationary domain while the fan is a rotating one and the FLUENT solver is used to solve this problem. Firstly, the flow field was solved in the computational domain using the Navier-Stokes finite- volume supported by the Spalart-Allmaras turbulence model. The governing equations, representing the particle motion through the moving stream of a compressible flow are introduced herein to calculate the particle trajectory. The solution of these equations is carried out based on the Lagrangian approach. Next, empirical equations representing the particle impact characteristics with the walls are introduced to calculate the rebound velocity, the erosion rate, erosion parameter, impact frequency and penetration rate. Moreover, a method to smoothen the irregularity in the calculated scattered data was discussed as well. During takeoff flight regime, the pressure side of fan blade experienced higher particle impact and erosion damage. The highest erosion rate was found at the corner formed by blade tip and trailing edge of pressure side. During cruise conditions, less erosion rates resulted. Maximum erosion rates are found at the leading edge of the pressure side.
Keywords: Turbomachinery Erosion, Transonic Axial Fan, Fan Erosion, Particulate Flow
1. Introduction Erosion is a main physical problem facing the aircraft
engines, especially for those operating in the desert or polluted environment. The tendency of an aircraft engine to ingest ground particles during ground operation is a well- known phenomenon. During high power setting at takeoff, the generated ground vortex has the capability of picking up particles from the ground, which are then ingested into the engine. Thrust reversal can also blow solid particles into the engine intake during landing. During takeoff or landing, helicopters need to use the effect of down-wash to create additional lift. The down-wash associated with hover maneuver and multiple pick-ups with rotor turning may
generate a severe dust cloud around the aircraft. This dust cloud circulates up and over the rotor blades to re-enter the circling air from above, inevitably a great deal of dust enters the engine. Moreover, the aircraft engine is subjected to fly ashes during flight operation.
In addition, dust from the desert areas is rich in sodium and potassium, especially particles of diameter up to 100 microns which are the most common. These particles deposit on the surfaces of the hot section of the engine after combining with sulfur and oxygen during the combustion process. Particles of four metals; sodium, potassium, vanadium, and lead will disrupt the protective coating of the hot gas sections leading to faster oxidization of these parts by the hot gases.
Turbomachinery blade erosion has been the subject of many analytical and experimental investigations in the last fifty

48 Ahmed Fayez EL-Saied et al.: Erosion of an Axial Transonic Fan due to Dust Ingestion
years. In these studies, the main subject was to correlate the particle impact velocity, impact angle, and impact locations with surface measured erosion parameter for a particular range of conditions. An early study by Montgomery et al. [1] described a test program to relate the losses in a radial turbine operating lifetime to the amount and sizes of ingested particles. This study indicated that, as particle small as )32( mµ− it still cause serious losses in the engine operating life time. Tabakoff and Hamed [2], experimentally, derived correlations for the restitution ratio on their study of erosion in radial inflow turbine.
Through an experimental study of an axial flow gas turbine, Tabakoff et al. [3] showed that the maximum stator blade erosion is at the blade trailing edge, and the maximum rotor blade erosion is located near one third the blade height at the leading edge. In an important contribution on the field of gas turbine erosion, Hamed [4] introduced a useful equation to compute the mass erosion parameter. A combined experimental and computational research program was conducted by Hamed et al. [5] to investigate the effect of solid particle impacts on the turbine blade material. The results indicate that many particles impact the vane pressure surface. The vane surface impacts reduce the particles absolute velocity and consequently they impact the rotor blade suction surface. Their prediction indicates a narrow band of high erosion at the vane leading edge and pressure surface erosion increasing towards the trailing edge.
Japikse [6], Wulf et al. [7], and Peterson [8] related the rate of wear to the time of usage. They claimed that, within 6000 -8000 hours of jet engine operation, compressor blades had blunt leading edges with an increased surface roughness.
The damage of the blades is caused mainly by direct material impingement of large particles, and even by recirculation of fine particles due to secondary flow through the blade passage, Neilson and Gilchrist [9].
Tabakoff and Hussein [10], and Elsayed and Brown [11] analyzed the particulate flow in axial turbo-machines. Hamed [12] presented a newer method for particle trajectory calculations to include the influence of the hub and tip shapes, the radial variations and the vane shape on the particle trajectories. She determined the particles rebounding velocity and direction after each impact, and consequently the erosion prediction on the blades by using empirical correlations derived from experiments conducted in a special tunnel. Beacher et al. [13] had improved the model of Hamed [12], involving a more complex representation of the three-dimensional flow fields. Hamed and Fowler [14] used statistical method combined with particle trajectories computations together with the experimental data of metal erosion and particle rebound characteristics in their modified model.
Clevenger and Tabakoff [15] treated the particulate flow problems in radial inflow turbines. Experimentally, they traced the particle trajectories through the different regions of the turbine (scroll, stator and rotor) using high speed camera. These trajectories are used to estimate the erosion rates. Hussein and Tabakoff [16] had developed a code for the
three-dimensional particle trajectory calculations through turbines and compressors. The success of their code was attributed to its accurate representation of the blade airfoil shape and the blade-to-blade flow field at the mean radius. Elsayed and Rashed [17] and [18] investigated the air flow and the erosion rate of centrifugal compressors. They estimated the lifetime of centrifugal compressor due to successive operation in polluted environment or sandy areas.
Maxwell [19] conducted a theoretical analysis of particle trajectory in a stationary cascade. Elsayed and Rouleau [20] investigated the erosion of stationary cascades in turbo-expanders. The air flow velocities were measured in many points within the passage using LDV. Next, the particle trajectories were calculated numerically. Erosion not only influences the aerodynamics of turbo-machineries but also affects their structural integrity. Such a combined effect influences the aero-elastic behavior of eroded turbo-machine. The change of the aero-elastic behavior was examined by Elsayed [21].
Suzuki et al. [22] carried out the numerical simulations for the sand erosion phenomena in the rotor/stator interaction of the single stage axial flow compressor. Through this study, authors conclude that: severe sand erosion occurs on the pressure surface at leading edge of the blades and blade tip is deteriorated by sand erosion rather than hub due to high impact velocity.
Corsini et al. [23] presented a numerical study on the evolution of blade leading edge erosion patterns in an axial induced draft fan. The numerical study clarifies the influence of flow structure, blade geometry, particle size, and concentration on erosion pattern. They found that: the blade wear on the leading edge pressure side is larger than that on the suction side, and the leading edge erosion extends over the entire blade. The authors also found that: the erosion sensitive areas were also concentrated over the tip corner due to the combination of the higher peripheral speed and particle migration from the pressure to the suction side.
Brun et al. [24] conducted a semi-empirical model to predict the behavior of solid particles, such as sand, dirt, and dust, in turbo-machines, such as centrifugal compressors, gas turbine engines, or axial compressors. The results allow one to develop a strategy to “harden” a turbo-machine locally against the damaging effects of sand or dirt ingestion.
Carbonetto and Hoch [25] discussed a method of predicting expander flow path erosion and deposition using computational fluid dynamics (CFD) coupled with empirical erosion data. With an understanding of the particle dynamics, new aerodynamically efficient components may be developed to significantly increase the reliability and life of the expander.
Zhang et al. [26] presented a new method to improve the erosion resistance of machine components by biomimetic method. The discrete phase model was used for modeling the solid particles flow, and the Eulerian conservation equations to the continuous phase. The numerical study employs computational fluid dynamics (CFD) software, based on a finite volume method. Gas/solid flow axial fan was simulated to calculate the erosion rate of the particles on the fan blades
American Journal of Aerospace Engineering 2015; 2(1-1): 47-63 49
and comparatively analyzed the erosive wear of the smooth surface. The results show that the groove-shaped biomimetic blade anti-erosion ability is better than that of the other fan blades.
From the above literature review, it is noticed that: most of the researches discussing the erosion problem in turbomachinery were concentrated on the erosion in compressors, turbines, and sometimes small fans. In modern turbofan engines, large fans with special designs are required to achieve high-pressure ratio and mass flux. The deterioration in such fan performance due to the erosion phenomenon has a great impact on its related engine. So, the present work is oriented to study the erosion in a large axial-flow fan installed in a high bypass-ratio turbofan engine at both takeoff and cruise conditions. At takeoff the particle material is considered sand while at cruise it is considered fly ash. For the two flight conditions the effect of particle size is examined. In addition, two particle distributions (at takeoff and cruise) are also examined.
2. Numerical Model Numerical simulation was conducted to determine the
three-dimensional compressible viscous flow field and associated solid trajectories through the fan. The discrete phase model was used for modeling the solid particles flow, and the Eulerian conservation equations to the continuous phase. The flow phase simulations are based on implicit solution of the Reynolds-averaged Navier-Stokes equation in conversation and with Spalart-Allmaras turbulence model with near wall treatment. The numerical study employs computational fluid dynamics (CFD) software, based on a finite volume method. Gas/solid flow axial fan was simulated to calculate the erosion characteristics of the particles on the fan blades and comparatively analyzed the erosive wear of the smooth surface. The simulation incorporates empirical particle-surface and particle-air interaction models. The compressible viscous flow and dispersed particle dynamics simulation were conducted using FLUINT 6.1 software ([27], [28], and [29]).
3. Case Study The case studied in the present work represents a subsonic
intake followed by an axial- flow fan. This fan is the first rotary module in the GENERAL ELECTRIC CF6-50 high bypass-ratio turbofan engines. The fan rotor has a large diameter (2.18 m) and the fan blade is tapered, highly twisted, and has a long span (0.6507 m) with a low hub to tip ratio (0.4033). Figure (1) shows the fan and its intake. The axial length of the intake was found to be 155.55 cm, and the nose of the fan can be simplified as a hemisphere of radius 40.57 cm. The fan and the intake detailed dimensions were measured from the real fan model of the CF6-50 turbofan engine at the maintenance workshop of the Egypt Air Company. The dimensions were measured at four different locations along the blade height. One at the hub, another at the tip, and the
other two sections are in between. These sections help for drawing the overall blade profile. Table (1) gives some important dimensions of the four sections.
Figure 1. CF6 intake and fan.
Table 1. Blade characteristics at different radius locations
Radial location, (cm) 44 hub 69 89 109 (tip)
Chord length 17.5 19.4 21 24.4
Stagger angle, degree 10 43 49 66
Location of max. thickness, %chord 65.7 58 48 47.8
Max. thickness, mm. 9 7.5 4.2 3.7
4. Computational Domain The computational domain in the study includes both of the
fan and the intake zones. Due to the large dimensions of both the intake and the fan combination, it was very difficult to solve the overall the domain. Since the fan includes 38 blades, a periodic sector of an angle (360/38) was generated separately for both the fan and the intake zones. The two zones were merged together to form the required computational domain. The GAMBIT preprocessor (a software in the Fluent 6.1 package) is used to build the geometry of the solution domain for both the intake and fan zones. It is also used to generate the suitable mesh. Due to complex geometry of both the fan and intake sectors, it was appropriate to use the unstructured tetrahedral grid. Figures (2) and (3) give the mesh at hub and tip sections, respectively and table (2) summarizes the mesh characteristics on the whole domain. Both the fan and the intake zones were meshed separately into two mesh files. The two meshes were merged using the TMERGE utility. Table (3) gives the types of boundary conditions for the computational domain.
Figure 2. The mesh at the hub section.

50 Ahmed Fayez EL-Saied et al.: Erosion of an Axial Transonic Fan due to Dust Ingestion
Figure 3. The mesh at the tip section.
Table 2. Grid characteristics
Intake block Fan block Total
Number of cells 49005 281941 330946
Number of faces 99020 585640 692844
Number of nodes 11353 59403 72011
Table 3. Boundary condition
Boundary Boundary type
Intake inlet Pressure inlet
Fan exit Pressure outlet
Intake casing and the fan casing Stationary wall Fan hub, fan pressure side, suction side, and the spinner cone.
Rotating walls
Fan inlet and intake outlet Grid interface plane
Fan and intake periodic sides Periodic
5. Procedure of Solution In calculating the particle trajectories and the erosion
characteristics on the fan blade, we will use the one- way coupling as discussed before. The procedure of solution can be summarized as follows [28]: 1. The Fluent main program reads the geometry and the air
flow field properties were calculated, [29]. 2. The particles initial conditions (injection locations and
velocity), and properties (density, diameter distribution, and mass flow- rate) are introduced to the solver.
3. The main Fluent 6.1 program starts particle trajectory calculations.
4. If the particle reaches a wall, the main program calls the user defined functions to compute the erosion rate, erosion parameter, penetration rate, and the impact frequency. These values are returned to the element face that the particle impacts.
5. The particle new velocity, after impact, is then calculated and the trajectory calculations continue with this new velocity and other impacts may be considered until the particle leaves the domain.
6. Another particle is traced in the same manner until all particles trajectory are calculated.
7. The erosion data obtained on the boundary wall elements are input to the developed FORTRAN program to begin the localized inverse interpolation calculations.
8. Finally, the obtained results are post processed.
6. Results and Discussion Many runs of the Fluent program were carried out to predict
the particle trajectories and the subsequent erosion phenomena. To understand the erosion problem, equally- space six injection locations are distributed at the intake inlet. These locations represent a part of the total initial injection locations distributed evenly at the intake inlet. These runs are classified according to the flight conditions (cruise and takeoff), different particle diameters (50, 150, and 250 mµ for takeoff, and 10, 20, and 30 mµ for cruise), and according to the particle size distribution (from 50 to 300 mµ for takeoff with the mean diameter at 150mµ , and from 5 to 30 mµ for cruise with the mean diameter at 15mµ ). At takeoff conditions, the particle material is considered sand while at cruise it is considered fly ash. The particle properties at both takeoff and cruise conditions are shown in table (4). The particle initial injection velocity equals the corresponding flow velocity. The results include the particle trajectories, blade impact frequency, blade erosion rate and erosion parameter and penetration rate.
Table 4. The properties of the particles at both takeoff and cruise conditions. Montgomery [1]
Particle parameter Takeoff Cruise
Material Sand Fly ashes
Density (kg/m3) 2650 600
Concentration g/m3 0.176 0.0176
Particle mass flow rate (gm/s) 97.5 8.83
Particle initial velocity (m/s) 128 133
6.1. Takeoff Condition
Figure (4) shows the trajectory of particle having 50 mµ diameters at different locations. One can observe that, the particle injected towards the fan nose (location 1) impacts the nose, then it is acquired a radial outward velocity component till it enters the fan passage where it is influenced by the centrifugal force. The particle then impacts the blade pressure side near the trailing edge at about 40% the blade span with a velocity about 220 m/s and next leaves the domain. Particle injected at location 2 follows the air flow, and then has two successive impacts with the blade pressure side at impact velocity of 180 m/s for each impact. The first impact is at about 20% of the blade span and one third the chord beyond the leading edge, while the second is at about 25% of the blade span near the blade trailing edge. Particle injected from location 3 impacts the blade suction side close to the leading edge with a velocity of 165 m/s. Then, it leaves the domain with a higher circumferential velocity component. Particles injected from locations 4,5 show similar behavior as that of location 3 except with higher impact velocity (230 m/s, 280 m/s, respectively ). Particle injected from location 6 near the intake casing is exposed to a slight impact with the intake casing. It continues its motion and follows the air flow until it impacts the blade suction side at about one third of the chord from the leading edge with a velocity of 240 m/s.

American Journal of Aerospace Engineering 2015; 2(1-1): 47-63 51
Figure 4. Trajectory of particles with diameter =pd 50 mµ (Takeoff).

52 Ahmed Fayez EL-Saied et al.: Erosion of an Axial Transonic Fan due to Dust Ingestion
Figure 5. Trajectory of particles with diameter =pd 150 mµ (Takeoff).

American Journal of Aerospace Engineering 2015; 2(1-1): 47-63 53
Figure 6. Trajectory of particles with diameter =pd 250 mµ (Takeoff).

54 Ahmed Fayez EL-Saied et al.: Erosion of an Axial Transonic Fan due to Dust Ingestion
(a) For 50 mµ
(b) For 150 mµ
(c) For 250 mµ
Figure 7. The impact frequency and erosion rate, respectively, at take off, for different particle diameters.

American Journal of Aerospace Engineering 2015; 2(1-1): 47-63 55
Figure 8. Rosin-Rammler particle diameter distribution at takeoff.
(a) Impact frequency (imp/cm2gm) (b) Erosion parameter
(c) Erosion rate (mg/gm) (d) Penetration rate (mm/s)
Figure 9. Impact frequency, erosion parameter, erosion rate and penetration rate for takeoff Rosin-Rammler distribution.

56 Ahmed Fayez EL-Saied et al.: Erosion of an Axial Transonic Fan due to Dust Ingestion
The three-dimensional trajectories of particle diameters 150 and, 250 mµ are shown in figures (5) and (6), respectively. These particles can be seen to continue their motion unaffected by the flow field due to their high inertia until they impact the blade surface. Most of these particles have two successive impacts. The first impact is observed on the suction side while the second with the blade pressure side. The particle impacts the pressure side with higher velocity and at higher radial location than the suction side.
Figure (7) shows the impact frequency and erosion rate contours on both pressure and suction sides of the fan blade, at takeoff condition and for different particle sizes (50, 150 and 250 mµ ). For a small particle (50mµ ), the impact frequency and erosion rate have maximum values (1.16x10⁴ imp/cm2gm and 2.81x10⁻⁵ mg/gm) on the blade pressure side at about 12% span and near the trailing edge. As the particle size increases, the point of maximum impact frequency and erosion rate moves in the blade span-wise direction towards the tip and from trailing to leading edge. The impact frequency decreases with radial position on the blade and it is concentrated near the blade trailing edge up to about 45% of the span. This is due to the particles drift by their impacts with the fan nose. Small numbers of particles impact the blade suction side with low frequency. Moreover, the suction side impacts are generally limited to the leading edge of the outer part of the blade. The leading edge of both pressure and suction sides is exposed to impacts with moderate frequency. It is also noticed that, no particles impact the blade tip either on the suction or the pressure sides. This is due to the effect of the intake geometry which causes the particles to be deflected in radial inward direction.
The Rosin-Rammler particle diameter distribution shown in Figure (8), that representing particle sizes distribution in the Middle East [1], is assumed to predict the erosion rate due to sand particles on the fan blade. The calculated impact frequency for this distribution is shown in figure (9.a). In this figure, one can observe that, the pressure side is exposed to a great number of particle impacts than the suction side. The maximum impact frequency appears at the pressure side on two regions. One of them is at the blade tip between the mid-chord and the trailing edge. This is because the large particles impact the fan nose is migrate outward due to centrifugal force to this region. The other is at about 20% span, near the trailing edge. That is due to small particles that reflected from the fan nose. The particle impacts on the suction side are concentrated at the blade leading edge close to hub and spread towards the trailing edge close to tip. This spreading appears to be deeper with increasing the blade span. Figure (9.b) shows the distribution of the erosion parameter over the blade pressure and suction sides. From this figure, one can conclude that, in general the erosion parameter exhibits greater values on the pressure side than on the suction side. The maximum erosion parameter on the pressure side appears in a region near the blade tip and spreads downward the blade span and towards the blade trailing edge. This region is exposed to higher particle velocities than other regions on the blade surface.
The erosion rate of the fan blade due to the previously mentioned distribution is shown in figure (9.c). Along the blade span, the erosion rate is concentrated near both the trailing and leading edges of the pressure side and near the leading edge of the suction side. On the suction side, the upper half of the blade is exposed to erosion rate ranging from 6.6x10⁻⁶ to 1.3 x 10⁻⁵ mg/gm. Other regions on the suction side are less affected by erosion. On the pressure side, the region of maximum erosion rate appears at the corner of the blade between the tip and trailing edge. The value of the erosion rate reaches its maximum in this region, (about 3.34x10⁻⁵ mg/gm). This is because it is exposed to high frequency and high erosion parameter. Moreover, the region on the blade pressure side at about the upper third of the blade height and about 20% chord from the trailing edge shows an increased erosion rates as well. Also, one can see that, near the leading edge of the pressure side, the erosion rate contours are condensed and indicating a value about 1 x 10⁻⁵ along the span. The penetration rate contours on the fan blade are shown in figure (8.d). Its distribution is the same as the erosion rate with a maximum value of 4.1x10⁻⁷ mm/s at the upper and trailing edge corner of the blade pressure side.
6.2. Cruise Condition
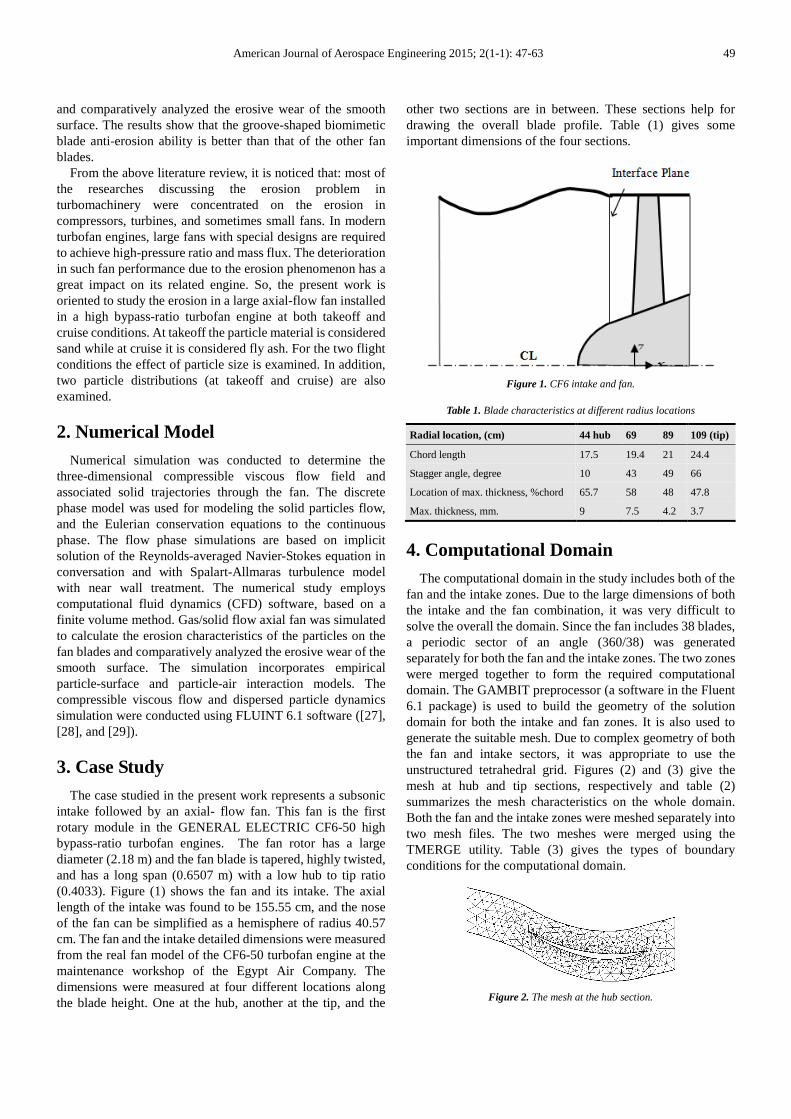
The trajectories of ash particles and associated erosion parameter at the cruise conditions are shown in figures (10) through (12). Figure (10) shows the trajectory of the 10 mµ diameter ash particles. From this figure, one can observe that the small size and small density of the ash particles makes the associated drag and inertia forces decrease. Thus, the particle trajectories will follow the corresponding streamline. Moreover, these particles acquire different velocities and degrees of turning similar to that of the carrier air flow. Particle injected from location 1 shows no impact with the fan nose because it is drifted by the carrier streamline. There are two successive impacts with the blade pressure side. The first one is at about one third of the chord and the second is near the trailing edge. Particle injected from location 2 shows two impacts with the blade pressure side. One is at the leading edge and the other is at the trailing edge. Particles injected from location 3 and 5 show a single impact with the blade pressure side at the leading edge. Particle injected from location 4 shows a single impact with the pressure side near the trailing edge. Particle injected from location 6 near the intake casing continues its motion and traverses the twisted blades without any impacts. From these trajectories, one can observe that the small ash particles mostly interact with the blade pressure side only even though they may impact more than once. That is because particles entering the fan domain show a tendency to travel from the blade suction side to the pressure side. As the relative velocity of the gas increases from the blade pressure side to the blade suction side, the relative velocity between the gas and particles will attain a minimum value near the pressure surface and maximum value near the suction surface for the same radial coordinates. Consequently, particles are subjected to a positive gradient from the suction surface to the pressure surface. In other
American Journal of Aerospace Engineering 2015; 2(1-1): 47-63 57
words, particles are driven towards the blade pressure side.
Figure 10. Trajectory of particles with diameter =pd 10 mµ ( Cruise ).

58 Ahmed Fayez EL-Saied et al.: Erosion of an Axial Transonic Fan due to Dust Ingestion
Figure 11. Trajectory of particles with diameter =pd 20 mµ ( Cruise ).

American Journal of Aerospace Engineering 2015; 2(1-1): 47-63 59
Figure 12. Trajectory of particles with diameter =pd 30 mµ ( Cruise ).

60 Ahmed Fayez EL-Saied et al.: Erosion of an Axial Transonic Fan due to Dust Ingestion
(a) For 10 mµ
(b) For 20 mµ
(c) For 30 mµ
Figure 13. The impact frequency and erosion rate, respectively, at cruise, for different particle diameters.

American Journal of Aerospace Engineering 2015; 2(1-1): 47-63 61
Figure 14. Rosin-Rammler particle diameter distribution at cruise.
(a) Impact frequency (imp/cm2gm) (b) Erosion parameter
(c) Erosion rate (mg/gm) (d) Penetration rate (mm/s)
Figure 15. Impact frequency, erosion parameter, erosion rate and penetration rate at cruise for Rosin-Rammler distribution.
Figures (11) and (12) show the trajectories of the 20 mµ and 30 mµ diameter ash particles. These trajectories are somewhat similar to that of the 10mµ particles. Most of these particles
impact the blade pressure side and a few of them impact the suction side at the leading edge.
Figure (13) shows the impact frequency and erosion rate

62 Ahmed Fayez EL-Saied et al.: Erosion of an Axial Transonic Fan due to Dust Ingestion
contours for the 10, 20 and 30 mµ diameters fly ash particles, respectively, at the cruise conditions. From this figure, it is noticed that most of the particles impact the blade pressure side.
For the 10 mµ diameter, the maximum impact frequency appears in two regions on the pressure side. One at the corner between the leading edge and the blade tip and the second between the hub and the blade trailing edge (about 2.7x10⁷ imp/cm2/gm). The leading edge of the pressure side is exposed to moderate impact frequency. The leading edge of the pressure side is exposed to maximum erosion rates in two regions, one at the tip and the other at the hub (about 5.9x10⁻⁸ mg/gm). Other locations on the leading edge are exposed to moderate erosion rates.
For 20 mµ diameter particles the maximum frequency appears at about 8% blade span on the pressure side at the inner half of the chord (about1.2x106 imp/cm2/gm). Some impacts with the blade leading edge are also shown at the pressure side. The blade suction side is exposed to few impacts. These impacts are concentrated at the leading edge of the blade suction side. One can observe that the maximum erosion rate is at the same region of maximum impact frequency on the pressure side (about 6.7x10⁻⁸ mg/gm). The suction side leading edge is exposed to small values of erosion.
For 30 mµ diameter particles, the pressure side is exposed to higher impacts and erosion than the suction side. The maximum frequency and erosion appear at about 10% from the blade span (about 5.8x10⁵ imp/cm2/gm and 2.5x10⁻⁷ mg/gm respectively). There are few impacts with pressure side leading edge causing small erosion rates of about 5x10⁻⁸ mg/gm. Both the frequency and erosion rate on the suction surface are limited to the leading edge.
The accumulative distribution of the particle size is shown in figure (14). This distribution represents a variation of the particle diameter from 5mµ to 30 mµ with the mean diameter at 15 mµ . The results of the erosion characteristics of this distribution are shown in figure (14). The impact frequency contours shown in figure (15.a) clarify that the pressure side is exposed to greater number of particles impacts than the suction side. Particles impact the suction side near the blade leading edge with a small frequency. The maximum frequency appears at the blade pressure side at two regions. The first is at the leading edge at about 50% of the upper blade span. The second region exists near the hub at the inner half of the blade chord with a value about 1.9x10⁸ imp/cm2/gm. The erosion mass parameter contours on both pressure and suction sides are shown in figure (15.b). One can observe condensed contours at the leading edge for both pressure and suction sides with moderate values. The maximum value exists at the corner between the hub and the pressure side trailing edge (about 2 mg/gm). The erosion and penetration rates on the fan blade due to the previously mentioned diameter distribution are shown in figures (15.c) and (15.d), respectively. One can observe high erosion and penetration rate values at the pressure side leading edge. The pressure side trailing edge is exposed to moderate values of erosion and penetration rates.
On the blade suction side, the erosion and penetration rates are limited to the blade leading edge at the upper half span.
7. Conclusion Regarding to the particulate flow, the effect of particle size
on the particle trajectory, impact location on the blade, and hence the erosion characteristics were investigated. The particles were sand at takeoff and fly ash at cruise conditions. The diameters of sand particles traced were 50, 150, and 250 µ m, while 10, 20, and 30 µ m were employed for fly ash. The general conclusions are summarized as follows:
7.1. At Takeoff Conditions
a) The deviation of the particle trajectories from the streamlines increased with increasing the particle size. Large size particles trajectories are greatly influenced by the centrifugal force and successively impacted the walls at high speeds and centrifuge faster after impacts.
b) The pressure side was exposed to a great number of particle impacts than the suction side.
c) Most of the large size sand particles had two successive impacts. The first impact was at the suction side while the second was at the blade pressure side.
d) The particle impacted the pressure side with higher velocity and at higher radial location than the suction side. After the first impact, small size particles were more influenced by the air flow field and therefore moved a certain longer distance before next impact.
e) The region of maximum impact frequency and erosion rate appeared on the pressure side at the corner formed by the blade tip and the trailing edge. This is due to the migration of large size particles to this region. The region of maximum erosion rate moved towards the blade leading edge and the blade tip as the particle size is increased.
7.2. At Cruise Conditions
a) The small size and small density of the fly ash particles reduced the associated drag and inertia forces. This caused the particle trajectories to follow the corresponding air flow streamlines. And therefore, these particles acquired velocities and degrees of turning 7 similar to that of the carrier air flow.
b) The ash particles mostly impacted the blade pressure side only. Two successive impacts were noticed at the pressure side, one at the leading edge and the other was at the trailing edge. That was because these small particles are subjected to a positive gradient from the suction surface to the pressure surface and therefore they were driven towards the blade pressure side.
c) The erosion and penetration rates were smaller compared with the takeoff conditions. The region of maximum erosion and penetration rate values appeared at the pressure side leading edge. The pressure side trailing

American Journal of Aerospace Engineering 2015; 2(1-1): 47-63 63
edge was exposed to moderate values of erosion and penetration rates.
References [1] Montgomery, J. E., and Clark, J. M., Jun., “Dust Erosion
Parameters for a Gas Turbine,” Soc. of Automotive Engineers Summer Meeting, 1962, Preprint 538A.
[2] Tabakoff, W., and Hamed, A., “Temperature Effect On Particle Dynamics And Erosion In Radial Inflow Turbine,” J. Turbomachinery, Vol. 110, APRIL 1988, PP. 258-264.
[3] Tabakoff, W., Hamed, A., and Metwally M., “Effect Of Particle Size Distribution On Particle Dynamics And Blade Erosion In Axial Flow Turbines,” J. Engineering For Gas Turbines And Power, October 1991, Vol. 113.
[4] Hamed, A. “An Investigation In The Variance In Particle Surface Interactions And Their Effects In Gas Turbines,”. Journal of Engineering For Gas Turbines And Power, APRIL 1992, Vol. 114, PP. 235-241.
[5] Hamed, A., Tabakoff, W., Richard B. Rivir, Kaushik Das, and Puneet Arora, ”Turbine Blade Surface Deterioration By Erosion”, Journal of Turbomachinery, July 2005, Vol. 127, Issue 3, pp. 445-452.
[6] Japikse, D., "Review- Progress in Numerical Turbo-machinery Analysis" ASME J. of Fluids Engineering, pp 592-606, 1976.
[7] Wulf, R. H., Kramer, W. H., and Paas, J. E., "CF6-6D Jet Engine Performance Deterioration" NASA/CR-159786, NASA, 1980.
[8] Peterson, R. C., "Design Features for Performance Retention in the CFM56 Engine" Turbomachinery Performance Deterioration FED, Vol. 37, the AIAA/ASME 4th Joint Fluid Mechanics Plasma Dynamics and Lasers Conference, Atlanta, Georgia, 1986.
[9] Neilson J. H. and Gilchrist A., “Erosion By A Stream Of Solid Particles “, Wear, Π , 1968 .
[10] Tabakoff, W., and Hussein, M. F., "Computation and Plotting of Solid Particle Flow In Rotating Cascades" Computers and Fluids, Vol. 2, 1974.
[11] Elsayed, A. F., and Brown, A., "Computer Prediction of Erosion Damage in Gas Turbine" ASME Paper 87-GT-127, 32nd ASME Int. Gas Turbine Conf., California, USA, 1987.
[12] Hamed, A., "Particle Dynamics of Inlet Flow Fields with Swirling Vanes" Journal of Aircraft, Vol. 19, No. 9, pp 707-712, 1982.
[13] Beacher B., Tabakoff W. and Hamed A. "Improved Particle Trajectory Calculations through Turbo-machinery Affected by Coal Ash Particles.",ASME Journal of Engineering for Power, vol. 104, pp 64-68, 1982.
[14] Hamed, A., and Fowler, S., "Erosion Pattern of Twisted Blades by Particle Laden Flows" ASME J. of Engineering for Power, Vol.105, pp839-843, 1983.
[15] Clevenger, W. B., Jr., and Tabakoff, W., "Similarity Parameters for Comparing Erosive Particle Trajectories in Hot Air and Cold Air Radial Inflow Turbines", ASME Paper 74-GT-65, 1974.
[16] Hussein, M. F., and Tabakoff, W., "Computer Program for Calculations of Particle Trajectories through a Rotating Cascade" Univ. of Cincinnati, Cincinnati, Ohio, USA, Tech. Report 76-47, 1976.
[17] Elsayed, A. F., and Rashed, M. I. I., "Erosion in Centrifugal Compressors" Paper No.55, Proc. 5th Int. Conf. on Erosion by Liquid and Solid Impact (ELSI V), Newnham Collage, Cambridge Univ., Uk, 1979.
[18] Elsayed, A. F., and Rashed, M. I. I., "Computation of Gas Flow in Centrifugal Compressors Used in Helicopters." Proc. of 5th Int. symposium on Air Breathing Engines, Bangalore, India, 1980.
[19] Maxwell, B. R., "Particle Flow in Blade Passage of Turbo-machinery with Application of Laser-Doppler Velocimetry", NASA CR-134543, 1974.
[20] Elsayed, A. F., and Rouleau, W. T., "Three Dimensional Viscous Particulate Flow in a Typical Turbo-expander", Int. J. of Energy Systems, Vol.5, No.2, 1985.
[21] Elsayed A. F., "Aerodynamics/Aero-elastic Behavior of Eroded Axial Turbines" 2nd Int. Symposium on Transport Phenomena, Dynamics and Design of Rotating Machinery, Honolulu, Hawaii, USA, 1988.
[22] Suzuki, M., Inaba, K., and Akoto Yamamoto, M.” Numerical Simulation of Sand Erosion Phenomena in Rotor/Stator Interaction of Compressor”, Proceedings of the 8th International Symposium on Experimental and Computational Aerothermodynamics of Internal Flows, Lyon, July 2007.
[23] Corsini, A., Marchegian, A., Rispoli, F., Venturini, P., and Sheard, A. “Predicting Blade Leading Edge Erosion in an Axial Induced Draft Fan”, Journal of Engineering for Gas Turbine and Power, published online January 30, 2012.
[24] Brun, K., Nored , M., and Kurz, R. “ Analysis of Solid Particle Surface Impact Behavior in Turbo-machines to Assess Blade Erosion and Fouling”, Proceedings of the Forty-First Turbo-machinery Symposium September 24-27, 2012, Houston, Texas.
[25] Carbonetto, B. and Hoch, V.” Advances in Erosion Prediction of an Axial Flow Expander”, Proceeding of The 28th Turbo-machinery Symposium.
[26] Zhang, J., Han, Z., Cao, H., Yin, W., Niu, S., and Wang, H. “Numerical Analysis of Erosion Caused by Biomimetic Axial Fan Blade”, Hindawi Publishing Corporation, Advances in Materials Science and Engineering, Volume 2013, Article ID 254305, 9 pages.
[27] Fluent 6.1 Documentation (User Guide Manual).
[28] Zohier, H. Z., "Solid Particulate Flow in an Axial Transonic Fan In a High Bypass Turbofan Engine", M.Sc. Thesis, Zagazig University, Egypt, 2006.
[29] Elsayed, A. F, Gobran M. H., and Zohier H., "Three-Dimensional Flow in A Transonic Axial Flow Fan of A High Bypass Ratio Turbofan Engine", 11th International Conference On Aerospace Science and Aviation Technology, Military College, Cairo, Egypt, 17-19, May 2005.