
ERDC/CERL TR-08-21, Lipari Landfill Piping Network ... · ERDC/CERL TR-08-21 December 2008 Lipari...
77
ERDC/CERL TR-08-21 Lipari Landfill Piping Network Corrosion Condition Assessment and Service Life Prediction Analysis Charles P. Marsh, Thomas A. Carlson, Robert A. Weber, Carl A. Feickert, and Peter B. Stynoski December 2008 Construction Engineering Research Laboratory Approved for public release; distribution is unlimited.
-
Upload
trinhkhuong -
Category
Documents
-
view
215 -
download
0
Transcript of ERDC/CERL TR-08-21, Lipari Landfill Piping Network ... · ERDC/CERL TR-08-21 December 2008 Lipari...

ERD
C/CE
RL
TR-0
8-2
1
Lipari Landfill Piping Network Corrosion Condition Assessment and Service Life Prediction Analysis
Charles P. Marsh, Thomas A. Carlson, Robert A. Weber, Carl A. Feickert, and Peter B. Stynoski
December 2008
Con
stru
ctio
n E
ngi
nee
rin
g R
esea
rch
Lab
orat
ory
Approved for public release; distribution is unlimited.

ERDC/CERL TR-08-21 December 2008
Lipari Landfill Piping Network Corrosion Condition Assessment and Service Life Prediction Analysis
Charles P. Marsh, Thomas A. Carlson, Carl A. Feickert, and Peter B. Stynoski
Construction Engineering Research Laboratory U.S. Army Engineer Research and Development Center 2902 Newmark Drive Champaign, IL 61822
Robert A. Weber
Robert A. Weber Associates Champaign, IL 61821
Final report
Approved for public release; distribution is unlimited.
Prepared for U.S. Army Corps of Engineers Washington, DC 20314-1000
Under EA Order W25PHS61912360

ERDC/CERL TR-08-21 ii
Abstract: The Lipari Landfill, located in Mullica Hill, NJ, accepted haz-ardous chemical waste for most of its service life, until operations were discontinued in 1971 by the New Jersey Department of Environmental Protection. After being designated as a federal Superfund site in 1982, a containment structure was built starting in 1983. Further remediation continued into the 1990s, including the construction of injection and ex-traction wells to eliminate chemical residues in the contained ground wa-ter. The water circulated through the piping network of the injec-tion/extraction well system has been determined to be corrosive, which could lead to a premature failure of the pipe. The objective of this study was to analyze the current condition of the piping network and changes that have occurred over time, to determine the corrosion rate, and to esti-mate the remaining service life of the pipes. Owing to the limited amount of pipe material-loss data available, various analytical methods were used to interpret those data and develop a supportable engineering judgment. The report describes these analyses and presents the data obtained.
DISCLAIMER: The contents of this report are not to be used for advertising, publication, or promotional purposes. Citation of trade names does not constitute an official endorsement or approval of the use of such commercial products. All product names and trademarks cited are the property of their respective owners. The findings of this report are not to be construed as an official Department of the Army position unless so designated by other authorized documents. DESTROY THIS REPORT WHEN NO LONGER NEEDED. DO NOT RETURN IT TO THE ORIGINATOR.

ERDC/CERL TR-08-21 iii
Table of Contents List of Figures and Tables ......................................................................................................................v
Preface...................................................................................................................................................vii
Unit Conversion Factors......................................................................................................................viii
1 Introduction..................................................................................................................................... 1 1.1 Background.................................................................................................................... 1 1.2 Objective ........................................................................................................................ 2 1.3 Approach ........................................................................................................................ 2
2 Technical Investigation.................................................................................................................. 4 2.1 Site overview.................................................................................................................. 4 2.2 Calculation of corrosion rates ....................................................................................... 5
2.2.1 Initial and final thickness corrosion rate calculation ................................................ 5 2.2.2 Graphical trend line corrosion rate calculation......................................................... 5
3 Determination of Corrosion Rates................................................................................................ 6 3.1 Initial condition assessment ......................................................................................... 6
3.1.1 Method ........................................................................................................................ 6 3.1.2 Data ............................................................................................................................. 6 3.1.3 Analysis........................................................................................................................ 7
3.2 Current condition assessment...................................................................................... 8 3.2.1 Method ........................................................................................................................ 8 3.2.2 Data ............................................................................................................................. 9 3.2.3 Analysis........................................................................................................................ 9
3.3 Statistical analysis of corrosion rate ..........................................................................12 3.3.1 Method ......................................................................................................................12 3.3.2 Data ...........................................................................................................................16 3.3.3 Analysis......................................................................................................................19
3.4 Corrosion coupon testing ............................................................................................ 24 3.4.1 Method ......................................................................................................................24 3.4.2 Data ...........................................................................................................................24 3.4.3 Analysis......................................................................................................................27
4 Results and Discussion................................................................................................................28 4.1 Summary of corrosion rates........................................................................................28 4.2 Evaluation of corrosion rate methods ........................................................................28 4.3 Determination of minimum pipe thickness................................................................30
5 Conclusions and Recommendations .........................................................................................31 5.1 Conclusions.................................................................................................................. 31 5.2 Recommendations ......................................................................................................32

ERDC/CERL TR-08-21 iv
References............................................................................................................................................33
Appendix A: Initial Condition Assessment Data...............................................................................35
Appendix B: Fifteen-Month Continuous Monitoring Data...............................................................37
Appendix C: Site Photographs............................................................................................................61
Report Documentation Page
ERDC/CERL TR-08-21 v
List of Figures and Tables
Figures
Figure 1. Aerial view showing location and layout of Lipari Landfill site, NJ. ........................................ 4 Figure 2. Simplified cross section of header piping system................................................................... 5 Figure 3. View of the pipe to be ultrasonically tested showing trace wire used to prevent pipe from freezing. ..................................................................................................................................... 8 Figure 4. Average thickness measurements for west header during 15-month current condition assessment................................................................................................................................ 9 Figure 5. Average thickness measurements for central header during 15-month current condition assessment.............................................................................................................................. 10 Figure 6. Average thickness measurements for east header during 15-month current condition assessment.............................................................................................................................. 10 Figure 7. Thickness measurements for the west header taken at location 13..................................13 Figure 8. Thickness measurements for the central header taken at location 6................................13 Figure 9. Thickness measurements for the central header taken at location 1................................ 14 Figure 10. Illustrative example of EVS analysis for well-behaved data (Castillo et al. 2005). ..........15 Figure 11. Illustrative example of straight-line graph and metric parameter (0.998) used to determine a corrosion rate (Castillo et al. 2005).............................................................................. 16 Figure 12. EVS analysis applied to all top header thickness measurements from December 29, 2007................................................................................................................................. 17 Figure 13. Compilation of extreme-value statistics for all top thickness measurements for all dates measurements were taken...................................................................................................... 17 Figure 14. EVS trend for all top ultrasonic thickness measurements for the duration of the assessment period using a metric of 0.50............................................................................................18 Figure 15. EVS trend for all bottom ultrasonic thickness measurements for the duration of the assessment period using a metric of 0.50. ....................................................................................19 Figure 16. Maximum and minimum ultrasonic thickness readings for all the bottom measurements. ........................................................................................................................................20 Figure 17. Maximum and minimum ultrasonic thickness readings for all the top measurements. ........................................................................................................................................ 21 Figure 18. Extreme-value statistics for top and bottom of the west header.......................................22 Figure 19. Extreme-value statistics for top and bottom of the central header...................................22 Figure 20. Extreme-value statistics for top and bottom of the east header. ......................................23 Figure 21. View of the backside of the test coupon attached to the valve stem. ..............................25 Figure 22. Photograph of test coupon about to be inserted into the west header............................25 Figure 23. Photograph of the test coupon after 6 months in the west header..................................26

ERDC/CERL TR-08-21 vi
Tables
Table 1. Summary of 62 initial condition assessment ultrasonic wall thickness measurements taken March 20, 2007, and calculation of corrosion rates (units in inches)......................................................................................................................................................... 7 Table 2. Corrosion rates for each header based on decreasing thickness trends. ...........................11 Table 3. Summary of 1,426 current condition assessment ultrasonic wall thickness measurements taken during 15 months, and calculation of corrosion rates (units in inches).......................................................................................................................................................12 Table 4. Summary of corrosion rates by the EVS method.................................................................... 24 Table 5. Measurements of the corrosion coupon from the west header............................................26 Table 6. Summary of corrosion rates and remaining pipe life. ............................................................29 Table 7. Expected remaining header service life (years). .....................................................................32

ERDC/CERL TR-08-21 vii
Preface
This study was conducted for the U.S. Army Engineer District Philadelphia under Economy Act Order W25PHS61912360, “CECER Pipe Study,” dated 7 August 2006. The technical monitor was Francisco Barba, CENAP-RM-B.
The work was performed by the Materials and Structures Branch (CF-M) of the Facilities Division (CF), U.S. Army Engineer Research and Devel-opment Center – Construction Engineering Research Laboratory (ERDC-CERL). At the time of publication, Vicki L. Van Blaricum was Chief, CEERD-CF-M; L. Michael Golish was Chief, CEERD-CF; and Martin J. Sa-voie was the Technical Director for Installations, CEERD-CV. The Deputy Director of ERDC-CERL was Dr. Kirankumar Topudurti and the Director was Dr. Ilker Adiguzel.
Daryl R. Salomon, Lipari Landfill Project Office, and onsite technicians Bob Scott, Ken Herwig, Mark Musser, Mike Warrington, and D. Teidman, are gratefully acknowledged for their efforts in collecting the raw field data that was necessary for performing the analysis.
COL Gary E. Johnston was the Commander and Executive Director of ERDC, and Dr. James R. Houston was the Director.
ERDC/CERL TR-08-21 viii
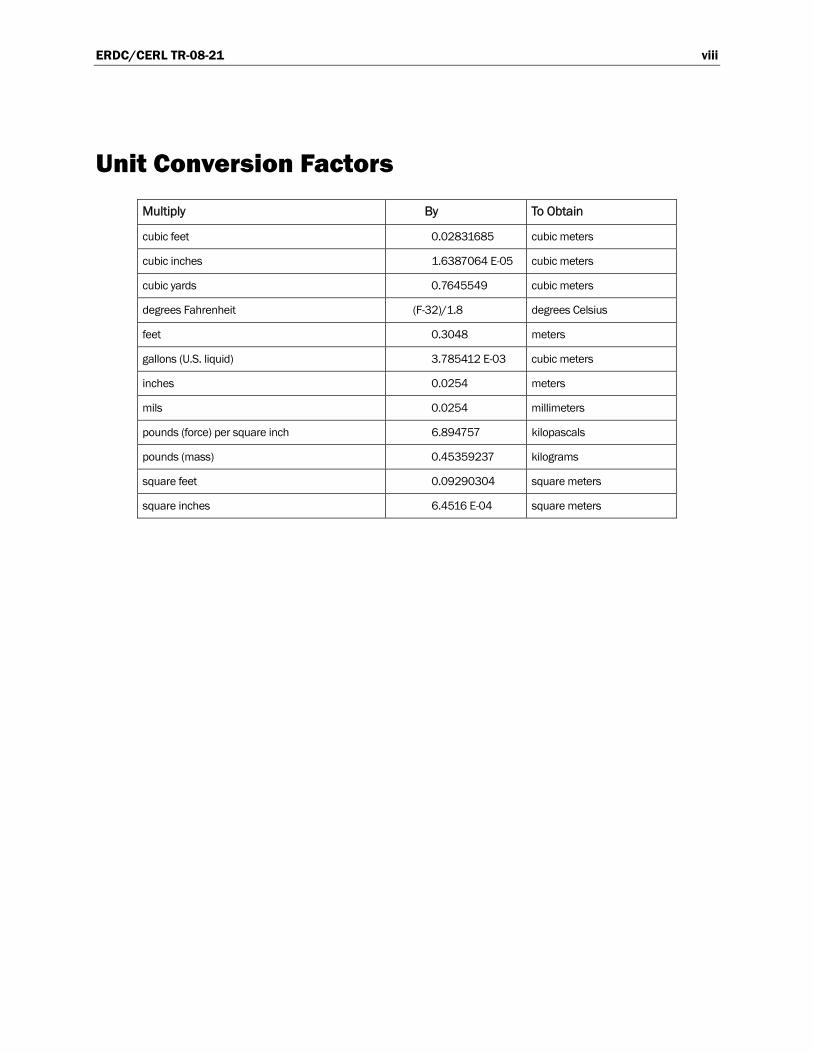
Unit Conversion Factors
Multiply By To Obtain
cubic feet 0.02831685 cubic meters
cubic inches 1.6387064 E-05 cubic meters
cubic yards 0.7645549 cubic meters
degrees Fahrenheit (F-32)/1.8 degrees Celsius
feet 0.3048 meters
gallons (U.S. liquid) 3.785412 E-03 cubic meters
inches 0.0254 meters
mils 0.0254 millimeters
pounds (force) per square inch 6.894757 kilopascals
pounds (mass) 0.45359237 kilograms
square feet 0.09290304 square meters
square inches 6.4516 E-04 square meters

ERDC/CERL TR-08-21 1
1 Introduction
1.1 Background
The Lipari Landfill site, located in Mullica Hill, NJ, began operations in 1958 as a sand and gravel quarry. After 2 years it was decided to convert the pit into a landfill operation. From 1960 to 1970 the Lipari Landfill ac-cepted municipal solid waste, solid chemical waste, and liquid chemical waste from the surrounding communities and from as far away as Phila-delphia, PA, and Camden, NJ. The landfill was closed to liquid dumping in 1970 because water-soluble contaminants had begun leaking into Alcyon Lake through the Chestnut Branch. In 1971 the Lipari Landfill was closed permanently by the New Jersey Department of Environmental Protection.
The U.S. Environmental Protection Agency (EPA) declared the Lipari Landfill a Superfund site in 1982. In 1983, construction began on a ben-tonite clay cutoff wall and high-density polyethylene (HDPE) landfill cap for the site. This structure stopped the leaching of contaminants into the surrounding ecosystem. In 1989 a contract was awarded to Bechtel Corp. to install injection and extraction wells, and to construct a plant for remov-ing contaminants from the water through carbon filtration and air strip-ping. Pumping of ground water began in 1993. In 1994, remediation was begun in creek and lake areas outside of the landfill.
The extraction system consists of a series of three headers that collect ground water from 26 wells. The west header is 630 ft, the central header is 720 ft, and the east header is 660 ft (2,010 ft total). The headers are still the original Schedule 40 steel pipes that had an original wall thickness of 0.237 in. (nominal). In 2001, the carbon steel branch line piping to the headers was replaced with stainless steel components. Extraction wells with trash screens were replaced between 2002 and 2005 due to catastro-phic screen collapses caused by heavy obstructions. The replacement wells, based on a stronger design, are referred to at the site as the third-generation wells. These third-generation dual-phase wells included one additional well (E-24B). A new injection gallery was installed in 2006 to help flush previously unsaturated (high-elevation) contaminated trash.
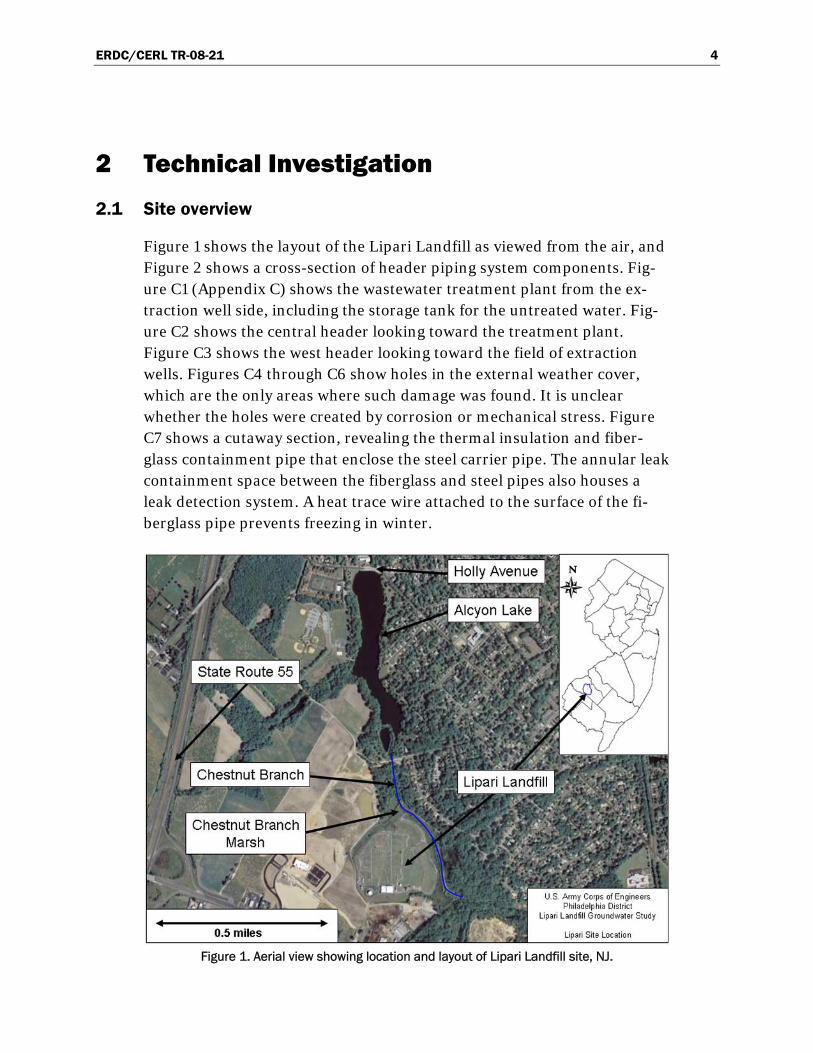
The EPA expressed concern that the corrosion process found in the origi-nal carbon steel branch lines could also be reducing the wall thickness of
ERDC/CERL TR-08-21 2
the original carbon steel 4 in. (nominal inner diameter) header piping, some of which is buried underground. U.S. Army Engineer District Phila-delphia (Philadelphia District), the EPA, and the New Jersey Department of Environmental Protection are concerned about the system‘s condition and its ability to remain functional without major repair or replacement.
The U.S. Army Engineer Research and Development Center – Construc-tion Engineering Research Laboratory (ERDC-CERL) was tasked by the EPA, through Philadelphia District, to assess the condition of Lipari ex-traction system components and, based on any identified corrosion effects, calculate a supportable estimate of remaining service life before steel header piping materials require replacement.
1.2 Objective
The objective of this study was to analyze the current condition of the pip-ing network and changes that have occurred over time, to determine the corrosion rate, and to estimate the remaining service life of the pipes.
1.3 Approach
A site inspection trip was made to perform an initial condition assessment of the plant and headers, and record initial thickness measurements of the steel carrier pipes.* That work is documented in ERDC-CERL Contract Report CR-07-1 (Weber 2007). The original pipe wall thicknesses and the initial condition assessment measurements provided the basis for estimat-ing corrosion rates for each pipe over the previous 14 years.† Subsequent thickness measurements made during the next 15 months provided data for calculating representative short-term pipe corrosion rates. Averages of the pipe thicknesses recorded during those 15 months supported the calcu-lation of a refined corrosion-rate estimate for the previous 14 years. Addi-tionally, two corrosion analyses using an advanced statistical method and minimum and maximum thickness averages were also completed. Finally, a test coupon was designed and inserted into the flow stream of one header, providing two additional short-term corrosion rates for the inside of that pipe. Because it was probable that the pumped water was not ho-mogenous, and the header pipes were at different elevations above ground
* As used here, “initial” indicates the condition of the pipe(s) at the start of this study, which began ap-proximately 14 years after the installation of the pipe.
† As used here, “original” indicates the condition of the pipe(s) when installed, which was approximately 14 years before the start of this study.

ERDC/CERL TR-08-21 3
level, corrosion rates for each pipe were determined independently where possible. An exception to this approach was made for part of the statistical analysis, where data for all pipes were added together in order to obtain a larger data set.
ERDC/CERL TR-08-21 4
2 Technical Investigation
2.1 Site overview
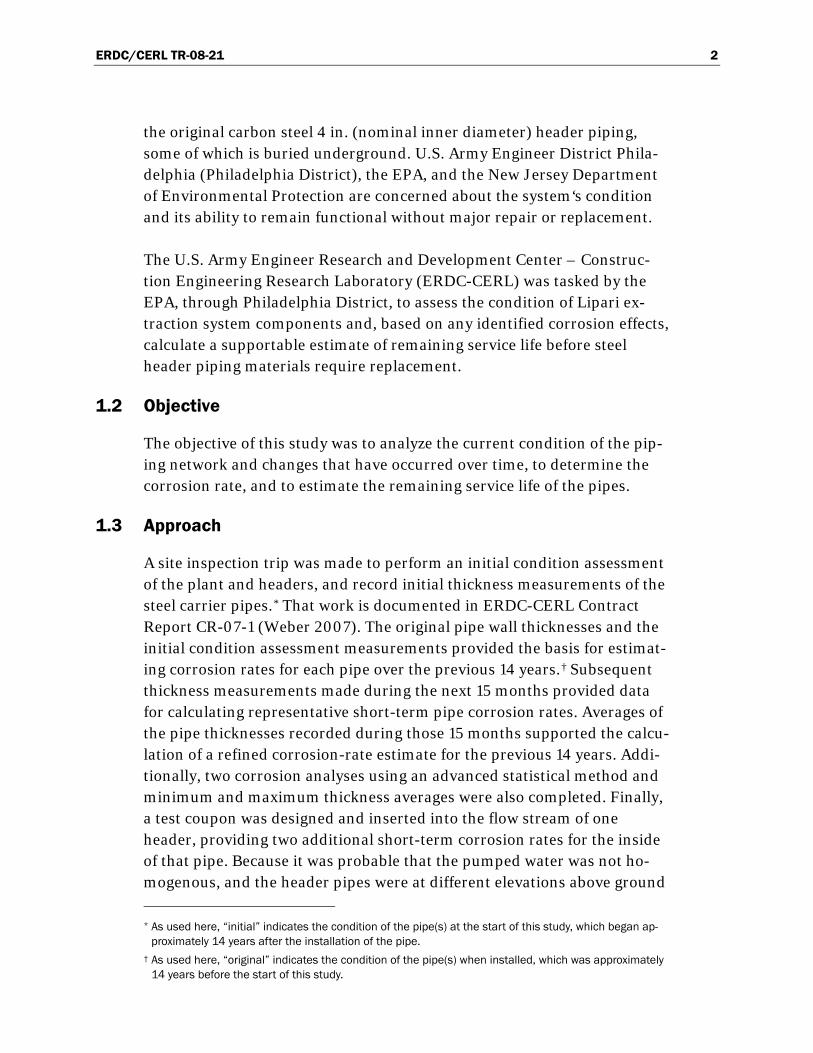
Figure 1 shows the layout of the Lipari Landfill as viewed from the air, and Figure 2 shows a cross-section of header piping system components. Fig-ure C1 (Appendix C) shows the wastewater treatment plant from the ex-traction well side, including the storage tank for the untreated water. Fig-ure C2 shows the central header looking toward the treatment plant. Figure C3 shows the west header looking toward the field of extraction wells. Figures C4 through C6 show holes in the external weather cover, which are the only areas where such damage was found. It is unclear whether the holes were created by corrosion or mechanical stress. Figure C7 shows a cutaway section, revealing the thermal insulation and fiber-glass containment pipe that enclose the steel carrier pipe. The annular leak containment space between the fiberglass and steel pipes also houses a leak detection system. A heat trace wire attached to the surface of the fi-berglass pipe prevents freezing in winter.
Figure 1. Aerial view showing location and layout of Lipari Landfill site, NJ.

ERDC/CERL TR-08-21 5
Figure 2. Simplified cross section of header piping system.
2.2 Calculation of corrosion rates
In this report, corrosion rates are given in units of mils per year (mpy). This is the thickness of steel pipe wall lost per year, as measured in one-thousandths of an inch. Corrosion rates were calculated in one of two ways, as described below.
2.2.1 Initial and final thickness corrosion rate calculation
If the initial and final pipe wall thicknesses (in inches) are known for a particular span of time, the corrosion rate can be estimated by subtracting the final thickness from the initial thickness to determine the amount of wall thickness lost between the measurement dates. That amount can be divided by the number of years between the measurements to express the value as a material-loss rate. The result, in turn, is multiplied by 1,000 to get express corrosion rate in terms of mils per year.
2.2.2 Graphical trend line corrosion rate calculation
If the pipe wall thickness measurements are plotted graphically versus time (number of days) and a trend line slope is determined, the corrosion rate may be calculated by multiplying that slope by 365 days, and then 1,000, to determine the rate in terms of mils per year (mpy).

ERDC/CERL TR-08-21 6
3 Determination of Corrosion Rates
3.1 Initial condition assessment
3.1.1 Method
For purposes of the initial assessment, the three header pipes were divided either into 10 or 11 inspection sections with an accompanying inspection point. The aluminum weather shield was removed, and the insulation and fiberglass protective shell were cut back to expose the steel carrier pipe for ultrasonic inspection. Sections of the steel carrier pipe were inspected us-ing ultrasonic wall thickness measurements taken at two positions — one near the top of the pipe and one near the bottom. Thus, the total number of inspection points for all three pipes was 31, while the total number of thickness measurements was 62. The ultrasonic thickness measurements were conducted according to the recommendations contained in the American Society for Nondestructive Testing (ASNT) handbook, Nonde-structive Testing Handbook, Third Edition: Volume 7, Ultrasonic Testing (ASNT 2007). Onsite instruction in application of the ultrasonic method was provided by an independent consultant before the initial condition as-sessment began.
Ultrasonic thickness measurement of pipes like those at the Lipari Landfill involve the placement of a transducer against the exterior of the pipe wall using a coupling agent such as grease, petroleum jelly, or oil for improved signal transmission. The ultrasonic signal passes through the wall of the pipe, reflects off the inside surface, and returns to the transducer. The wall thickness is calculated using the elapsed time between signal emission and reception with respect to the speed of sound in the pipe material. Also, a calibration block of known thickness is measured intermittently during pipe wall thickness measurement to verify the accuracy of the equipment. For this work, the calibration block was provided by ERDC-CERL.
3.1.2 Data
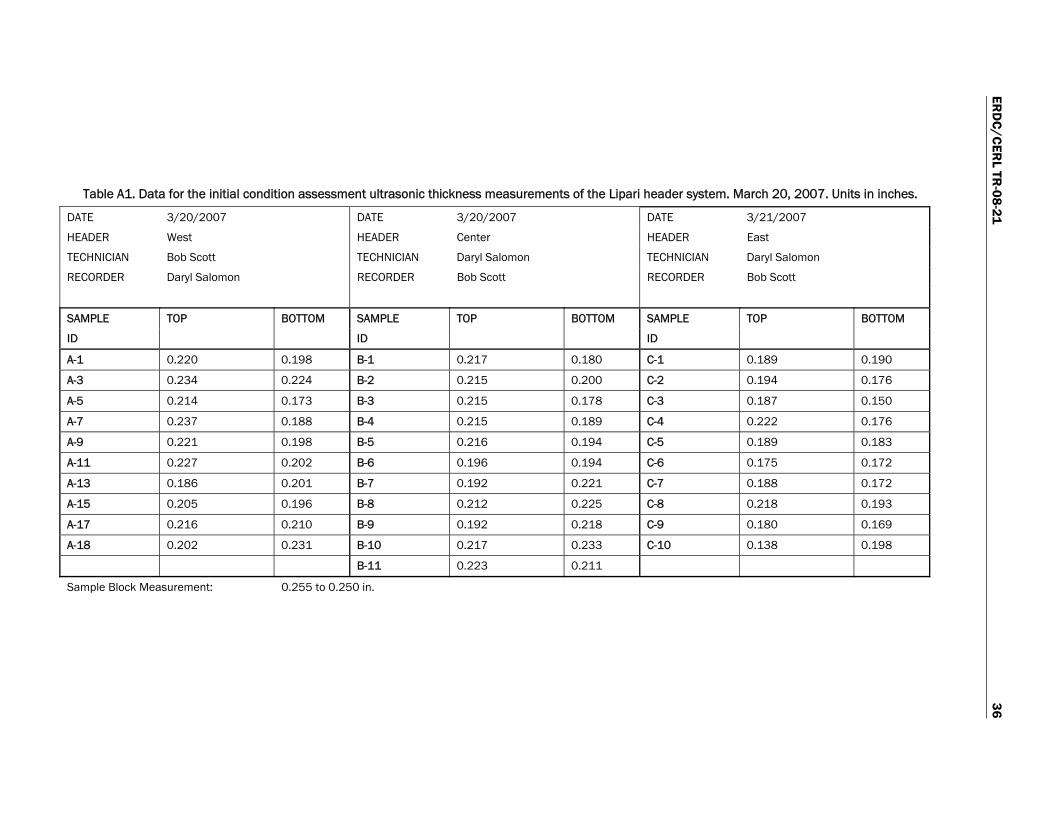
The initial thickness measurements were taken on March 20, 2007. The thickness of the pipe at each point is recorded in Appendix A, Table A1. The lower numbered test point positions are closer to the plant and stor-age tank and increase going away from the plant.
ERDC/CERL TR-08-21 7
3.1.3 Analysis
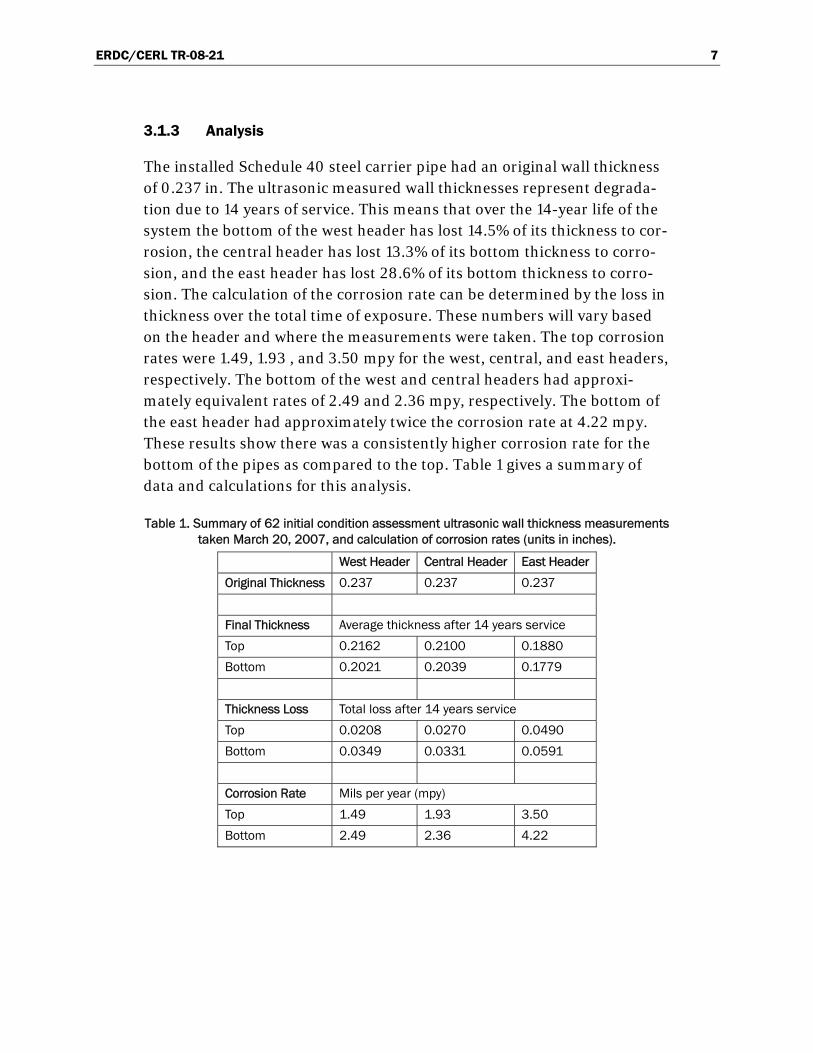
The installed Schedule 40 steel carrier pipe had an original wall thickness of 0.237 in. The ultrasonic measured wall thicknesses represent degrada-tion due to 14 years of service. This means that over the 14-year life of the system the bottom of the west header has lost 14.5% of its thickness to cor-rosion, the central header has lost 13.3% of its bottom thickness to corro-sion, and the east header has lost 28.6% of its bottom thickness to corro-sion. The calculation of the corrosion rate can be determined by the loss in thickness over the total time of exposure. These numbers will vary based on the header and where the measurements were taken. The top corrosion rates were 1.49, 1.93 , and 3.50 mpy for the west, central, and east headers, respectively. The bottom of the west and central headers had approxi-mately equivalent rates of 2.49 and 2.36 mpy, respectively. The bottom of the east header had approximately twice the corrosion rate at 4.22 mpy. These results show there was a consistently higher corrosion rate for the bottom of the pipes as compared to the top. Table 1 gives a summary of data and calculations for this analysis.
Table 1. Summary of 62 initial condition assessment ultrasonic wall thickness measurements taken March 20, 2007, and calculation of corrosion rates (units in inches).
West Header Central Header East Header
Original Thickness 0.237 0.237 0.237
Final Thickness Average thickness after 14 years service
Top 0.2162 0.2100 0.1880
Bottom 0.2021 0.2039 0.1779
Thickness Loss Total loss after 14 years service
Top 0.0208 0.0270 0.0490
Bottom 0.0349 0.0331 0.0591
Corrosion Rate Mils per year (mpy)
Top 1.49 1.93 3.50
Bottom 2.49 2.36 4.22
ERDC/CERL TR-08-21 8
3.2 Current condition assessment
3.2.1 Method
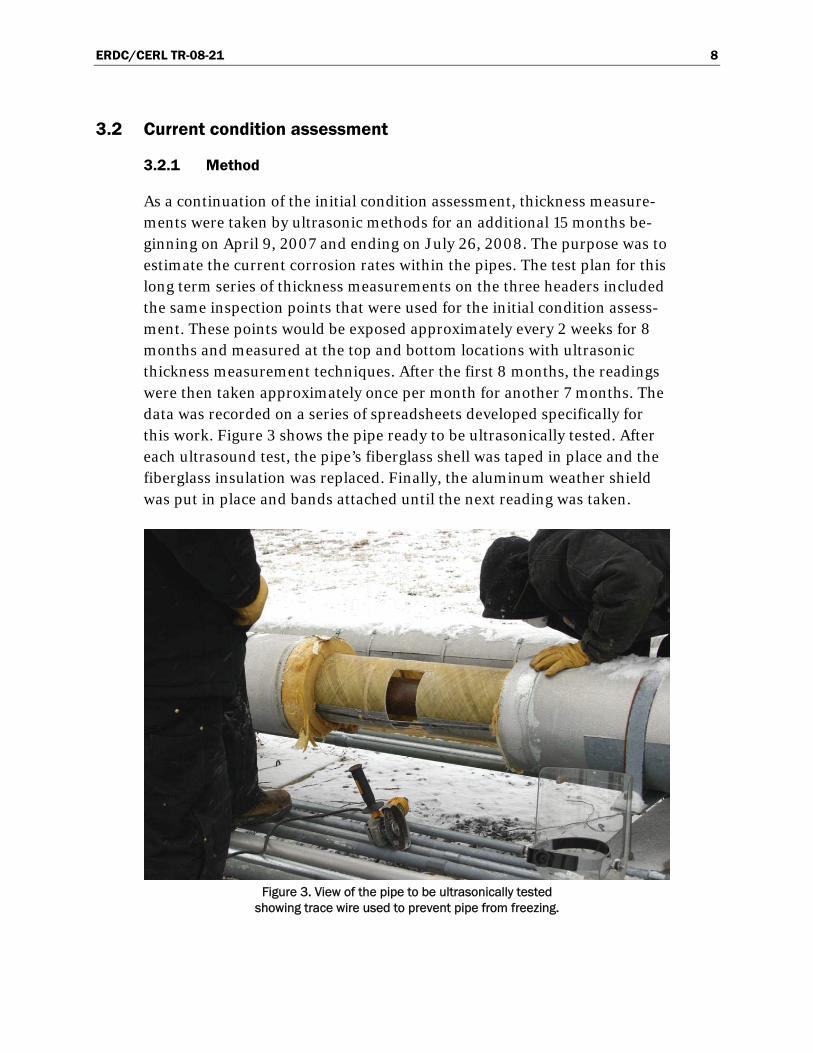
As a continuation of the initial condition assessment, thickness measure-ments were taken by ultrasonic methods for an additional 15 months be-ginning on April 9, 2007 and ending on July 26, 2008. The purpose was to estimate the current corrosion rates within the pipes. The test plan for this long term series of thickness measurements on the three headers included the same inspection points that were used for the initial condition assess-ment. These points would be exposed approximately every 2 weeks for 8 months and measured at the top and bottom locations with ultrasonic thickness measurement techniques. After the first 8 months, the readings were then taken approximately once per month for another 7 months. The data was recorded on a series of spreadsheets developed specifically for this work. Figure 3 shows the pipe ready to be ultrasonically tested. After each ultrasound test, the pipe’s fiberglass shell was taped in place and the fiberglass insulation was replaced. Finally, the aluminum weather shield was put in place and bands attached until the next reading was taken.
Figure 3. View of the pipe to be ultrasonically tested
showing trace wire used to prevent pipe from freezing.

ERDC/CERL TR-08-21 9
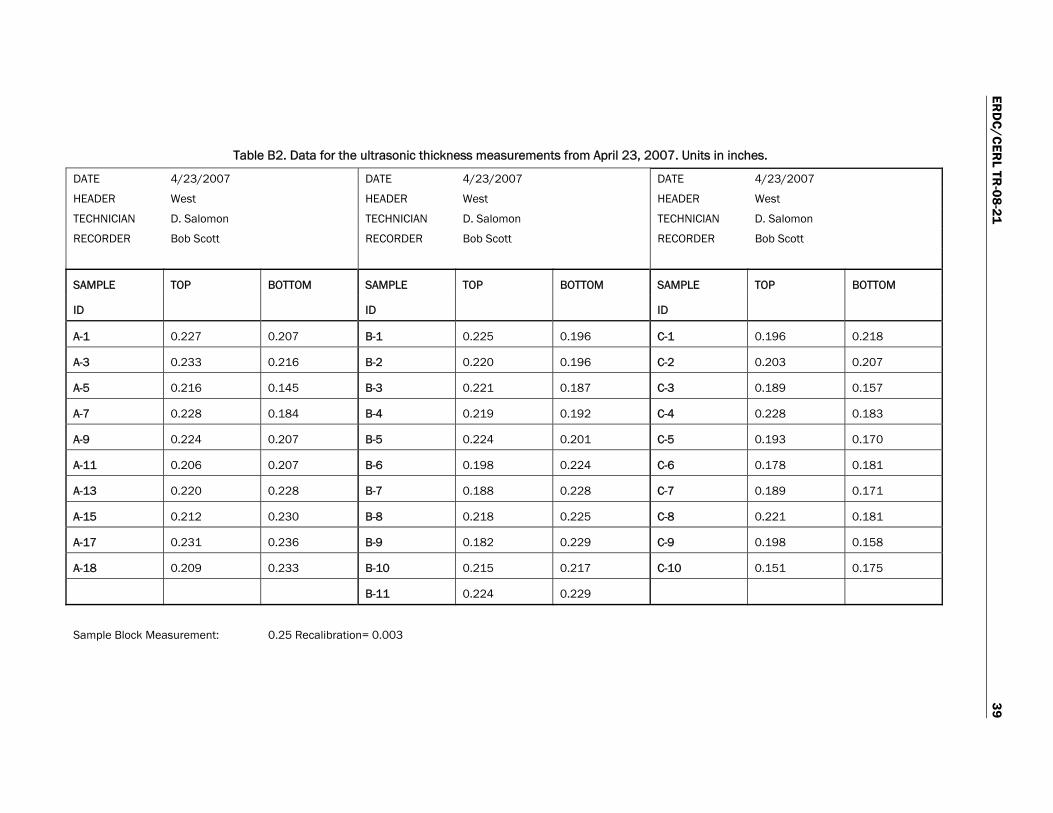
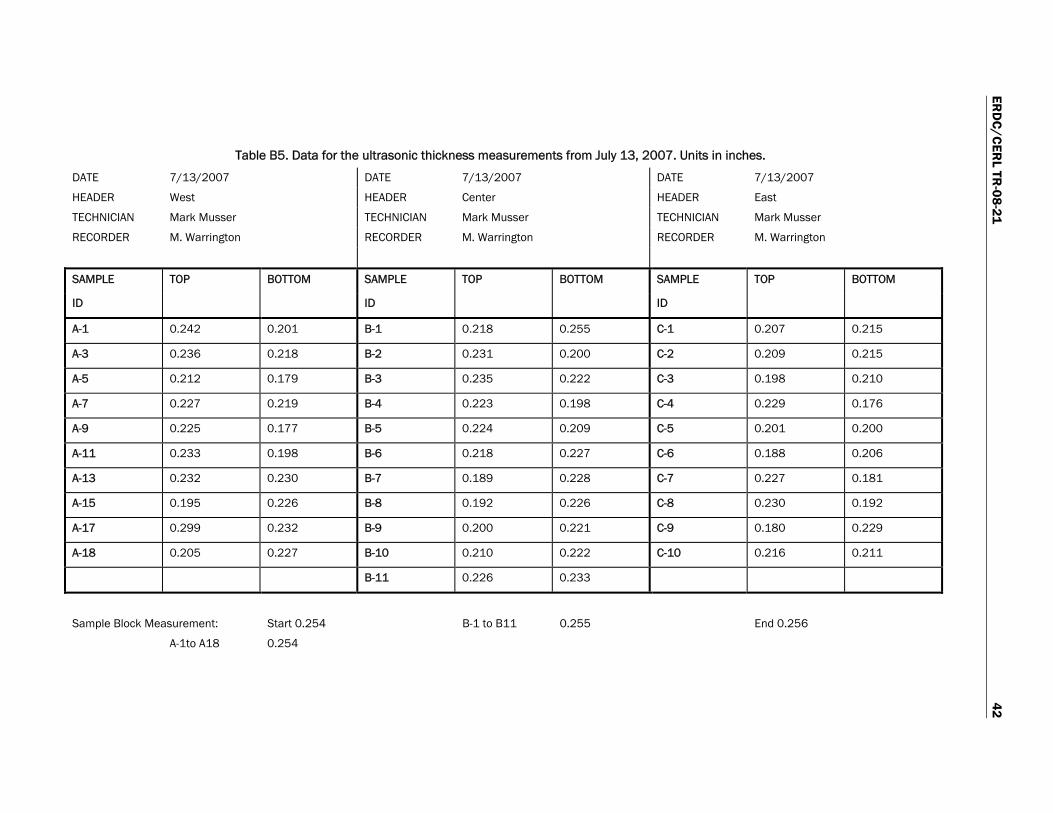
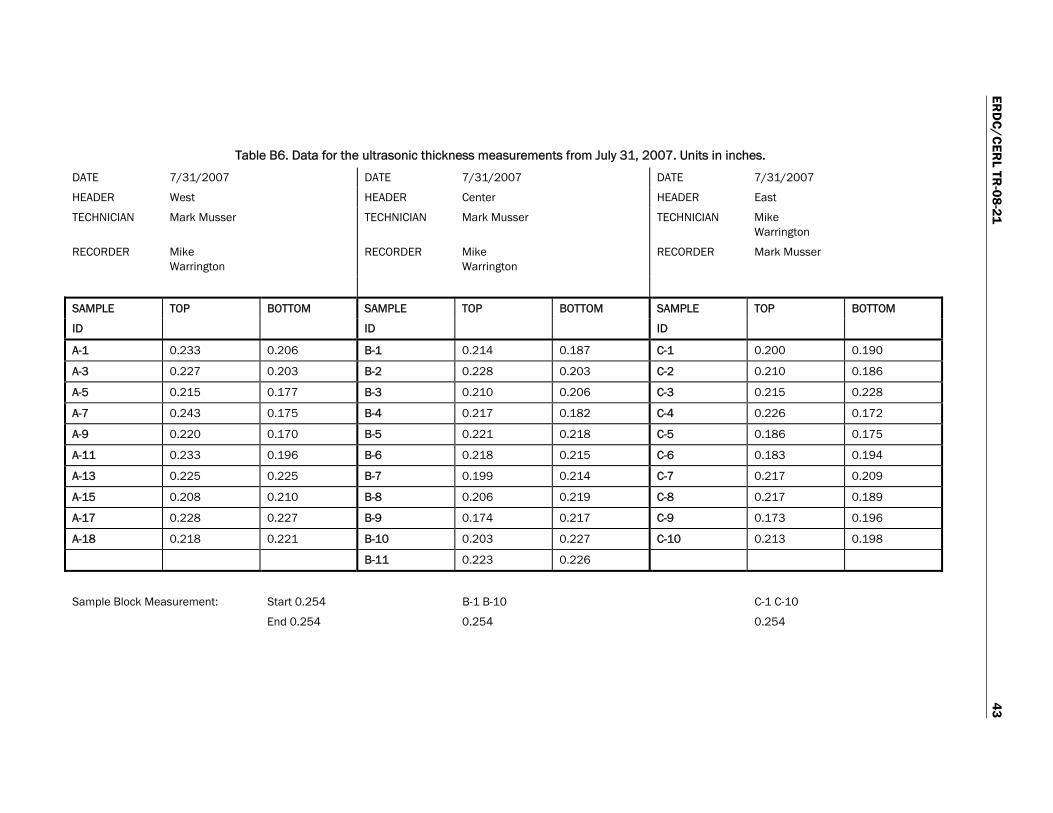
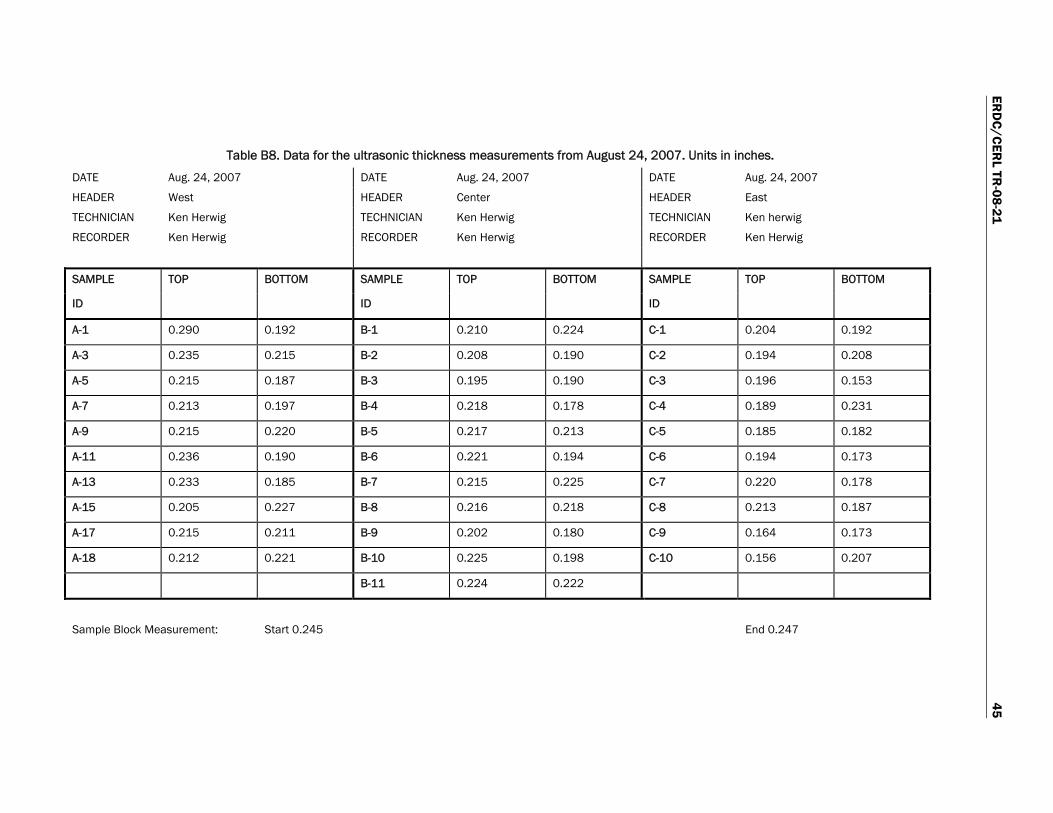
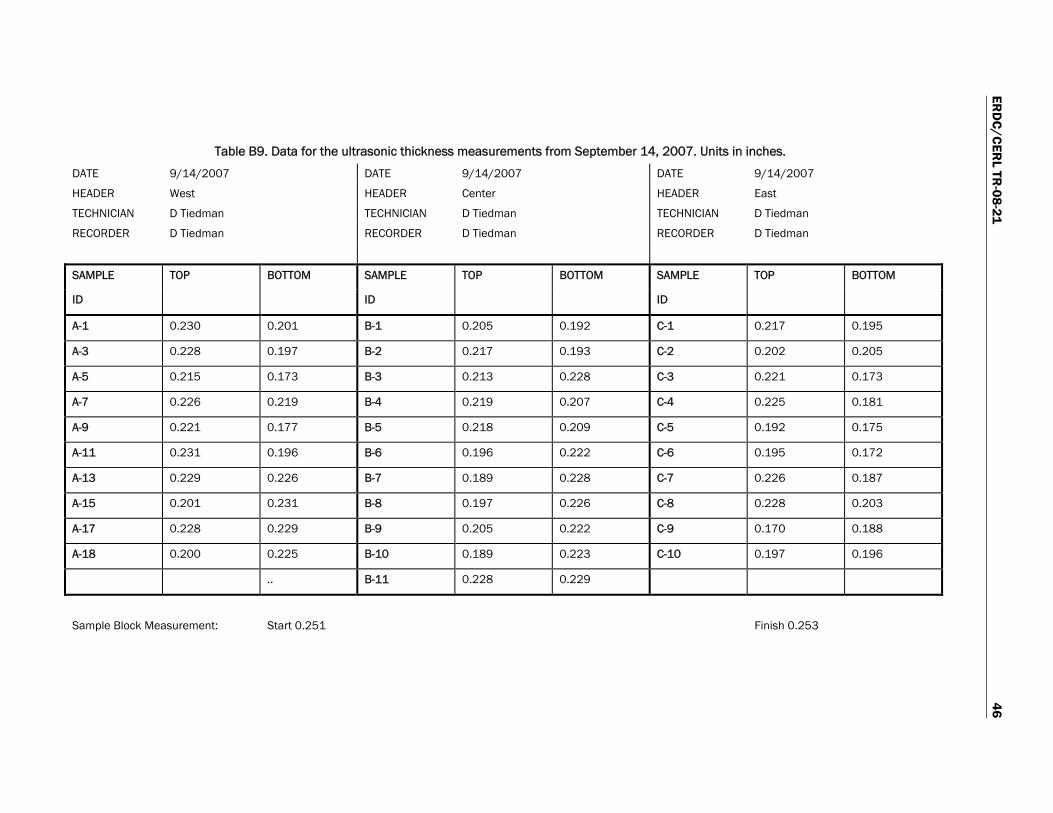
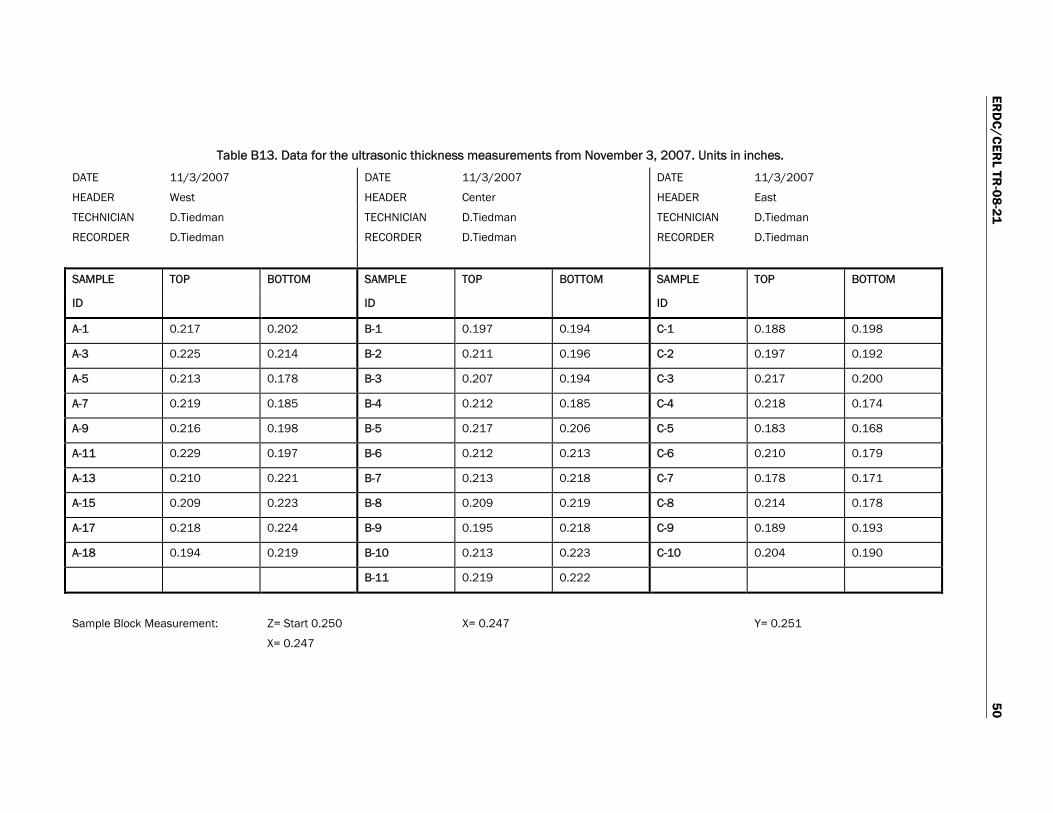
3.2.2 Data
The thickness measurements for each location for the 15 months are pro-vided in Appendix B, Tables B1 through B23. The reader should note that if there is not a well defined interface between the solid steel and the cor-rosion products, the ultrasonic measurement may include the thickness of the corrosion products along with the solid steel. Because the ultrasonic technique used here does not distinguish corrosion products from steel in such cases, a sort of “blurring” effect in the material may sometimes return a measurement that implies a greater steel wall thickness than is actually the case. Because this phenomenon is not predictable, it may lead to a large scatter in the data.
3.2.3 Analysis
3.2.3.1 Fifteen-month trend analysis
After the 15 months, and all the pipe thickness were measured and re-corded, an average thickness was calculated for each pipe based on the 10 or 11 measurement locations on each pipe for each day of measurement. These average thicknesses were plotted versus time for the period during which the measurements were taken. Figure 4, Figure 5, and Figure 6 show the average thickness readings from the headers.
Average thickness for west header
y = -7.06E-06x + 2.06E-01R2 = 4.92E-02
y = -1.39E-05x + 2.22E-01R2 = 1.33E-01
0.15
0.16
0.17
0.18
0.19
0.2
0.21
0.22
0.23
0.24
0 100 200 300 400 500 600
Day #
Ave
rage
Thi
ckne
ss (i
nch)
West TopWest Bottom
Figure 4. Average thickness measurements for west header
during 15-month current condition assessment.

ERDC/CERL TR-08-21 10
Average thickness for central header
y = -9.72E-06x + 2.11E-01R2 = 6.50E-02
y = 2.41E-06x + 2.08E-01R2 = 3.42E-03
0.15
0.16
0.17
0.18
0.19
0.2
0.21
0.22
0.23
0 100 200 300 400 500 600
Day #
Ave
rage
Thi
ckne
ss (i
nch)
Central TopCentral Bottom
Figure 5. Average thickness measurements for central header
during 15-month current condition assessment.
Average thickness for east header
y = 9.56E-06x + 1.83E-01R2 = 3.16E-02
y = 1.67E-05x + 1.95E-01R2 = 1.27E-01
0.15
0.16
0.17
0.18
0.19
0.2
0.21
0.22
0 100 200 300 400 500 600
Day #
Ave
rage
Thi
ckne
ss (i
nch)
East TopEast Bottom
Figure 6. Average thickness measurements for east header
during 15-month current condition assessment.

ERDC/CERL TR-08-21 11
The data show some interesting trends. For the west header, both top and bottom thickness measurements show a decreasing trend. This would in-dicate a wall thickness that is thinning during the measurement period. For the central header, the top measurements show a decreasing trend, while the bottom measurements show a very slight increasing trend. This might indicate a loss of wall material near the top of the pipe and an ac-cumulation of corrosion products at the bottom of the pipe. For the east header, both top and bottom measurements show an increasing tend. This might be due to an accumulation of corrosion products on the entire inside surface of the pipe. While this last trend may be an indication of the most excessive corrosion of the three pipes, we have to use the decreasing trend lines as an indication of material loss and hence a corrosion rate. The cor-rosion rates based on the decreasing trend lines are given in Table 2.
Table 2. Corrosion rates for each header based on decreasing thickness trends.
West Header Center Header East Header
Corrosion Rate Mils per year (mpy)
Top 5.07 3.55 -
Bottom 2.58 - -
These three corrosion rates give an average of 3.73 mpy. It should be noted that if this average corrosion rate were in effect immediately after the pipe was installed and it stayed constant, then the current pipe walls theoreti-cally would be thinner than actually measured. Therefore, it may be logi-cally inferred that the corrosion rate measured during the 15 month as-sessment is higher than the averaged actual rate during the previous 14 years of service.
3.2.3.2 Fifteen-month average analysis
After reviewing Figure 4, Figure 5, and Figure 6, and taking note of the large scatter in the data (low R2 value), it was deemed instructive to calcu-late averages of all thickness measurements taken for each pipe. This would give more reliable estimates of the current pipe thicknesses upon which to calculate additional 14-year pipe corrosion rates similar to that in section 3.1. The results of this analysis are shown in Table 3.

ERDC/CERL TR-08-21 12
Table 3. Summary of 1,426 current condition assessment ultrasonic wall thickness measurements taken during 15 months, and calculation of corrosion rates (units in inches).
West Header Central Header East Header
Original Thickness 0.237 0.237 0.237
Final Thickness Average thickness during 15 months
Top 0.2181 0.2080 0.2005
Bottom 0.2034 0.2086 0.1862
Thickness Loss Total loss after 14 years service
Top 0.0189 0.0290 0.0365
Bottom 0.0336 0.0284 0.0508
Corrosion Rate Mils per year (mpy)
Top 1.35 2.07 2.61
Bottom 2.40 2.03 3.63
The corrosion rates shown here do not differ significantly with those in Table 1. The only major differences are that here the central header has similar corrosion rates for both the top and bottom of the pipe, and the east header has a higher average thickness than measured during the ini-tial condition assessment.
Given that significantly less data were used in the initial condition assess-ment (Table 1), the results of the current condition assessment shown in Table 3, using all 1,426 measurements, provides a more accurate represen-tation of the corrosion rates for the three pipes.
3.3 Statistical analysis of corrosion rate
3.3.1 Method
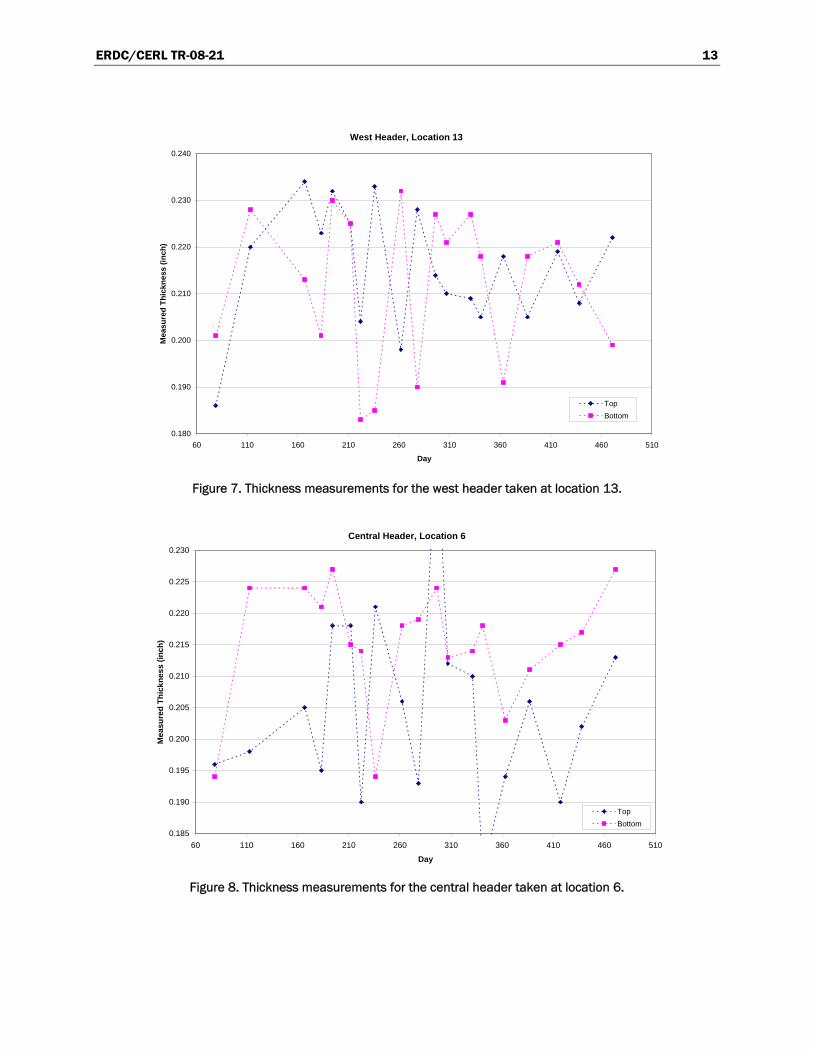
After reviewing the thickness measurements made on the carrier pipe for 15 months (Appendix B, Tables B1 through B23), it was obvious that the data had a large amount of scatter. The thickness values for individual measurement locations were plotted versus time. Selected examples are shown in Figure 7, Figure 8, and Figure 9.
ERDC/CERL TR-08-21 13
West Header, Location 13
0.180
0.190
0.200
0.210
0.220
0.230
0.240
60 110 160 210 260 310 360 410 460 510
Day
Mea
sure
d Th
ickn
ess
(inch
)
TopBottom
Figure 7. Thickness measurements for the west header taken at location 13.
Central Header, Location 6
0.185
0.190
0.195
0.200
0.205
0.210
0.215
0.220
0.225
0.230
60 110 160 210 260 310 360 410 460 510
Day
Mea
sure
d Th
ickn
ess
(inch
)
TopBottom
Figure 8. Thickness measurements for the central header taken at location 6.

ERDC/CERL TR-08-21 14
East Header, Location 1
0.180
0.185
0.190
0.195
0.200
0.205
0.210
0.215
0.220
0.225
60 110 160 210 260 310 360 410 460 510
Day
Mea
sure
d Th
ickn
ess
(inch
)
TopBottom
Figure 9. Thickness measurements for the central header taken at location 1.
Given this situation, an additional bounding procedure was required for monitoring the progression of the corrosion process. Extreme-value statis-tics (EVS) offers such a procedure.
EVS is based on the premise of ongoing random damage, and has been ap-plied to both piping and steel underground storage tanks (Eldredge 1957; Finley 1967; Aziz 1956). The specific approach applied here involves the prediction of the extremes (Finley 1967; Castillo et al. 2005; Gumbel 1958) which in this case is the deepest internal corrosion penetration and hence, ultimately, first leakage. Assuming that the sampled data are at least as representative of the environment experienced by the entire piping sys-tem, multiple remaining thickness measurements of structural metal can provide some measure of the ongoing corrosion rate.
As mentioned, sequential time measurements at any one of the particular top or bottom locations have failed to display a systematic temporal trend, in fact quite to the contrary, as previously shown in Figure 7, Figure 8, and Figure 9. It was then considered to treat an entire date’s collection of all header pipe measurements as two “samples,” with data from the top and bottom treated separately.
ERDC/CERL TR-08-21 15
3.3.1.1 Definition of extreme-value statistics as applied to pipe wall thicknesses
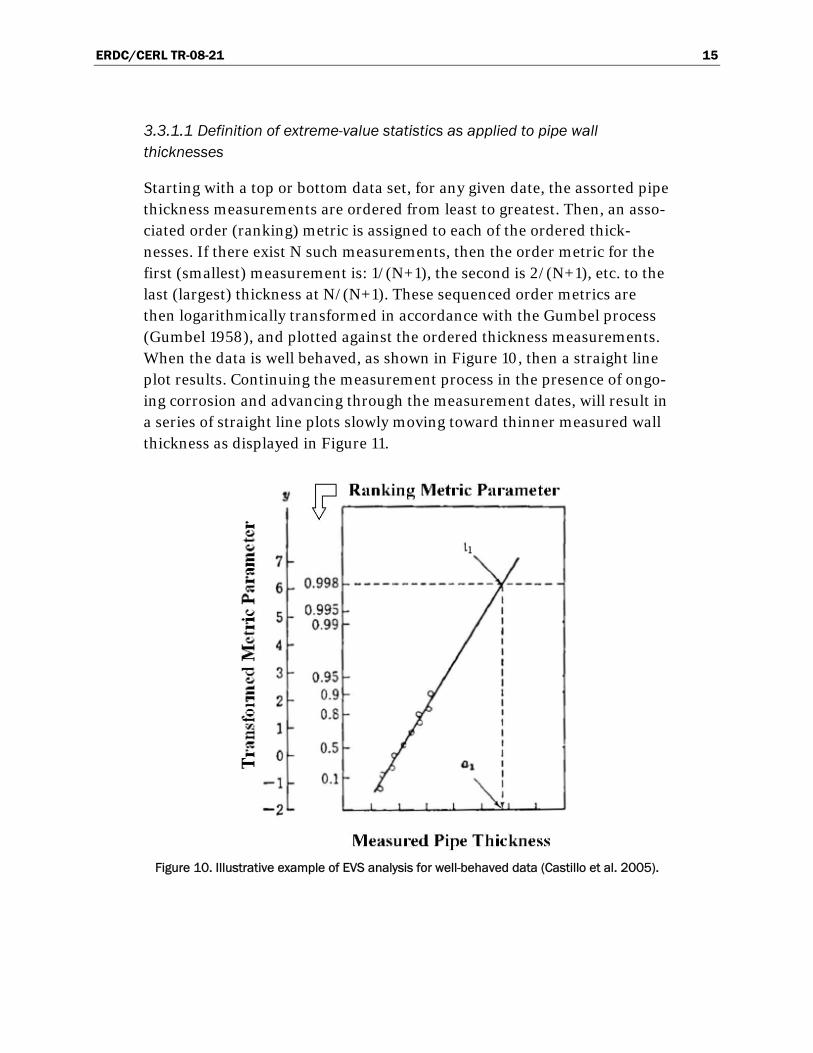
Starting with a top or bottom data set, for any given date, the assorted pipe thickness measurements are ordered from least to greatest. Then, an asso-ciated order (ranking) metric is assigned to each of the ordered thick-nesses. If there exist N such measurements, then the order metric for the first (smallest) measurement is: 1/(N+1), the second is 2/(N+1), etc. to the last (largest) thickness at N/(N+1). These sequenced order metrics are then logarithmically transformed in accordance with the Gumbel process (Gumbel 1958), and plotted against the ordered thickness measurements. When the data is well behaved, as shown in Figure 10, then a straight line plot results. Continuing the measurement process in the presence of ongo-ing corrosion and advancing through the measurement dates, will result in a series of straight line plots slowly moving toward thinner measured wall thickness as displayed in Figure 11.
Figure 10. Illustrative example of EVS analysis for well-behaved data (Castillo et al. 2005).
ERDC/CERL TR-08-21 16
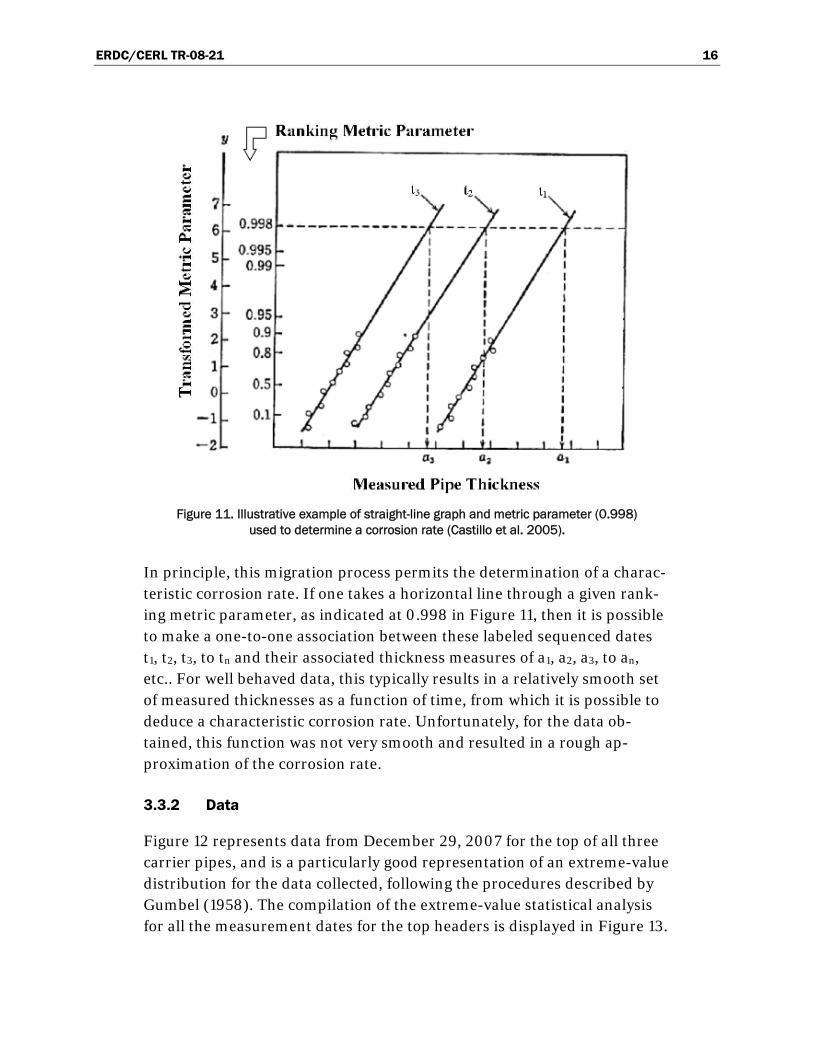
Figure 11. Illustrative example of straight-line graph and metric parameter (0.998)
used to determine a corrosion rate (Castillo et al. 2005).
In principle, this migration process permits the determination of a charac-teristic corrosion rate. If one takes a horizontal line through a given rank-ing metric parameter, as indicated at 0.998 in Figure 11, then it is possible to make a one-to-one association between these labeled sequenced dates t1, t2, t3, to tn and their associated thickness measures of a1, a2, a3, to an, etc.. For well behaved data, this typically results in a relatively smooth set of measured thicknesses as a function of time, from which it is possible to deduce a characteristic corrosion rate. Unfortunately, for the data ob-tained, this function was not very smooth and resulted in a rough ap-proximation of the corrosion rate.
3.3.2 Data
Figure 12 represents data from December 29, 2007 for the top of all three carrier pipes, and is a particularly good representation of an extreme-value distribution for the data collected, following the procedures described by Gumbel (1958). The compilation of the extreme-value statistical analysis for all the measurement dates for the top headers is displayed in Figure 13.

ERDC/CERL TR-08-21 17
Example of Extreme-Value Statistical Analysis for Entire (TOP) Liparie Pipe Line System. December 29, 2007 data.
0.02
0.05
0.10
0.20
0.30
0.400.500.600.700.80
0.900.950.98
y = 88.381x - 18.672R2 = 0.9917
-4
-3
-2
-1
0
1
2
0.16 0.17 0.18 0.19 0.2 0.21 0.22 0.23 0.24Total TOP-Pipe Line, Thickness Measurements (inches)
Gum
bel T
rans
form
: Ln
(-Ln(
M))
Ord
erin
g M
etric
Figure 12. EVS analysis applied to all top header thickness measurements from December 29, 2007.
Figure 13. Compilation of extreme-value statistics for all top thickness measurements
for all dates measurements were taken.
ERDC/CERL TR-08-21 18
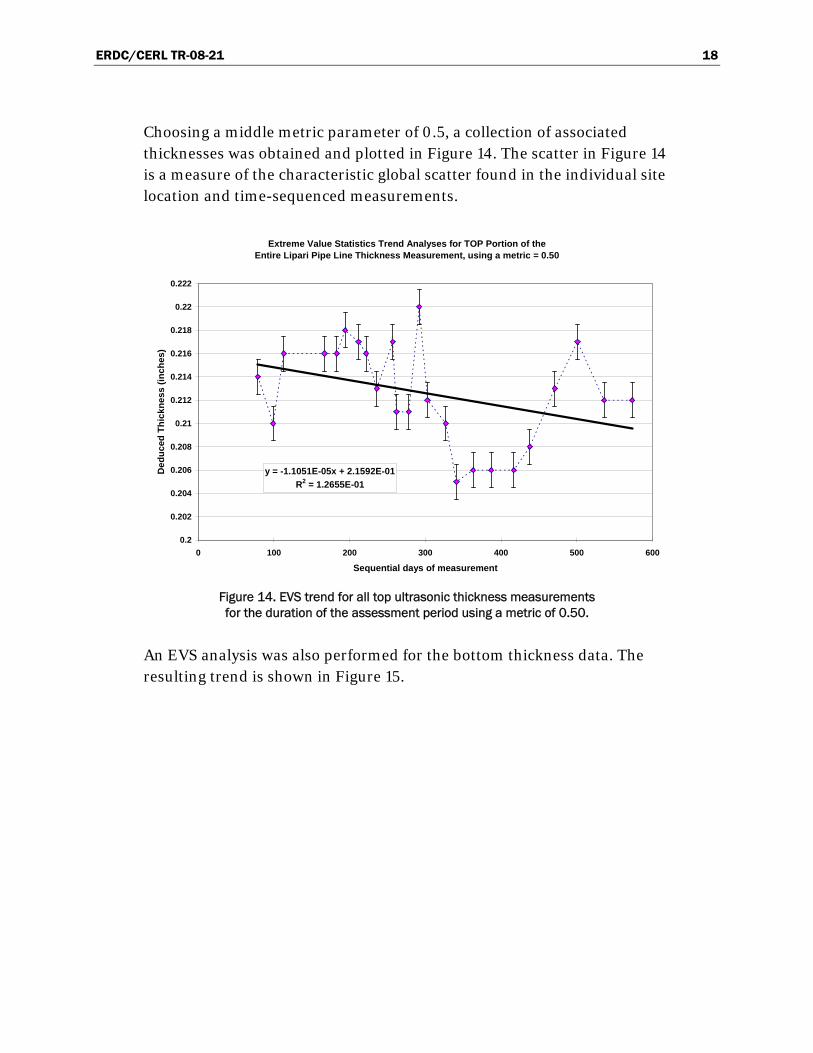
Choosing a middle metric parameter of 0.5, a collection of associated thicknesses was obtained and plotted in Figure 14. The scatter in Figure 14 is a measure of the characteristic global scatter found in the individual site location and time-sequenced measurements.
Extreme Value Statistics Trend Analyses for TOP Portion of theEntire Lipari Pipe Line Thickness Measurement, using a metric = 0.50
y = -1.1051E-05x + 2.1592E-01R2 = 1.2655E-01
0.2
0.202
0.204
0.206
0.208
0.21
0.212
0.214
0.216
0.218
0.22
0.222
0 100 200 300 400 500 600
Sequential days of measurement
Ded
uced
Thi
ckne
ss (i
nche
s)
Figure 14. EVS trend for all top ultrasonic thickness measurements for the duration of the assessment period using a metric of 0.50.
An EVS analysis was also performed for the bottom thickness data. The resulting trend is shown in Figure 15.

ERDC/CERL TR-08-21 19
Extreme Value Statistics Trend Analyses for BOTTOM of the Entire Lipari Pipe Line Thickness Measurement, using a metric = 0.50
y = -7.2041E-06x + 2.0093E-01R2 = 3.1348E-02
0.185
0.19
0.195
0.2
0.205
0.21
0.215
0.22
0 100 200 300 400 500 600
Sequential days of measurement
Ded
uced
Thi
ckne
ss (i
nche
s)
Figure 15. EVS trend for all bottom ultrasonic thickness measurements
for the duration of the assessment period using a metric of 0.50.
3.3.3 Analysis
The random scatter in this actual data is substantial. Even so, the statisti-cal method extracts a systematic thinning of the original 0.237 in. thick steel carrier pipe. Using the analytic equation derived from the least squares fit of the data in Figure 14, a characteristic corrosion rate for the top of all pipes was calculated to be 4.03 mpy. Using the analytic equation derived from the least squares fit of the data in Figure 15, a characteristic corrosion rate for the bottom of all pipes was calculated to be 2.63 mpy.
It should again be noted that this corrosion rate is defined only for the pe-riod during which data was collected. Inserting 0.237 in. initial pipe wall thickness into the analytic equation for the “y” value defines a sequential day in the past at which time the pipe line was placed into service, as de-fined by the EVS process. Doing so for the top data gives an elapsed value of ~1,979 days, between the predicted service startup date and the begin-ning of the first series of thickness measurements starting March 20, 2007. This amounts to approximately 5.4 years of service life if the corro-sion rate was constant and started immediately after installation. How-ever, this is not the case, and thus it is reasoned that this inferred corro-sion rate is higher than that of the previous 14 years.
ERDC/CERL TR-08-21 20
3.3.3.1 Average minimum and maximum thickness corrosion rates
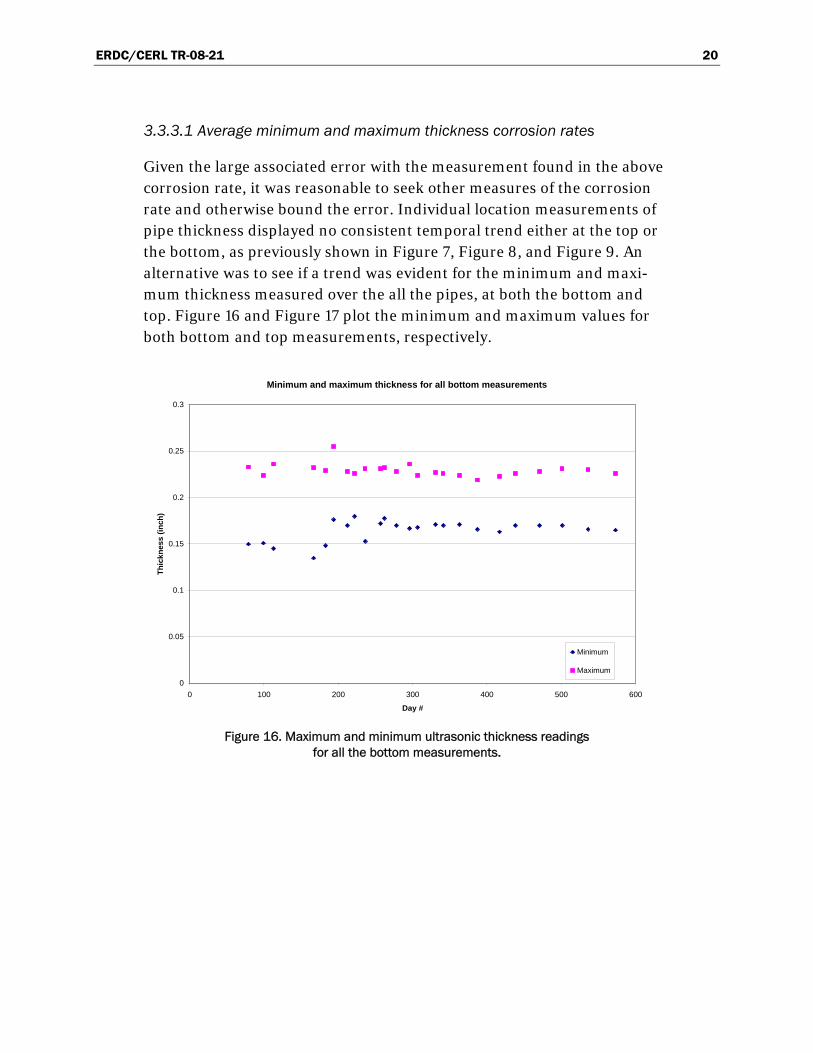
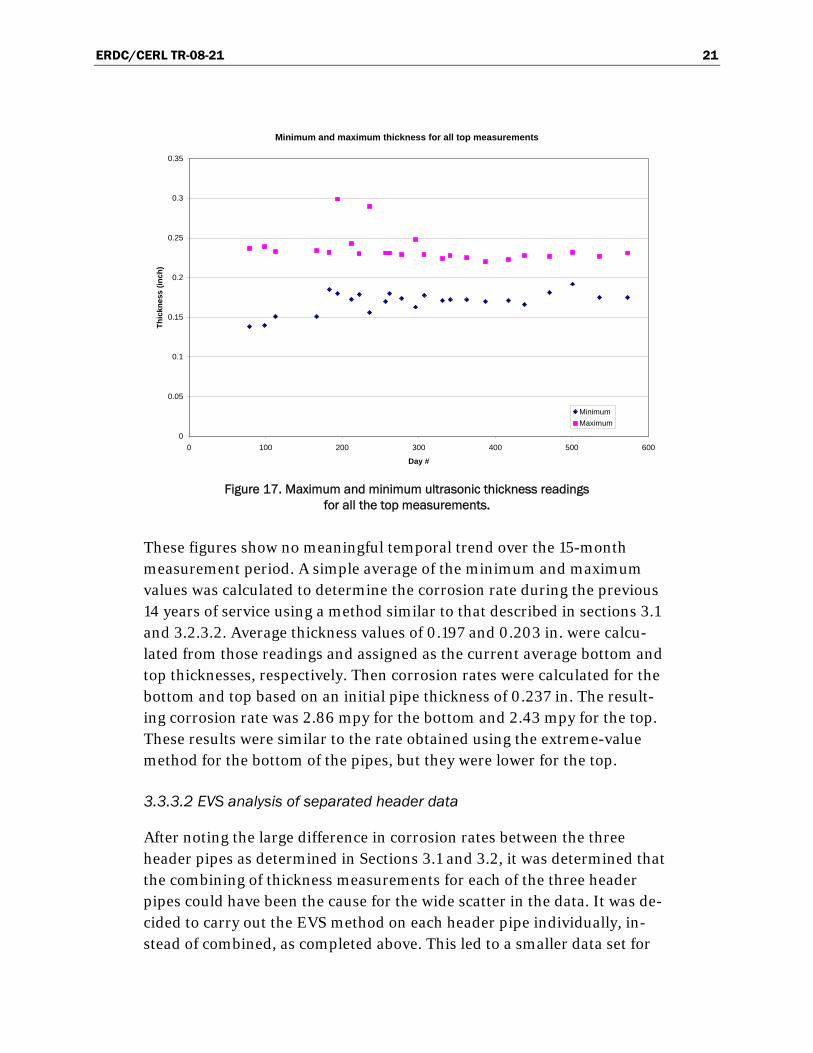
Given the large associated error with the measurement found in the above corrosion rate, it was reasonable to seek other measures of the corrosion rate and otherwise bound the error. Individual location measurements of pipe thickness displayed no consistent temporal trend either at the top or the bottom, as previously shown in Figure 7, Figure 8, and Figure 9. An alternative was to see if a trend was evident for the minimum and maxi-mum thickness measured over the all the pipes, at both the bottom and top. Figure 16 and Figure 17 plot the minimum and maximum values for both bottom and top measurements, respectively.
Minimum and maximum thickness for all bottom measurements
0
0.05
0.1
0.15
0.2
0.25
0.3
0 100 200 300 400 500 600
Day #
Thic
knes
s (in
ch)
Minimum
Maximum
Figure 16. Maximum and minimum ultrasonic thickness readings
for all the bottom measurements.
ERDC/CERL TR-08-21 21
Minimum and maximum thickness for all top measurements
0
0.05
0.1
0.15
0.2
0.25
0.3
0.35
0 100 200 300 400 500 600
Day #
Thic
knes
s (in
ch)
MinimumMaximum
Figure 17. Maximum and minimum ultrasonic thickness readings
for all the top measurements.
These figures show no meaningful temporal trend over the 15-month measurement period. A simple average of the minimum and maximum values was calculated to determine the corrosion rate during the previous 14 years of service using a method similar to that described in sections 3.1 and 3.2.3.2. Average thickness values of 0.197 and 0.203 in. were calcu-lated from those readings and assigned as the current average bottom and top thicknesses, respectively. Then corrosion rates were calculated for the bottom and top based on an initial pipe thickness of 0.237 in. The result-ing corrosion rate was 2.86 mpy for the bottom and 2.43 mpy for the top. These results were similar to the rate obtained using the extreme-value method for the bottom of the pipes, but they were lower for the top.
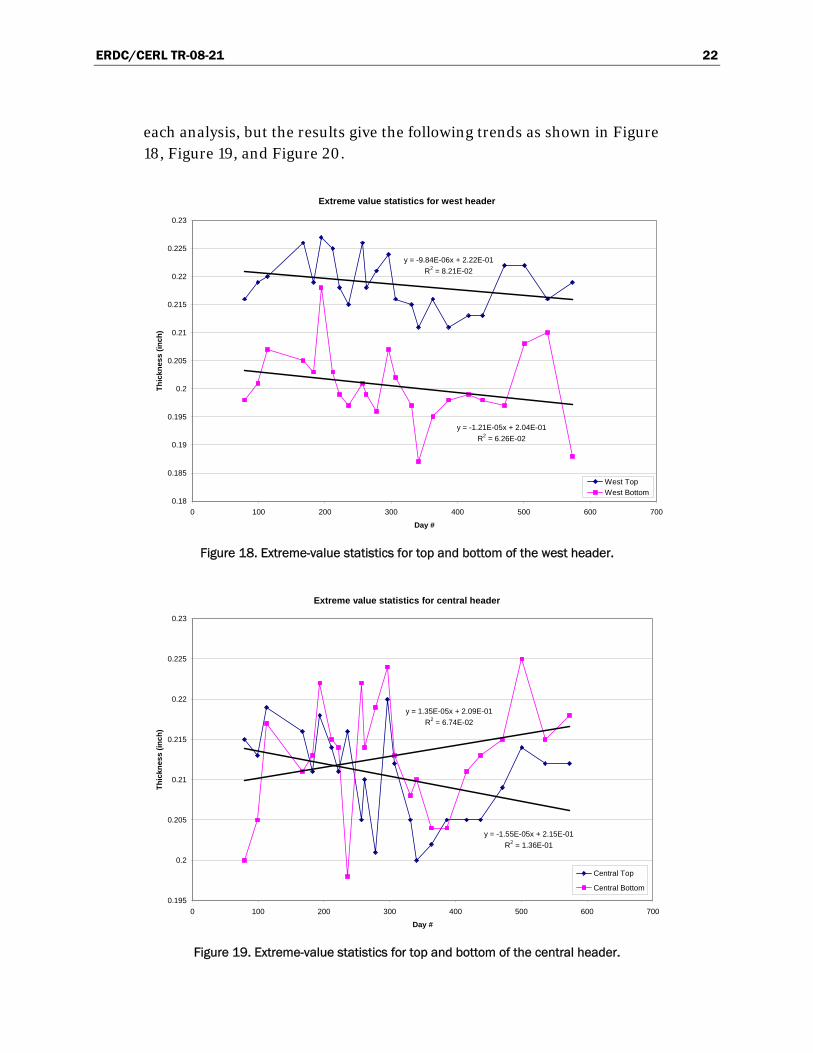
3.3.3.2 EVS analysis of separated header data
After noting the large difference in corrosion rates between the three header pipes as determined in Sections 3.1 and 3.2, it was determined that the combining of thickness measurements for each of the three header pipes could have been the cause for the wide scatter in the data. It was de-cided to carry out the EVS method on each header pipe individually, in-stead of combined, as completed above. This led to a smaller data set for
ERDC/CERL TR-08-21 22
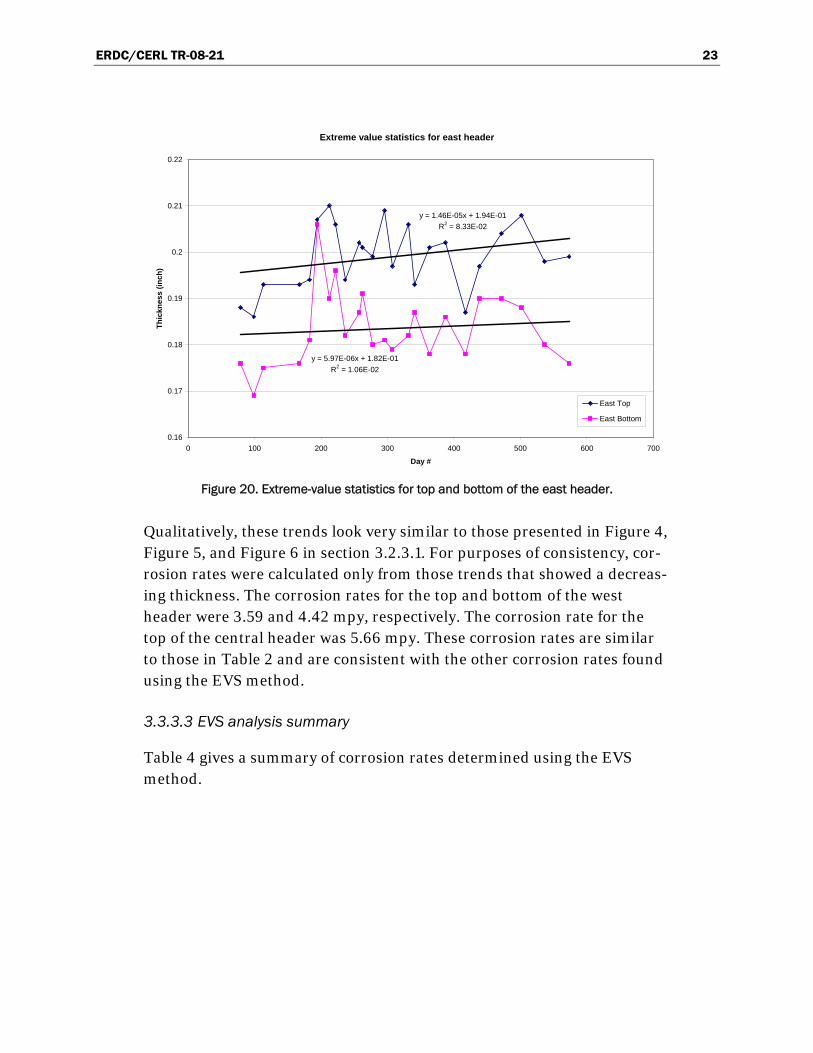
each analysis, but the results give the following trends as shown in Figure 18, Figure 19, and Figure 20.
Extreme value statistics for west header
y = -1.21E-05x + 2.04E-01R2 = 6.26E-02
y = -9.84E-06x + 2.22E-01R2 = 8.21E-02
0.18
0.185
0.19
0.195
0.2
0.205
0.21
0.215
0.22
0.225
0.23
0 100 200 300 400 500 600 700
Day #
Thic
knes
s (in
ch)
West TopWest Bottom
Figure 18. Extreme-value statistics for top and bottom of the west header.
Extreme value statistics for central header
y = 1.35E-05x + 2.09E-01R2 = 6.74E-02
y = -1.55E-05x + 2.15E-01R2 = 1.36E-01
0.195
0.2
0.205
0.21
0.215
0.22
0.225
0.23
0 100 200 300 400 500 600 700
Day #
Thic
knes
s (in
ch)
Central Top
Central Bottom
Figure 19. Extreme-value statistics for top and bottom of the central header.
ERDC/CERL TR-08-21 23
Extreme value statistics for east header
y = 1.46E-05x + 1.94E-01R2 = 8.33E-02
y = 5.97E-06x + 1.82E-01R2 = 1.06E-02
0.16
0.17
0.18
0.19
0.2
0.21
0.22
0 100 200 300 400 500 600 700
Day #
Thic
knes
s (in
ch)
East Top
East Bottom
Figure 20. Extreme-value statistics for top and bottom of the east header.
Qualitatively, these trends look very similar to those presented in Figure 4, Figure 5, and Figure 6 in section 3.2.3.1. For purposes of consistency, cor-rosion rates were calculated only from those trends that showed a decreas-ing thickness. The corrosion rates for the top and bottom of the west header were 3.59 and 4.42 mpy, respectively. The corrosion rate for the top of the central header was 5.66 mpy. These corrosion rates are similar to those in Table 2 and are consistent with the other corrosion rates found using the EVS method.
3.3.3.3 EVS analysis summary
Table 4 gives a summary of corrosion rates determined using the EVS method.

ERDC/CERL TR-08-21 24
Table 4. Summary of corrosion rates by the EVS method.
Description Corrosion Rate (mpy)
All top measurements 4.03
All bottom measurements 2.63
Average of all top minimum and maximum measurements 2.43
Average of all bottom minimum and maximum measurements 2.86
EVS corrosion rates for individual headers (mpy)
West Header Central Header East Header
Top 3.59 5.66 -
Bottom 4.42 - -
3.4 Corrosion coupon testing
3.4.1 Method
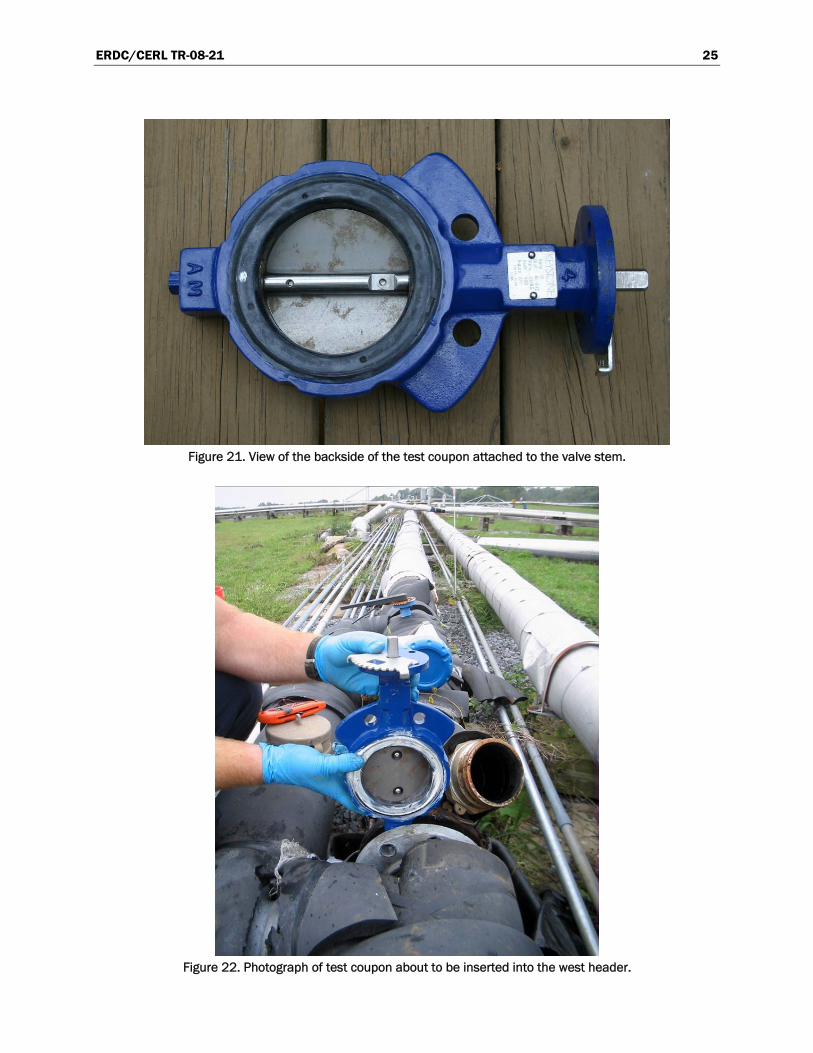
A corrosion test coupon was designed to fit into one of the header pipes and be subjected to the flow of the contaminated ground water. A disk was machined from carbon steel similar in grade to the carrier pipe and at-tached to the stem of a butterfly valve, replacing the original valve. Figure 21 and Figures C8 through C10 (see Appendix C) show the coupon at-tached to the valve stem. The disc mounting screws were electrically insu-lated using nylon washers and sleeves to prevent galvanic corrosion be-tween dissimilar metals. Also, the area between the valve stem and the disc was filled with silicon caulk to prevent any crevice or erosion corrosion.
3.4.2 Data
The valve body containing the corrosion coupon was placed into the west header on August 4, 2007. Figure 22 and Figure C11 (see Appendix C) show this installation. Prior to installation, the corrosion coupon had a di-ameter of 10.6 cm and was machined out of 0.317 cm (0.125 in.) thick car-bon steel. After machining the disk, an initial weight of 200.00 grams was determined using a calibrated laboratory scale, and the thickness of the plate, 0.317 cm (0.125 in.), was determined using a calibrated micrometer. The surface area was calculated to be 182.59 cm2 (28.4 sq. in.).
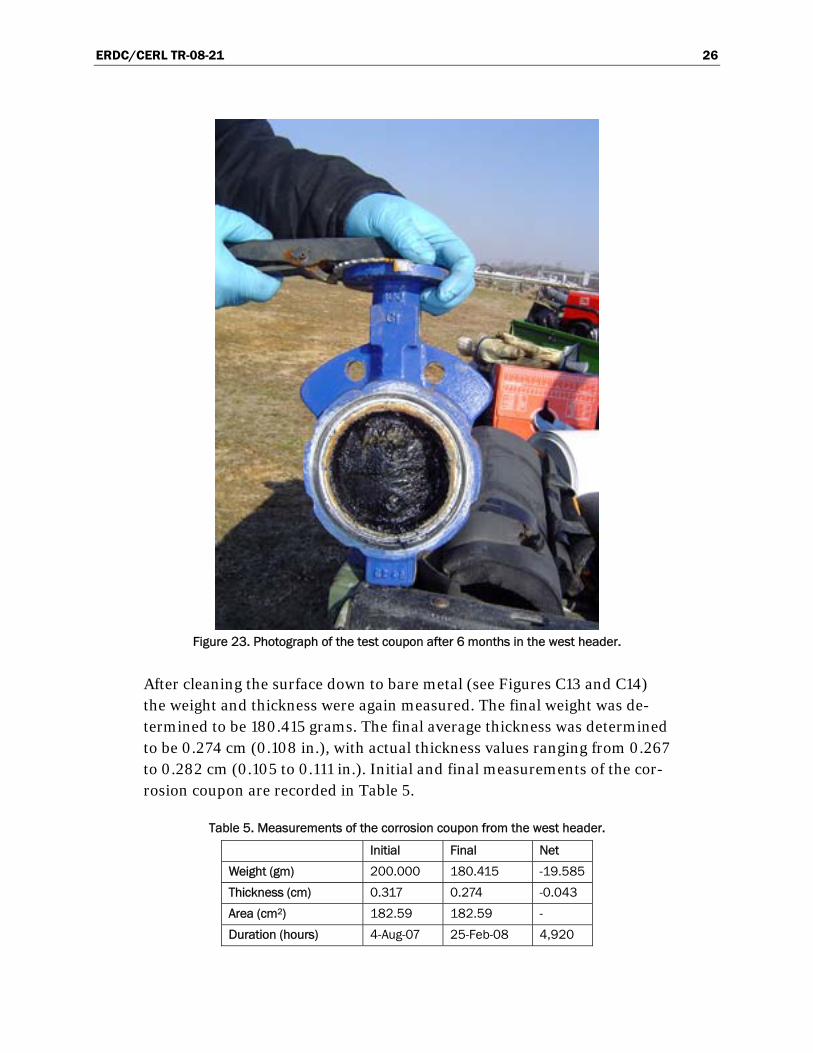
The corrosion test coupon was removed from the west header on February 25, 2008, for a total of 205 days of exposure (Figure 23 and Figure C12) and returned to ERDC-CERL for analysis.
ERDC/CERL TR-08-21 25
Figure 21. View of the backside of the test coupon attached to the valve stem.
Figure 22. Photograph of test coupon about to be inserted into the west header.
ERDC/CERL TR-08-21 26
Figure 23. Photograph of the test coupon after 6 months in the west header.
After cleaning the surface down to bare metal (see Figures C13 and C14) the weight and thickness were again measured. The final weight was de-termined to be 180.415 grams. The final average thickness was determined to be 0.274 cm (0.108 in.), with actual thickness values ranging from 0.267 to 0.282 cm (0.105 to 0.111 in.). Initial and final measurements of the cor-rosion coupon are recorded in Table 5.
Table 5. Measurements of the corrosion coupon from the west header.
Initial Final Net
Weight (gm) 200.000 180.415 -19.585
Thickness (cm) 0.317 0.274 -0.043
Area (cm2) 182.59 182.59 -
Duration (hours) 4-Aug-07 25-Feb-08 4,920

ERDC/CERL TR-08-21 27
3.4.3 Analysis
The corrosion product on the coupon when removed from the pipe was black, as shown in Figure 23 and Figure C12 (see Appendix C). By the time the coupon reached the lab, the corrosion product was the common hema-tite rust color, as shown in Figures C13 and C14, which is typical of aerobic corrosion. This indicates that the pumped water had minimal dissolved oxygen to support complete corrosion. The corrosion product was loosely attached to the surface of the steel and was easily washed away. This may have allowed for fresh coupon material to be exposed to the corrosive ac-tion of the water while in the pipe and caused an accelerated corrosion rate.
Using the ASM (2003) standard method of calculating the corrosion rate from test coupon data, the corrosion rate was calculated to be 9.57 mpy. Additionally, a corrosion rate calculation based on initial and final average thickness measurements returned a value of 15.07 mpy.
ERDC/CERL TR-08-21 28
4 Results and Discussion
4.1 Summary of corrosion rates
Eight methods were used to determine corrosion rates of the steel carrier pipes. The rates returned from each of those methods were then used to predict the remaining life of the pipes. The averages from all the recorded ultrasonic thickness measurements were used to determine the estimated current pipe thicknesses, using the same method as described in section 3.2.3.2.
The pipes were assumed to be at the end of their useful life when wall thickness fell below two-thirds its original dimension. For the original Schedule 40 steel pipes, which originally measured 0.237 in. thick, the minimum functional wall thickness would be 0.158 in. Remaining life was then determined for each corrosion rate for each pipe. The results are summarized in Table 6. The methods for determining the corrosion rates were then critically evaluated.
4.2 Evaluation of corrosion rate methods
For the initial condition assessment, the corrosion rate estimates were based on a single day of ultrasonic measurements and their averages, and thus have some degree of measurement error, which is associated with the ultrasonic test method. The current condition assessment measurements were subject to that same degree of measurement error plus additional po-tential for error as a result of employing different technicians to perform the measurements over time. Additionally, the amount of measurement error using the ultrasonic thickness method was probably great enough to conceal any significant changes in the pipe thickness between successive measurement dates, which were carried out approximately once every 2 or 4 weeks. However, averaging the values returned over 15 months added reliability to the estimate of current pipe thickness, so that number was used in determining the remaining pipe life.
The EVS method was used to bound the error from the wide scatter in the ultrasonic thickness measurements, and was thus the most conservative. The method incorporated top and bottom data for all three pipes, and the corrosion rate reflected the combined average for all three.

ERDC/CERL TR-08-21 29
Table 6. Summary of corrosion rates and remaining pipe life.
West Header Central Header East Header
Top 0.218 0.208 0.201 Estimated Current Pipe Thickness (inch)
Bottom 0.203 0.209 0.186
Method Corrosion Rate (mpy)
Top 1.33 2.19 3.61 Initial Condition Assessment
Bottom 2.46 2.24 4.84
Top 5.07 3.55 - Current Condition Assessment (Trend)
Bottom 2.58 - -
Top 1.35 2.07 2.61 Current Condition Assessment (Average)
Bottom 2.41 2.03 3.63
Top 4.03 Extreme-Value Statistics (Combined)
Bottom 2.63
Top 3.59 5.66 - Extreme-value Statistics (Separated)
Bottom 4.42 - -
Top 2.43 Minimum/Maximum Average
Bottom 2.86
Corrosion Coupon (ASTM) - 9.57 - -
Corrosion Coupon (Thickness) - 15.07 - -
Method Remaining Pipe Life (year)
Top 45.1 22.8 11.9 Initial Condition Assessment
Bottom 18.3 22.8 5.8
Top 11.8 14.1 - Current Condition Assessment (Trend)
Bottom 17.4 - -
Top 44.4 24.2 16.5 Current Condition Assessment (Average)
Bottom 18.7 25.1 7.7
Top 14.9 12.4 10.7 Extreme-value Statistics (Combined)
Bottom 17.1 19.4 10.6
Top 16.7 8.8 - Extreme-value Statistics (Separated)
Bottom 10.2 - -
Top 24.7 20.6 17.7 Minimum/Maximum Average
Bottom 15.7 17.8 9.8
Corrosion Coupon (ASTM) - 5.5 - -
Corrosion Coupon (Thickness) - 3.5 - -
Note 1: remaining life is based on a minimum pipe wall thickness (inches) of 0.158. Note 2: "-" indicates corrosion rate (and remaining life) were not calculated for that pipe or location.
ERDC/CERL TR-08-21 30
When splitting the measurements returned by the EVS method for each header, the data sets were reduced to a third of the previous size. But based upon earlier trends, the corrosion rates were believed to be more accurate for each pipe.
When the average of the minimum and maximum thickness readings for the entire monitoring period were used to calculate corrosion rate, the re-sult was very similar to that of the initial condition assessment. But be-cause the data set included measurements from all three pipes, the corro-sion rate again represented the combined average of all three.
The test coupon inserted into the west header seemed the most practical way to extract a representative corrosion rate from the inside of the pipe. After calculating rather high corrosion rates, however, two reasons were identified for why this rate was not accepted. First, an unrealistically high corrosion rate may result from a brief initial period of accelerated corro-sion of the bright metal prior to surface passivation through the formation of an oxide layer. That effect can be more pronounced over a short test pe-riod, as used in this assessment, than over a longer-term test period. Sec-ond, the test specimen was placed in the center of the flow, so the action of the pumped water provided a medium to remove corrosion products faster than if they were on the pipe wall, because flow at the pipe wall is generally lower than at the center of a pipe.
4.3 Determination of minimum pipe thickness
The Lipari piping system was initially designed with a safety factor of 10. This means that the pipes were designed to withstand an internal pressure 10 times greater than expected during their service life, or that they could operate with no safety factor at expected pressures after pipe wall thinning to one-tenth the original thickness. However, because it is out of the ques-tion to operate the system without some factor of safety, it is deemed ap-propriate to assume an original practical safety factor of 6.67. Owing to the minimal internal pressure experienced by the piping system, this reduc-tion in safety factor is the equivalent of allowing the pipe walls to reach two-thirds their original thickness. As applied to the original Schedule 40 pipe with wall thickness of 0.237 in., a 6.67 safety factor means that the minimum acceptable pipe thickness is 0.158 in.

ERDC/CERL TR-08-21 31
5 Conclusions and Recommendations
5.1 Conclusions
Based on the available data and the analyses presented here, the following conclusions are offered.
Only minor damage was found on the piping system’s exterior aluminum weather guard, and minimal work will be needed to repair it. The damaged sections of aluminum sheathing are small enough to easily be replaced to protect the thermal insulation layer from water infiltration.
The fiberglass spill-containment piping that envelops the steel carrier pipe also was found to be in good condition. No evidence was found that water has intruded though the fiberglass containment piping to affect the steel carrier pipes, and the outside surfaces of the carrier pipes were found to be in good condition.
Considerable interior thinning was found in some areas of the carrier pipes through the use of ultrasonic thickness testing. It is concluded that this material loss has been caused by the corrosive chemistry of the pumped liquid. The steel corrosion rates, as calculated using eight differ-ent methods and summarized in Table 6, require some interpretation ow-ing to the wide range of results returned by some of the analytical meth-ods.
In all cases, the minimum useful pipe wall thickness was assumed to be 0.158 in. At the present rates of corrosion, all three headers will reach that dimension between 3.5 years and 45.1 years. Obviously, that range is too broad to be of much engineering value, so additional considerations must be made.
Looking at each header pipe individually, the west header will reach the minimum wall thickness between 3.5 and 45.1 years, depending on which analytical method was used. Discarding the two highest (45.1 and 44.4) and two lowest (3.5 and 5.5) predictions of useful life, the range narrows to between 10.2 and 24.7 years (min/max average). Using that same ap-proach for the central and east header life-cycle predictions, the estimates
ERDC/CERL TR-08-21 32
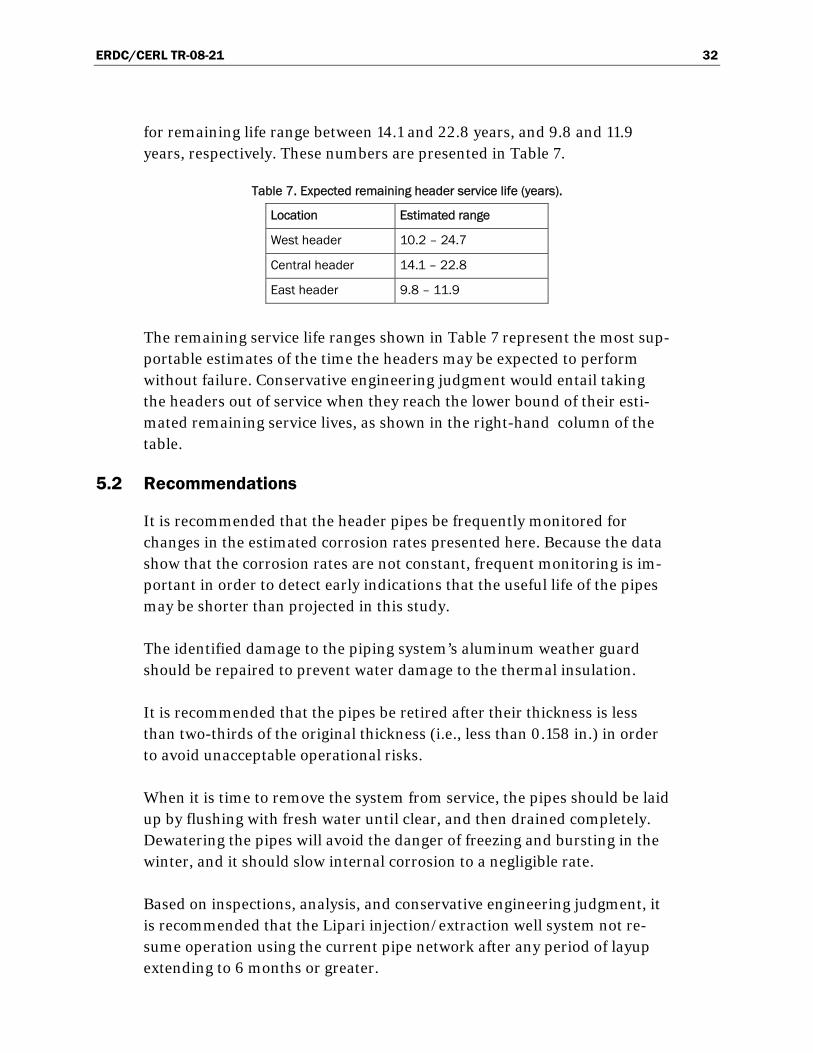
for remaining life range between 14.1 and 22.8 years, and 9.8 and 11.9 years, respectively. These numbers are presented in Table 7.
Table 7. Expected remaining header service life (years).
Location Estimated range
West header 10.2 – 24.7
Central header 14.1 – 22.8
East header 9.8 – 11.9
The remaining service life ranges shown in Table 7 represent the most sup-portable estimates of the time the headers may be expected to perform without failure. Conservative engineering judgment would entail taking the headers out of service when they reach the lower bound of their esti-mated remaining service lives, as shown in the right-hand column of the table.
5.2 Recommendations
It is recommended that the header pipes be frequently monitored for changes in the estimated corrosion rates presented here. Because the data show that the corrosion rates are not constant, frequent monitoring is im-portant in order to detect early indications that the useful life of the pipes may be shorter than projected in this study.
The identified damage to the piping system’s aluminum weather guard should be repaired to prevent water damage to the thermal insulation.
It is recommended that the pipes be retired after their thickness is less than two-thirds of the original thickness (i.e., less than 0.158 in.) in order to avoid unacceptable operational risks.
When it is time to remove the system from service, the pipes should be laid up by flushing with fresh water until clear, and then drained completely. Dewatering the pipes will avoid the danger of freezing and bursting in the winter, and it should slow internal corrosion to a negligible rate.
Based on inspections, analysis, and conservative engineering judgment, it is recommended that the Lipari injection/extraction well system not re-sume operation using the current pipe network after any period of layup extending to 6 months or greater.
ERDC/CERL TR-08-21 33
References
American Society for Nondestructive Testing (ASNT). 2007. Nondestructive testing handbook, third edition: Volume 7, ultrasonic testing. Columbus, OH: American Society for Nondestructive Testing.
ASM International. 2003. Corrosion testing and evaluation, vol 13A: Corrosion fundamentals, testing, and protection. ASM handbook, 468. Materials Park, OH: ASM International.
Aziz, P.M. 1956. Application of the statistical theory of extreme values to the analysis of maximum pit depth data for aluminum. Corrosion 12. Houston, TX: NACE International.
Castillo, E., A.S. Hadi, N. Balakrishnan, J.M. Sarabia. 2005. Extreme value and related models with applications in engineering and science. Hoboken, NJ: Wiley.
Eldredge, G.G. 1957. Analysis of corrosion pitting by extreme-value statistics and its application to oil well tubing caliper surveys. Corrosion 13: 51-60. Houston, TX: NACE International.
Finley, Howard F. April 1967. An extreme-value statistical analysis of maximum pit depths and time to first perforation. Corrosion: 83–87. Houston, TX: NACE International.
Gumbel, E.J. 1958. Statistics of extremes. New York: Columbia University Press.
Weber, Robert A. 2007. Condition assessment of the Lipari Landfill piping system: Interim report: Baseline condition assessment. ERDC-CERL Contract Report CR-07-1. Champaign, IL: U.S. Army Engineer Research and Development Center – Construction Engineering Research Laboratory.

ERDC/CERL TR-08-21 35
Appendix A: Initial Condition Assessment Data
ERD
C/C
ERL TR
-08-21 36
Table A1. Data for the initial condition assessment ultrasonic thickness measurements of the Lipari header system. March 20, 2007. Units in inches.
DATE 3/20/2007 DATE 3/20/2007 DATE 3/21/2007
HEADER West HEADER Center HEADER East
TECHNICIAN Bob Scott TECHNICIAN Daryl Salomon TECHNICIAN Daryl Salomon
RECORDER Daryl Salomon RECORDER Bob Scott RECORDER Bob Scott
SAMPLE TOP BOTTOM SAMPLE TOP BOTTOM SAMPLE TOP BOTTOM
ID ID ID
A-1 0.220 0.198 B-1 0.217 0.180 C-1 0.189 0.190
A-3 0.234 0.224 B-2 0.215 0.200 C-2 0.194 0.176
A-5 0.214 0.173 B-3 0.215 0.178 C-3 0.187 0.150
A-7 0.237 0.188 B-4 0.215 0.189 C-4 0.222 0.176
A-9 0.221 0.198 B-5 0.216 0.194 C-5 0.189 0.183
A-11 0.227 0.202 B-6 0.196 0.194 C-6 0.175 0.172
A-13 0.186 0.201 B-7 0.192 0.221 C-7 0.188 0.172
A-15 0.205 0.196 B-8 0.212 0.225 C-8 0.218 0.193
A-17 0.216 0.210 B-9 0.192 0.218 C-9 0.180 0.169
A-18 0.202 0.231 B-10 0.217 0.233 C-10 0.138 0.198
B-11 0.223 0.211
Sample Block Measurement: 0.255 to 0.250 in.

ERDC/CERL TR-08-21 37
Appendix B: Fifteen-Month Continuous Monitoring Data

ERD
C/C
ERL TR
-08-21 38
Table B1. Data for the ultrasonic thickness measurements from April 9, 2007. Units in inches.
DATE 4/9/2007 DATE 4/9/2007 DATE 4/9/2007
HEADER West HEADER Center HEADER East
TECHNICIAN D. Salomon TECHNICIAN D. Salomon TECHNICIAN D. Salomon
RECORDER D. Salomon RECORDER D. Salomon RECORDER D. Salomon
SAMPLE TOP BOTTOM SAMPLE TOP BOTTOM SAMPLE TOP BOTTOM
ID ID ID
A-1 0.224 0.201 B-1 0.214 0.186 C-1 0.187 0.175
A-3 0.225 0.210 B-2 0.213 0.189 C-2 0.196 0.177
A-5 0.207 0.187 B-3 0.214 0.181 C-3 0.186 0.162
A-7 0.239 0.195 B-4 0.213 0.205 C-4 0.220 0.160
A-9 0.219 0.151 B-5 0.215 0.198 C-5 0.185 0.169
A-11 0.222 0.194 B-6 0.188 0.220 C-6 0.187 0.168
A-13 0.209 0.221 B-7 0.205 0.223 C-7 0.174 0.170
A-15 0.202 0.224 B-8 0.210 0.217 C-8 0.215 0.174
A-17 0.220 0.219 B-9 0.169 0.220 C-9 0.175 0.161
A-18 0.217 0.224 B-10 0.210 0.205 C-10 0.140 0.177
B-11 0.218 0.217
ERD
C/C
ERL TR
-08-21 39
Table B2. Data for the ultrasonic thickness measurements from April 23, 2007. Units in inches.
DATE 4/23/2007 DATE 4/23/2007 DATE 4/23/2007
HEADER West HEADER West HEADER West
TECHNICIAN D. Salomon TECHNICIAN D. Salomon TECHNICIAN D. Salomon
RECORDER Bob Scott RECORDER Bob Scott RECORDER Bob Scott
SAMPLE TOP BOTTOM SAMPLE TOP BOTTOM SAMPLE TOP BOTTOM
ID ID ID
A-1 0.227 0.207 B-1 0.225 0.196 C-1 0.196 0.218
A-3 0.233 0.216 B-2 0.220 0.196 C-2 0.203 0.207
A-5 0.216 0.145 B-3 0.221 0.187 C-3 0.189 0.157
A-7 0.228 0.184 B-4 0.219 0.192 C-4 0.228 0.183
A-9 0.224 0.207 B-5 0.224 0.201 C-5 0.193 0.170
A-11 0.206 0.207 B-6 0.198 0.224 C-6 0.178 0.181
A-13 0.220 0.228 B-7 0.188 0.228 C-7 0.189 0.171
A-15 0.212 0.230 B-8 0.218 0.225 C-8 0.221 0.181
A-17 0.231 0.236 B-9 0.182 0.229 C-9 0.198 0.158
A-18 0.209 0.233 B-10 0.215 0.217 C-10 0.151 0.175
B-11 0.224 0.229
Sample Block Measurement: 0.25 Recalibration= 0.003

ERD
C/C
ERL TR
-08-21 40
Table B3. Data for the ultrasonic thickness measurements from June 16, 2007. Units in inches.
DATE 6/16/2007 DATE 6/16/2007 DATE 6/16/2007
HEADER West HEADER Center HEADER East
TECHNICIAN D. Salomon TECHNICIAN D. Salomon TECHNICIAN D Salomon
RECORDER D. Salomon RECORDER D. Salomon RECORDER D. Salomon
SAMPLE TOP BOTTOM SAMPLE TOP BOTTOM SAMPLE TOP BOTTOM
ID ID ID
A-1 0.230 0.208 B-1 0.205 0.192 C-1 0.193 0.208
A-3 0.228 0.135 B-2 0.219 0.192 C-2 0.204 0.186
A-5 0.217 0.187 B-3 0.216 0.170 C-3 0.190 0.147
A-7 0.226 0.183 B-4 0.223 0.206 C-4 0.226 0.177
A-9 0.223 0.192 B-5 0.222 0.190 C-5 0.200 0.172
A-11 0.230 0.205 B-6 0.205 0.224 C-6 0.200 0.176
A-13 0.234 0.213 B-7 0.184 0.229 C-7 0.191 0.177
A-15 0.207 0.229 B-8 0.226 0.223 C-8 0.223 0.180
A-17 0.226 0.232 B-9 0.204 0.222 C-9 0.190 0.161
A-18 0.210 0.226 B-10 0.207 0.211 C-10 0.151 0.171
B-11 0.231 0.229
Sample Block Measurement: 0.248 A1 to A7 0.250 B1 to B11 0.252 C1 to C5
0.250 A9 to A18 0.259 C6 to C10
Ending Block Measurement: 0.255

ERD
C/C
ERL TR
-08-21 41
Table B4. Data for the ultrasonic thickness measurements from July 2, 2007. Units in inches.
DATE 7/2/2007 DATE 7/2/2007 DATE 7/2/2007
HEADER West HEADER Center HEADER East
TECHNICIAN K. Herwig TECHNICIAN M. Musser TECHNICIAN M.Musser
RECORDER M. Musser RECORDER K. Herwig RECORDER K. Herwig
SAMPLE TOP BOTTOM SAMPLE TOP BOTTOM SAMPLE TOP BOTTOM
ID ID ID
A-1 0.230 0.203 B-1 0.209 0.193 C-1 0.193 0.196
A-3 0.225 0.194 B-2 0.221 0.171 C-2 0.193 0.196
A-5 0.217 0.175 B-3 0.212 0.209 C-3 0.222 0.148
A-7 0.225 0.203 B-4 0.221 0.182 C-4 0.221 0.180
A-9 0.221 0.194 B-5 0.223 0.213 C-5 0.194 0.175
A-11 0.199 0.211 B-6 0.195 0.221 C-6 0.186 0.183
A-13 0.223 0.201 B-7 0.185 0.229 C-7 0.220 0.181
A-15 0.216 0.217 B-8 0.211 0.223 C-8 0.224 0.208
A-17 0.219 0.227 B-9 0.192 0.216 C-9 0.194 0.173
A-18 0.210 0.222 B-10 0.196 0.208 C-10 0.215 0.192
B-11 0.232 0.228
Sample Block Measurement:
Start= A1-A6= 0.247 A7-A18= 0.250 B1-B6= 0.252 B7-B11= 0.251 C1-C10= 0.252
Finish= 0.254
ERD
C/C
ERL TR
-08-21 42
Table B5. Data for the ultrasonic thickness measurements from July 13, 2007. Units in inches.
DATE 7/13/2007 DATE 7/13/2007 DATE 7/13/2007
HEADER West HEADER Center HEADER East
TECHNICIAN Mark Musser TECHNICIAN Mark Musser TECHNICIAN Mark Musser
RECORDER M. Warrington RECORDER M. Warrington RECORDER M. Warrington
SAMPLE TOP BOTTOM SAMPLE TOP BOTTOM SAMPLE TOP BOTTOM
ID ID ID
A-1 0.242 0.201 B-1 0.218 0.255 C-1 0.207 0.215
A-3 0.236 0.218 B-2 0.231 0.200 C-2 0.209 0.215
A-5 0.212 0.179 B-3 0.235 0.222 C-3 0.198 0.210
A-7 0.227 0.219 B-4 0.223 0.198 C-4 0.229 0.176
A-9 0.225 0.177 B-5 0.224 0.209 C-5 0.201 0.200
A-11 0.233 0.198 B-6 0.218 0.227 C-6 0.188 0.206
A-13 0.232 0.230 B-7 0.189 0.228 C-7 0.227 0.181
A-15 0.195 0.226 B-8 0.192 0.226 C-8 0.230 0.192
A-17 0.299 0.232 B-9 0.200 0.221 C-9 0.180 0.229
A-18 0.205 0.227 B-10 0.210 0.222 C-10 0.216 0.211
B-11 0.226 0.233
Sample Block Measurement: Start 0.254 B-1 to B11 0.255 End 0.256
A-1to A18 0.254
ERD
C/C
ERL TR
-08-21 43
Table B6. Data for the ultrasonic thickness measurements from July 31, 2007. Units in inches.
DATE 7/31/2007 DATE 7/31/2007 DATE 7/31/2007
HEADER West HEADER Center HEADER East
TECHNICIAN Mark Musser TECHNICIAN Mark Musser TECHNICIAN Mike Warrington
RECORDER Mike Warrington
RECORDER Mike Warrington
RECORDER Mark Musser
SAMPLE TOP BOTTOM SAMPLE TOP BOTTOM SAMPLE TOP BOTTOM
ID ID ID
A-1 0.233 0.206 B-1 0.214 0.187 C-1 0.200 0.190
A-3 0.227 0.203 B-2 0.228 0.203 C-2 0.210 0.186
A-5 0.215 0.177 B-3 0.210 0.206 C-3 0.215 0.228
A-7 0.243 0.175 B-4 0.217 0.182 C-4 0.226 0.172
A-9 0.220 0.170 B-5 0.221 0.218 C-5 0.186 0.175
A-11 0.233 0.196 B-6 0.218 0.215 C-6 0.183 0.194
A-13 0.225 0.225 B-7 0.199 0.214 C-7 0.217 0.209
A-15 0.208 0.210 B-8 0.206 0.219 C-8 0.217 0.189
A-17 0.228 0.227 B-9 0.174 0.217 C-9 0.173 0.196
A-18 0.218 0.221 B-10 0.203 0.227 C-10 0.213 0.198
B-11 0.223 0.226
Sample Block Measurement: Start 0.254 B-1 B-10 C-1 C-10
End 0.254 0.254 0.254

ERD
C/C
ERL TR
-08-21 4
4
Table B7. Data for the ultrasonic thickness measurements from August 10, 2007. Units in inches.
DATE 10 Aug.2007 DATE 10 Aug. 2007 DATE 10 Aug. 2007
HEADER West HEADER Center HEADER East
TECHNICIAN Ken Herwig TECHNICIAN Mike Warrington
TECHNICIAN Ken Herwig
RECORDER Mike Warrington
RECORDER Ken Herwig RECORDER Mike Warrington
SAMPLE TOP BOTTOM SAMPLE TOP BOTTOM SAMPLE TOP BOTTOM
ID ID ID
A-1 0.223 0.215 B-1 0.215 0.180 C-1 0.219 0.188
A-3 0.223 0.210 B-2 0.216 0.190 C-2 0.206 0.204
A-5 0.218 0.185 B-3 0.211 0.214 C-3 0.217 0.209
A-7 0.225 0.181 B-4 0.215 0.181 C-4 0.223 0.187
A-9 0.216 0.215 B-5 0.218 0.191 C-5 0.179 0.205
A-11 0.225 0.199 B-6 0.190 0.214 C-6 0.200 0.195
A-13 0.204 0.183 B-7 0.182 0.224 C-7 0.230 0.196
A-15 0.198 0.221 B-8 0.185 0.218 C-8 0.220 0.218
A-17 0.224 0.192 B-9 0.193 0.221 C-9 0.190 0.226
A-18 0.217 0.217 B-10 0.211 0.225 C-10 0.202 0.192
B-11 0.22 0.219
Sample Block Measurement: Start 0.252 Finish 0.246
ERD
C/C
ERL TR
-08-21 45
Table B8. Data for the ultrasonic thickness measurements from August 24, 2007. Units in inches.
DATE Aug. 24, 2007 DATE Aug. 24, 2007 DATE Aug. 24, 2007
HEADER West HEADER Center HEADER East
TECHNICIAN Ken Herwig TECHNICIAN Ken Herwig TECHNICIAN Ken herwig
RECORDER Ken Herwig RECORDER Ken Herwig RECORDER Ken Herwig
SAMPLE TOP BOTTOM SAMPLE TOP BOTTOM SAMPLE TOP BOTTOM
ID ID ID
A-1 0.290 0.192 B-1 0.210 0.224 C-1 0.204 0.192
A-3 0.235 0.215 B-2 0.208 0.190 C-2 0.194 0.208
A-5 0.215 0.187 B-3 0.195 0.190 C-3 0.196 0.153
A-7 0.213 0.197 B-4 0.218 0.178 C-4 0.189 0.231
A-9 0.215 0.220 B-5 0.217 0.213 C-5 0.185 0.182
A-11 0.236 0.190 B-6 0.221 0.194 C-6 0.194 0.173
A-13 0.233 0.185 B-7 0.215 0.225 C-7 0.220 0.178
A-15 0.205 0.227 B-8 0.216 0.218 C-8 0.213 0.187
A-17 0.215 0.211 B-9 0.202 0.180 C-9 0.164 0.173
A-18 0.212 0.221 B-10 0.225 0.198 C-10 0.156 0.207
B-11 0.224 0.222
Sample Block Measurement: Start 0.245 End 0.247
ERD
C/C
ERL TR
-08-21 46
Table B9. Data for the ultrasonic thickness measurements from September 14, 2007. Units in inches.
DATE 9/14/2007 DATE 9/14/2007 DATE 9/14/2007
HEADER West HEADER Center HEADER East
TECHNICIAN D Tiedman TECHNICIAN D Tiedman TECHNICIAN D Tiedman
RECORDER D Tiedman RECORDER D Tiedman RECORDER D Tiedman
SAMPLE TOP BOTTOM SAMPLE TOP BOTTOM SAMPLE TOP BOTTOM
ID ID ID
A-1 0.230 0.201 B-1 0.205 0.192 C-1 0.217 0.195
A-3 0.228 0.197 B-2 0.217 0.193 C-2 0.202 0.205
A-5 0.215 0.173 B-3 0.213 0.228 C-3 0.221 0.173
A-7 0.226 0.219 B-4 0.219 0.207 C-4 0.225 0.181
A-9 0.221 0.177 B-5 0.218 0.209 C-5 0.192 0.175
A-11 0.231 0.196 B-6 0.196 0.222 C-6 0.195 0.172
A-13 0.229 0.226 B-7 0.189 0.228 C-7 0.226 0.187
A-15 0.201 0.231 B-8 0.197 0.226 C-8 0.228 0.203
A-17 0.228 0.229 B-9 0.205 0.222 C-9 0.170 0.188
A-18 0.200 0.225 B-10 0.189 0.223 C-10 0.197 0.196
.. B-11 0.228 0.229
Sample Block Measurement: Start 0.251 Finish 0.253

ERD
C/C
ERL TR
-08-21 47
Table B10. Data for the ultrasonic thickness measurements from September 19, 2007. Units in inches.
DATE 9/19/2007 DATE 9/19/2007 DATE 9/19/2007
HEADER West HEADER Center HEADER East
TECHNICIAN D. Tiedman TECHNICIAN D. Tiedman TECHNICIAN D. Tiedman
RECORDER D. Tiedman RECORDER D. Tiedman RECORDER D. Tiedman
SAMPLE TOP BOTTOM SAMPLE TOP BOTTOM SAMPLE TOP BOTTOM
ID ID ID
A-1 0.219 0.195 B-1 0.194 0.184 C-1 0.209 0.198
A-3 0.225 0.210 B-2 0.210 0.192 C-2 0.195 0.197
A-5 0.208 0.178 B-3 0.206 0.202 C-3 0.221 0.191
A-7 0.220 0.207 B-4 0.220 0.186 C-4 0.225 0.183
A-9 0.219 0.190 B-5 0.218 0.214 C-5 0.180 0.182
A-11 0.231 0.193 B-6 0.206 0.218 C-6 0.201 0.203
A-13 0.198 0.232 B-7 0.194 0.223 C-7 0.214 0.180
A-15 0.198 0.199 B-8 0.211 0.220 C-8 0.217 0.189
A-17 0.218 0.226 B-9 0.198 0.218 C-9 0.180 0.201
A-18 0.213 0.227 B-10 0.218 0.208 C-10 0.196 0.192
B-11 0.220 0.225
Sample Block Measurement:
Start.0.250 0.246 Finish 0.249

ERD
C/C
ERL TR
-08-21 48
Table B11. Data for of the ultrasonic thickness measurements from October 5, 2007. Units in inches.
DATE 10/5/2007 DATE 10/5/2007 DATE 10/5/2007
HEADER West HEADER Center HEADER East
TECHNICIAN D. Tiedman TECHNICIAN D. Tiedman TECHNICIAN D. Tiedman
RECORDER D. Tiedman RECORDER D. Tiedman RECORDER D. Tiedman
SAMPLE TOP BOTTOM SAMPLE TOP BOTTOM SAMPLE TOP BOTTOM
ID ID ID
A-1 0.228 0.200 B-1 0.192 0.193 C-1 0.192 0.194
A-3 0.226 0.215 B-2 0.211 0.197 C-2 0.197 0.171
A-5 0.207 0.183 B-3 0.226 0.204 C-3 0.220 0.170
A-7 0.221 0.180 B-4 0.220 0.186 C-4 0.226 0.190
A-9 0.221 0.192 B-5 0.218 0.216 C-5 0.191 0.177
A-11 0.229 0.196 B-6 0.193 0.219 C-6 0.200 0.192
A-13 0.228 0.190 B-7 0.193 0.224 C-7 0.216 0.18
A-15 0.208 0.228 B-8 0.201 0.222 C-8 0.226 0.198
A-17 0.217 0.227 B-9 0.198 0.226 C-9 0.174 0.178
A-18 0.205 0.226 B-10 0.198 0.221 C-10 0.199 0.194
B-11 0.223 0.226
Sample Block Measurement: 0.250 0.250 0.250

ERD
C/C
ERL TR
-08-21 49
Table B12. Data for the ultrasonic thickness measurements from October 23, 2007. Units in inches.
DATE 10/23/2007 DATE 10/23/2007 DATE 10/23/2007
HEADER West HEADER Center HEADER East
TECHNICIAN D Tiedman TECHNICIAN D Tiedman TECHNICIAN D Tiedman
RECORDER D Tiedman RECORDER D Tiedman RECORDER D Tiedman
SAMPLE TOP BOTTOM SAMPLE TOP BOTTOM SAMPLE TOP BOTTOM
ID ID ID
A-1 0.234 0.204 B-1 0.222 0.192 C-1 0.218 0.207
A-3 0.237 0.222 B-2 0.220 0.202 C-2 0.210 0.191
A-5 0.224 0.167 B-3 0.214 0.217 C-3 0.226 0.171
A-7 0.227 0.201 B-4 0.219 0.203 C-4 0.228 0.181
A-9 0.224 0.191 B-5 0.228 0.209 C-5 0.163 0.174
A-11 0.229 0.207 B-6 0.248 0.224 C-6 0.188 0.178
A-13 0.214 0.227 B-7 0.219 0.229 C-7 0.209 0.183
A-15 0.213 0.216 B-8 0.215 0.226 C-8 0.231 0.185
A-17 0.223 0.236 B-9 0.200 0.224 C-9 0.166 0.175
A-18 0.209 0.233 B-10 0.224 0.225 C-10 0.174 0.186
B-11 0.227 0.231
Sample Block Measurement: W 0.264 X 0.259 Y 0.252
ERD
C/C
ERL TR
-08-21 50
Table B13. Data for the ultrasonic thickness measurements from November 3, 2007. Units in inches.
DATE 11/3/2007 DATE 11/3/2007 DATE 11/3/2007
HEADER West HEADER Center HEADER East
TECHNICIAN D.Tiedman TECHNICIAN D.Tiedman TECHNICIAN D.Tiedman
RECORDER D.Tiedman RECORDER D.Tiedman RECORDER D.Tiedman
SAMPLE TOP BOTTOM SAMPLE TOP BOTTOM SAMPLE TOP BOTTOM
ID ID ID
A-1 0.217 0.202 B-1 0.197 0.194 C-1 0.188 0.198
A-3 0.225 0.214 B-2 0.211 0.196 C-2 0.197 0.192
A-5 0.213 0.178 B-3 0.207 0.194 C-3 0.217 0.200
A-7 0.219 0.185 B-4 0.212 0.185 C-4 0.218 0.174
A-9 0.216 0.198 B-5 0.217 0.206 C-5 0.183 0.168
A-11 0.229 0.197 B-6 0.212 0.213 C-6 0.210 0.179
A-13 0.210 0.221 B-7 0.213 0.218 C-7 0.178 0.171
A-15 0.209 0.223 B-8 0.209 0.219 C-8 0.214 0.178
A-17 0.218 0.224 B-9 0.195 0.218 C-9 0.189 0.193
A-18 0.194 0.219 B-10 0.213 0.223 C-10 0.204 0.190
B-11 0.219 0.222
Sample Block Measurement: Z= Start 0.250 X= 0.247 Y= 0.251
X= 0.247

ERD
C/C
ERL TR
-08-21 51
Table B14. Data for the ultrasonic thickness measurements from November 27, 2007. Units in inches.
DATE 11/27/2007 DATE 11/27/2007 DATE 11/27/2007
HEADER HEADER HEADER
TECHNICIAN D. Tiedman TECHNICIAN D. Tiedman TECHNICIAN D. Tiedman
RECORDER D. Tiedman RECORDER D. Tiedman RECORDER D. Tiedman
SAMPLE TOP BOTTOM SAMPLE TOP BOTTOM SAMPLE TOP BOTTOM
ID s ID t ID t
A-1 0.224 0.197 B-1 0.186 0.178 C-1 0.206 0.192
A-3 0.222 0.208 B-2 0.205 0.180 C-2 0.197 0.199
A-5 0.203 0.197 B-3 0.201 0.196 C-3 0.210 0.218
A-7 0.217 0.196 B-4 0.214 0.182 C-4 0.221 0.171
A-9 0.215 0.178 B-5 0.213 0.192 C-5 0.196 0.172
A-11 0.224 0.188 B-6 0.210 0.214 C-6 0.190 0.182
A-13 0.209 0.227 B-7 0.185 0.223 C-7 0.209 0.175
A-15 0.197 0.212 B-8 0.190 0.216 C-8 0.213 0.180
A-17 0.215 0.221 B-9 0.189 0.215 C-9 0.171 0.196
A-18 0.210 0.219 B-10 0.210 0.208 C-10 0.213 0.188
B-11 0.222 0.215
Sample Block Measurement: L= Start 0.250 T= 0.249 T= 0.249
S= 0.250

ERD
C/C
ERL TR
-08-21 52
Table B15. Data for the ultrasonic thickness measurements from December 7, 2007. Units in inches.
DATE 12/7/2007 DATE 12/7/2007 DATE 12/7/2007
HEADER West HEADER Center HEADER East
TECHNICIAN D. Tiedman TECHNICIAN D. Tiedman TECHNICIAN D. Tiedman
RECORDER D. Tiedman RECORDER D. Tiedman RECORDER D. Tiedman
SAMPLE TOP BOTTOM SAMPLE TOP BOTTOM SAMPLE TOP BOTTOM
ID ID ID
A-1 0.215 0.193 B-1 0.195 0.180 C-1 0.206 0.188
A-3 0.228 0.205 B-2 0.199 0.182 C-2 0.187 0.194
A-5 0.203 0.179 B-3 0.200 0.195 C-3 0.211 0.193
A-7 0.216 0.171 B-4 0.211 0.175 C-4 0.214 0.170
A-9 0.211 0.172 B-5 0.207 0.182 C-5 0.178 0.171
A-11 0.220 0.187 B-6 0.179 0.218 C-6 0.186 0.174
A-13 0.205 0.218 B-7 0.174 0.212 C-7 0.208 0.173
A-15 0.204 0.172 B-8 0.201 0.213 C-8 0.212 0.187
A-17 0.215 0.207 B-9 0.184 0.210 C-9 0.172 0.217
A-18 0.190 0.222 B-10 0.207 0.226 C-10 0.193 0.195
B-11 0.213 0.224
Sample Block Measurement: L 0.250 Z= 0.249 Z= 0.249
Start= Z 0.249

ERD
C/C
ERL TR
-08-21 53
Table B16. Data for the ultrasonic thickness measurements from December 29, 2007. Units in inches.
DATE 12/29/2007 DATE 12/29/2007 DATE 12/29/2007
HEADER West HEADER Center HEADER East
TECHNICIAN D. Tiedman TECHNICIAN D. Tiedman TECHNICIAN D. Tiedman
RECORDER D. Tiedman RECORDER D. Tiedman RECORDER D. Tiedman
SAMPLE TOP BOTTOM SAMPLE TOP BOTTOM SAMPLE TOP BOTTOM
ID ID ID
A-1 0.225 0.197 B-1 0.190 0.182 C-1 0.203 0.189
A-3 0.223 0.211 B-2 0.202 0.179 C-2 0.198 0.200
A-5 0.206 0.192 B-3 0.206 0.194 C-3 0.211 0.199
A-7 0.214 0.195 B-4 0.210 0.206 C-4 0.216 0.176
A-9 0.216 0.196 B-5 0.206 0.198 C-5 0.180 0.171
A-11 0.222 0.190 B-6 0.194 0.203 C-6 0.201 0.171
A-13 0.218 0.191 B-7 0.201 0.220 C-7 0.212 0.175
A-15 0.202 0.187 B-8 0.187 0.214 C-8 0.208 0.178
A-17 0.218 0.222 B-9 0.188 0.211 C-9 0.172 0.190
A-18 0.200 0.218 B-10 0.218 0.224 C-10 0.199 0.183
B-11 0.215 0.204
Sample Block Measurement: A=0.250 B=0.245 C= 0.248

ERD
C/C
ERL TR
-08-21 5
4
Table B17. Data for the ultrasonic thickness measurements from January 22, 2008. Units in inches.
DATE 1/22/2008 DATE 1/22/2008 DATE 1/22/2008
HEADER West HEADER Center HEADER East
TECHNICIAN D. Tiedman TECHNICIAN D. Tiedman TECHNICIAN D. Tiedman
RECORDER D. Tiedman RECORDER D. Tiedman RECORDER D. Tiedman
SAMPLE TOP BOTTOM SAMPLE TOP BOTTOM SAMPLE TOP BOTTOM
ID ID ID
A-1 0.218 0.187 B-1 0.208 0.183 C-1 0.202 0.187
A-3 0.220 0.204 B-2 0.205 0.185 C-2 0.199 0.186
A-5 0.204 0.198 B-3 0.199 0.192 C-3 0.211 0.216
A-7 0.217 0.205 B-4 0.206 0.197 C-4 0.210 0.190
A-9 0.213 0.188 B-5 0.212 0.204 C-5 0.170 0.193
A-11 0.218 0.192 B-6 0.206 0.211 C-6 0.179 0.181
A-13 0.205 0.218 B-7 0.183 0.201 C-7 0.210 0.166
A-15 0.199 0.205 B-8 0.197 0.207 C-8 0.206 0.172
A-17 0.211 0.179 B-9 0.184 0.213 C-9 0.188 0.217
A-18 0.193 0.216 B-10 0.204 0.215 C-10 0.216 0.171
B-11 0.21 0.219
Sample Block Measurement: K=0.252 K=0.252 J=0.250

ERD
C/C
ERL TR
-08-21 55
Table B18. Data for the ultrasonic thickness measurements from February 21, 2008. Units in inches.
DATE 2/21/2008 DATE 2/21/2008 DATE 2/21/2008
HEADER West HEADER Center HEADER East
TECHNICIAN D. Tiedman TECHNICIAN D. Tiedman TECHNICIAN D. Tiedman
RECORDER D. Tiedman RECORDER D. Tiedman RECORDER D. Tiedman
SAMPLE TOP BOTTOM SAMPLE TOP BOTTOM SAMPLE TOP BOTTOM
ID ID ID
A-1 0.216 0.199 B-1 0.199 0.182 C-1 0.202 0.184
A-3 0.222 0.219 B-2 0.205 0.181 C-2 0.180 0.191
A-5 0.205 0.163 B-3 0.204 0.190 C-3 0.211 0.197
A-7 0.213 0.186 B-4 0.209 0.192 C-4 0.215 0.164
A-9 0.215 0.168 B-5 0.211 0.185 C-5 0.171 0.168
A-11 0.223 0.187 B-6 0.190 0.215 C-6 0.187 0.176
A-13 0.219 0.221 B-7 0.220 0.218 C-7 0.215 0.169
A-15 0.199 0.212 B-8 0.208 0.214 C-8 0.206 0.188
A-17 0.210 0.223 B-9 0.188 0.211 C-9 0.175 0.218
A-18 0.194 0.215 B-10 0.184 0.212 C-10 0.171 0.178
B-11 0.208 0.216
Sample Block Measurement: B=0.250 B=0.250 B=0.250

ERD
C/C
ERL TR
-08-21 56
Table B19. Data for the ultrasonic thickness measurements from March 13, 2008. Units in inches.
DATE 3/13/2008 DATE 3/13/2008 DATE 3/13/2008
HEADER West HEADER Center HEADER East
TECHNICIAN D. Tiedman TECHNICIAN D. Tiedman TECHNICIAN D. Tiedman
RECORDER D. Tiedman RECORDER D. Tiedman RECORDER D. Tiedman
SAMPLE TOP BOTTOM SAMPLE TOP BOTTOM SAMPLE TOP BOTTOM
ID ID ID
A-1 0.222 0.198 B-1 0.204 0.180 C-1 0.209 0.192
A-3 0.228 0.212 B-2 0.210 0.187 C-2 0.197 0.190
A-5 0.203 0.187 B-3 0.205 0.196 C-3 0.213 0.197
A-7 0.218 0.190 B-4 0.211 0.184 C-4 0.221 0.170
A-9 0.200 0.173 B-5 0.215 0.189 C-5 0.183 0.172
A-11 0.213 0.190 B-6 0.202 0.217 C-6 0.197 0.200
A-13 0.208 0.212 B-7 0.208 0.222 C-7 0.212 0.178
A-15 0.192 0.205 B-8 0.204 0.213 C-8 0.210 0.173
A-17 0.220 0.226 B-9 0.195 0.218 C-9 0.187 0.22
A-18 0.213 0.224 B-10 0.194 0.224 C-10 0.166 0.199
B-11 0.214 0.217
Sample Block Measurement: A= 0.250 B=0.249 C=0.248
B=0.249

ERD
C/C
ERL TR
-08-21 57
Table B20. Data for the ultrasonic thickness measurements from April 15, 2008. Units in inches.
DATE 4/15/2008 DATE 4/15/2008 DATE 4/15/2008
HEADER West HEADER Center HEADER East
TECHNICIAN D. Tiedman TECHNICIAN D. Tiedman TECHNICIAN D. Tiedman
RECORDER D. Tiedman RECORDER D. Tiedman RECORDER D. Tiedman
SAMPLE TOP BOTTOM SAMPLE TOP BOTTOM SAMPLE TOP BOTTOM
ID ID ID
A-1 0.218 0.197 B-1 0.217 0.192 C-1 0.213 0.200
A-3 0.227 0.214 B-2 0.215 0.194 C-2 0.199 0.195
A-5 0.223 0.195 B-3 0.209 0.203 C-3 0.218 0.170
A-7 0.224 0.181 B-4 0.186 0.190 C-4 0.222 0.172
A-9 0.218 0.195 B-5 0.22 0.196 C-5 0.199 0.175
A-11 0.225 0.191 B-6 0.213 0.227 C-6 0.204 0.190
A-13 0.222 0.199 B-7 0.205 0.226 C-7 0.193 0.177
A-15 0.205 0.216 B-8 0.181 0.221 C-8 0.219 0.203
A-17 0.225 0.228 B-9 0.197 0.215 C-9 0.190 0.224
A-18 0.203 0.223 B-10 0.195 0.225 C-10 0.210 0.192
B-11 0.221 0.227
Sample Block Measurement: A= 0.250
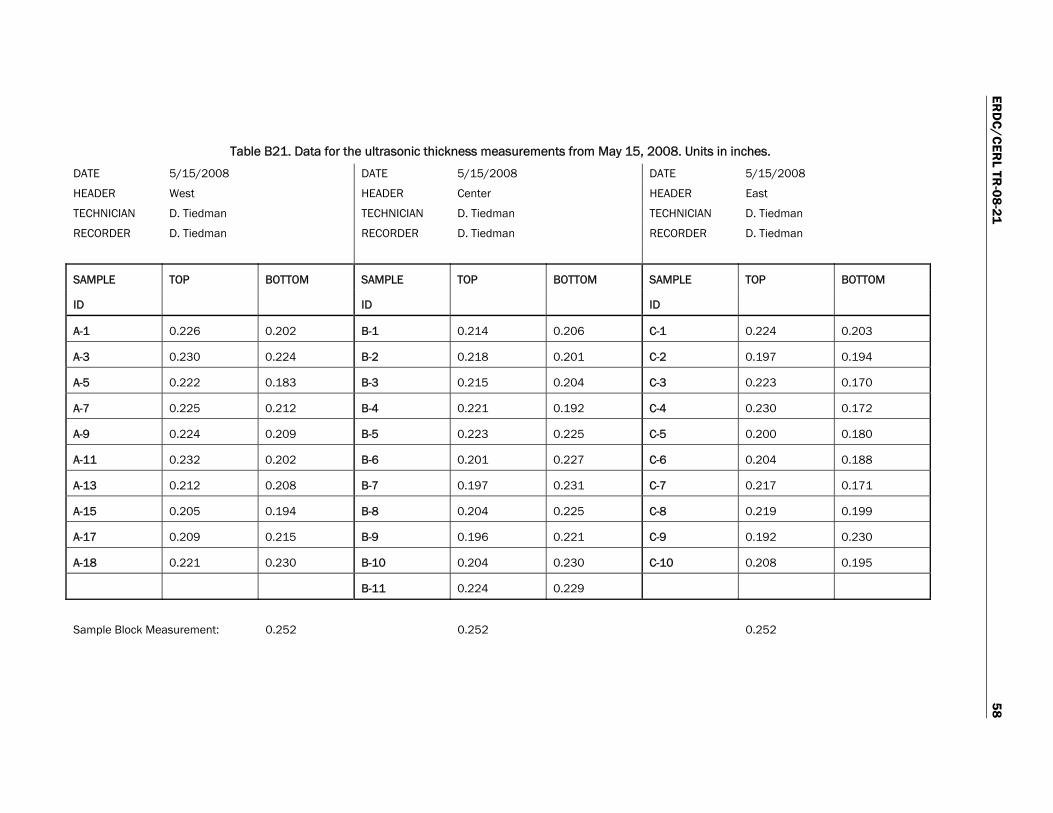
ERD
C/C
ERL TR
-08-21 58
Table B21. Data for the ultrasonic thickness measurements from May 15, 2008. Units in inches.
DATE 5/15/2008 DATE 5/15/2008 DATE 5/15/2008
HEADER West HEADER Center HEADER East
TECHNICIAN D. Tiedman TECHNICIAN D. Tiedman TECHNICIAN D. Tiedman
RECORDER D. Tiedman RECORDER D. Tiedman RECORDER D. Tiedman
SAMPLE TOP BOTTOM SAMPLE TOP BOTTOM SAMPLE TOP BOTTOM
ID ID ID
A-1 0.226 0.202 B-1 0.214 0.206 C-1 0.224 0.203
A-3 0.230 0.224 B-2 0.218 0.201 C-2 0.197 0.194
A-5 0.222 0.183 B-3 0.215 0.204 C-3 0.223 0.170
A-7 0.225 0.212 B-4 0.221 0.192 C-4 0.230 0.172
A-9 0.224 0.209 B-5 0.223 0.225 C-5 0.200 0.180
A-11 0.232 0.202 B-6 0.201 0.227 C-6 0.204 0.188
A-13 0.212 0.208 B-7 0.197 0.231 C-7 0.217 0.171
A-15 0.205 0.194 B-8 0.204 0.225 C-8 0.219 0.199
A-17 0.209 0.215 B-9 0.196 0.221 C-9 0.192 0.230
A-18 0.221 0.230 B-10 0.204 0.230 C-10 0.208 0.195
B-11 0.224 0.229
Sample Block Measurement: 0.252 0.252 0.252

ERD
C/C
ERL TR
-08-21 59
Table B22. Data for the ultrasonic thickness measurements from June 19, 2008. Units in inches.
DATE 6/19/2008 DATE 6/19/2008 DATE 6/19/2008
HEADER West HEADER Center HEADER East
TECHNICIAN D. Tiedman TECHNICIAN D. Tiedman TECHNICIAN D. Tiedman
RECORDER D. Tiedman RECORDER D. Tiedman RECORDER D. Tiedman
SAMPLE TOP BOTTOM SAMPLE TOP BOTTOM SAMPLE TOP BOTTOM
ID ID ID
A-1 0.219 0.195 B-1 0.19 0.188 C-1 0.213 0.196
A-3 0.227 0.216 B-2 0.205 0.196 C-2 0.198 0.209
A-5 0.209 0.189 B-3 0.212 0.202 C-3 0.218 0.193
A-7 0.222 0.182 B-4 0.22 0.191 C-4 0.224 0.166
A-9 0.221 0.21 B-5 0.219 0.212 C-5 0.175 0.17
A-11 0.225 0.188 B-6 0.212 0.215 C-6 0.187 0.178
A-13 0.208 0.225 B-7 0.21 0.217 C-7 0.186 0.174
A-15 0.198 0.211 B-8 0.194 0.216 C-8 0.209 0.18
A-17 0.208 0.230 B-9 0.192 0.229 C-9 0.181 0.198
A-18 0.216 0.227 B-10 0.215 0.230 C-10 0.213 0.199
B-11 0.218 0.229
Sample Block Measurement: 0.250 0.250 0.250

ERD
C/C
ERL TR
-08-21 60
Table B23. Data for the ultrasonic thickness measurements from July 26, 2008. Units in inches.
DATE 7/26/2008 DATE 7/26/2008 DATE 7/26/2008
HEADER West HEADER Center HEADER East
TECHNICIAN D Tiedman TECHNICIAN D Tiedman TECHNICIAN D Tiedman
RECORDER D Tiedman RECORDER D Tiedman RECORDER D Tiedman
SAMPLE TOP BOTTOM SAMPLE TOP BOTTOM SAMPLE TOP BOTTOM
ID ID ID
A-1 0.219 0.200 B-1 0.196 0.198 C-1 0.212 0.193
A-3 0.231 0.217 B-2 0.210 0.192 C-2 0.199 0.203
A-5 0.212 0.185 B-3 0.212 0.201 C-3 0.199 0.165
A-7 0.226 0.188 B-4 0.220 0.204 C-4 0.225 0.170
A-9 0.207 0.186 B-5 0.221 0.218 C-5 0.180 0.176
A-11 0.229 0.200 B-6 0.216 0.223 C-6 0.193 0.175
A-13 0.221 0.196 B-7 0.211 0.226 C-7 0.211 0.170
A-15 0.210 0.185 B-8 0.209 0.217 C-8 0.213 0.189
A-17 0.226 0.182 B-9 0.197 0.220 C-9 0.175 0.182
A-18 0.212 0.222 B-10 0.217 0.225 C-10 0.216 0.188
B-11 0.220 0.226
Sample Block Measurement: 0.250
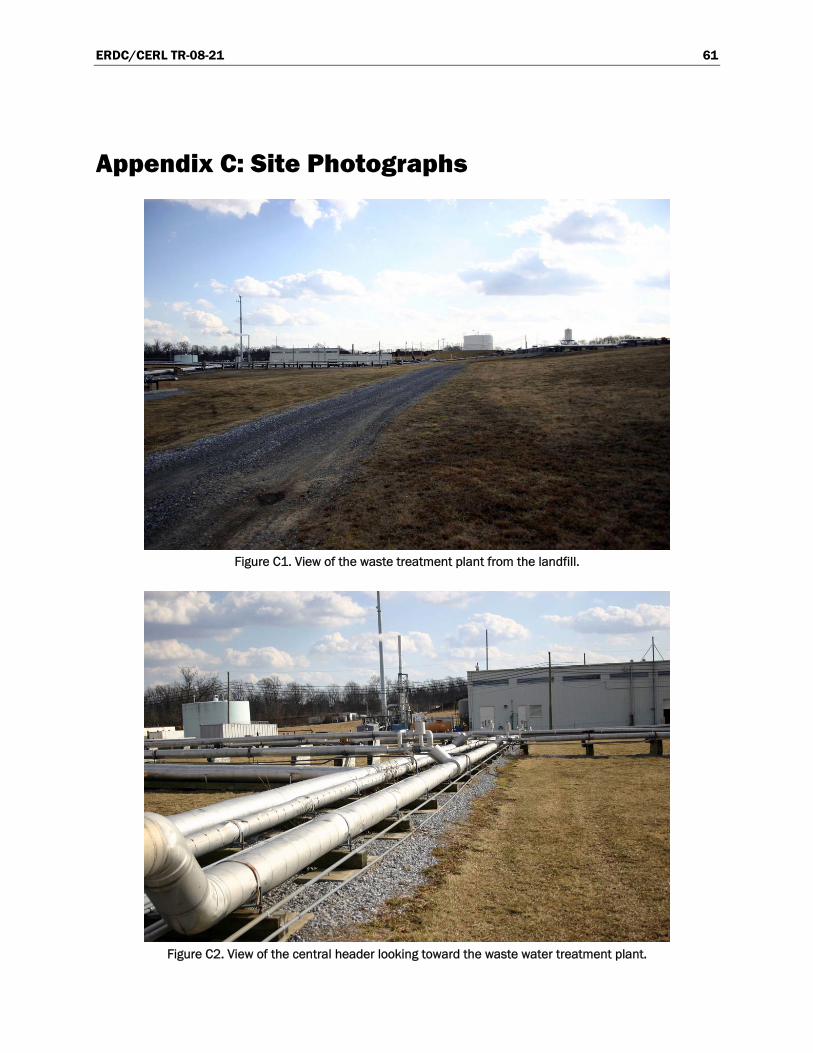
ERDC/CERL TR-08-21 61
Appendix C: Site Photographs
Figure C1. View of the waste treatment plant from the landfill.
Figure C2. View of the central header looking toward the waste water treatment plant.
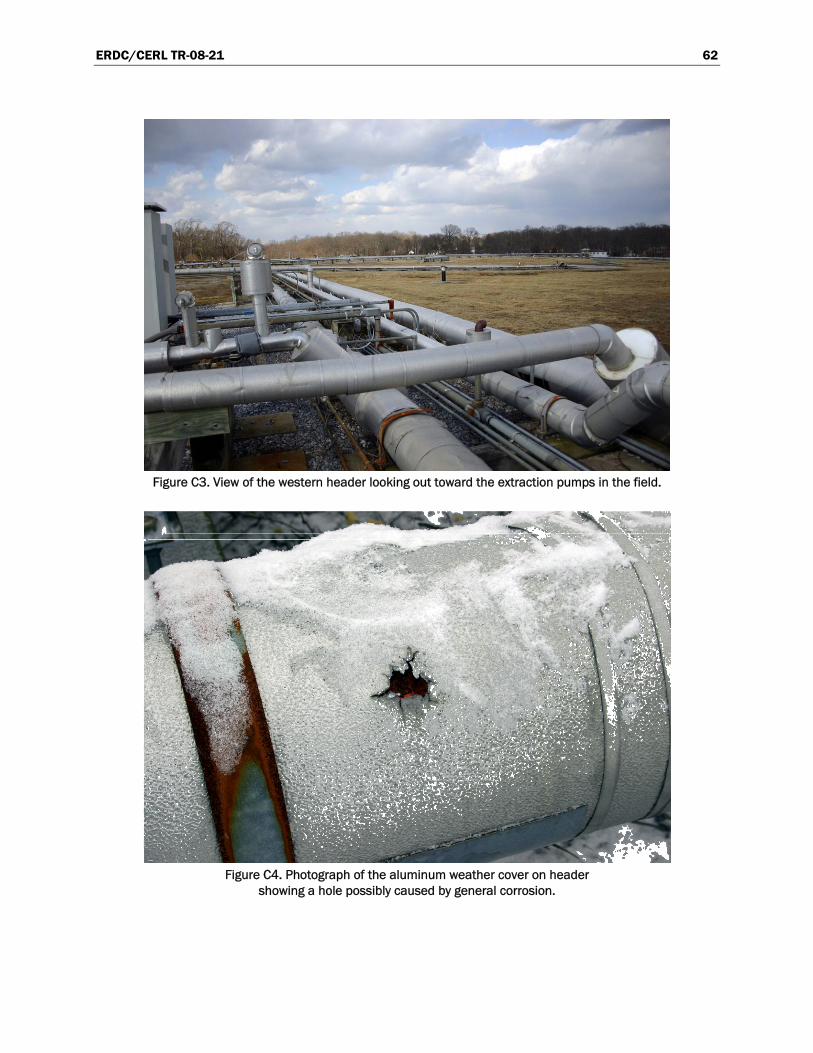
ERDC/CERL TR-08-21 62
Figure C3. View of the western header looking out toward the extraction pumps in the field.
Figure C4. Photograph of the aluminum weather cover on header
showing a hole possibly caused by general corrosion.
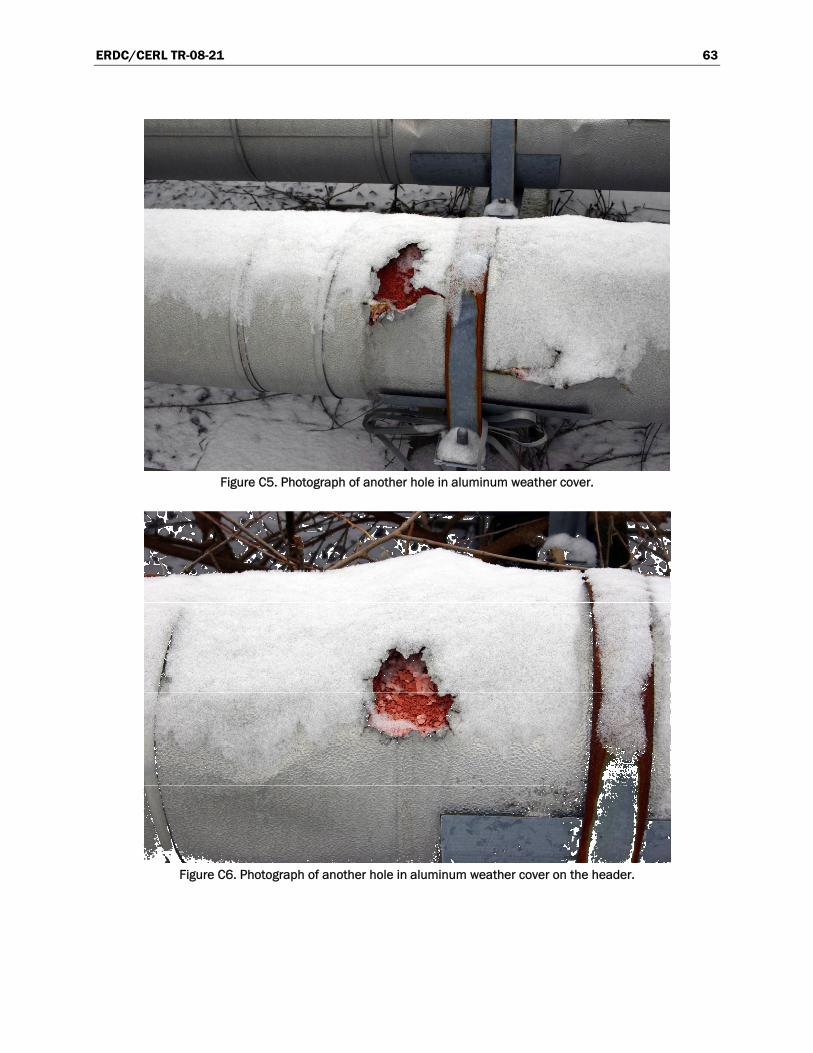
ERDC/CERL TR-08-21 63
Figure C5. Photograph of another hole in aluminum weather cover.
Figure C6. Photograph of another hole in aluminum weather cover on the header.
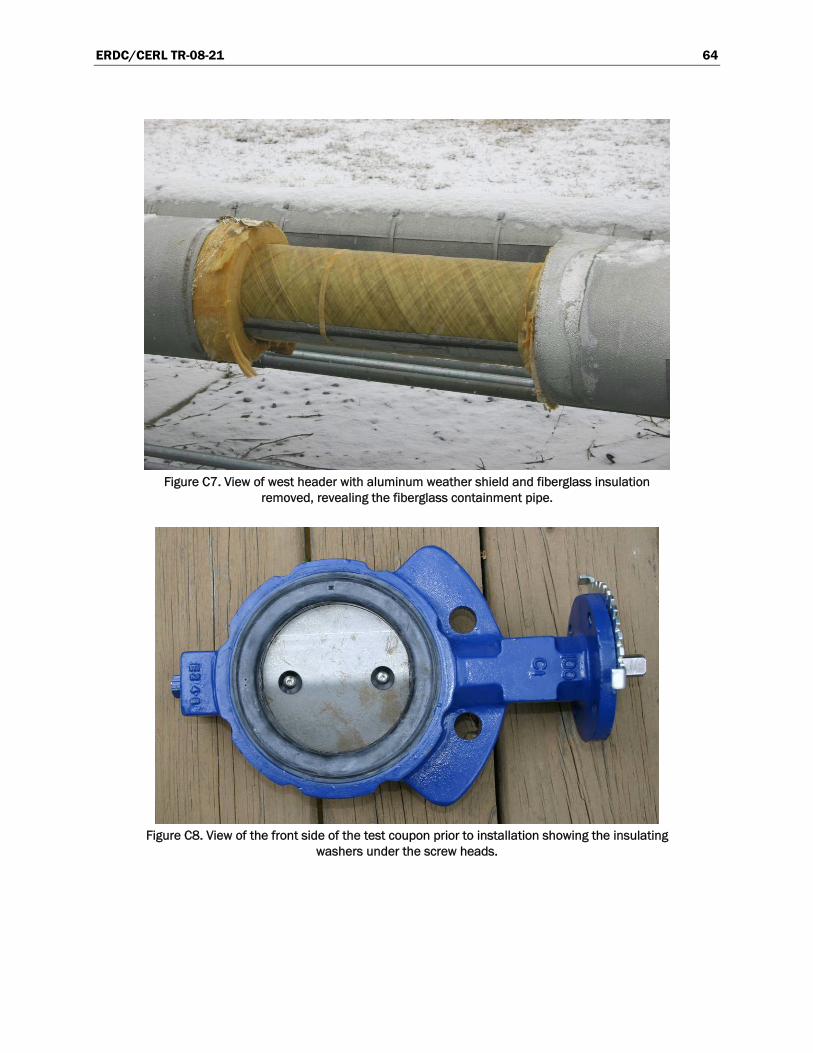
ERDC/CERL TR-08-21 64
Figure C7. View of west header with aluminum weather shield and fiberglass insulation
removed, revealing the fiberglass containment pipe.
Figure C8. View of the front side of the test coupon prior to installation showing the insulating
washers under the screw heads.
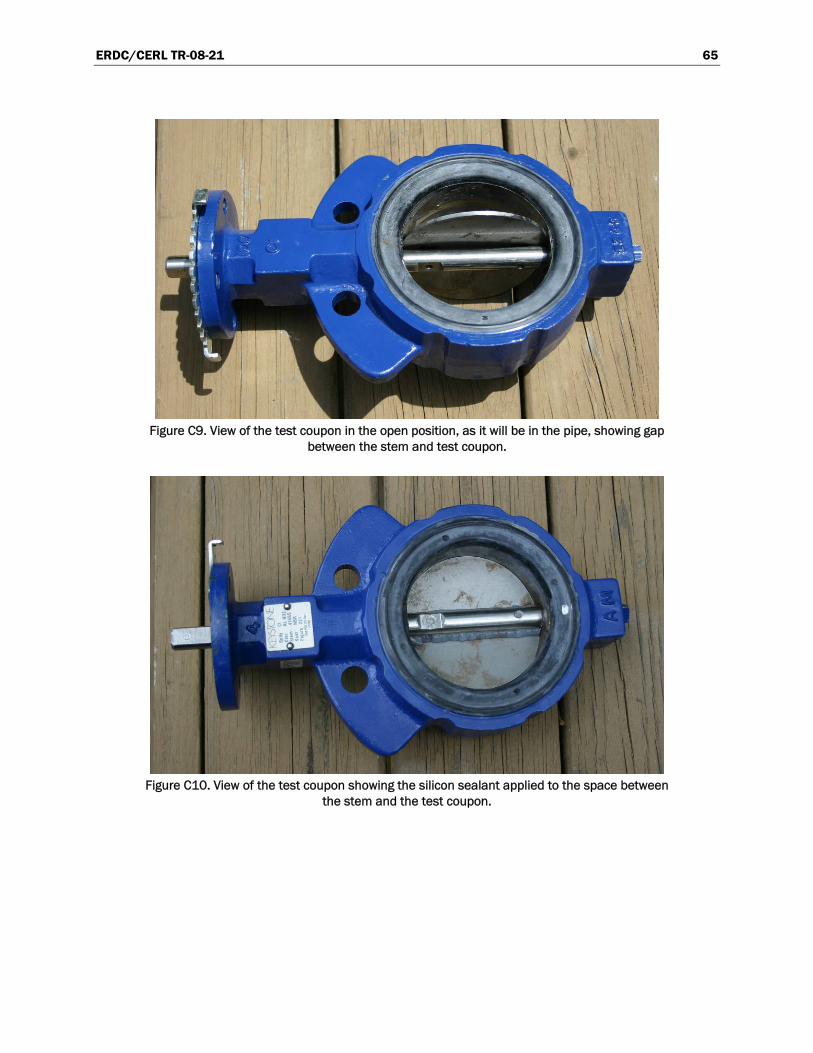
ERDC/CERL TR-08-21 65
Figure C9. View of the test coupon in the open position, as it will be in the pipe, showing gap
between the stem and test coupon.
Figure C10. View of the test coupon showing the silicon sealant applied to the space between
the stem and the test coupon.
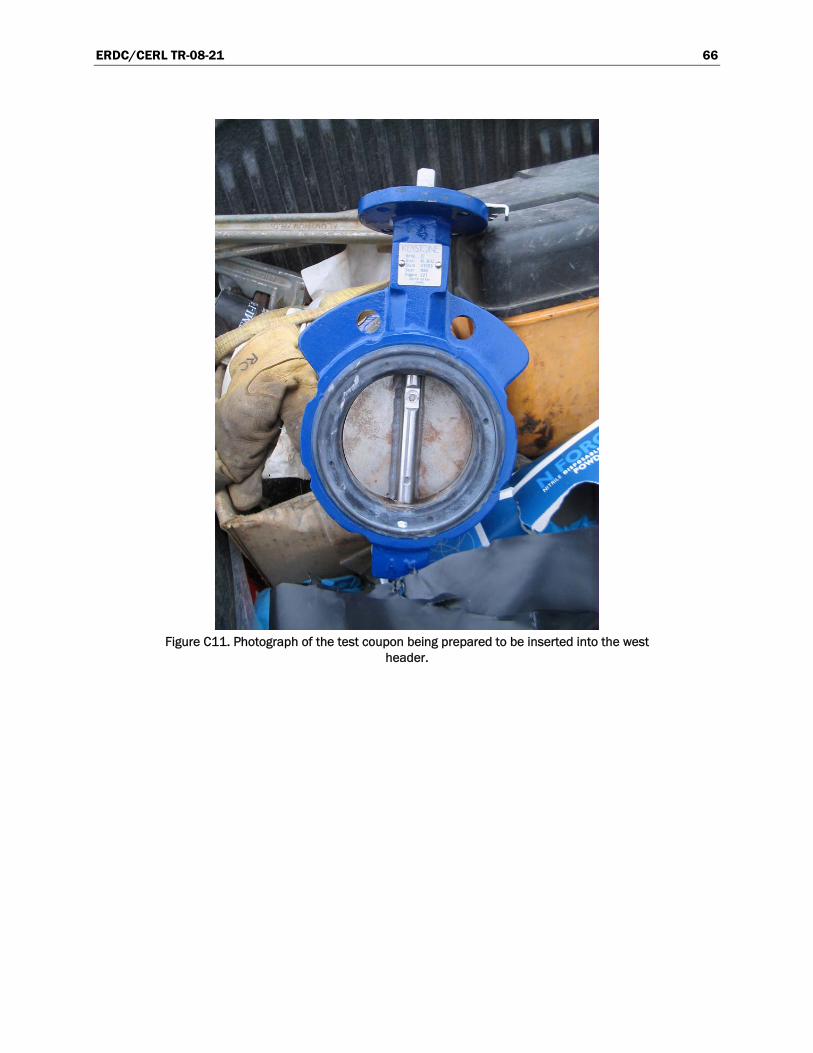
ERDC/CERL TR-08-21 66
Figure C11. Photograph of the test coupon being prepared to be inserted into the west
header.
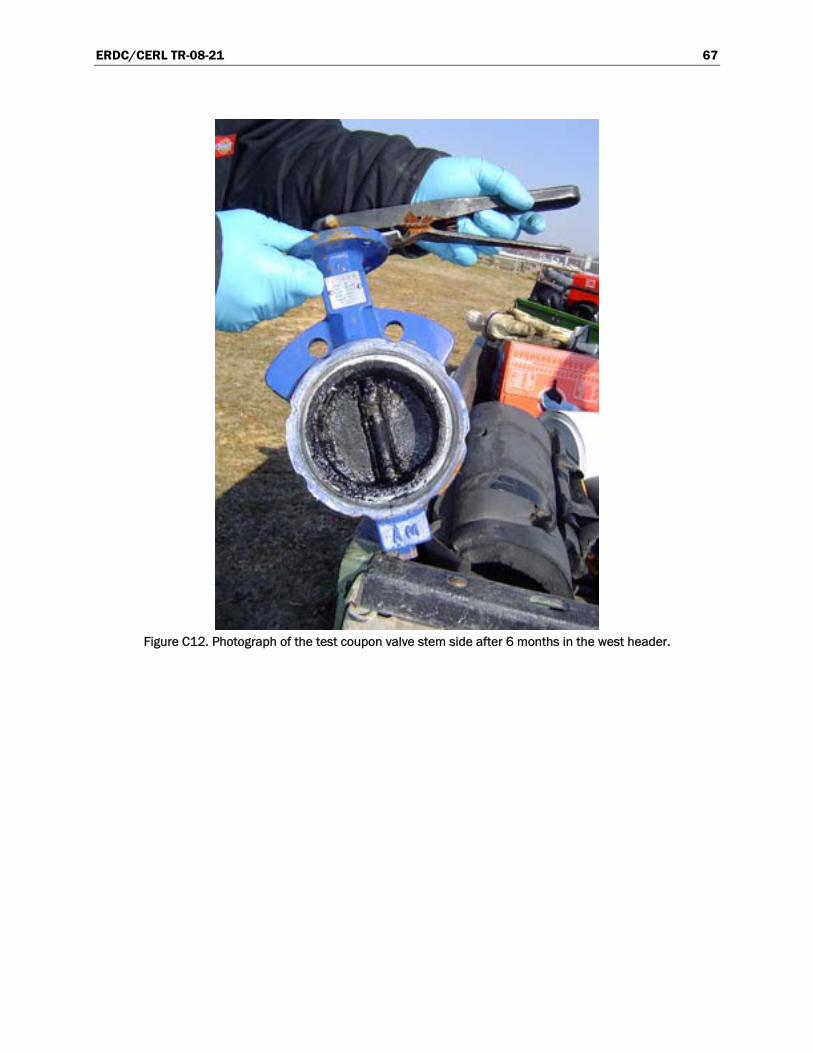
ERDC/CERL TR-08-21 67
Figure C12. Photograph of the test coupon valve stem side after 6 months in the west header.
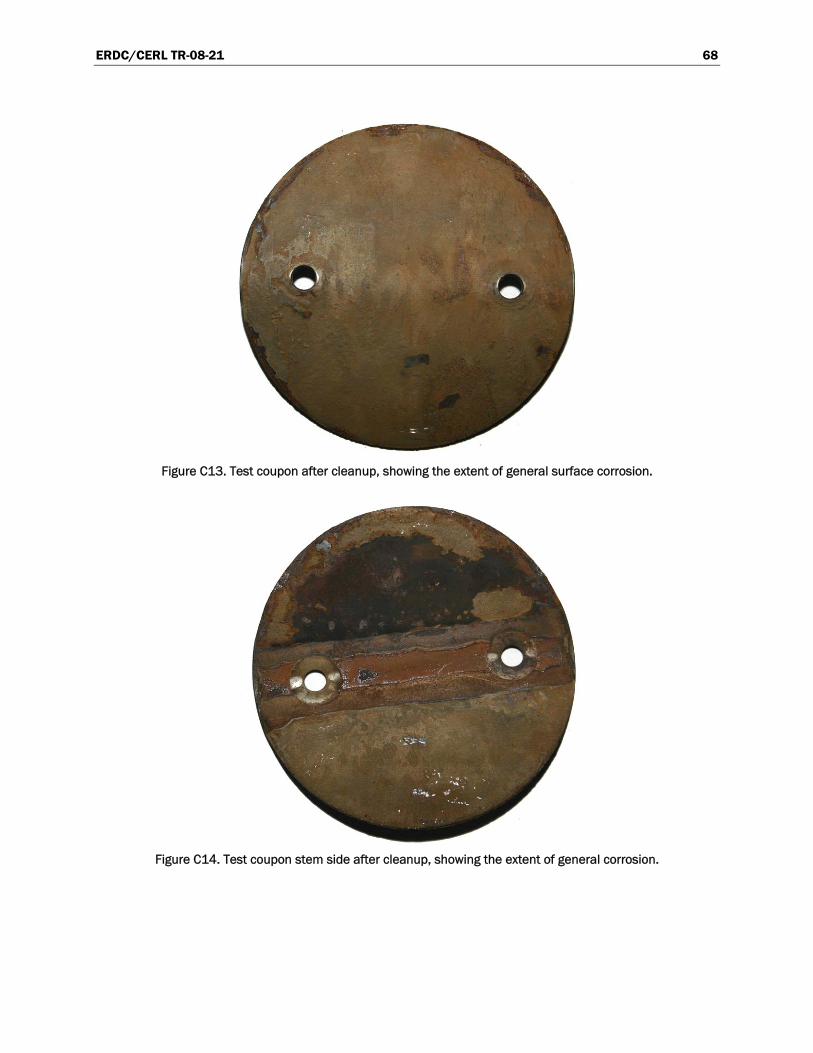
ERDC/CERL TR-08-21 68
Figure C13. Test coupon after cleanup, showing the extent of general surface corrosion.
Figure C14. Test coupon stem side after cleanup, showing the extent of general corrosion.
REPORT DOCUMENTATION PAGE Form Approved
OMB No. 0704-0188 Public reporting burden for this collection of information is estimated to average 1 hour per response, including the time for reviewing instructions, searching existing data sources, gathering and maintaining the data needed, and completing and reviewing this collection of information. Send comments regarding this burden estimate or any other aspect of this collection of information, including suggestions for reducing this burden to Department of Defense, Washington Headquarters Services, Directorate for Information Operations and Reports (0704-0188), 1215 Jefferson Davis Highway, Suite 1204, Arlington, VA 22202-4302. Respondents should be aware that notwithstanding any other provision of law, no person shall be subject to any penalty for failing to comply with a collection of information if it does not display a currently valid OMB control number. PLEASE DO NOT RETURN YOUR FORM TO THE ABOVE ADDRESS.
1. REPORT DATE (DD-MM-YYYY) December 2008
2. REPORT TYPE Final
3. DATES COVERED (From - To)
5a. CONTRACT NUMBER
5b. GRANT NUMBER
4. TITLE AND SUBTITLE Lipari Landfill Piping Network Corrosion Condition Assessment and Service Life Prediction Analysis
5c. PROGRAM ELEMENT NUMBER
5d. PROJECT NUMBER EA Order W25PHS61912360
5e. TASK NUMBER
6. AUTHOR(S) Charles P. Marsh, Thomas A. Carlson, Robert A. Weber, Carl A. Feickert, and Peter B. Stynoski
5f. WORK UNIT NUMBER
7. PERFORMING ORGANIZATION NAME(S) AND ADDRESS(ES) U.S. Army Engineer Research and Development Center Construction Engineering Research Laboratory P.O. Box 9005 Champaign, IL 61826-9005
8. PERFORMING ORGANIZATION REPORT NUMBER
ERDC/CERL TR-08-21
10. SPONSOR/MONITOR’S ACRONYM(S)
9. SPONSORING / MONITORING AGENCY NAME(S) AND ADDRESS(ES) U.S. Army Engineer District Philadelphia The Wanamaker Building 100 Penn Square East Philadelphia, PA 19107-3390
11. SPONSOR/MONITOR’S REPORT NUMBER(S)
12. DISTRIBUTION / AVAILABILITY STATEMENT
Approved for public release; distribution is unlimited.
13. SUPPLEMENTARY NOTES
14. ABSTRACT The Lipari Landfill, located in Mullica Hill, NJ, accepted hazardous chemical waste for most of its service life until operations were discontinued in 1971 by the New Jersey Department of Environmental Protection. After being designated as a federal Superfund site in 1982, a containment structure was built starting in 1983. Further remediation continued into the 1990s, including the construction of injection and extraction wells to eliminate chemical residues in the contained ground water. The water circulated through the pip-ing network of the injection/extraction well system has been determined to be corrosive, which could lead to a premature failure of the pipe. The objective of this study was to analyze the current condition of the piping network, and changes that have occurred over time, to determine the corrosion rate and estimate the remaining service life of the pipes. Owing to the limited amount of pipe mate-rial-loss data available, various analytical methods were used to interpret those data and develop a supportable engineering judgment. The report describes these analyses and presents the data obtained.
15. SUBJECT TERMS Lipari Landfill, Superfund site remediation, hazardous waste, containment structures, corrosion rate prediction, condition analysis
16. SECURITY CLASSIFICATION OF: 17. LIMITATION OF ABSTRACT
18. NUMBER OF PAGES
19a. NAME OF RESPONSIBLE PERSON
a. REPORT
Unclassified
b. ABSTRACT
Unclassified
c. THIS PAGE
Unclassified 76 19b. TELEPHONE NUMBER (include area code)
Standard Form 298 (Rev. 8-98) Prescribed by ANSI Std. 239.18