
ERCOT Planning Overview and Summer 2014 Assessments Update ERCOT Planning 1.
30
ERCOT Planning Overview and Summer 2014 Assessments Update ERCOT Planning 1
-
Upload
cassidy-fenner -
Category
Documents
-
view
231 -
download
0
Transcript of ERCOT Planning Overview and Summer 2014 Assessments Update ERCOT Planning 1.

ERCOT Planning Overview and Summer 2014 Assessments
Update
ERCOT Planning
1

Objectives
• Identify the objective of the Capacity, Demand and Reserve Report (CDR)
• Identify the CDR 2014 Firm Load Forecast, MW• Identify the objective of the Seasonal
Assessment of Resource Adequacy (SARA)• Identify the objective of the Regional
Transmission Plan (RTP)• Identify the projected congestion for 2016 and
2018 based on the 2013 RTP model simulation
2

ERCOT System Planning
• ERCOT planning performs coordinated planning studies with input from NERC registered Transmission Planners (TPs), Transmission Owners (TOs) and other stakeholders to address region-wide reliability and economic transmission
• Performs transmission studies/assessment (both near-term and long-term planning horizon) to meet ERCOT and NERC standards (TPL-001-004, PRC-023, FAC-013)
• Assesses resource availability of existing units and future generators
• Load forecasting for the near-term and long-term Planning Horizon
3
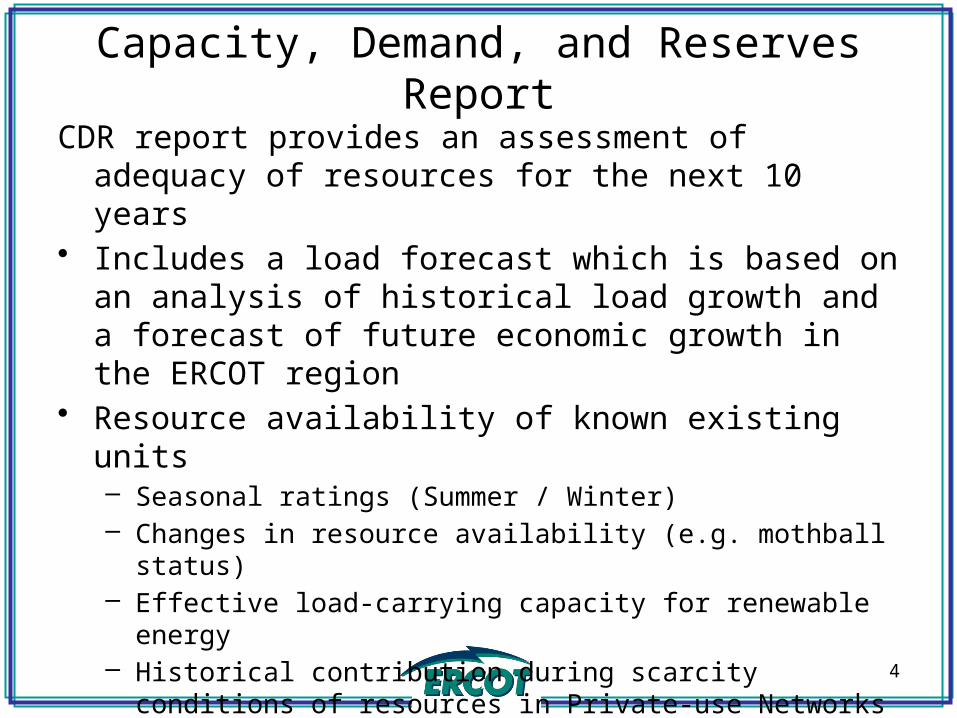
Capacity, Demand, and Reserves Report
CDR report provides an assessment of adequacy of resources for the next 10 years
• Includes a load forecast which is based on an analysis of historical load growth and a forecast of future economic growth in the ERCOT region
• Resource availability of known existing units– Seasonal ratings (Summer / Winter)– Changes in resource availability (e.g. mothball status)– Effective load-carrying capacity for renewable energy– Historical contribution during scarcity conditions of resources in
Private-use Networks (PUNs)
• Includes anticipated future resources with completed interconnection agreements and air permits (if required)
4
CDR Summer Expectations
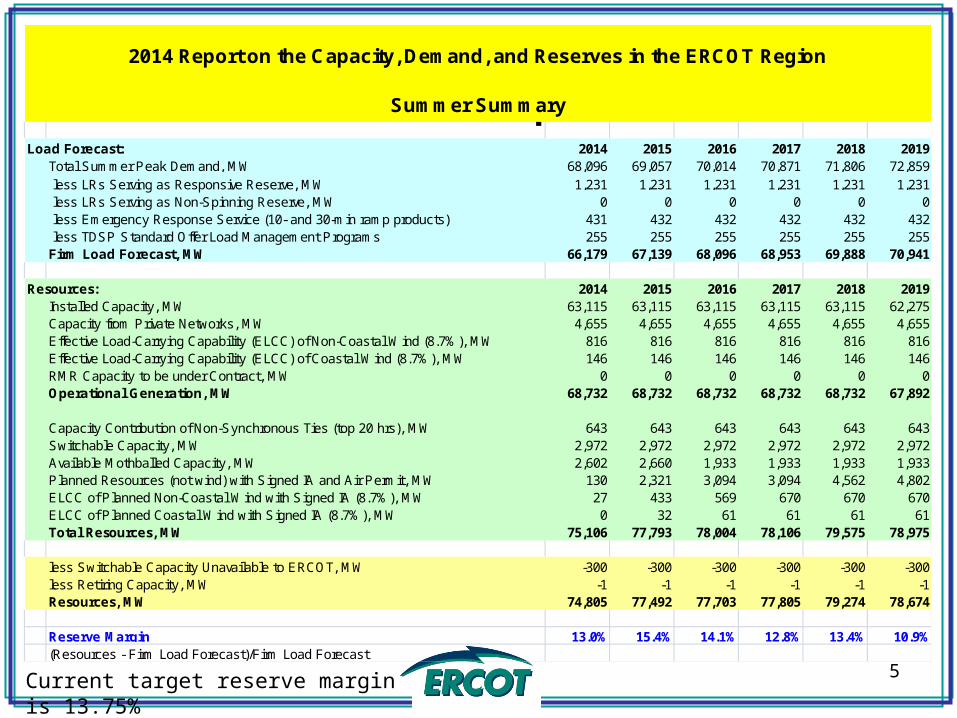
Current target reserve margin is 13.75% 5
Load Forecast: 2014 2015 2016 2017 2018 2019Total Summer Peak Demand, MW 68,096 69,057 70,014 70,871 71,806 72,859 less LRs Serving as Responsive Reserve, MW 1,231 1,231 1,231 1,231 1,231 1,231 less LRs Serving as Non-Spinning Reserve, MW 0 0 0 0 0 0 less Emergency Response Service (10- and 30-min ramp products) 431 432 432 432 432 432 less TDSP Standard Offer Load Management Programs 255 255 255 255 255 255Firm Load Forecast, MW 66,179 67,139 68,096 68,953 69,888 70,941
Resources: 2014 2015 2016 2017 2018 2019Installed Capacity, MW 63,115 63,115 63,115 63,115 63,115 62,275Capacity from Private Networks, MW 4,655 4,655 4,655 4,655 4,655 4,655Effective Load-Carrying Capability (ELCC) of Non-Coastal Wind (8.7%), MW 816 816 816 816 816 816Effective Load-Carrying Capability (ELCC) of Coastal Wind (8.7%), MW 146 146 146 146 146 146RMR Capacity to be under Contract, MW 0 0 0 0 0 0Operational Generation, MW 68,732 68,732 68,732 68,732 68,732 67,892
Capacity Contribution of Non-Synchronous Ties (top 20 hrs), MW 643 643 643 643 643 643Switchable Capacity, MW 2,972 2,972 2,972 2,972 2,972 2,972Available Mothballed Capacity, MW 2,602 2,660 1,933 1,933 1,933 1,933Planned Resources (not wind) with Signed IA and Air Permit, MW 130 2,321 3,094 3,094 4,562 4,802ELCC of Planned Non-Coastal Wind with Signed IA (8.7%), MW 27 433 569 670 670 670ELCC of Planned Coastal Wind with Signed IA (8.7%), MW 0 32 61 61 61 61Total Resources, MW 75,106 77,793 78,004 78,106 79,575 78,975
less Switchable Capacity Unavailable to ERCOT, MW -300 -300 -300 -300 -300 -300less Retiring Capacity, MW -1 -1 -1 -1 -1 -1Resources, MW 74,805 77,492 77,703 77,805 79,274 78,674
Reserve Margin 13.0% 15.4% 14.1% 12.8% 13.4% 10.9%(Resources - Firm Load Forecast)/Firm Load Forecast
2014 Report on the Capacity, Demand, and Reserves in the ERCOT Region
Summer Summary
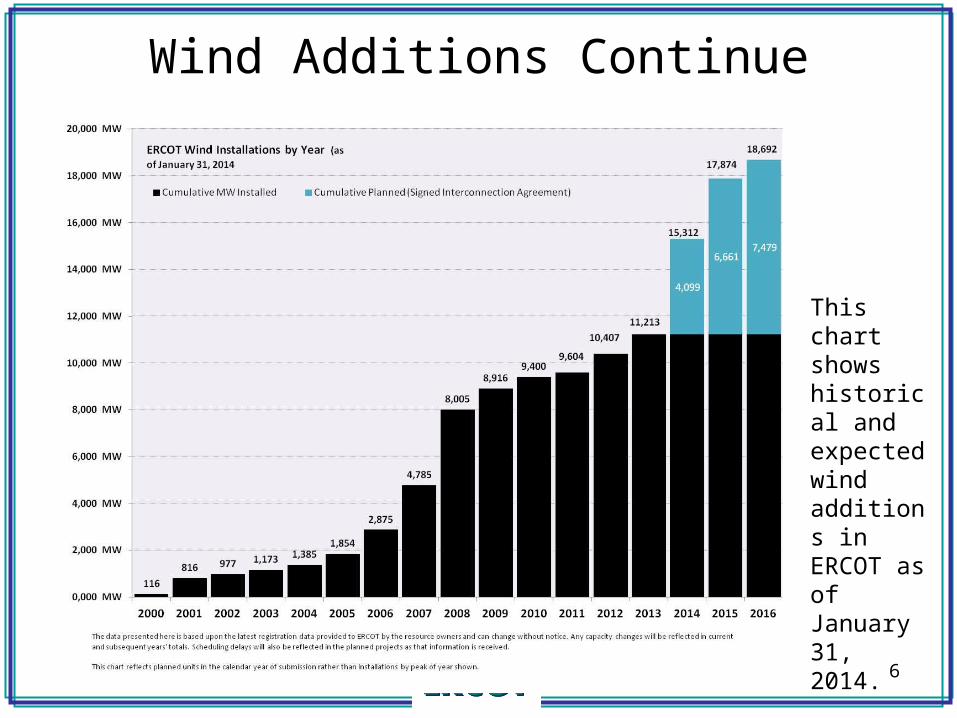
Wind Additions Continue
This chart shows historical and expected wind additions in ERCOT as of January 31, 2014.
6
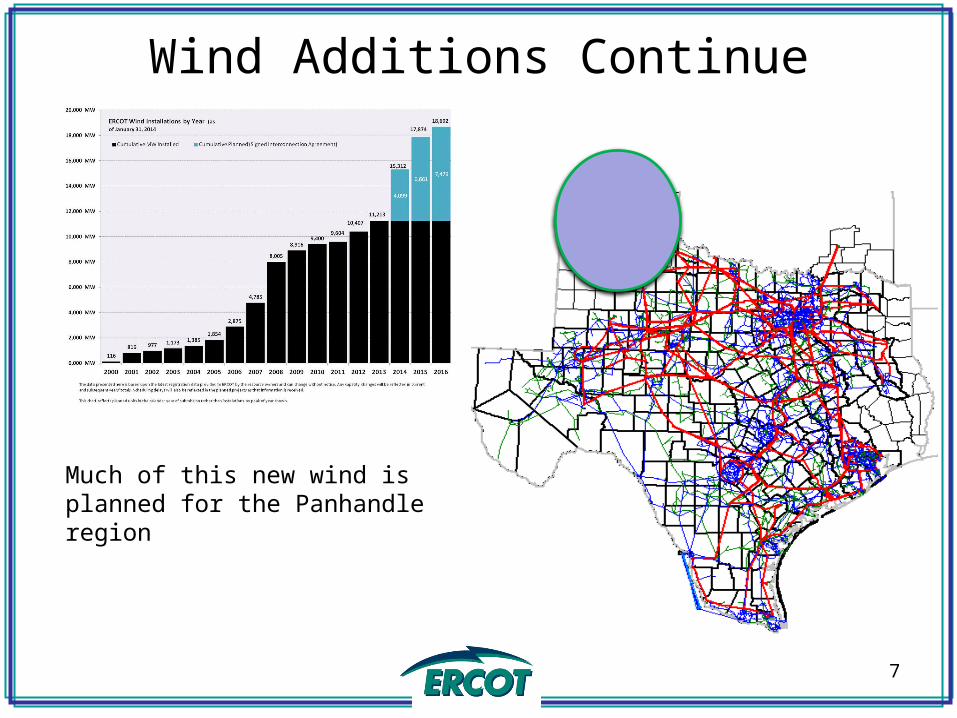
Wind Additions Continue
7
Much of this new wind is planned for the Panhandle region
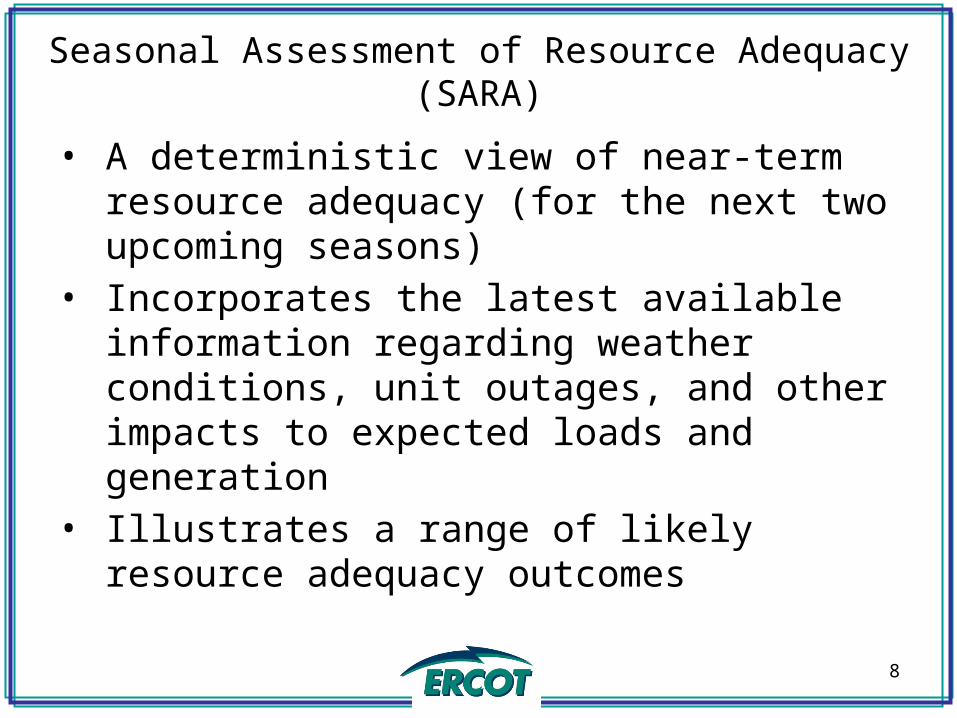
• A deterministic view of near-term resource adequacy (for the next two upcoming seasons)
• Incorporates the latest available information regarding weather conditions, unit outages, and other impacts to expected loads and generation
• Illustrates a range of likely resource adequacy outcomes
Seasonal Assessment of Resource Adequacy (SARA)
8
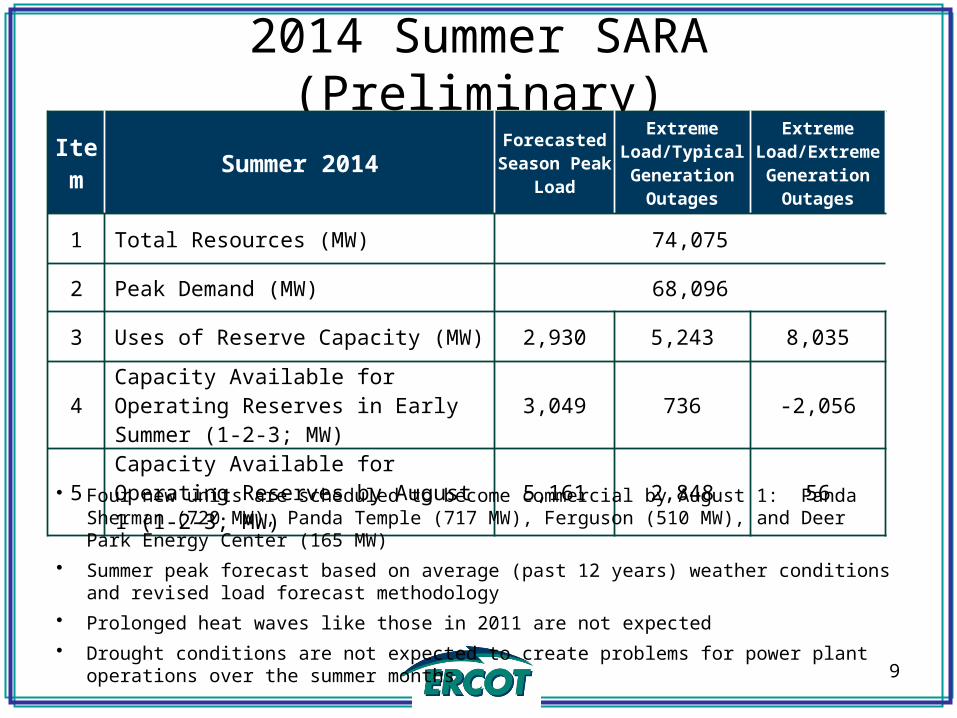
2014 Summer SARA (Preliminary)
Item Summer 2014Forecasted
Season Peak Load
Extreme Load/Typical Generation
Outages
Extreme Load/Extreme
Generation Outages
1 Total Resources (MW) 74,075
2 Peak Demand (MW) 68,096
3 Uses of Reserve Capacity (MW) 2,930 5,243 8,035
4 Capacity Available for Operating Reserves in Early Summer (1-2-3; MW) 3,049 736 -2,056
5 Capacity Available for Operating Reserves by August 1 (1-2-3; MW) 5,161 2,848 56
• Four new units are scheduled to become commercial by August 1: Panda Sherman (720 MW), Panda Temple (717 MW), Ferguson (510 MW), and Deer Park Energy Center (165 MW)
• Summer peak forecast based on average (past 12 years) weather conditions and revised load forecast methodology
• Prolonged heat waves like those in 2011 are not expected
• Drought conditions are not expected to create problems for power plant operations over the summer months
9
Regional Transmission Plan (RTP) - Objective
• Regional Transmission Plan is developed annually by ERCOT in coordination with the RPG and the TSPs
• Annual assessment to identify transmission needs of ERCOT system over next six years
• Projects identified to meet the ERCOT/NERC reliability requirements (Reliability projects) and to reduce system congestion (Economic projects) that meet the ERCOT economic criteria
• The RTP system upgrades identified need to be further reviewed by the appropriate TPs to determine the need for an earlier in-service year
10
2013 Regional Transmission Plan (RTP) - Process
• The SSWG 2013 Data Set B 2014-2018 summer peak base cases and 2016 minimum load base case were used as start cases
• Existing generation plants and new generation (as defined in Planning Guide Section 6.9) were used in the study, with a few exceptions
• The higher of the aggregated weather zone load in the SSWG base cases or the ERCOT 90th percentile weather zone load forecast was used for the summer peak reliability portion of the analysis
• The latest SSWG ERCOT contingency list was used• Performed Powerworld SCOPF or TARA redispatch to identify
reliability issues in the 2014, 2016, and 2018 conditioned cases• Ran generation outage analysis on 2014, 2016, and 2018 cases to
screen for thermal overloads• Using UPLAN, proposed economic projects that met the ERCOT economic
criteria to solve highest congested elements
11

2013 Regional Transmission Plan (RTP) – Overview of Results
• Pronounced impact of resource availability on transmission planning
• Significant increase in total number of system improvements identified
• Large number of unresolved reliability issues for 2014
12
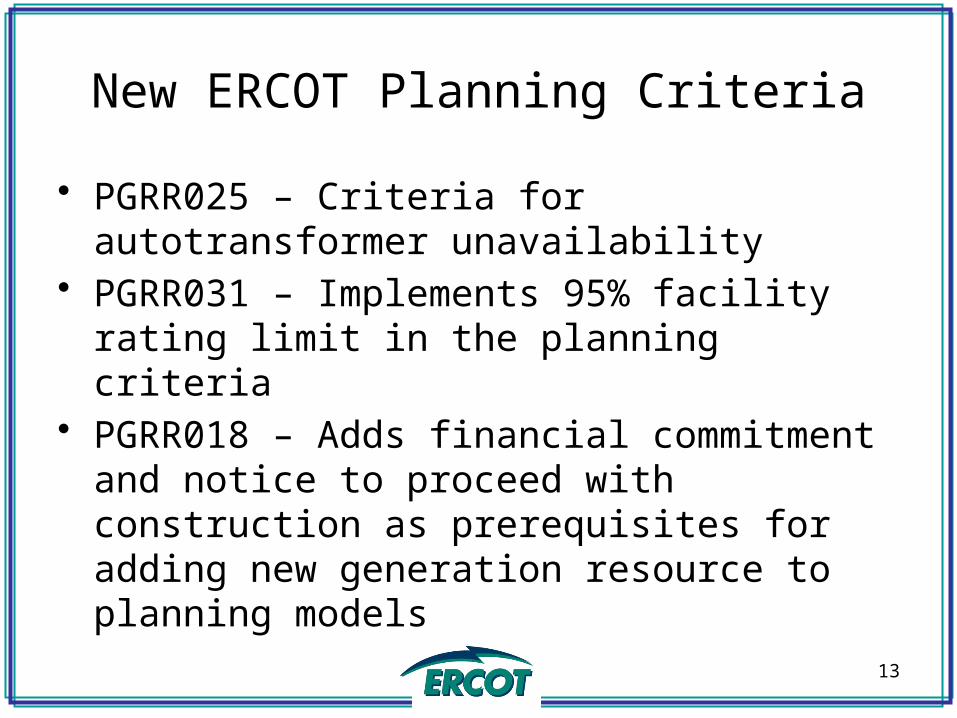
New ERCOT Planning Criteria
• PGRR025 – Criteria for autotransformer unavailability
• PGRR031 – Implements 95% facility rating limit in the planning criteria
• PGRR018 – Adds financial commitment and notice to proceed with construction as prerequisites for adding new generation resource to planning models
13
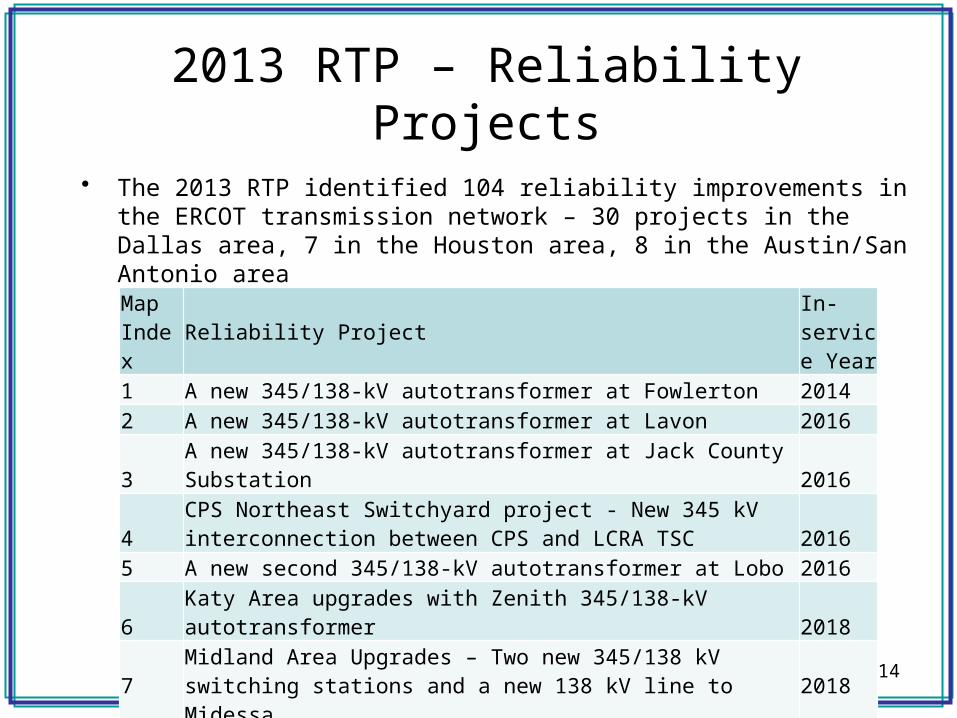
2013 RTP – Reliability Projects
• The 2013 RTP identified 104 reliability improvements in the ERCOT transmission network – 30 projects in the Dallas area, 7 in the Houston area, 8 in the Austin/San Antonio area
14
Map Index Reliability Project
In-service Year
1 A new 345/138-kV autotransformer at Fowlerton 20142 A new 345/138-kV autotransformer at Lavon 20163 A new 345/138-kV autotransformer at Jack County Substation 2016
4CPS Northeast Switchyard project - New 345 kV interconnection between CPS and LCRA TSC 2016
5 A new second 345/138-kV autotransformer at Lobo 20166 Katy Area upgrades with Zenith 345/138-kV autotransformer 2018
7 Midland Area Upgrades – Two new 345/138 kV switching stations and a new 138 kV line to Midessa
2018

2013 RTP – Reliability Projects
15
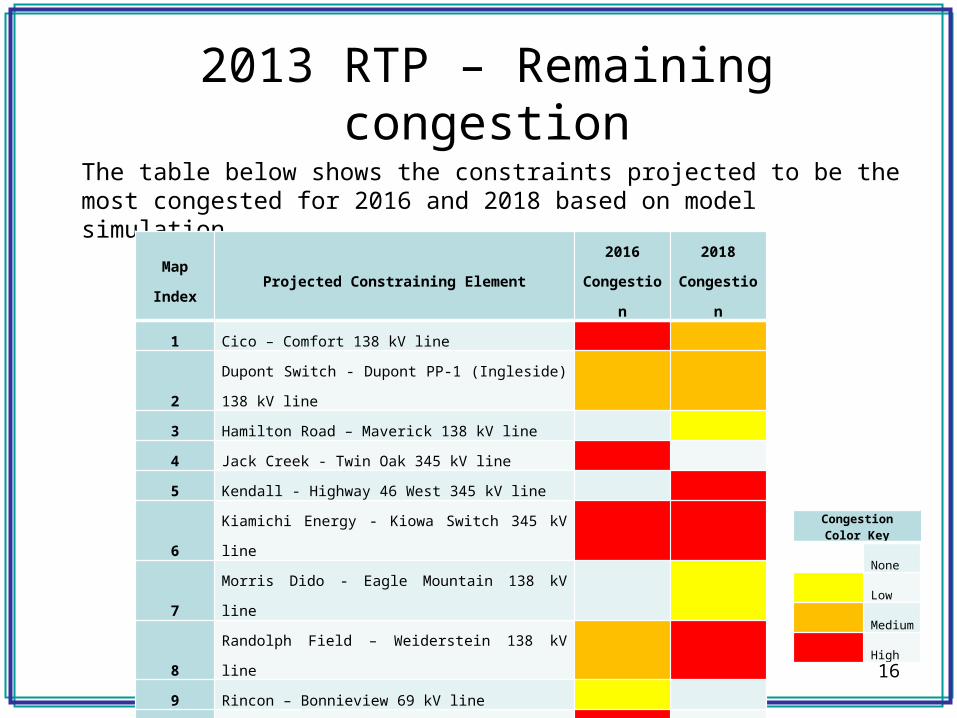
2013 RTP – Remaining congestion
The table below shows the constraints projected to be the most congested for 2016 and 2018 based on model simulation.
Map
IndexProjected Constraining Element
2016
Congestion
2018
Congestion
1 Cico – Comfort 138 kV line
2 Dupont Switch - Dupont PP-1 (Ingleside) 138 kV line
3 Hamilton Road – Maverick 138 kV line
4 Jack Creek - Twin Oak 345 kV line
5 Kendall - Highway 46 West 345 kV line
6 Kiamichi Energy - Kiowa Switch 345 kV line
7 Morris Dido - Eagle Mountain 138 kV line
8 Randolph Field – Weiderstein 138 kV line
9 Rincon – Bonnieview 69 kV line
10 River Oaks - Highway 46 West 138 kV line
11 Singleton – Zenith 345 kV line
12 Wolfgang – Rotan 69 kV line
Congestion Color Key
None
Low
Medium
High
16
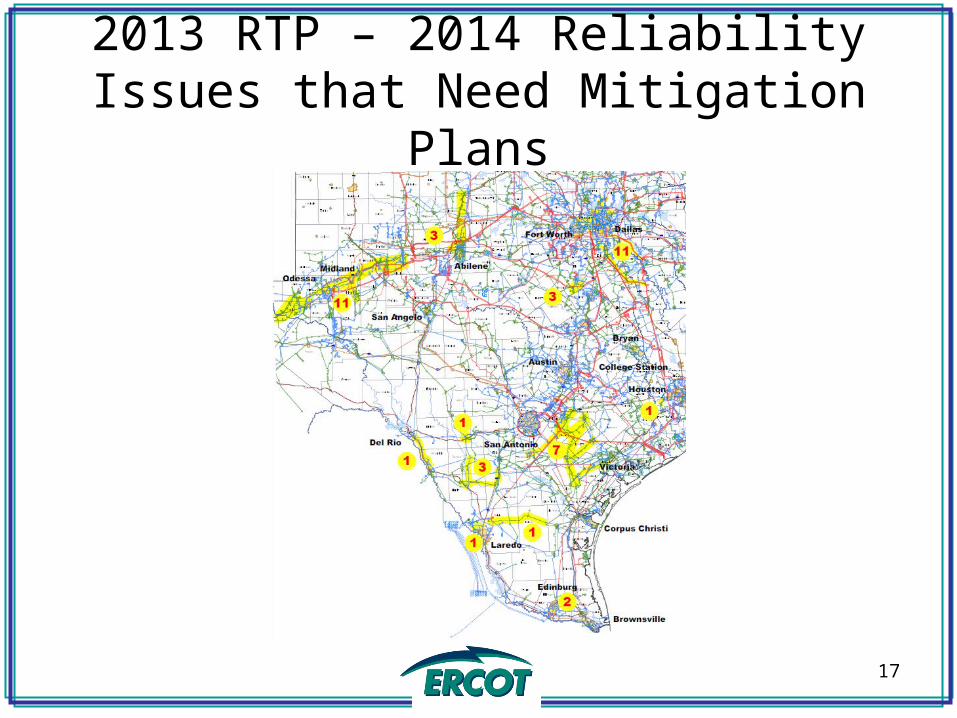
2013 RTP – 2014 Reliability Issues that Need Mitigation Plans
17
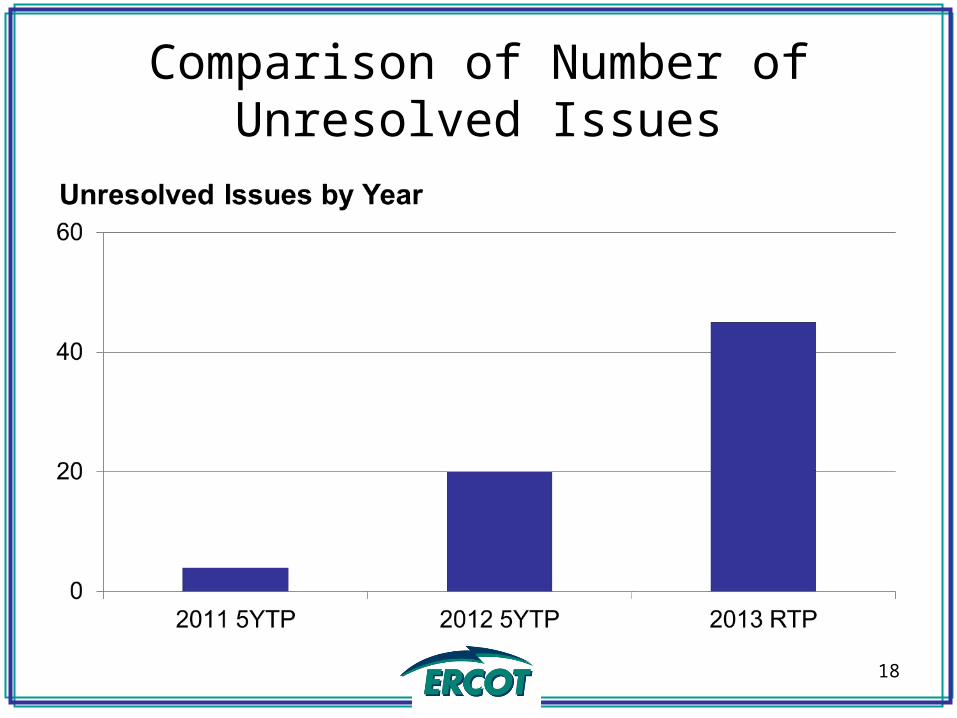
Comparison of Number of Unresolved Issues
18
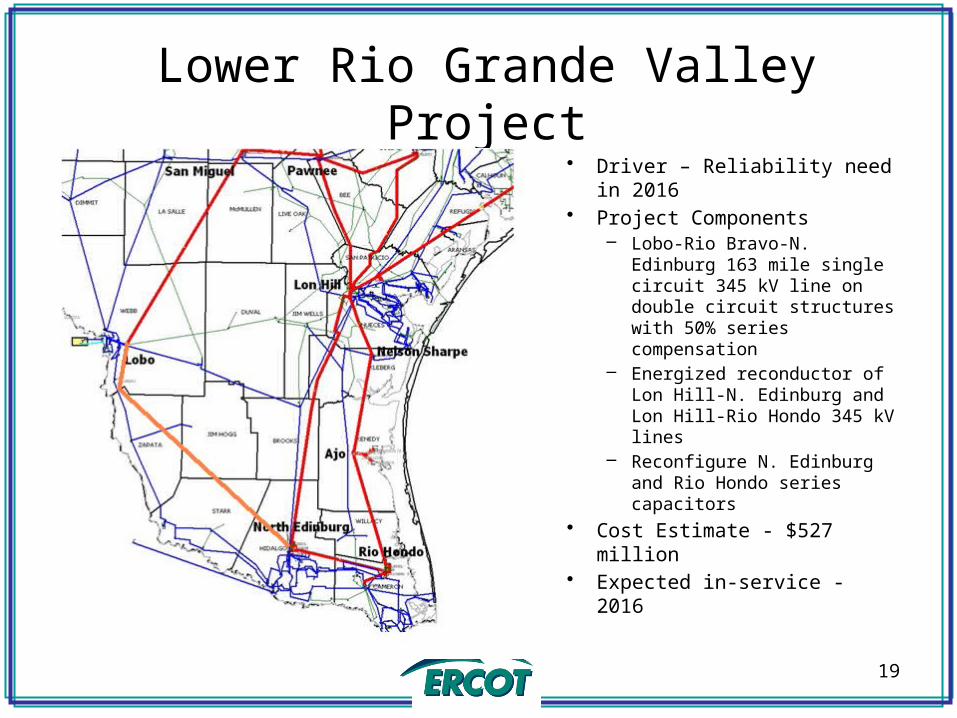
Lower Rio Grande Valley Project• Driver – Reliability need in
2016• Project Components
– Lobo-Rio Bravo-N. Edinburg 163 mile single circuit 345 kV line on double circuit structures with 50% series compensation
– Energized reconductor of Lon Hill-N. Edinburg and Lon Hill-Rio Hondo 345 kV lines
– Reconfigure N. Edinburg and Rio Hondo series capacitors
• Cost Estimate - $527 million• Expected in-service - 2016
19
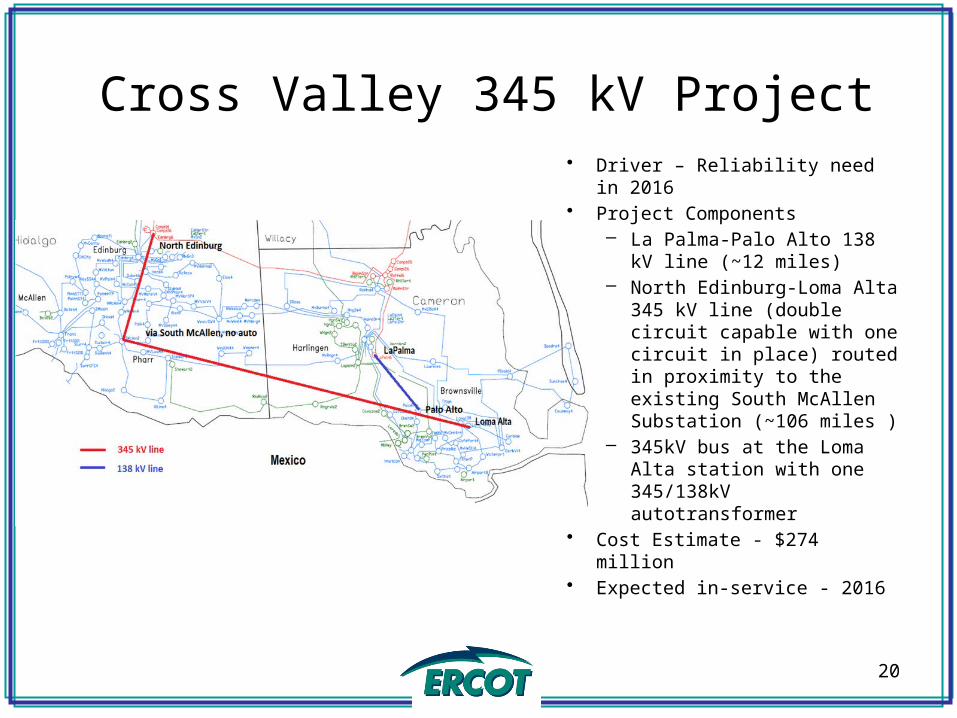
Cross Valley 345 kV Project• Driver – Reliability need in
2016• Project Components
– La Palma-Palo Alto 138 kV line (~12 miles)
– North Edinburg-Loma Alta 345 kV line (double circuit capable with one circuit in place) routed in proximity to the existing South McAllen Substation (~106 miles )
– 345kV bus at the Loma Alta station with one 345/138kV autotransformer
• Cost Estimate - $274 million• Expected in-service - 2016
20
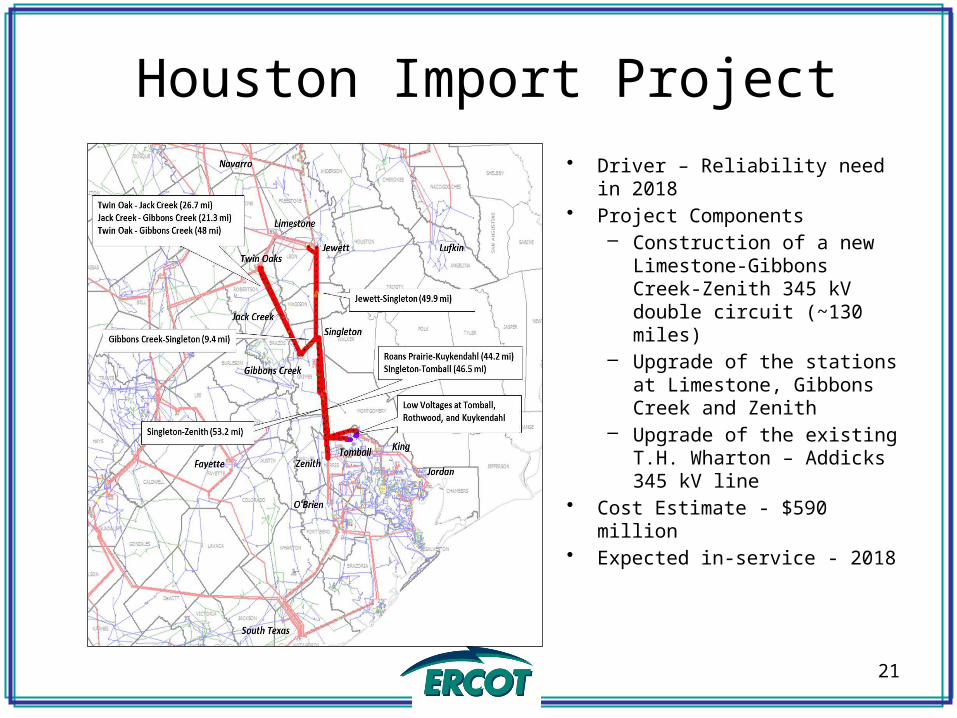
Houston Import Project
21
• Driver – Reliability need in 2018
• Project Components– Construction of a new
Limestone-Gibbons Creek-Zenith 345 kV double circuit (~130 miles)
– Upgrade of the stations at Limestone, Gibbons Creek and Zenith
– Upgrade of the existing T.H. Wharton – Addicks 345 kV line
• Cost Estimate - $590 million• Expected in-service - 2018

West Texas Study• ERCOT identified more than 60 reliability projects needed over the next four
years to meet the projected oil and natural gas load growth in west Texas
22

Eagle Ford Shale Oil and Natural Gas Related Projects
• Driver – Reliability need between 2013 and 2016
• Project Components– Sinton – Beeville – Kenedy
Area Improvements Project (2013-2016)
– Kenedy Switch – Guadalupe Project (2015)
– Kenedy Switch – Nixon – Seguin upgrade and conversion from 69 kV to 138 kV service (2016)
• Cost Estimate for 3 additional projects - $178.4 million
• Expected in-service – 2013-2016
23
Overview
• Resource adequacy heavily impacts outcome of planning studies
• Remaining unresolved reliability issues in 2014
• System improvements triggered by oil and gas related load growth
• New ERCOT planning criteria provide larger safety margin for system reliability
24

QuestionsQuestions
????25
26
1. The CDR report provides an __________ of __________ of resources for the next ten years.
a) assessmentb) adequacyc) reliabilityd) both a and be) both b and c
27
2. The CDR 2014 Firm Load Forecast, MW is _______________.
a) 67592b) 69020c) 66179d) 66900

28
3. SARA provides a deterministic view of near-term resource adequacy (for the next ______ upcoming seasons)
a) twob) three c) fourd) six

29
4. One of the purposes of the Regional Transmission Plan is an annual assessment to identify transmission needs of ERCOT system over next _______ years.
a) fourb) sixc) sevend) ten
30
5. One of the RTP constraints projected to be high congested for 2016 is _______________.
a) Cico – Comfort 138kV lineb) Hamilton Road – Maverick 138kV linec) Kendall – Highway 46 West 345kV lined) Morris Dido – Eagle Mountain 138kV line